Wnt11 acts on dermomyotome cells to guide epaxial myotome morphogenesis
- Department of Biological Sciences, Graduate School of Science, University of Tokyo, Japan
- Centre for Organismal Studies, Heidelberg University, Germany
- Heidelberg Biosciences International Graduate School, Germany
Figures
Figure 1 with 1 supplement
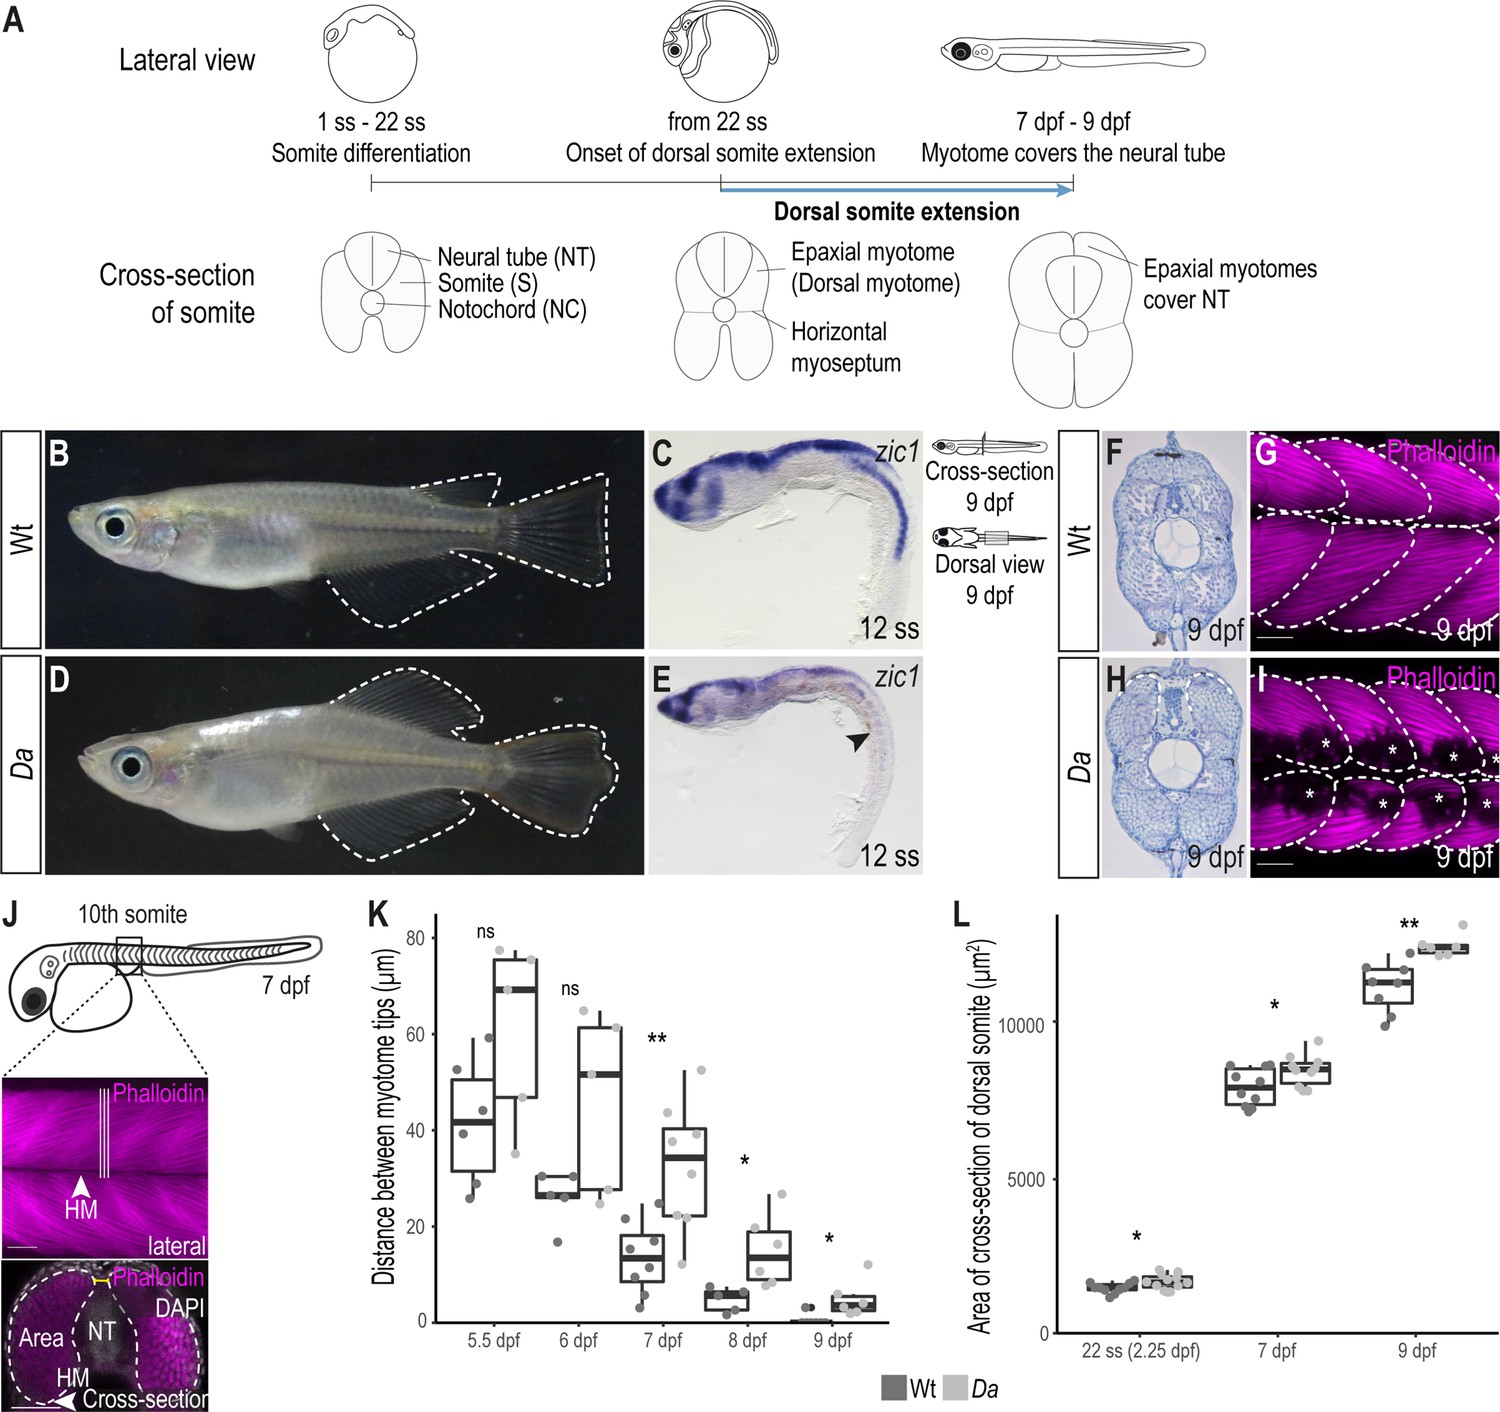
The epaxial myotome of the Da mutant fails to cover the neural tube at the end of embryonic development.
(A) Schematic representation of dorsal somite extension which results in the full coverage of the neural tube by the epaxial myotomes at the end of embryonic development. (B) Lateral view of adult Wt medaka. Dorsal, caudal, and anal fins are outlined. (C) Lateral view of whole-mount in situ hybridization against zic1 in a 12 ss (1.7 dpf, stage 23) Wt embryo. zic1 expression can be observed in the brain, neural tissues and the dorsal somites. (D) Lateral view of adult Da mutant. Dorsal, anal and caudal fins are outlined. The dorsal trunk region resembles the ventral trunk region. (E) Lateral view of whole-mount in situ hybridization against zic1 of a 12 ss Da embryo. zic1 expression can be observed in the brain and the neural tissues, but is drastically decreased in the dorsal somites (arrowhead). (F, H) Cross-sections of tail regions of hematoxylin stained 9 dpf embryos. Dorsal ends of myotomes are outlined. In Wt, the left and the right myotome come in close contact at the top of the neural tube and form a gapless muscle layer (F). In the Da mutant, the left and right myotome fail to come in contact at the top of the neural tube (H). (G, I) Dorsal view of whole-mount Phalloidin (magenta) immunostaining labeling the myotome of Wt (G) and Da (I) embryos. Epaxial myotome is outlined, and asterisks label melanophores. The contour of the myotomes was drawn based on the Z-stack images of the dorsal myotomes to avoid ambiguity caused by melanophores. Anterior to the left. (J) Schematic representation of measurements to analyze the distance between the left and the right dorsal tip of the myotome (yellow) and the cross-sectional area of the dorsal myotome. For each measurement, three consecutive optical cross sections of the 10th somite were analyzed and averaged. (K) Distance between the left and right tip of the dorsal myotome 5.5 dpf – 9 dpf (n = 6 and 5 for Wt and Da embryos, respectively at 5.5 dpf (stage 35) (p = 0.097); n = 5 and 5 at 6 dpf (stage 36) (p = 0.075); n = 8 and 8 at 7 dpf (stage 37) (p = 0.0047); n = 5 and 6 at 8 dpf (stage 38) (p = 0.019); n = 7 and 6 at 9 dpf (stage 39) (p = 0.034); median, first and third quartiles are shown). (L) Cross-sectional area of the dorsal somites at 22 ss (2.25 dpf, stage 26; n = 10 somites of 5 Wt embryos, n = 12 somites of 6 Da embryos) (p = 0.038), 7 dpf (n = 10 somites of 5 Wt embryos, n = 10 somites of 5 Da embryos) (p = 0.044) and 9 dpf (n = 8 somites of 4 Wt embryos, n = 6 somites of 3 Da embryos) (p = 0.0019). Median, first and third quartiles are shown. HM, horizontal myoseptum; NT, neural tube. Scale bar = 50 μm. ** p < 0.01, * p < 0.05, ns, not significant.
Figure 1—figure supplement 1

The ventralized epaxial myotome of the Da mutant fails to extend sufficiently to cover the neural tube at the end of embryonic development.
(A–L) Hematoxylin staining of cross-sections from Wt (A, C, E) and Da mutant (G, I, K) embryos, and maximum intensity projection of dorsal view of whole-mount Phalloidin (magenta) immunostaining to label the myotome of Wt (B, D, F) and Da mutant (H, J, L) embryos. Asterisks label melanophores. Dashed lines delineate the myotomes. Anterior to the left. Scale bar = 50 μm. (M) Diameter of myofibers in dorsal myotome of 7 dpf embryos (n = 10 myofibers from 10 somites of 5 Wt embryos, n = 10 myofibers from 10 somites of 5 Da embryos; p = 0.15) and 9 dpf embryos (n = 10 myofibers from 10 somites of 5 Wt embryos, n = 12 myofibers from 12 somites of 6 Da embryos; p = 0.31). Median, first and third quartiles are shown. ns, not significant.
Figure 2 with 2 supplements
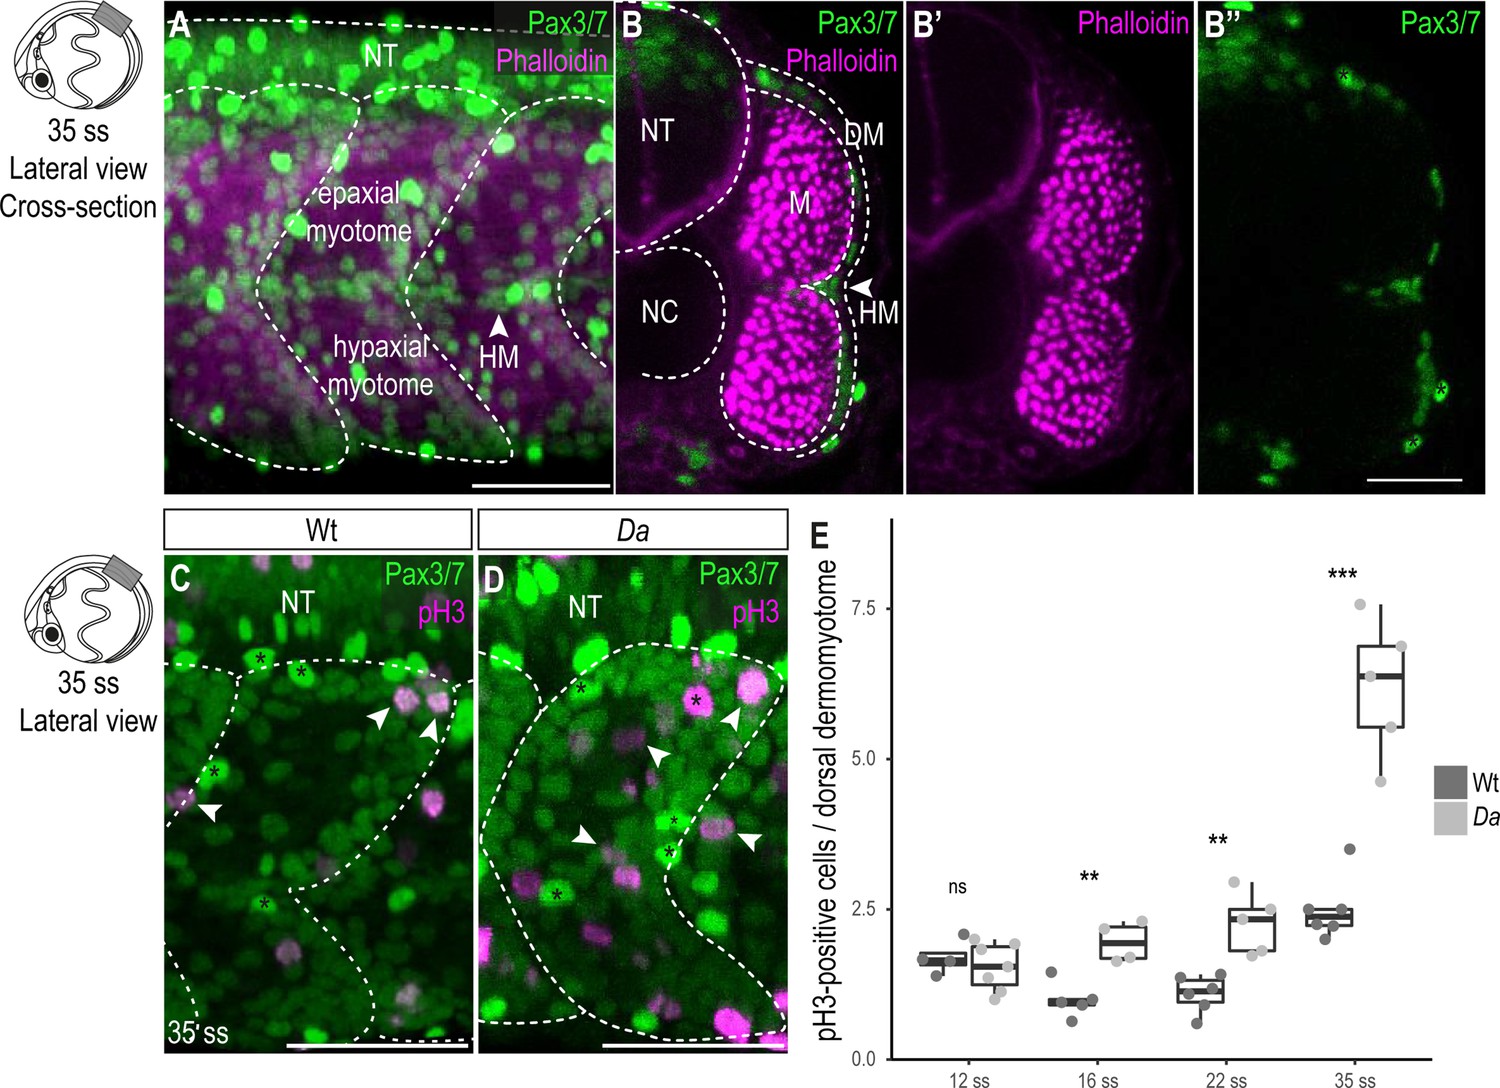
Wt dorsal DM cells show lower proliferative activity after the confinement of zic1 expression to the dorsal somite.
(A) Lateral view of 35 ss (3.4 dpf, stage 30) embryo, 10th somite is positioned in the center. Pax3/7 (green) labels DM cells and Phalloidin (magenta) labels myotome. The horizontal myoseptum (HM) separates the myotome into epaxial myotome (dorsal) and hypaxial myotome (ventral). (B–B’’) Optical cross sections, myotome is labeled by Phalloidin (magenta) and encompassed by a one-cell thick layer of DM labeled with Pax3/7 (green). Asterisks mark neural crest cells which are highly Pax3/7-positive (B’’). (C, D) Lateral view of Wt (C) and Da (D) 35 ss embryos labeled with Pax3/7 (green) and pH3 (magenta; representatives are indicated by arrowheads). Asterisks mark neural crest cells. (E) Quantification of pH3-positive cells in Wt and Da at 12 ss (n = 46.5 somites from 4 Wt embryos, n = 95 somites from 7 Da embryos; p = 0.48), 16 ss (n = 54.5 somites from 5 Wt embryos, n = 42.5 somites from 4 Da embryos; p = 0.0038), 22 ss (n = 66 somites from 6 Wt embryos, n = 40.5 somites from 5 Da embryos; p = 0035) and 35 ss (n = 49 somites from 6 Wt embryos, n = 47.5 somites from 5 Da embryos; p = 0.0008). Median, first and third quartiles are shown. ns, not significant, **p < 0.01, ***p < 0.001. Anterior to the left. Dorsal to the top. DM, dermomyotome; HM, horizontal myoseptum; M, myotome; NT, neural tube; NC, notochord. Scale bar = 50 μm.
Figure 2—figure supplement 1
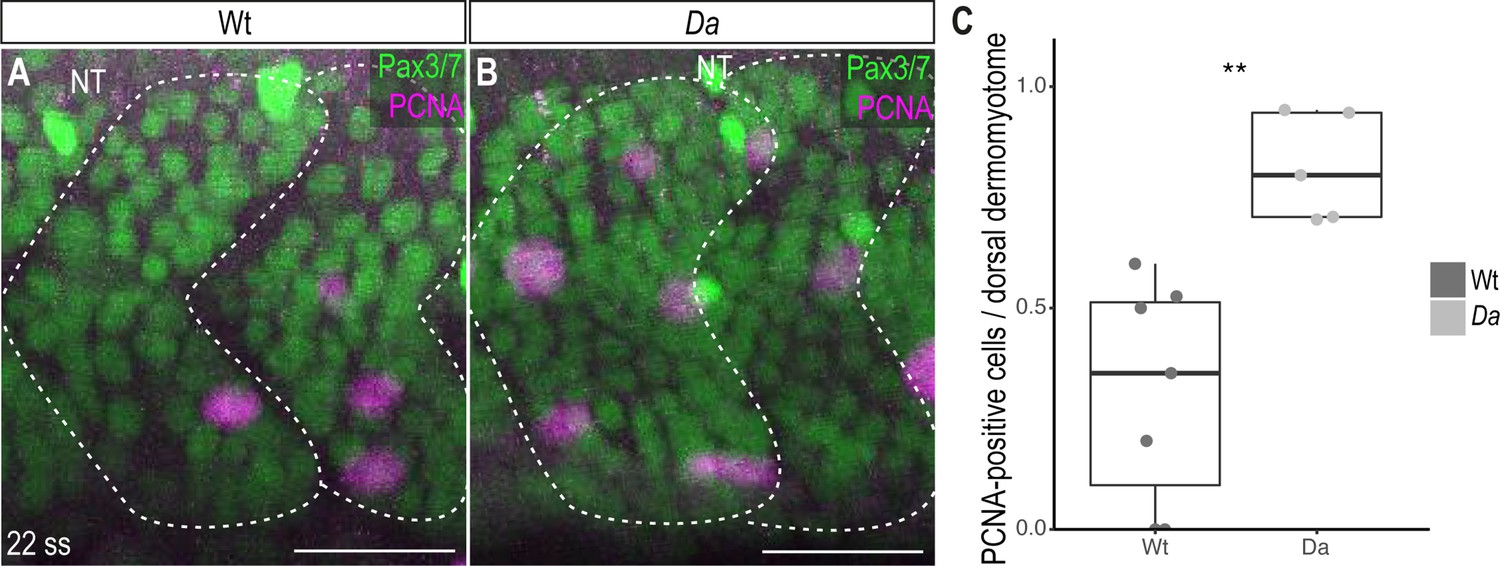
Analysis of proliferative activity of dorsal DM cells using anti-PCNA immunohistochemistry.
(A, B) Lateral view of Wt (A) and Da (B) 22 ss embryos labeled with Pax3/7 (green) and PCNA (magenta). Anterior to the left. NT, neural tube. Scale bar = 30 μm. (C) Quantification of PCNA-positive cells in dorsal somites of Wt and Da 22 ss embryos (n = 66 somites from 7 Wt embryos, n = 46.5 somites from 5 Da embryos; p = 0.0011). Median, first and third quartiles are shown.
Figure 2—figure supplement 2

Difference in proliferative activity is not observed between Wt and Da ventral DM.
(A) Quantification of pH3-positive cells in the ventral DM of 22 ss embryos (n = 66 somites from 6 Wt embryos, n = 51 somites from 5 Da embryos; p = 0.2). Median, first and third quartiles are shown.
Figure 3 with 2 supplements
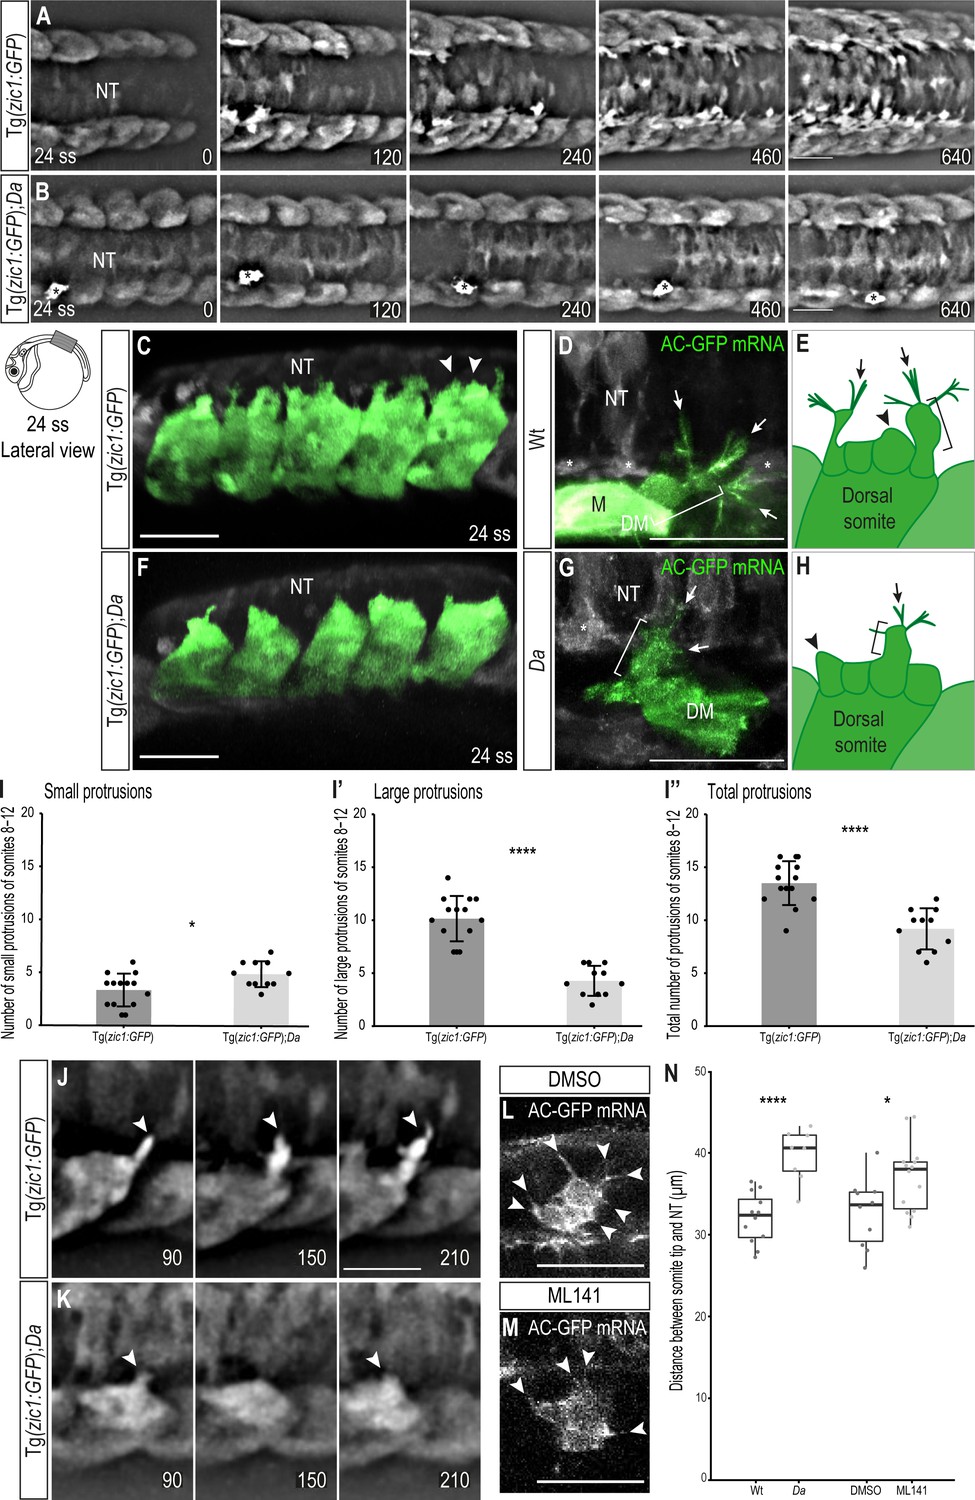
Wt dorsal DM cells form numerous large, motile protrusions at the onset of somite extension.
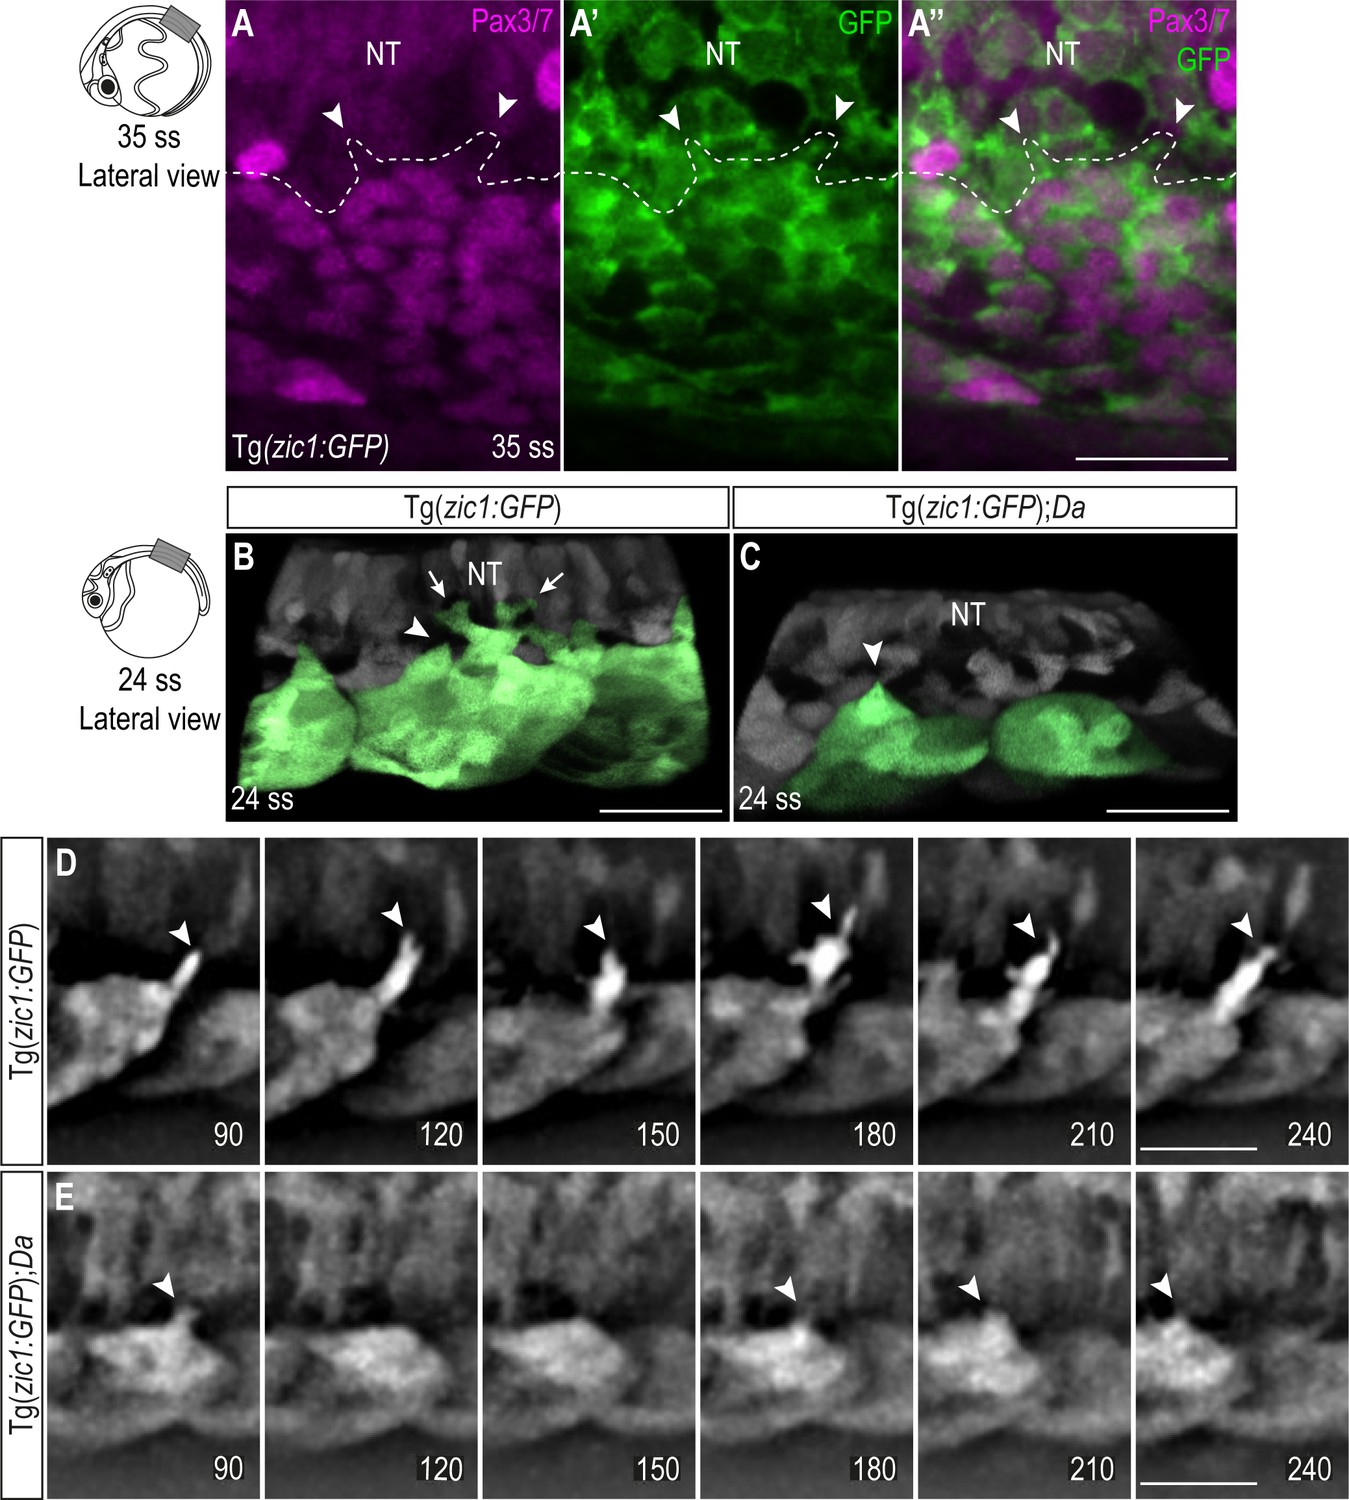
(A, B) Dorsal view of time-lapse in vivo imaging of onset of dorsal somite extension at 24 ss (2.4 dpf, stage 27) of Tg(zic1:GFP) (A) and Tg(zic1:GFP);Da (B) embryos. 15th somite is positioned in the center, z-stacks were imaged every 10 min, time is displayed in min. Asterisks indicate migrating melanophore. Scale bar = 50 μm. (C, F) Lateral view of in vivo imaging of Tg(zic1:GFP) (C) and Tg(zic1:GFP);Da (F). Signals in dorsal somites are highlighted in green. Arrowheads indicate small protrusions, arrow indicates large protrusion. Scale bar = 50 μm. (D, G) Dorsal view of in vivo imaging of large protrusion in Wt (D) and Da (G). Embryos were injected with Actin-Chromobody GFP (AC-GFP) mRNA. Signals in somitic cells are highlighted in green. Brackets indicate a lamellipodia-like structure. Arrows indicate filopodia branching out from dorsal tips of lamellipodia-like core. Asterisks indicate sclerotome cells. Scale bar = 25 μm. (E, H) Summary of dorsal DM cell protrusions in Wt (E) and Da (H) embryos. Arrowheads indicate small protrusions, brackets indicate lamellipodia-like core structure of large protrusions, and arrows indicate filopodia bundles branching off from dorsal tips of large protrusions. (I-I’’) Quantification of protrusions from Tg(zic1:GFP) (n = 14 embryos) and Tg(zic1:GFP);Da (n = 11 embryos). Protrusions of the 8th-12th somite were counted (mean ± SD, p = 0.01 for small protrusions, p = 3.3e-08 for large protrusions, p = 2.1e-05 for total protrusions). (J–K) Lateral view of protrusions extracted from time-lapse imaging of (A–B). Arrowheads indicate tip of protrusions, time is displayed in min. (J) Protrusion observed in Tg(zic1:GFP). (K) Protrusion observed in Tg(zic1:GFP);Da. Scale bar = 25 μm. (L, M) Z-planes of large protrusions of 24 ss embryos treated with DMSO (L) or ML141 (M). Arrowheads indicate filopodia. Scale bar = 25 μm. (N) Distance between dorsal somite tip and top of neural tube in 24 ss embryos (n = 12 somites from 6 Wt embryos, n = 8 somites from 4 Da embryos, p = 6.8e-05; n = 10 somites from 5 embryos treated with DMSO, n = 14 somites from 7 embryos treated with ML141, p = 0.021). Median, first and third quartiles are shown. ****p < 0.0001, *p < 0.5. Anterior to the left. DM, dermomyotome; M, myotome; NT, neural tube.
Figure 3—figure supplement 1
Protrusion forming cells at the tips of the dorsal somites are DM cells.
(A-A’’) Dorsal view of immunostaining performed on Tg(zic1:GFP) embryos at 35 ss. GFP labels Zic1-positive dorsal somite cells (green), Pax3/7 labels DM cells (magenta). Arrowheads indicate protrusions. Scale bar = 50 μm. (B, C) Lateral view of dorsal somites from Tg(zic1:GFP) (B) and Tg(zic1:GFP);Da (C) embryos at 24 ss. Signals in dorsal somites are highlighted in green. 10th somite is positioned in center. Small and large protrusions are exemplary labeled by arrowheads and arrows, respectively. Scale bar = 25 μm. (D, E) Lateral view of protrusions extracted from time-lapse images shown in Figure 3A–B. Arrowheads indicate tip of protrusions, and time is displayed in min. (D) Protrusion observed in Tg(zic1:GFP). (E) Protrusion observed in Tg(zic1:GFP);Da. Scale bar = 25 μm. Anterior to the left. Dorsal to the top. NT, neural tube.
Figure 3—figure supplement 2
Dorsal DM cells form protrusions throughout dorsal somite extension.
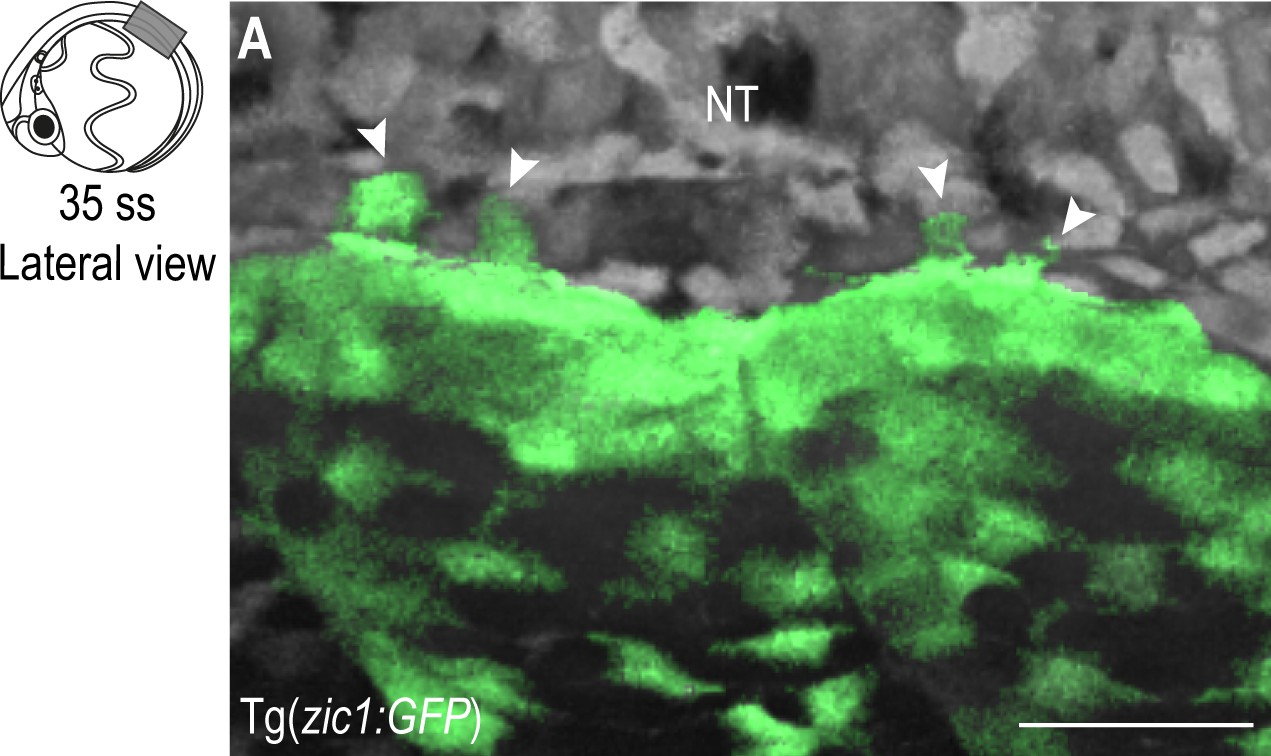
(A) Lateral view of dorsal somites from Tg(zic1:GFP) at 35 ss 5th somite. Signals in dorsal somites are highlighted in green. Large protrusions are indicated with arrowheads. Anterior to the left. Dorsal to the top. NT, neural tube. Scale bar = 50 μm.
Figure 4 with 3 supplements
DM cells delaminate from the dorsal somite at the end of dorsal somite extension and accumulate between somites.
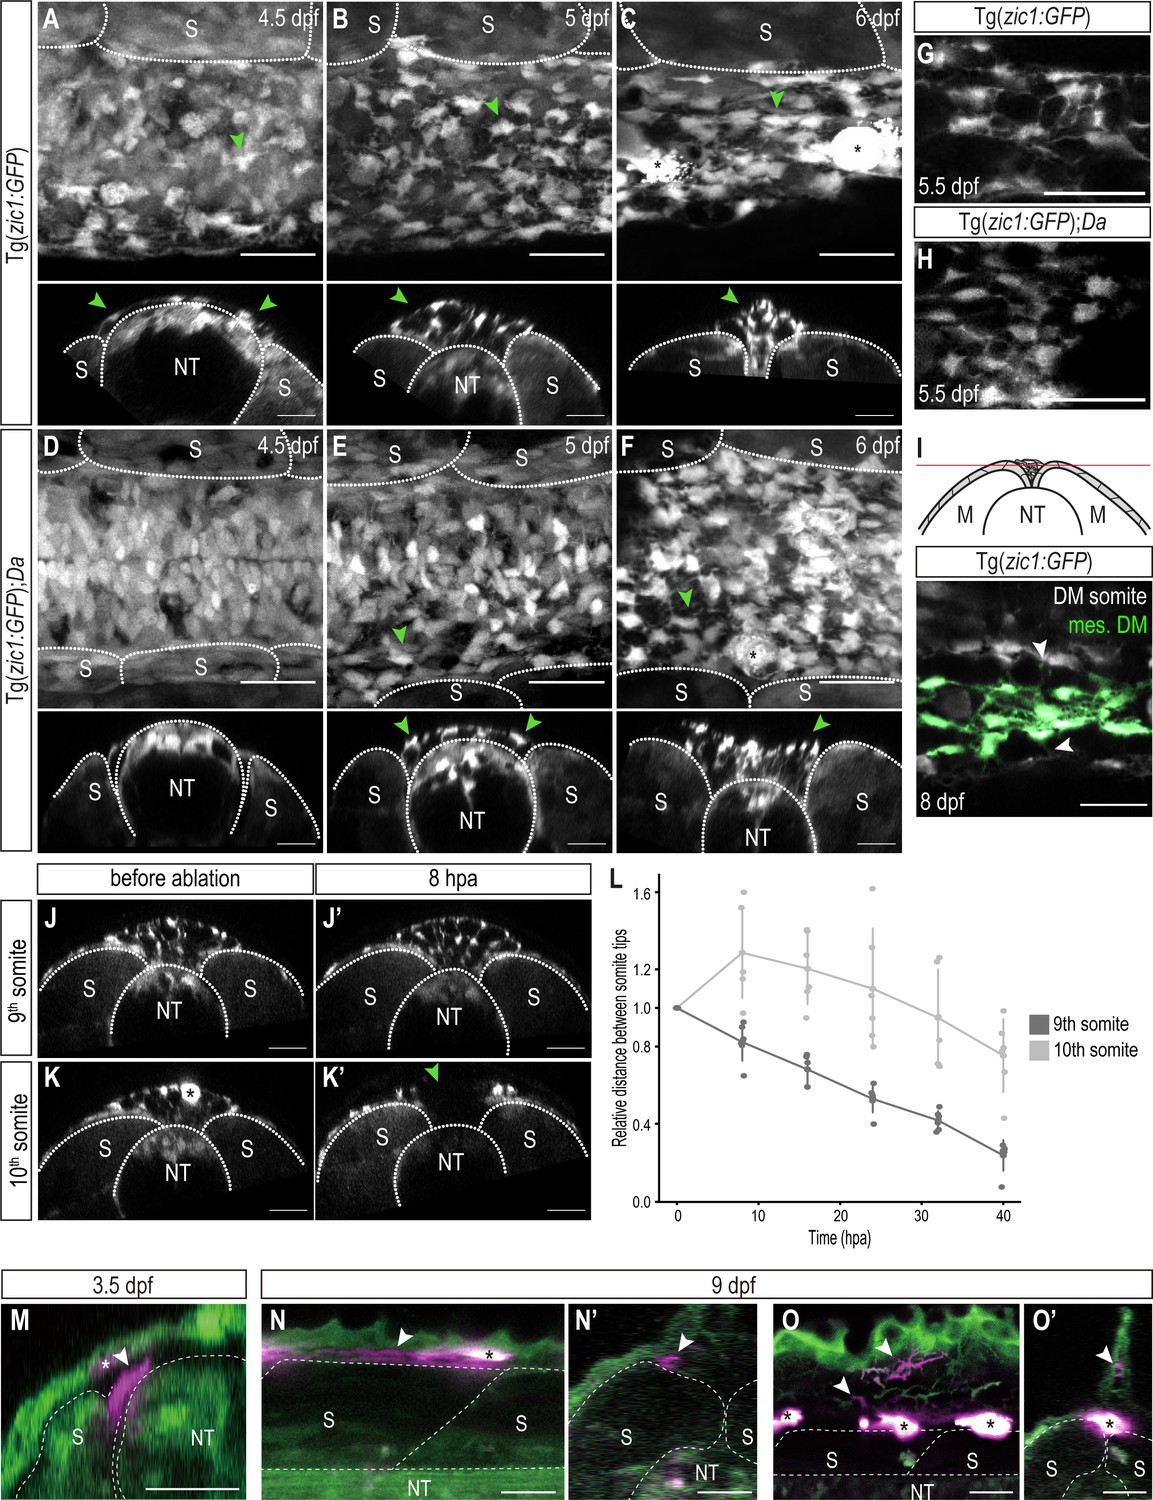
(A–F) Dorsal (top) and cross-sectional (bottom) views of Tg(zic1:GFP) at 4.5 dpf (A), 5 dpf (B), and 6 dpf (C) and Tg(zic1:GFP);Da at 4.5 dpf (D), 5 dpf (E) and 6 dpf (F). 10th somite is positioned in center. Arrowheads point to exemplary mesenchymal DM cells, and asterisks mark melanophores. (G, H) Dorsal view of mesenchymal DM cells of Tg(zic1:GFP) (G) and Tg(zic1:GFP);Da (H). (I) Z-plane of dorsal view of 10th somite of Tg(zic1:GFP) embryo. Mesenchymal DM (mes. DM) cells are colored green. Arrowheads indicate exemplary protrusions formed between somitic DM cell and mesenchymal DM cell. (J-K’) Cross-sections of 9th somite before ablation (J), 8 hr post ablation (hpa) (J’), and 10th somite before ablation (K) and 8 hpa (K’) of Tg(zic1:GFP) 5.5 dpf embryo. Green arrowhead indicates the ablation site, and asterisk indicates a pigment cell. (L) Quantification of relative distance between the left and the right tips of the 9th and 10th somites after laser ablation (n = 6 Tg(zic1:GFP) embryos). (M-O’) Fate mapping, using KikGR-mediated photoconversion, of dorsal DM cells with protrusions. (M) A single dorsal DM cell at the dorsal tip of a somite (arrowhead) was labeled at 3.5 dpf. Cross-section of the trunk is shown. Asterisk indicates an ectopically labeled epidermis cell. (N-O’) At hatching stage (9 dpf), descendants of the labeled DM cell contribute to blood vessels (arrowheads in N, N’) and fin mesenchyme in the dorsal fin fold (arrowheads in O, O’). (N) and (O), lateral views; (N’) and (O’), cross sections. Asterisks indicate autofluorescent pigment cells. Anterior to the left. M, myotome; NT, neural tube; S, somite. Scale bar = 25 μm.
Figure 4—figure supplement 1
Mesenchymal DM cells originate from dorsal somites.
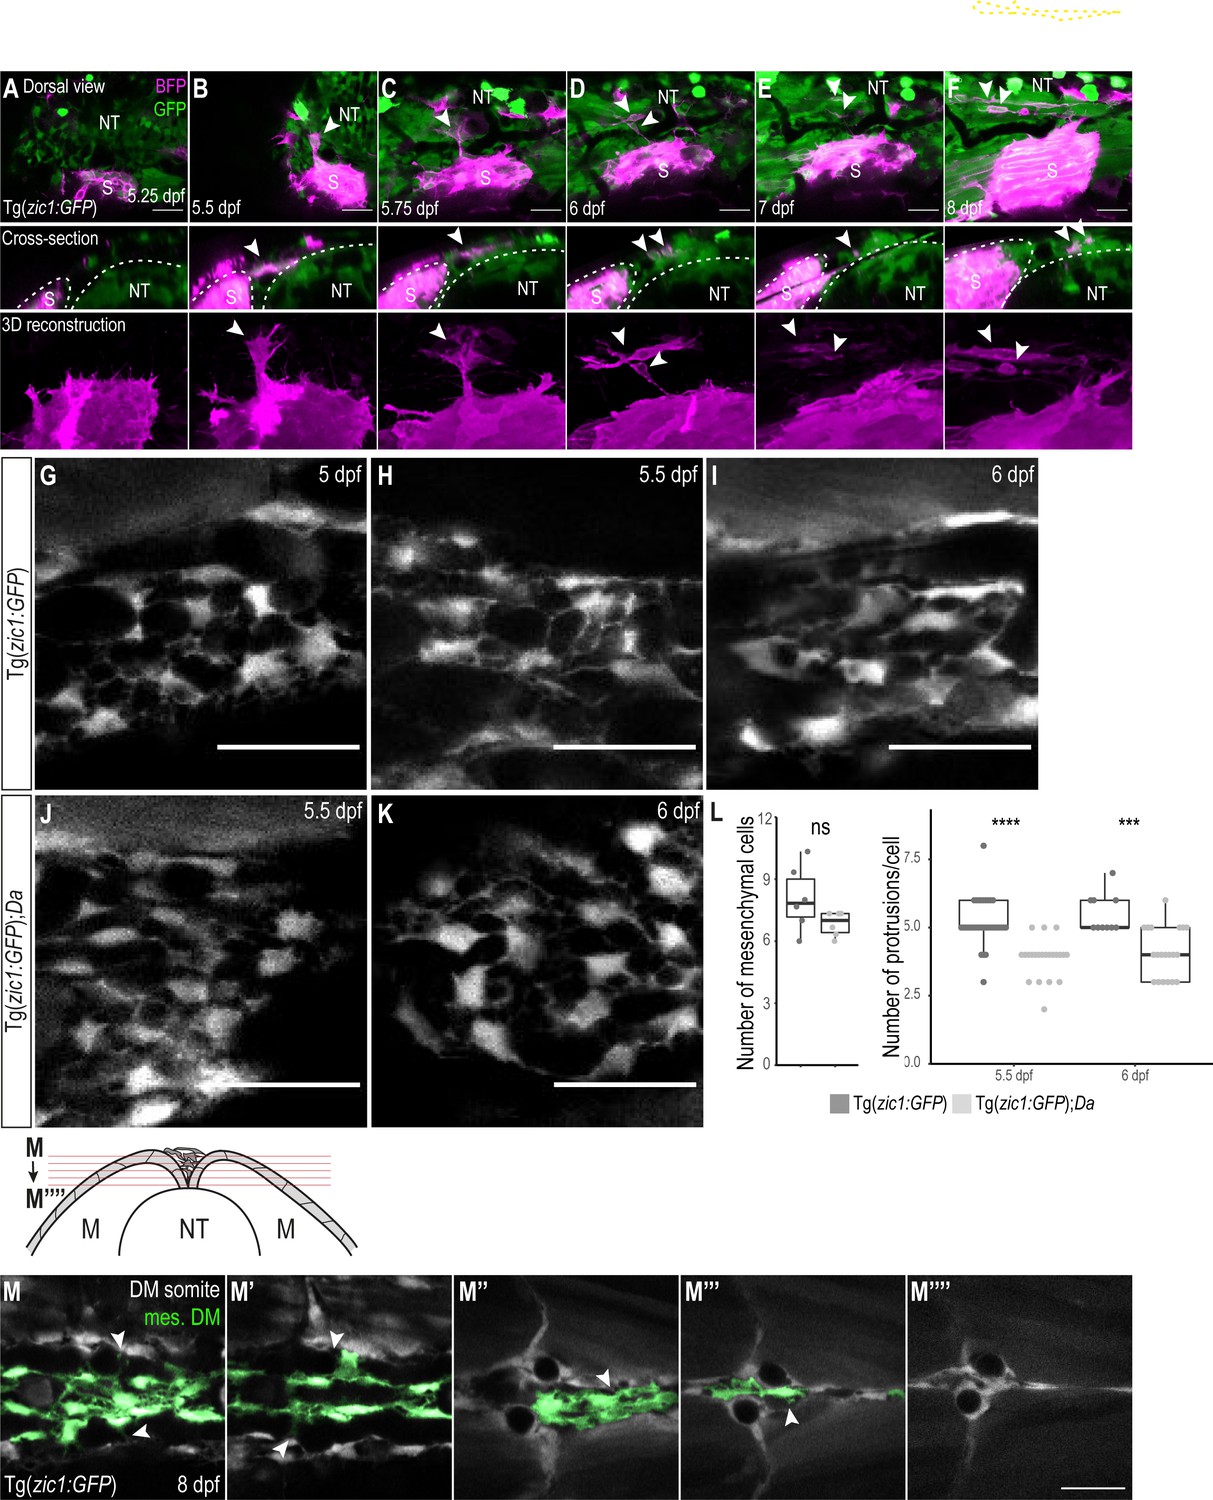
(A–F) Lineage tracing experiment to clarify the origin of mesenchymal DM cells. Cells were mosaically labeled with BFP (magenta). Arrowheads indicate DM cell originating from labeled somite which extends dorsally (B, C) and delaminates (D), becoming a mesenchymal DM cell. Somites are outlined in white. (G–K) Dorsal view of mesenchymal DM cells of Tg(zic1:GFP) at 5 dpf (G), 5.5 dpf (H) and 6 dpf (I) and Tg(zic1:GFP);Da at 5.5 dpf (J) and 6 dpf (K). (L) Left, number of mesenchymal DM cells at 5.5 dpf. Three consecutive optical cross-sections of 10th somite were analyzed and averaged (n = 5 from 2 embryos for both Tg(zic1:GFP) and Tg(zic1:GFP);Da). Right, quantification of protrusions of mesenchymal DM cells at 5.5 dpf (n = 40 cells from Tg(zic1:GFP), n = 22 cells from Tg(zic1:GFP);Da) (p = 4.4e-07) and 6 dpf (n = 10 cells from Tg(zic1:GFP), n = 20 cells from Tg(zic1:GFP);Da) (p = 0.00012). Median, first and third quartiles are shown. ***p < 0.001, ****p < 0.0001, ns, not significant. (M-M’’’’’) Consecutive z-planes of dorsal view at the 10th somites of a Tg(zic1:GFP) embryo. Mesenchymal DM cells are colored green, and arrowheads indicate protrusions extending from mesenchymal DM cells to the somitic DM cells. Anterior to the left. NT, neural tube; S, somite. Scale bar = 25 μm.
Figure 4—figure supplement 2
Mesenchymal DM cells do not migrate significantly.
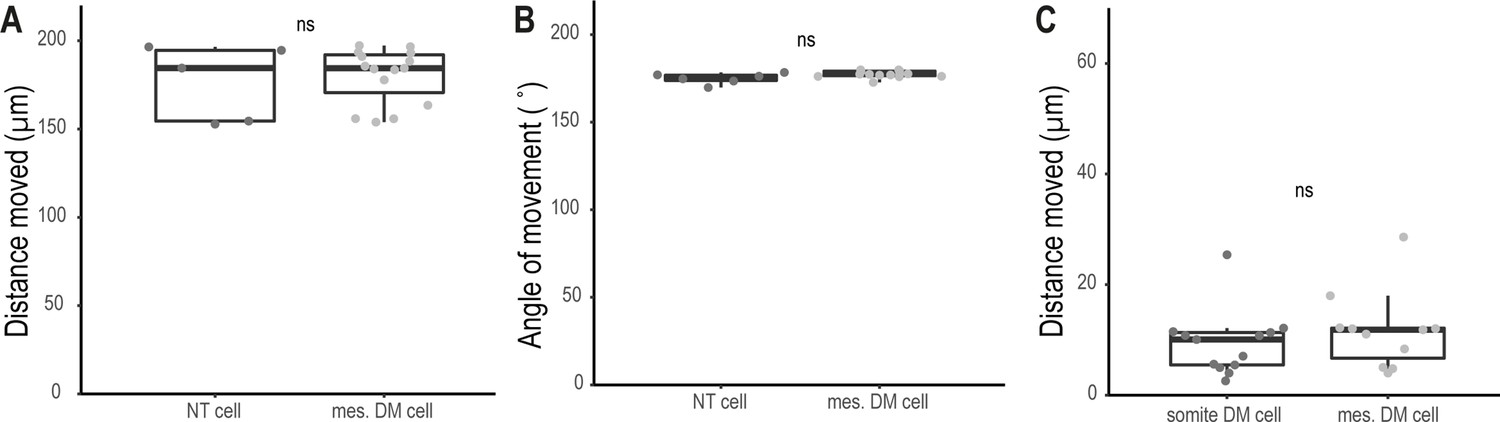
(A) Distance moved relative to imaging field by mesenchymal DM cells (mes. DM cell, n = 15 DM cells) and cells of the neural tube (NT cell, n = 5 NT cells) during 13.3 h in vivo imaging of 4.5 dpf Tg(zic1:GFP) embryo (Video 3) (median, first and third quartiles are shown; p = 0.73). (B) Angle moved relative to imaging field by mesenchymal DM cells (n = 15 DM cells) and cells from the neural tube (n = 5 NT cells) during 13.3 h in vivo imaging of 4.5 dpf Tg(zic1:GFP) embryo (Video 3) (median, first and third quartiles are shown; p = 0.1). (C) Distance moved relative to imaging field by DM cells from the tip of the dorsal somite (somite DM cell, n = 11 somite DM cells) and mesenchymal DM cells (mes. DM cells, n = 13 mesenchymal DM cells) during 15 hr in vivo imaging of 5.5 dpf Tg(zic1:GFP) embryo (Video 4) (median, first and third quartiles are shown; p = 0.4). ns, not significant.
Figure 4—figure supplement 3
Function and fate of mesenchymal DM cells.
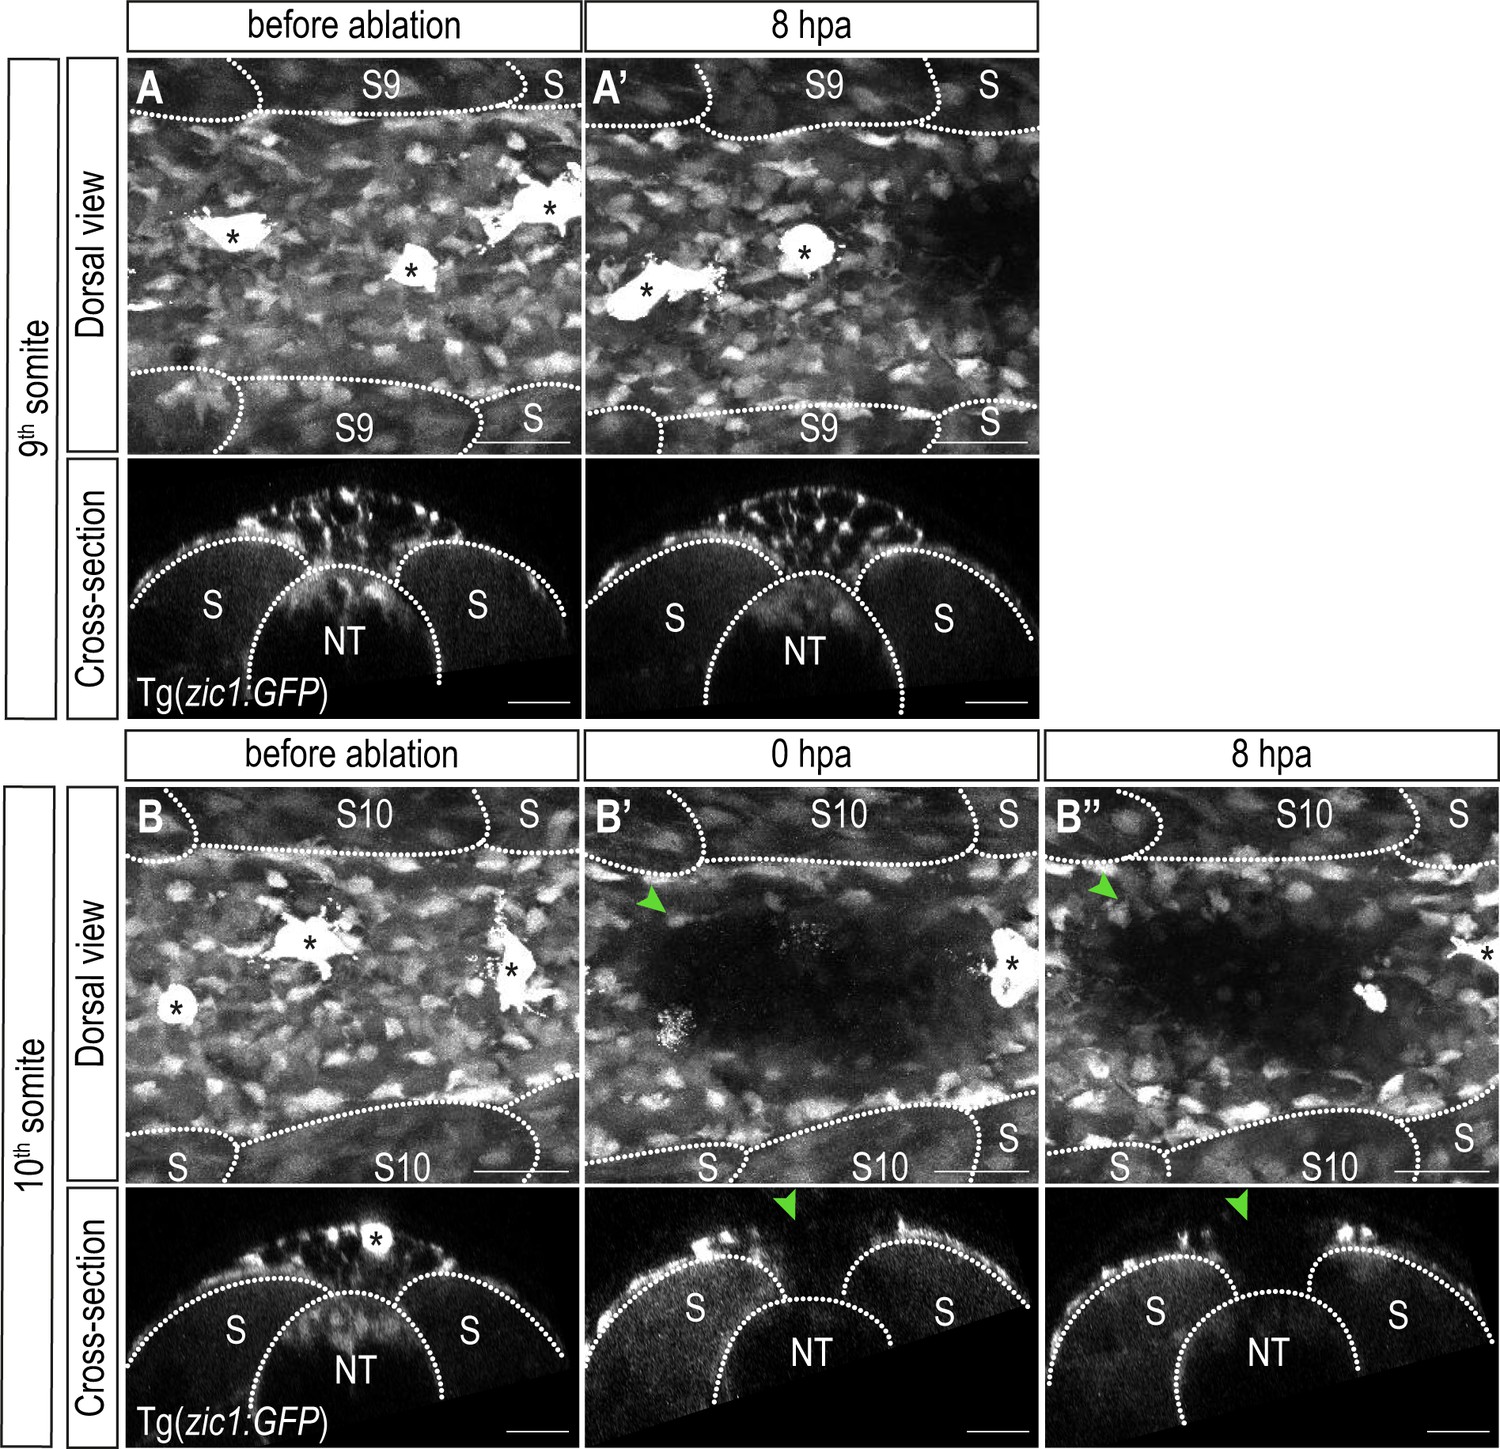
Dorsal and cross-sectional view of 9th somite before ablation (A), 8 hpa (A’) and 10th somite before ablation (B), just after laser ablation (B’) and 8 hpa (B’’) of a Tg(zic1:GFP). s9, 9th somite; s10, 10th somite. Scale bar = 25 μm Anterior to the left. NT, neural tube; S, somite.
Figure 5 with 2 supplements
Zic1 regulates dorsal-specific expression of genes in the somites.
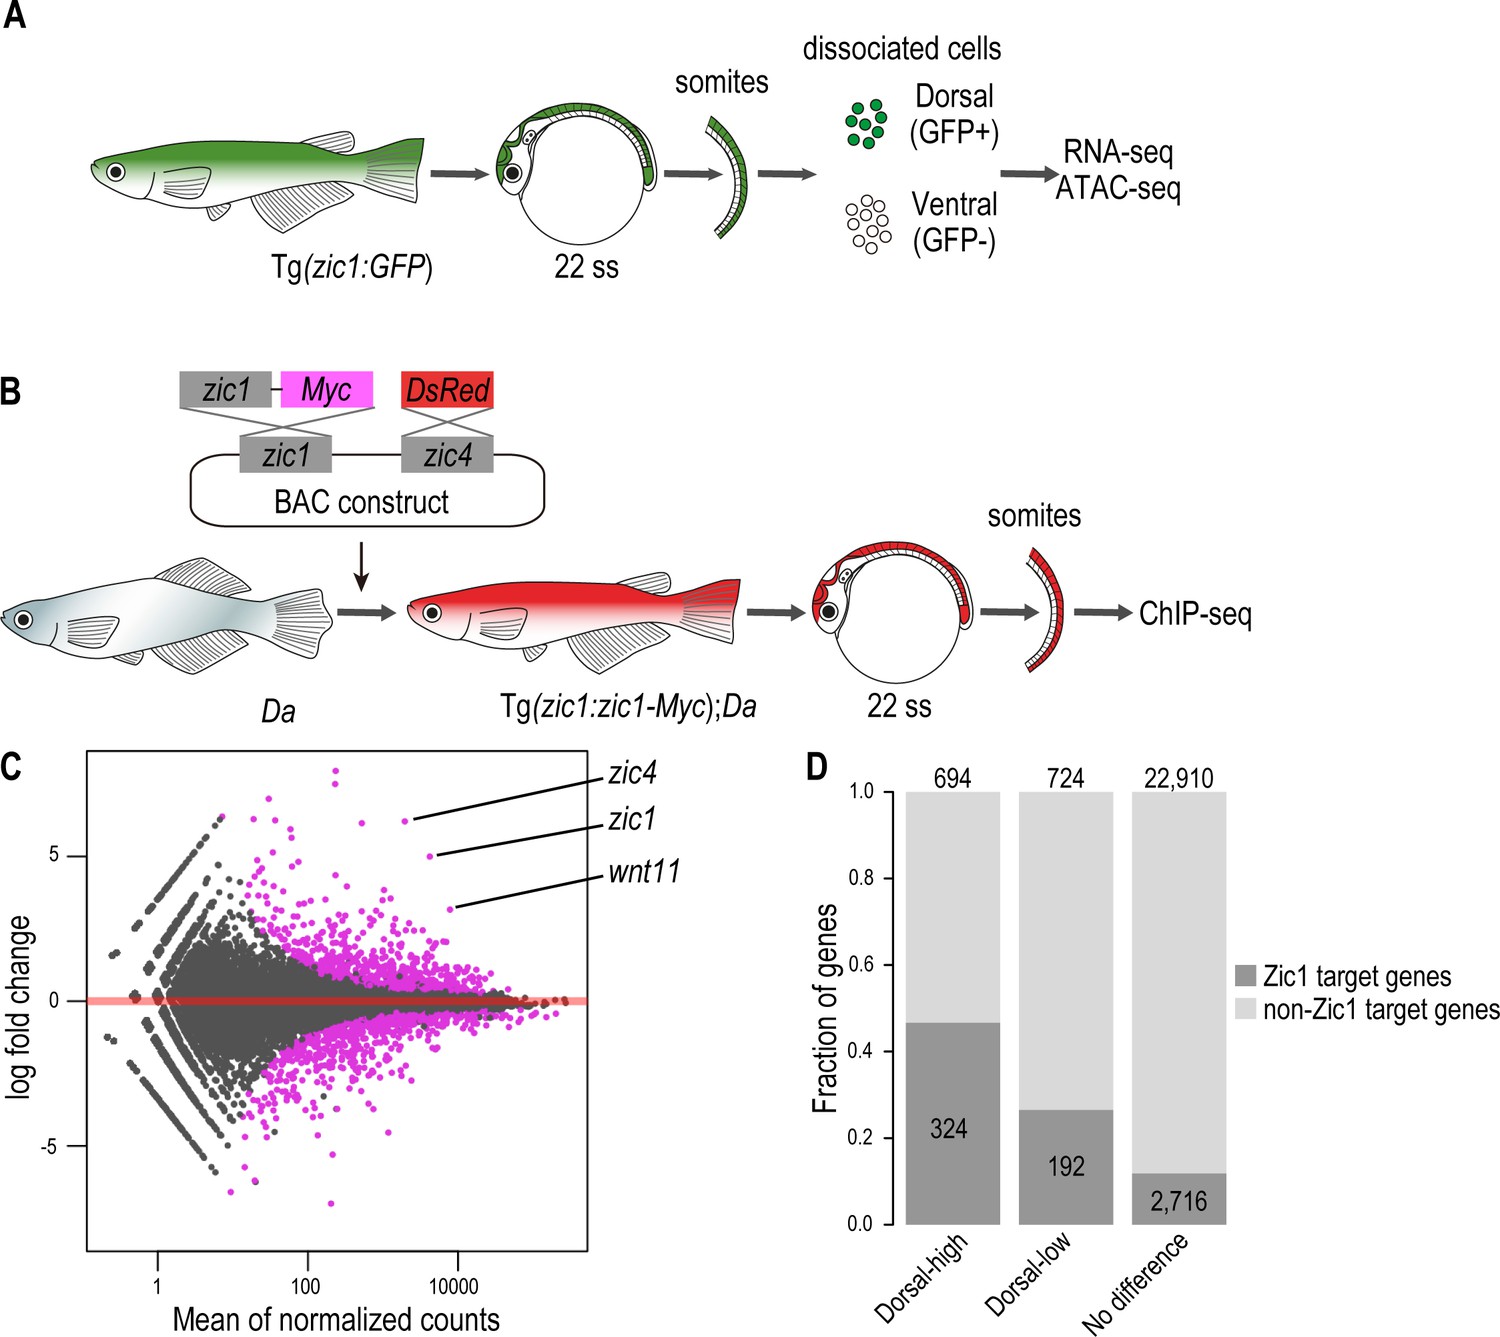
(A) Schematic representation of preparation of dorsal and ventral somite cells for RNA-seq and ATAC-seq. (B) Schematic representation of generating the transgenic line Tg(zic1:zic1-Myc);Da. Somites expressing zic1-Myc are subjected to ChIPmentation against Myc. (C) Analysis of RNA-seq revealed that 694 genes are expressed specifically in the dorsal somites (among these genes are zic1, zic4 and wnt11) and 724 genes are expressed specifically in ventral somites. Magenta indicates differentially expressed genes (adjusted p-value < 0.01). (D) The ChIPmentation against Zic1 revealed that 324 of dorsal-high genes, 192 dorsal-low genes and 2716 non differential expressed genes in the somites are potential Zic1 target genes.
Figure 5—figure supplement 1
In Tg(zic1:zic1-Myc);Da fish, the ventralized trunk phenotype is rescued.
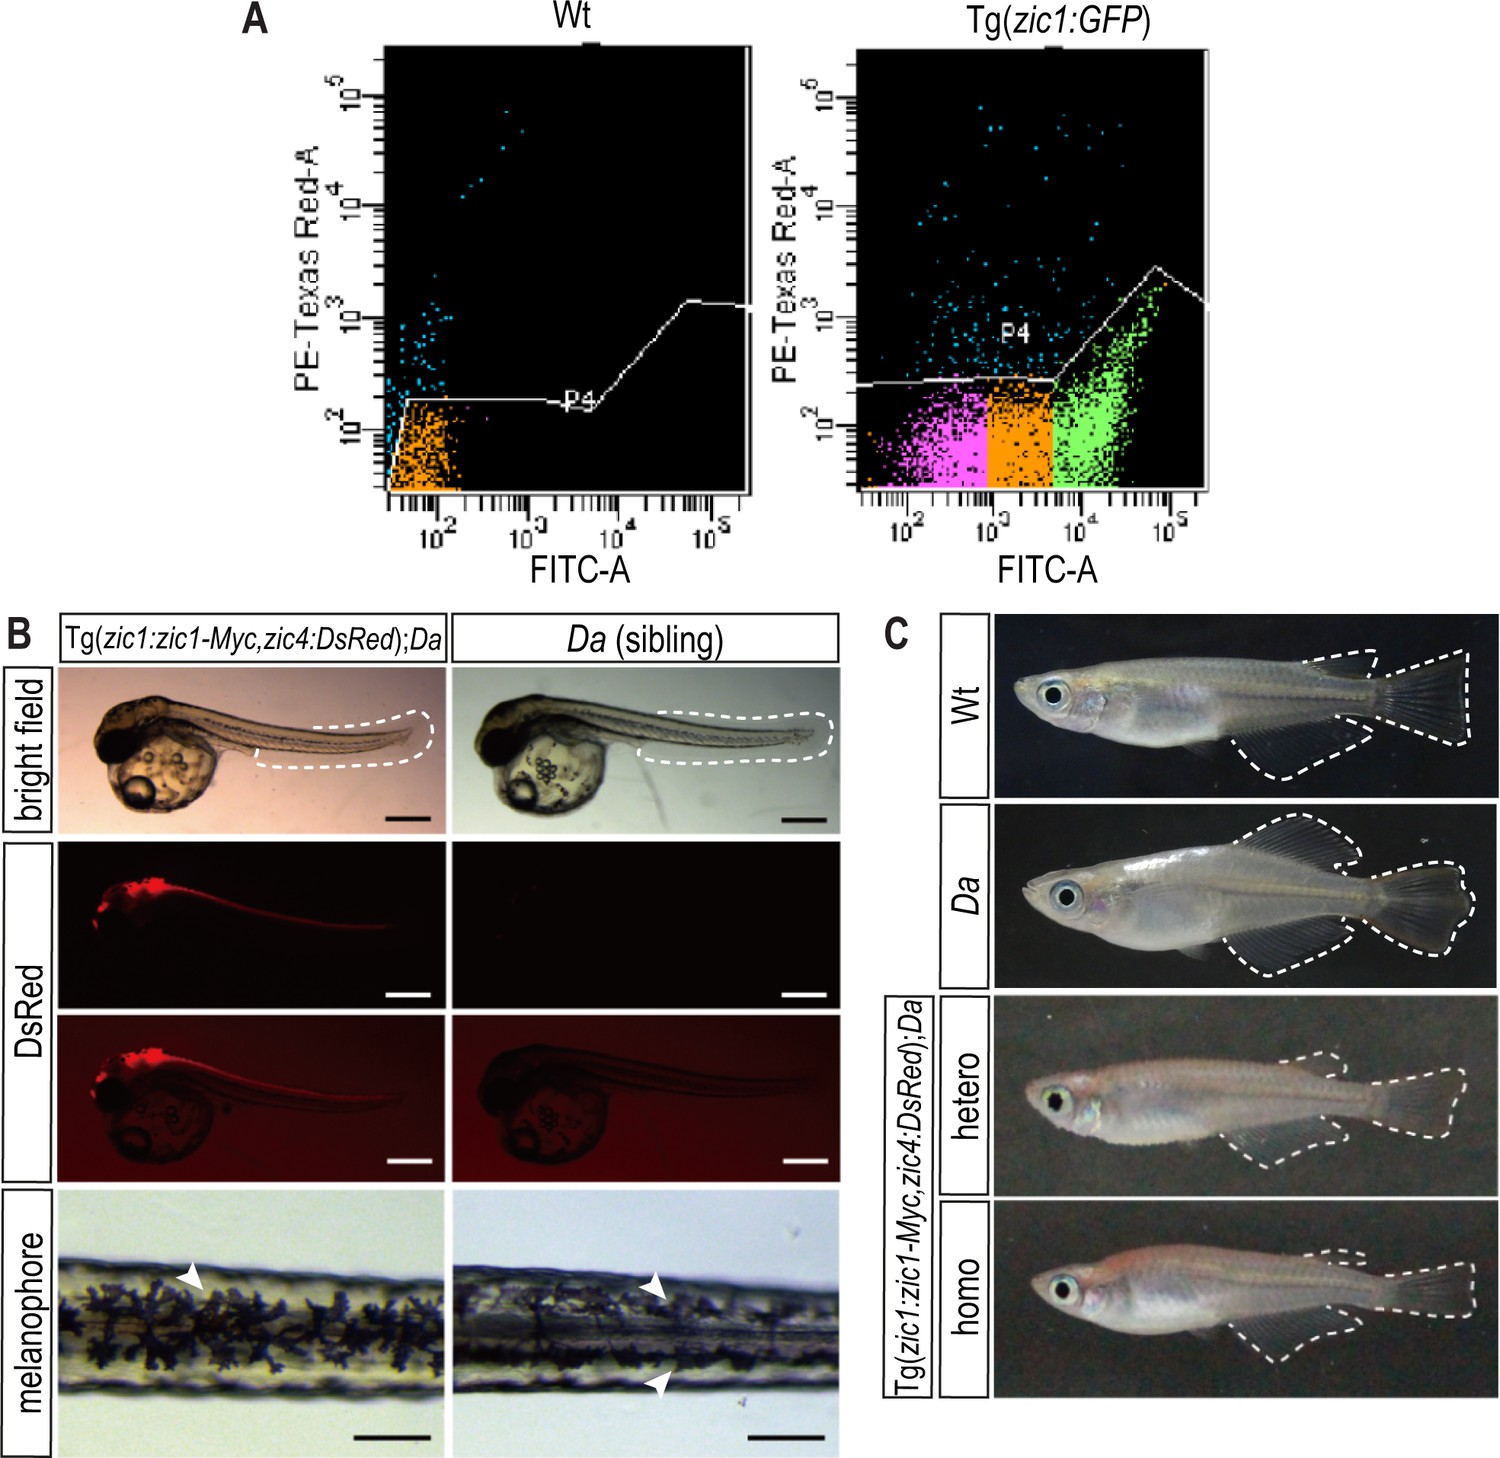
(A) A representative flow cytometry plot of GFP expression in somite cells. Cells in green and magenta regions were collected as GFP positive and negative cells, respectively. PE-Texas Red-A indicates dead cells by PI staining. FITC shows GFP signal intensity. (B, C) Da phenotype is rescued in the transgenic line Tg(zic1:zic1-Myc);Da. (B) DsRed is expressed in the neural tube and dorsal somites, mimicking the endogenous expression of zic1 and zic4 (scale bar = 500 μm). Da mutant embryos display two rows of melanophores on the dorsal midline of their trunk (arrowheads, scale bar = 100 μm). In Tg(zic1:zic1-Myc);Da embryos, as in Wt embryos, a single row of melanophores (arrowhead) on the dorsal midline is found. (C) Ventralized phenotypes of adult Da mutants (including body shape, pigmentation, fin shape (outlined)) are rescued in Tg(zic1:zic1-Myc);Da adult fish. Images of Wt and Da adult medaka were first shown in Figure 1B and D.
Figure 5—figure supplement 2
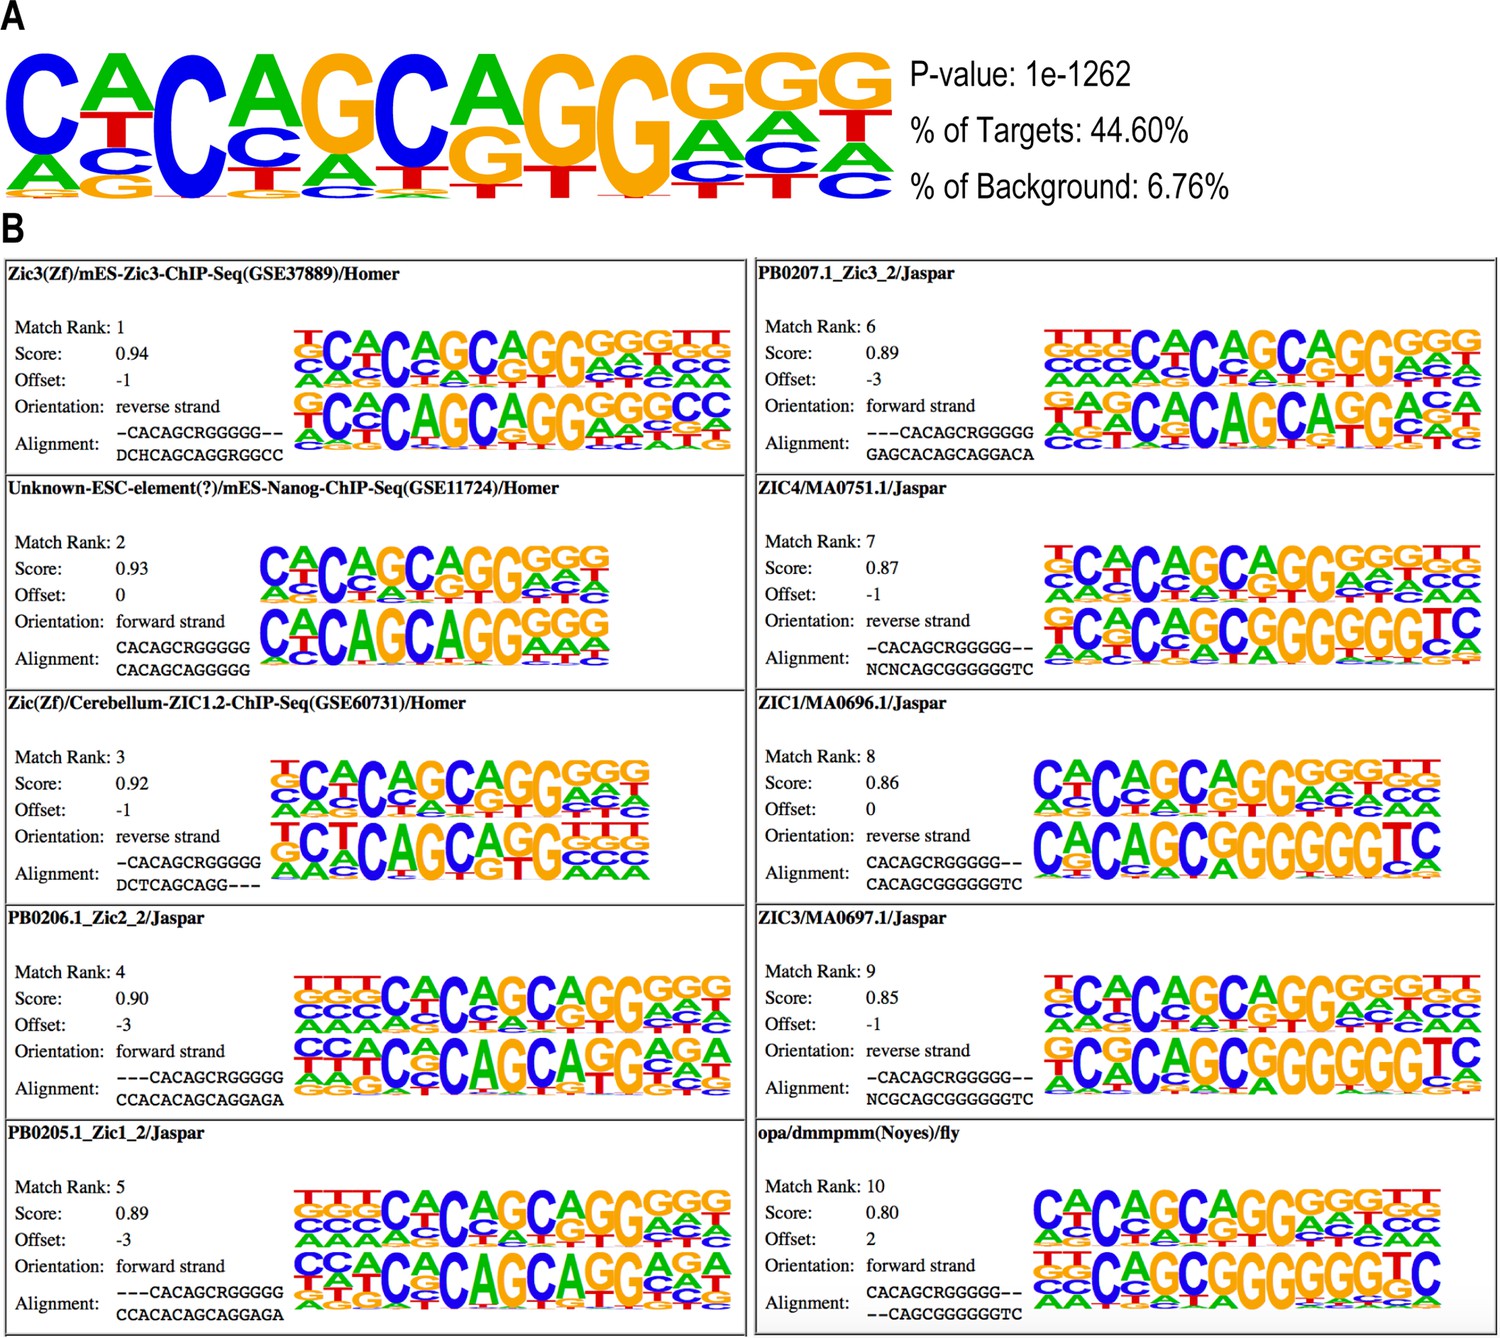
Common ZIC family DNA motifs are enriched in Zic1 peaks.
(A) Top DNA motif enriched in Zic-Myc ChIPmentation peaks identified by HOMER. (B) Known motifs matched to DNA motif in (A). For each match, the upper motif, identified in this study (A), was compared to a known motif (lower motif). Matches were analyzed by HOMER.
Figure 6 with 1 supplement
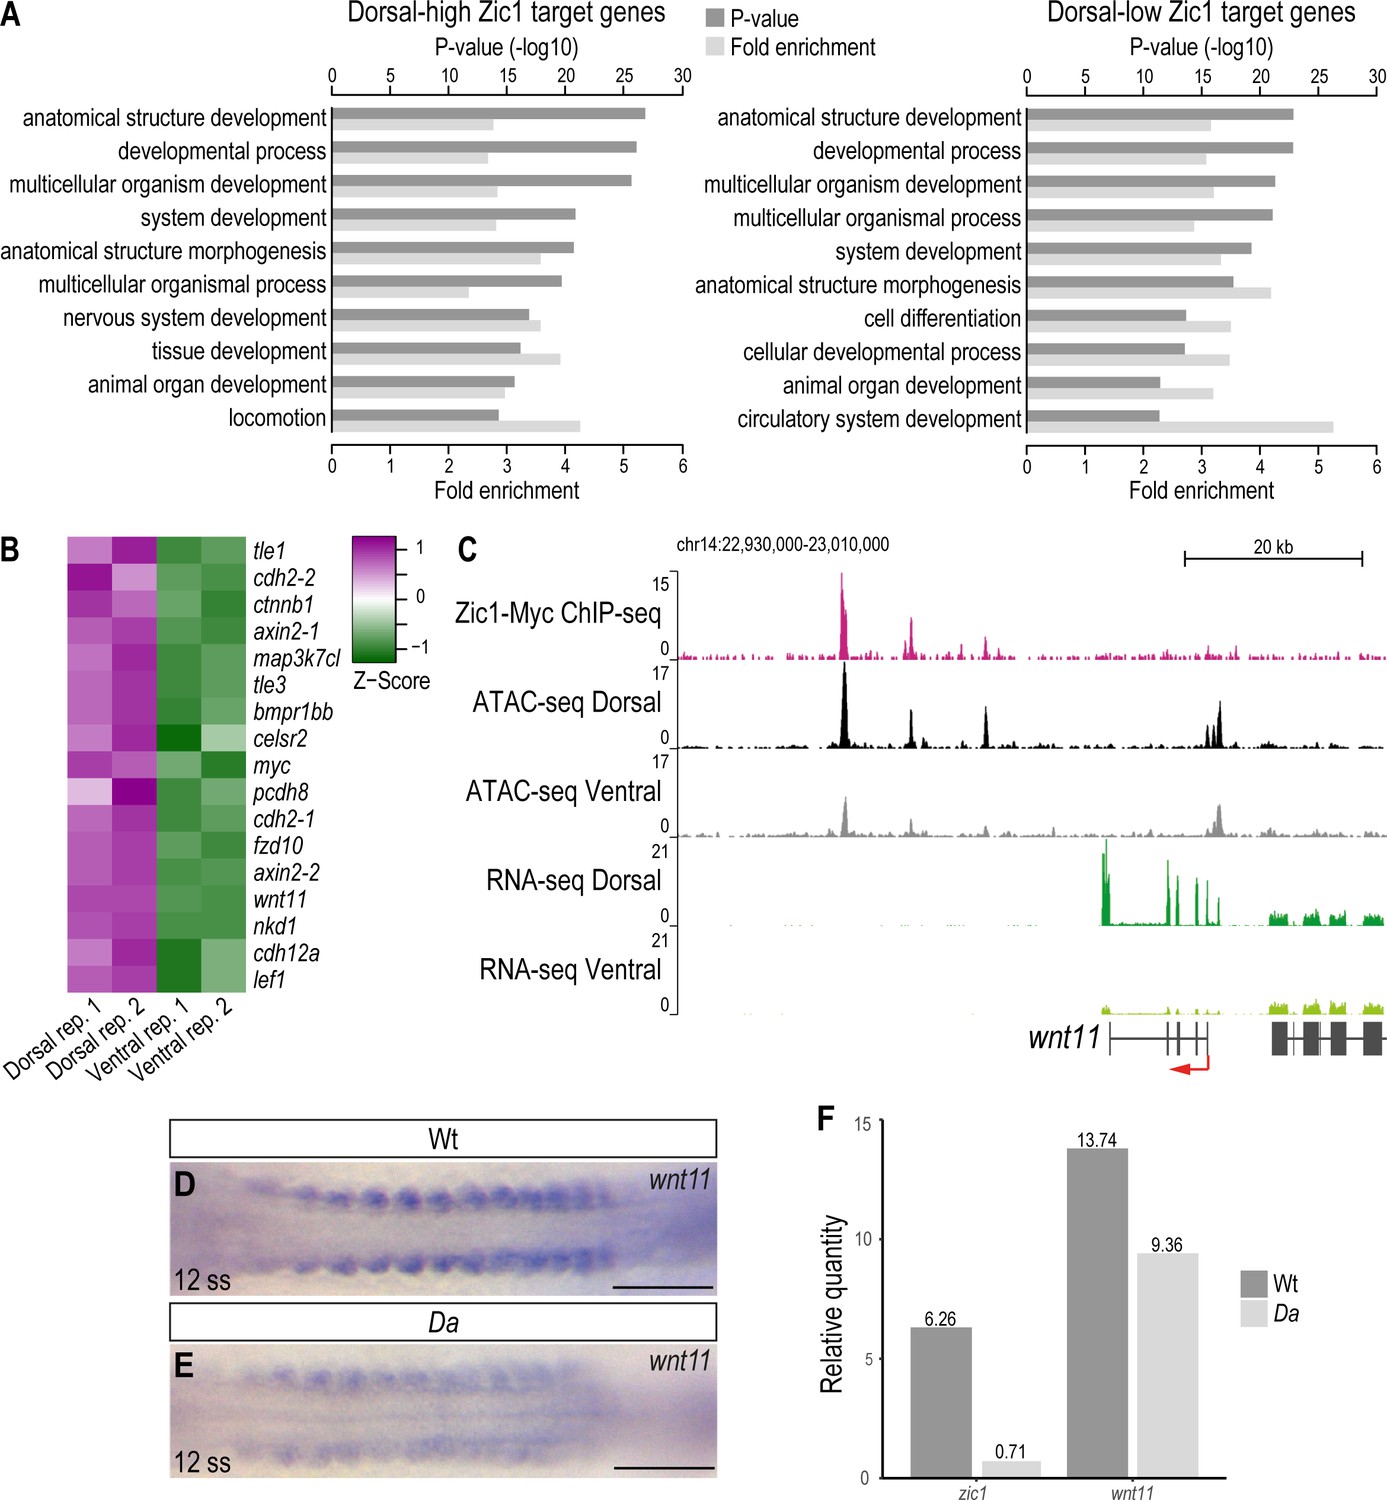
wnt11 is a direct downstream target of Zic1 and down-regulated in the dorsal somites of the Da mutant.
(A) GO analysis of dorsal-high (left) and dorsal-low (right) Zic1 target genes. (B) Pathway enrichment analysis indicated that genes associated with Wnt signaling pathway are specifically enriched in dorsal-high Zic1 target genes. (C) Analysis of the wnt11 locus. Peaks form the ChIPmentation against Zic1 (magenta track) overlap with open chromatin regions in the dorsal somites (black track), while this genomic region is less open in ventral somites (grey track). RNA-seq data revealed that wnt11 is highly expressed in dorsal somites (dark green track) and minimally in ventral somites (light green track). (D, E) Dorsal view of tails of whole-mount in situ hybridization against wnt11 performed in Wt (D) and Da (E) 12 ss embryos. The expression of wnt11 is reduced in the Da mutant. (F) RT-PCR performed on pooled tails of Wt and Da 12 ss embryos indicates that zic1 expression is reduced by 8.8-fold and wnt11 expression by 1.4-fold in the Da mutant. Anterior to the left. Scale bar = 100 μm.
Figure 6—figure supplement 1
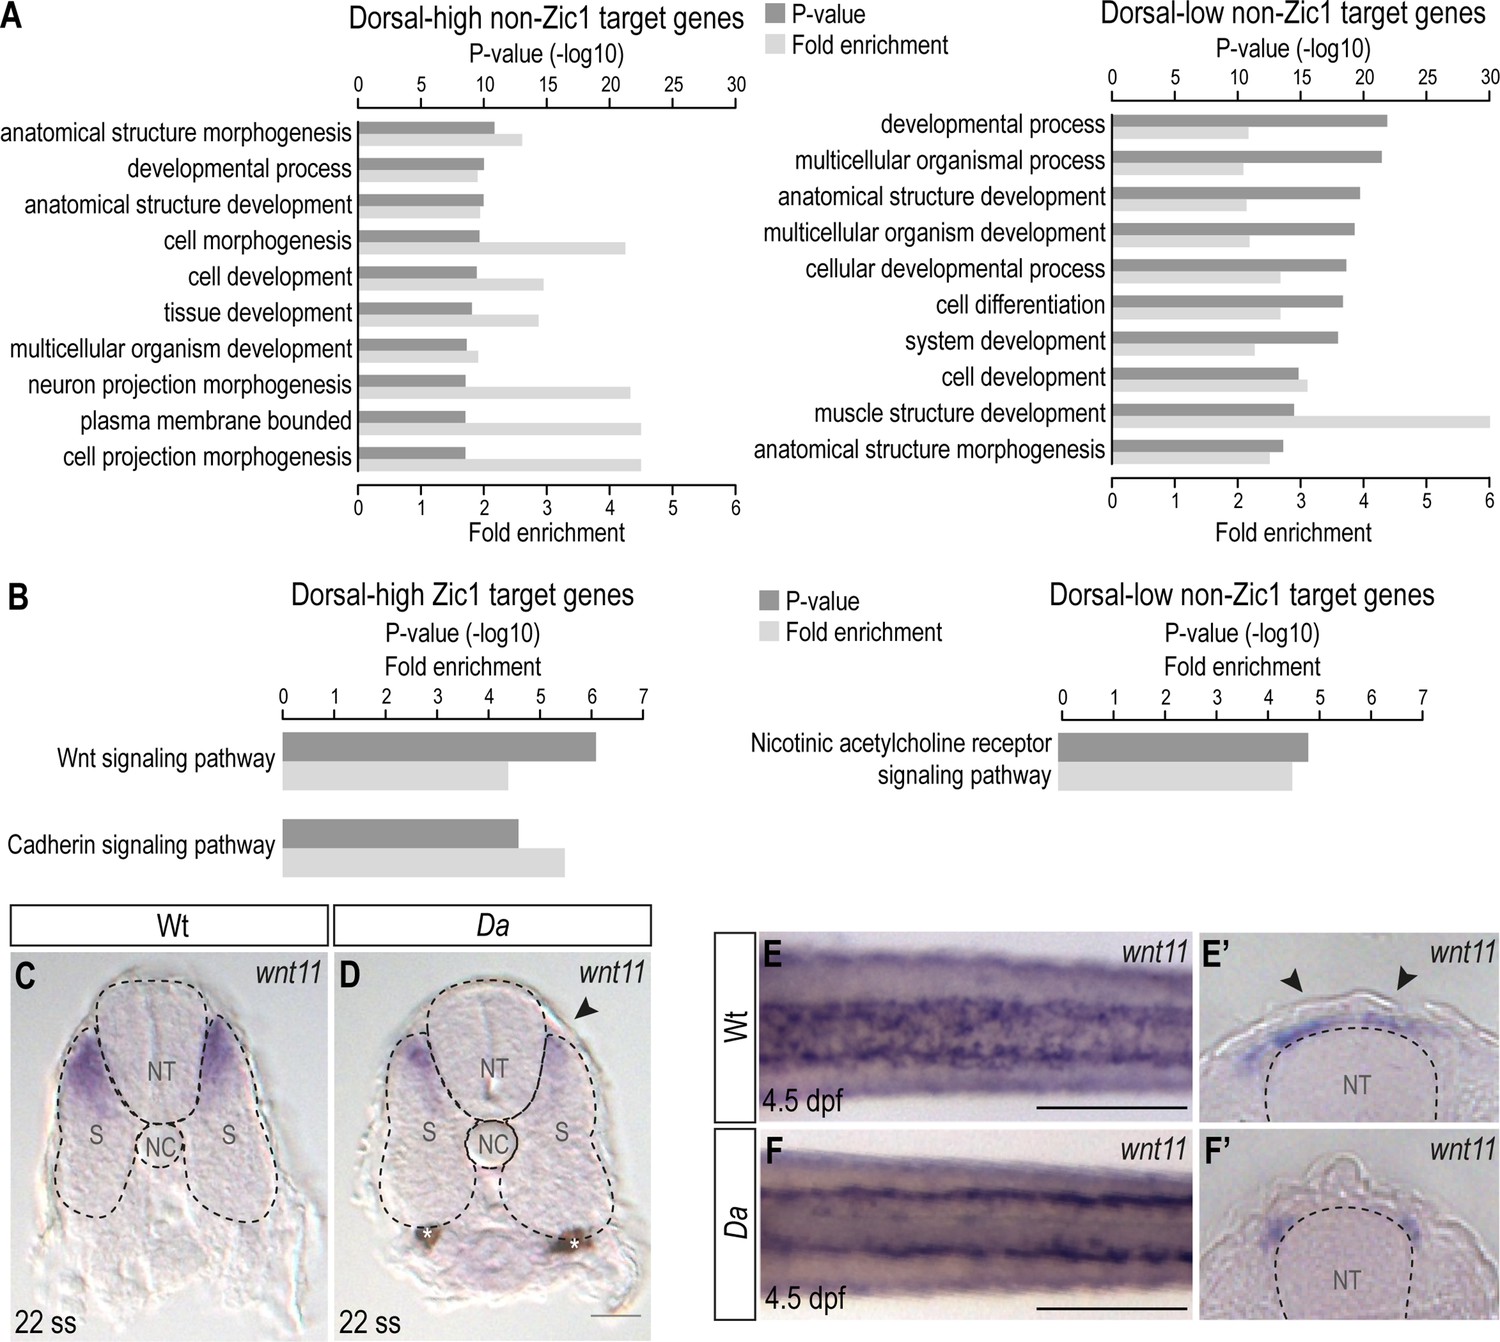
Wnt signaling pathway is enriched in dorsal-high Zic1 target genes.
(A) GO analysis of dorsal-high and dorsal-low non-Zic1 target genes. (B) Pathway enrichment analysis of dorsal-high Zic1 target genes and dorsal-low non-Zic1 target genes. (C, D) Sections of the trunk of whole-mount in situ hybridization against wnt11 performed on 22 ss Wt (C) and Da mutant (D) embryos. The expression of wnt11 is reduced in the dorsal somites of the Da mutant (arrowhead). Asterisks mark melanophores. Scale bar = 38 μm. (E-F’) Whole-mount in situ hybridization against wnt11 on Wt (E, E’) and Da (F, F’) embryos at 4.5 dpf (E, F, dorsal view: E’, F’, cross-section). In Wt wnt11 expression is further restricted to the dorsal most part of the somites (E’) and the mesenchymal DM cells (E’, arrowheads). The expression of wnt11 is reduced in the dorsal somites of the Da mutant (F, F’). Scale bar = 100 μm. Anterior to the left. Dorsal to the top. NC, notochord; NT, neural tube; S, somite. Sections = 40 μm.
Figure 7 with 2 supplements
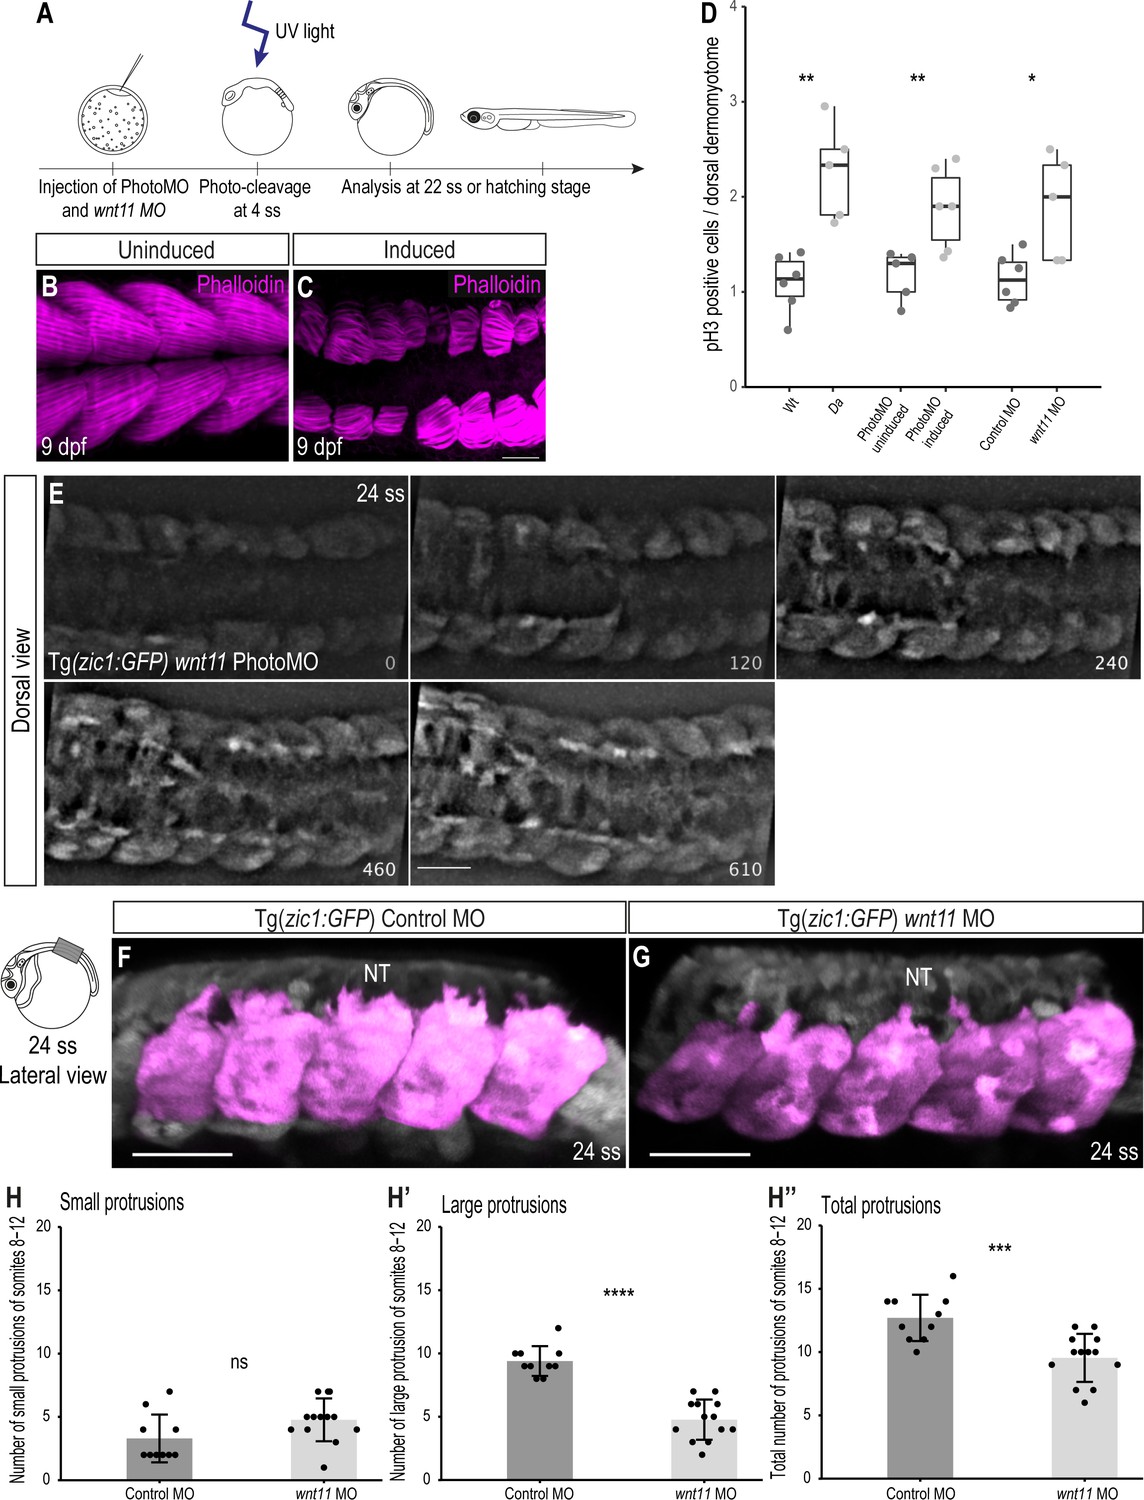
Knock-down of wnt11 in Wt embryos recapitulates the Da dorsal somite phenotype.
(A) Schematic outline of PhotoMO mediated knock-down of wnt11. (B, C) Dorsal view of maximum projection of whole-mount Phalloidin staining of 9 dpf embryos injected with PhotoMO but not photocleaved (B) and photo-cleaved (C). The epaxial myotomes of the wnt11 morphant are affected. (D) Quantification of pH3-positive cells in the dorsal DM of 22 ss embryos. Embryos with reduced levels of wnt11 in their dorsal somites (n = 40.5 somites from 5 Da embryos (adopted from Figure 2E), n = 61.5 somites of 6 wnt11 PhotoMO-Morphant embryos and n = 52 somites from 5 wnt11 morphant embryos) have significantly more pH3-positive cells in their dorsal DM compared to the respective controls (n = 66 somites from 6 Wt embryos (adopted from Figure 2E), n = 51 somites of 5 uninduced PhotoMO embryos and n = 65 somites from 6 Control MO embryos; p = 0.0035, 0.0091, 0.021, respectively). Median, first and third quartiles are shown. (E) Dorsal view of 24 ss Tg(zic1:GFP) embryo injected with wnt11 PhotoMO and photo-cleaved at 4 ss. Z-stacks were recorded every 10 min, time is displayed in min, and 15th somite is positioned in the center. (F, G) Lateral view of dorsal somites (colored magenta) of Tg(zic1:GFP) injected with Control MO (F) and wnt11 MO (G). (H-H’’) Quantification of protrusions formed by the 8th-12th somite of Tg(zic1:GFP) injected with Control MO (n = 10 embryos) or wnt11 MO (n = 13 embryos) (mean ± SD, p = 0.069 for small protrusions, p = 7.7e-08 for large protrusions, p = 0.00064 for total protrusions). Anterior to the left. NT, neural tube. Scale bar = 50 μm. *p < 0.05, **p < 0.01, ***p < 0.001, ****p < 0.0001, ns, not significant.
Figure 7—figure supplement 1
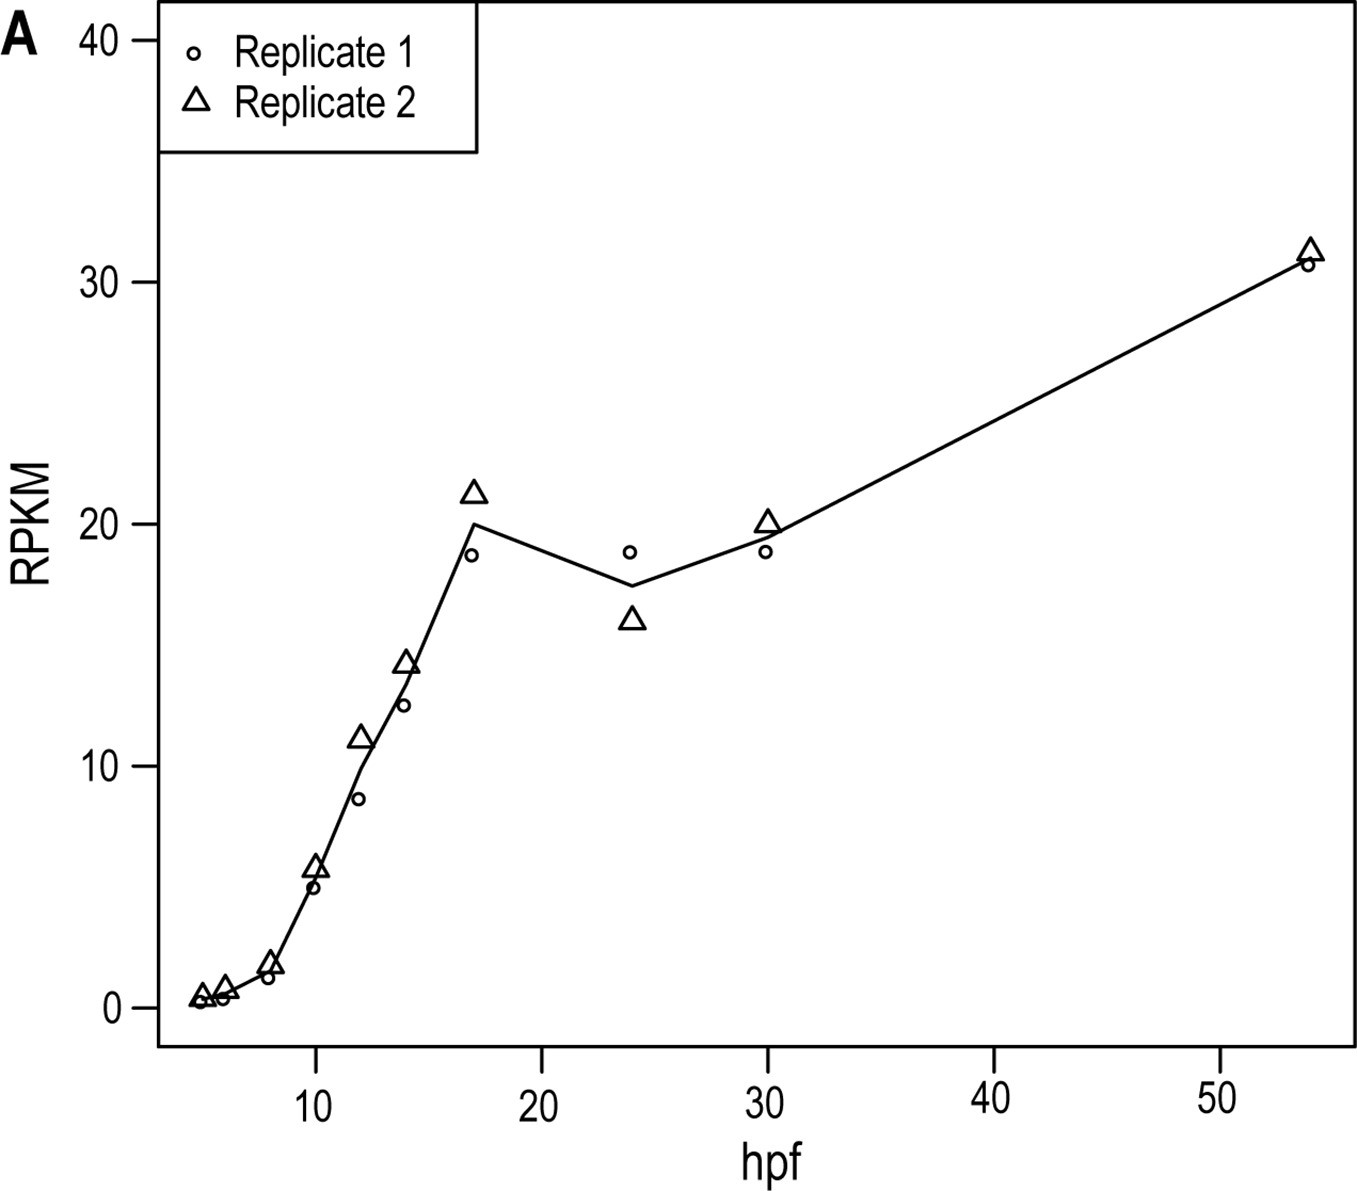
wnt11 expression starts before gastrulation and increases with proceeding development.
(A) Reads per kilo base per million mapped reads (RPKM) of wnt11 at 5 hpf (hours post fertilization, stage 9), 6 hpf (stage 10), 8 hpf (stage 11), 10 hpf (stage 12, pre-early gastrula stage), 12 hpf (stage 13), 14 hpf (stage 14), 17 hpf (stage 15, mid-gastrula stage), 24 hpf (stage 17), 30 hpf (6 ss, stage 21), and 54 hpf (24 ss, stage 27).
Figure 7—figure supplement 2
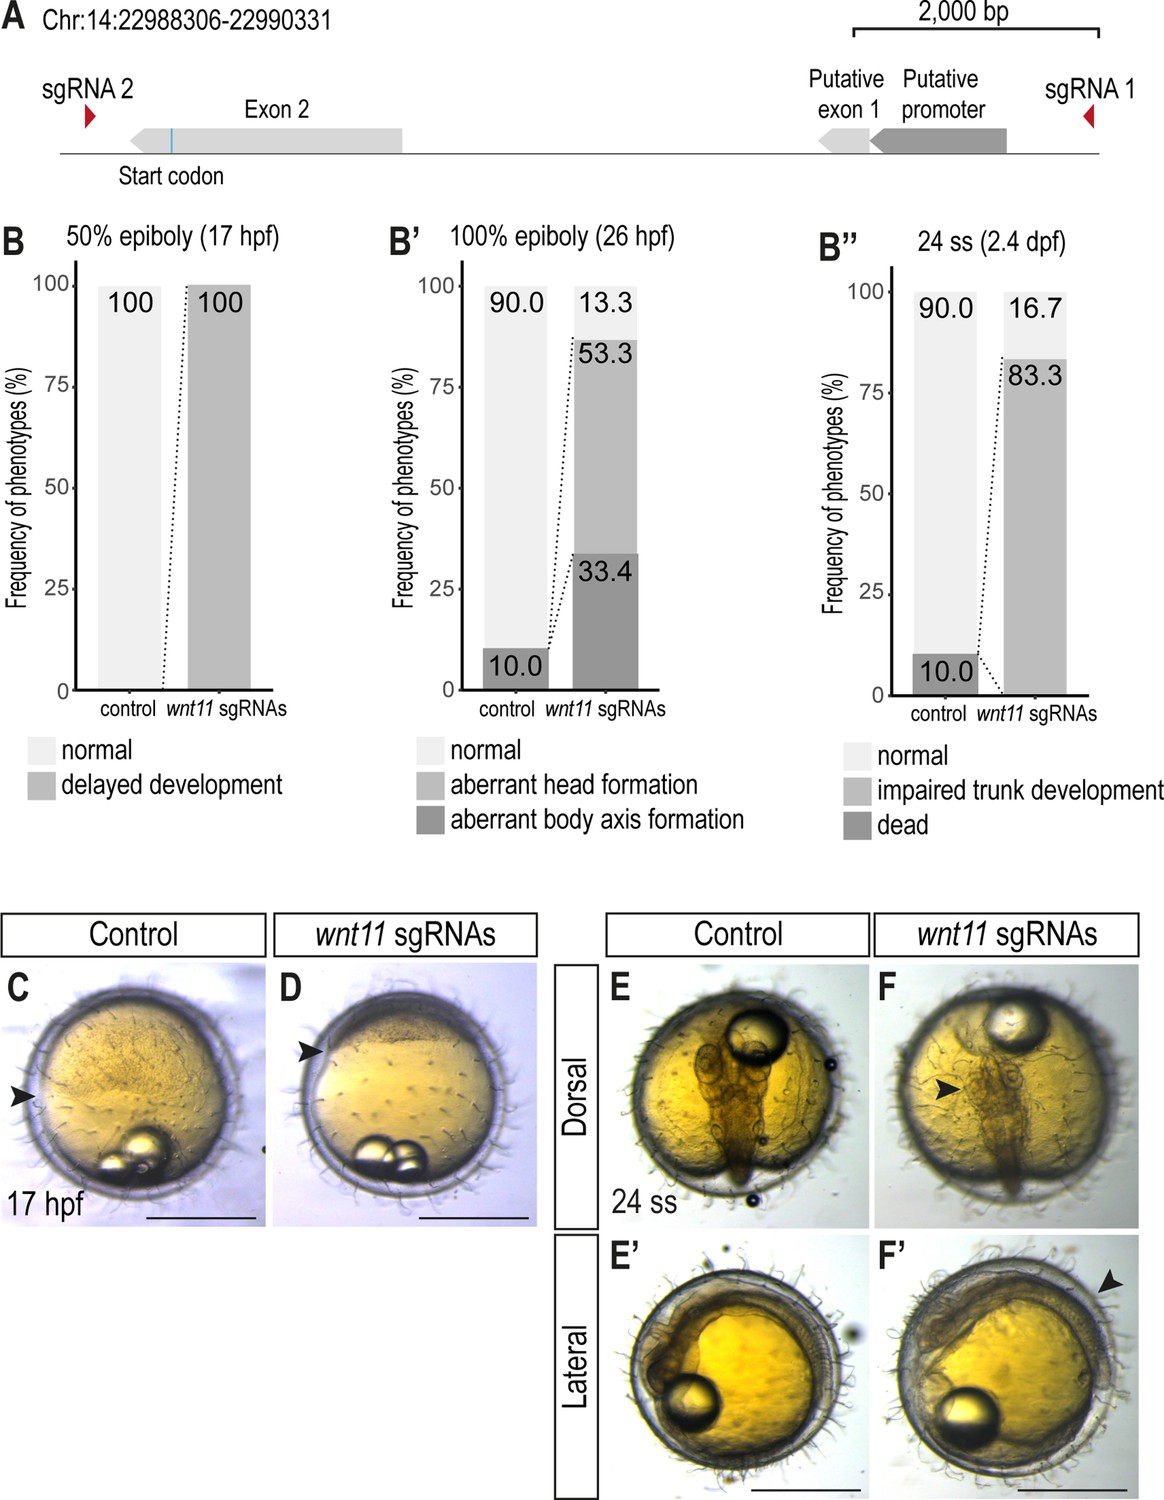
Injection of wnt11 sgRNAs results in delayed epiboly movement, and impaired body axis and trunk development.
(A) Schematic representation of the promoter region and exons of wnt11 including the position of sgRNAs. (B-B’’) Quantification of phenotypes at 17 hpf (50% epiboly) (B), 26 hpf (stage 18, 100% epiboly) (B’) and 2.4 dpf (24 ss) (B’’) (n = 20 control embryos, n = 30 wnt11 crispant embryos). (C, D) Lateral view of 17 hpf control embryo injected with Cas9-protein only (C) and wnt11 crispant embryo (D). The progression of epiboly is delayed in the wnt11 crispant (D). Arrowheads indicate progression of epiboly. (E, F) Dorsal and lateral view of control embryos (E) and wnt11 crispant embryos (D) at 24 ss. wnt11 crispants show a variety of morphological defects including shortened body axis, impaired trunk (arrowhead in F’) and head (arrowhead in E’) development. Scale bar = 400 μm.
Figure 8
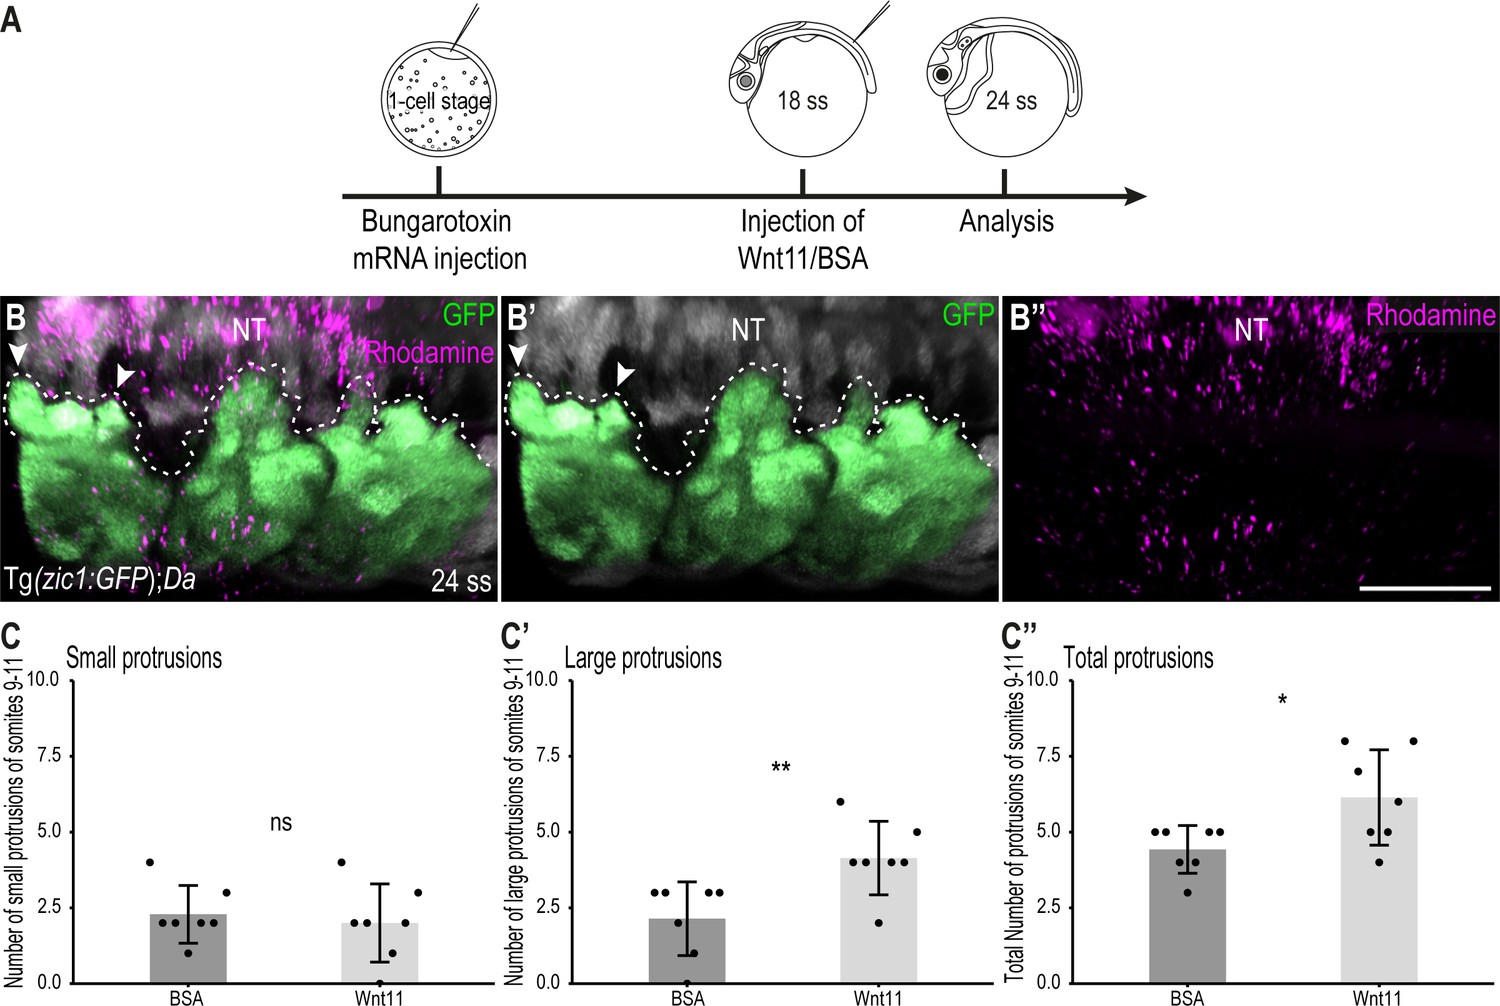
Wnt11 injections partially rescue the Tg(zic1:GFP);Da protrusion phenotype.
(A) Schematic representation of Wnt11 protein injection on top of the 10th somite of 18 ss Tg(zic1:GFP);Da embryos. (B-B’’) Dorsal view of dorsal somites of Tg(zic1:GFP);Da embryos injected with Wnt11-Dextran Rhodamine mix (magenta). GFP signals in dorsal somites are highlighted in green. Protrusions are outlined. (C-C’’) Quantification of dorsal protrusions of the 9th – 11th somite (somite at injection site plus adjacent somites) of embryos injected with BSA (n = 7 embryos) or hrWnt11(n = 7 embryos) (mean ± SD, p = 0.65 for small protrusions, p = 0.0095 for large protrusions, p = 0.03 for total protrusions). Anterior to the left. NT, neural tube. Scale bar = 50 μm. *p < 0.05, **p < 0.01, ns, not significant.
Figure 9
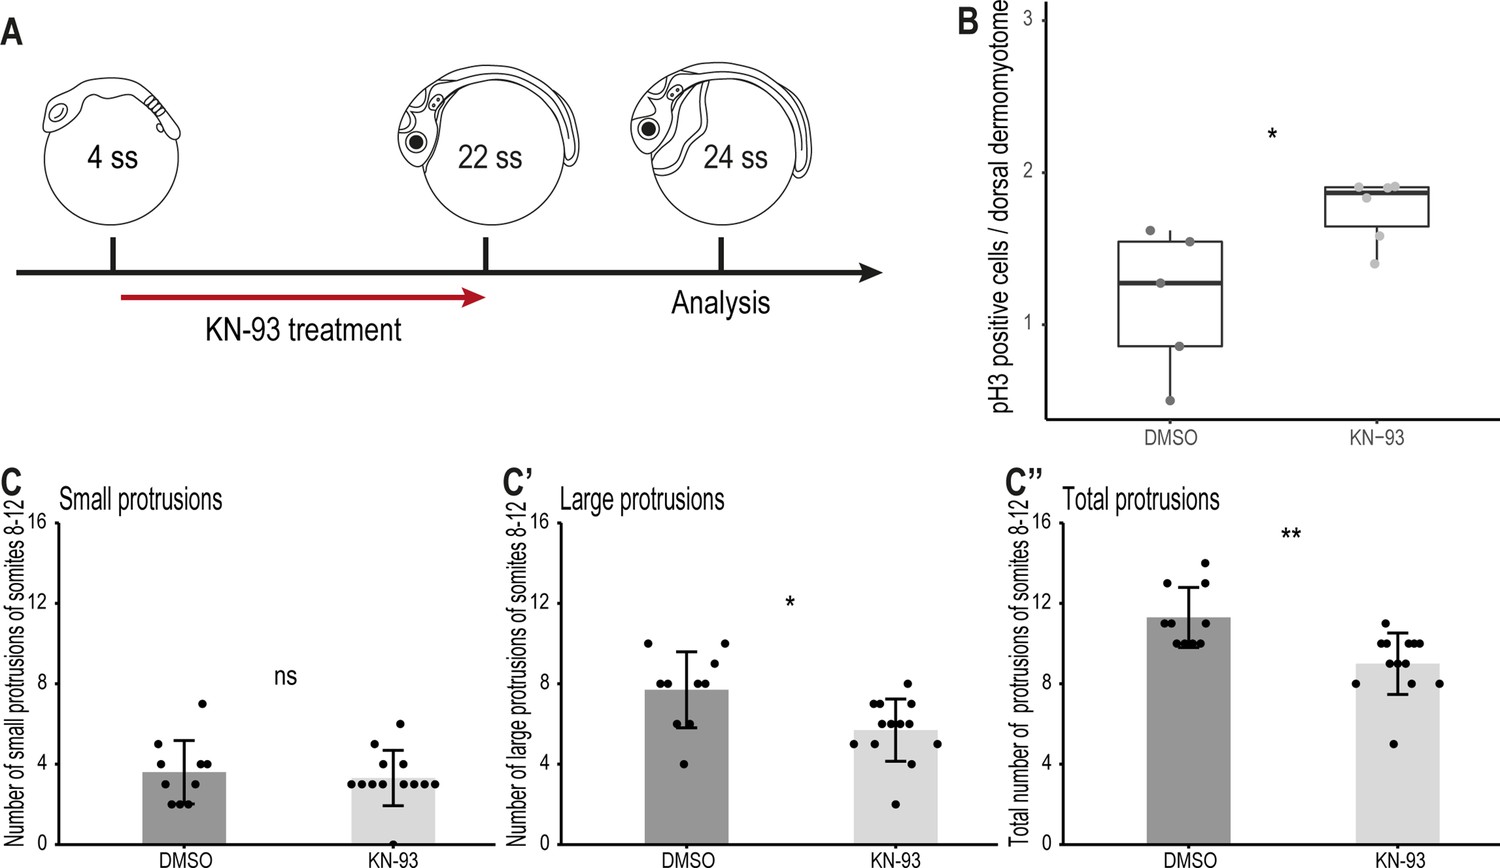
Wnt11 acts through the Wnt/Ca2+ signaling pathway during dorsal somite extension.
(A) Schematic representation of KN-93 treatment, embryos in the control group were treated with DMSO. (B) Embryos treated with KN-93 (n = 65.5 somites from 6 embryos) have significantly more pH3-positive cell in the dorsal DM compared to embryos of the control group (n = 52.5 somites from 5 embryos) (median, first and third quartiles, p = 0.045). (C-C’’) Quantification of protrusions formed by the 8th-12th somites of Tg(zic1:GFP) embryos treated with DMSO (n = 10 embryos) or KN-93 (n = 13 embryos) (mean ± SD, p = 0.65 for small protrusions, p = 0.014 for large protrusions, p = 0.0017 for total protrusions). *p < 0.05, **p < 0.01, ns, not significant.
Figure 10
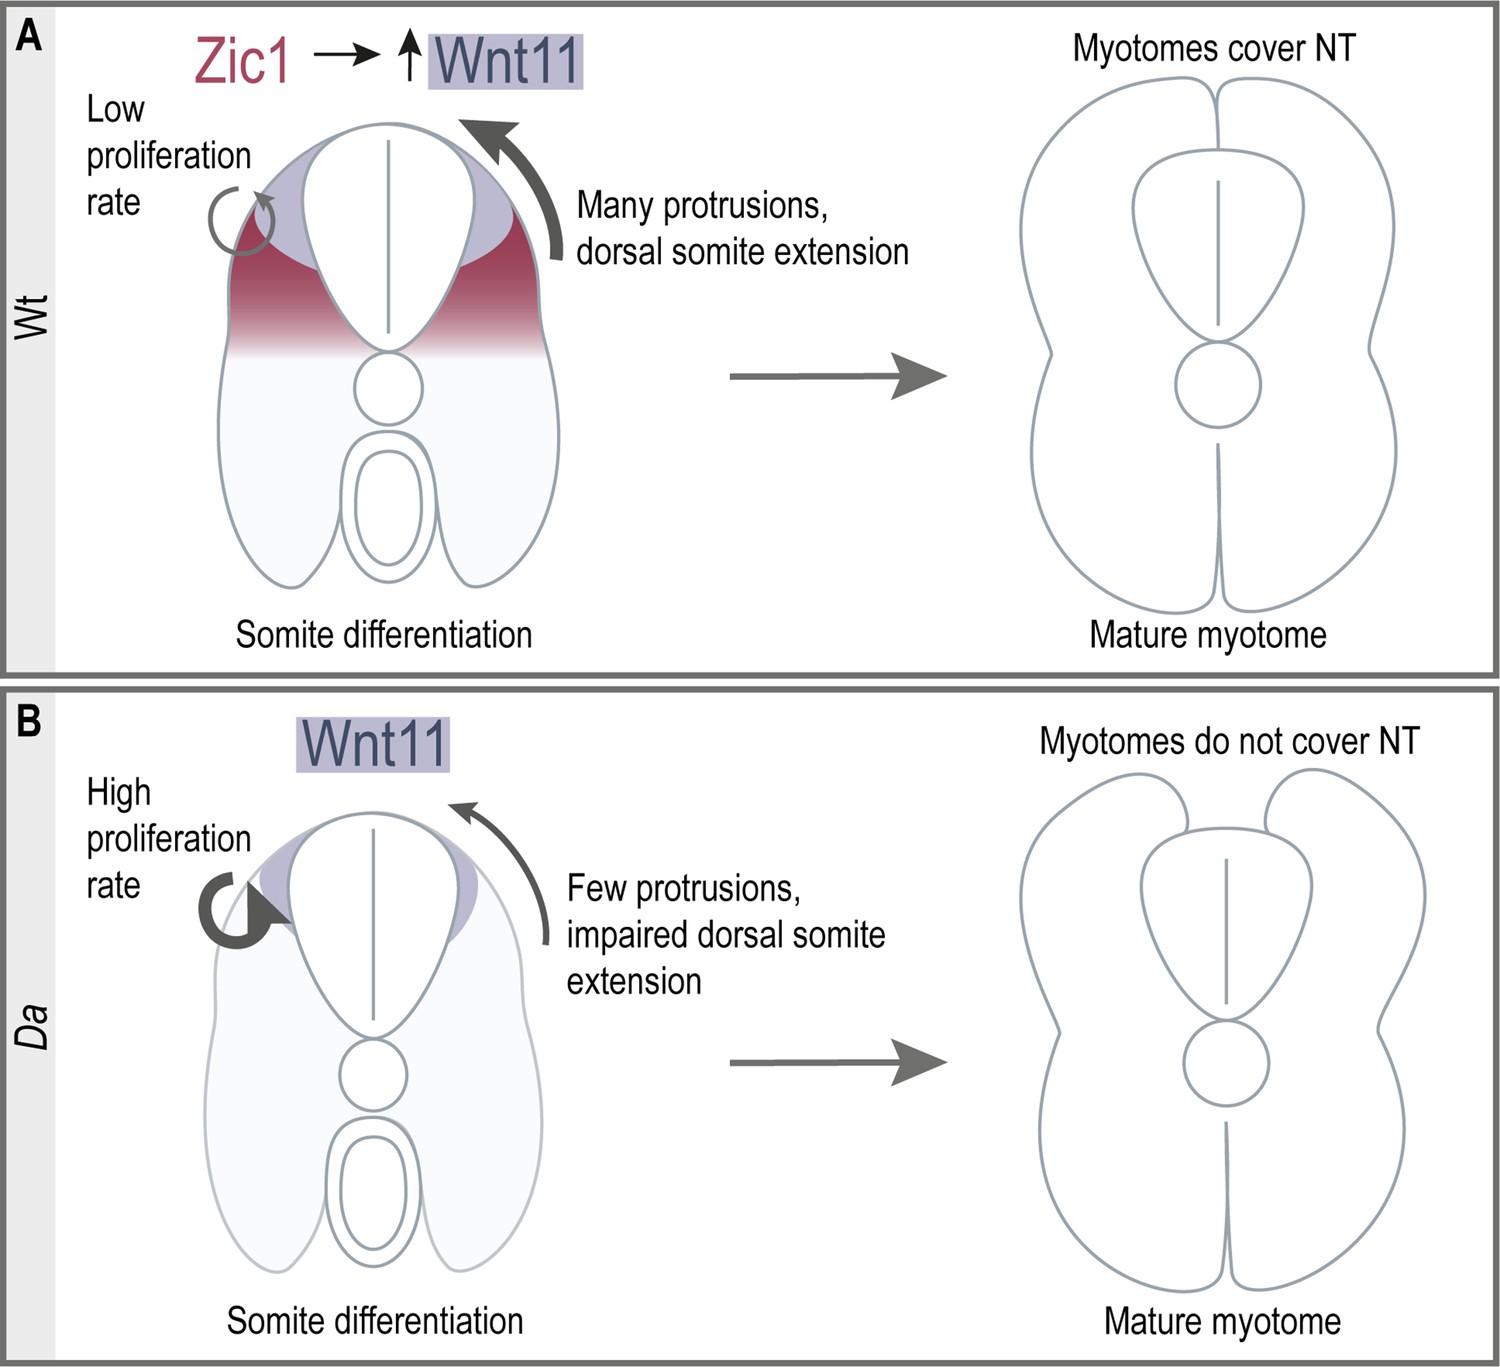
Summary of dorsal somite extension in Wt and the Da mutant.
(A) Zic1 induces or maintains the expression of wnt11 during somite differentiation. This leads to a reduced proliferative activity of the dorsal DM and increases protrusion formation of the dorsal DM cells which are non-myogenic. Ultimately, the non-myogenic DM guides the epaxial myotomes dorsally where the myotomes form a gapless muscle layer covering the neural tube at the end of embryonic development. (B) In the Da mutant wnt11 expression is reduced in the dorsal somites. The dorsal DM cells show a high proliferative activity and reduced ability to form numerous large protrusions causing insufficient dorsal somite extension. This results in the incomplete coverage of the neural tube by the epaxial myotomes at the end of embryonic development.
Videos
Video 1
Onset of dorsal somite extension in Tg(zic1:GFP).
Dorsal view of time-lapse in vivo imaging of 24 ss Tg(zic1:GFP) embryo. 15th somite is positioned in the center, z-stacks were imaged every 10 min, time is displayed in min. Anterior to the left. Scale bar = 50 μm.
Video 2
Onset of dorsal somite extension in Tg(zic1:GFP);Da.
Dorsal view of time-lapse in vivo imaging of 24 ss Tg(zic1:GFP);Da embryo. 15th somite is positioned in center, z-stacks were imaged every 10 min, time is displayed in min. Bright cell at the bottom migrating to the right is a melanophore. Anterior to the left. Scale bar = 50 μm.
Video 3
Mesenchymal DM cells during dorsal somite extension at 4.5 dpf.
Dorsal view of time-lapse in vivo imaging of 4.5 dpf Tg(zic1:GFP) embryo. 10th somite positioned in center, z-stacks were imaged every 10 min, time is displayed in min. Arrowhead indicates representative mesenchymal DM cell. Anterior to the left. Scale bar = 50 μm.
Video 4
Mesenchymal DM cells during dorsal somite extension at 5.5 dpf.
Dorsal view of time-lapse in vivo imaging of 5.5 dpf Tg(zic1:GFP) embryo. 10th somite is positioned in center, z-stacks were imaged every 10 min, time is displayed in min. Arrowhead indicates representative mesenchymal DM cell. Anterior to the left. Scale bar = 50 μm.
Video 5
Onset of dorsal somite extension in wnt11 morphant embryo.
wnt11 was knocked down using the PhotoMO approach (Figure 7A) in a Tg(zic1:GFP) embryo. Dorsal view of time-lapse in vivo imaging of 24 ss Tg(zic1:GFP) embryo. 15th somite is positioned in the center, z-stacks were imaged every 10 min, time is displayed in min. Anterior to the left. Scale bar = 50 μm.
Tables
Key resources table
| Reagent type (species) or resource | Designation | Source or reference | Identifiers | Additional information |
|---|---|---|---|---|
| Strain, strain background (Oryzias latipes) | d-rR | Yamamoto, 1975 | Medaka Southern wild type population | |
| Strain, strain background (O. latipes) | Double anal fin (Da) mutant | Ohtsuka et al., 2004 | ||
| Strain, strain background (O. latipes) | Tg(zic1:GFP,zic4:DsRed) | Kawanishi et al., 2013 | ||
| Strain, strain background (O. latipes) | Tg(zic1:zic1-Myc,zic4:DsRed);Da | this paper | BAC construct zic1:zic1-Myc/zic4:DsRed was introduced into the Da mutant | |
| Antibody | Anti-Digoxigenin-AP Fab fragments, peroxidase-conjugated (sheep polyclonal) | Roche (Germany) | 11093274910 | IHC (1:2000) |
| Antibody | Anti-GFP (rabbit polyclonal) | Clontech (Mountain View, California, USA) | 632592, RRID: 2336883 | IHC (1:500) |
| Antibody | Anti-mouse Alexa 555 (goat polyclonal) | Thermo Fisher (Waltham, Massachusetts, USA) | A-21422, RRID: AB_2535844 | IHC (1:500) |
| Antibody | Anti-Pax3/7 (DP312) (mouse monoclonal) | Davis et al., 2001 | IHC (1:100) | |
| Antibody | Anti-PCNA (rabbit polyclonal) | Abcam (Cambridge) | ab18197, RRID:AB_444313 | IHC (1:200) |
| Antibody | Anti-pH3 (Ser10) (rabbit polyclonal) | Milipore (Burlington, Massachusetts, USA) | 06–570,RRID: AB_310177 | IHC (1:200) |
| Antibody | Anti-rabbit Alexa 488 (donkey polyclonal) | Life Technologies (Carlsbad, California, USA) | A-11008, RRID: AB_143165 | IHC (1:500) |
| Recombinant DNA reagent | gRNA expression vector (DR274) | Addgene (Watertown, Massachusetts, USA) | 42,250 | T7 promoter for in vivo transcription |
| Recombinant DNA reagent | pCRIITOPO-wnt11 | Kawanishi et al., 2013 | For ISH at 12 ss | T7 promoter for RNA generation |
| Recombinant DNA reagent | pMTB-AC-TagGFP2 | this paper | T7 promoter for mRNA generation | |
| Recombinant DNA reagent | pGEM-Teasy(Wnt11_ISH) | this paper | For ISH at 22 ss | Sp6 promoter for RNA generation |
| Recombinant DNA reagent | pMTB-memCherry | Xiong et al., 2014 | T7 promoter for mRNA generation | |
| Recombinant DNA reagent | pMTB-memb-mTagBFP2 | Collins et al., 2018 | Vector with Tol2 sites | |
| Recombinant DNA reagent | pMTB-t7-alpha-bungarotoxin J4 lab stock | Addgene (Watertown, Massachusetts, USA) | 69,542 | T7 promoter for mRNA generation |
| Recombinant DNA reagent | pMTB-KikGR | This paper | Sp6 promoter for mRNA generation | |
| Recombinant DNA reagent | pSPORT6.1(zic1-ISH) | This paper | T7 promoter for RNA generation | |
| Recombinant DNA reagent | zic1:GFP/zic4:DsRed (BAC) | Kawanishi et al., 2013 | Vector with I-SceI meganuclease sites | |
| Recombinant DNA reagent | zic1:zic1-Myc/zic4:DsRed (BAC) | This paper | Vector with I-SceI meganuclease sites | |
| Sequence-based reagent | PCR forward primer to amplify sgRNA template for in vivo transcription | Lee et al., 2020 | AAAAGCACCGACTCGGTG | |
| Sequence-based reagent | PCR reverse primer to amplify sgRNA template for in vivo transcription | This paper | GGTCAGGTATGATTTAAATGGTCAGT | |
| Sequence-based reagent | PCR forward primer to generate wnt11 ISH probe for 12 ss | Kawanishi et al., 2013 | CAAATGGCTAACACTGTCTCAAAC | |
| Sequence-based reagent | PCR reverse primer to generate wnt11 ISH probe for 12 ss | Kawanishi et al., 2013 | CTATTTGCAAACGTATCTCTCCAC | |
| Sequence-based reagent | PCR forward primer to generate wnt11 ISH probe for 22 ss | This paper | CATGAAGAGCCGCTCTCACA | |
| Sequence-based reagent | PCR reverse primer to generate wnt11 ISH probe for 22 ss | This paper | TCCCTGAGGTCTTGGAGTCC | |
| Sequence-based reagent | RT-PCR forward primer for gapdh | This paper | TGGCCATCAATGACCCGTTC | |
| Sequence-based reagent | RT-PCR reverse primer for gapdh | This paper | TAGTTTGCCTCCCTCAGCCT | |
| Sequence-based reagent | RT-PCR forward primer for wnt11 | This paper | CGCTGGAACTGCTCCTCTAT | |
| Sequence-based reagent | RT-PCR reverse primer for wnt11 | This paper | GCAGCGGACAAGGCATAAAC | |
| Sequence-based reagent | RT-PCR forward primer for zic1 | Nakamura et al., 2014 | AGCCCTTTCCGTGTCCGTTCC | |
| Sequence-based reagent | RT-PCR reverse primer for zic1 | Nakamura et al., 2014 | CCGACGTGTGGACGTGCATGT | |
| Sequence-based reagent | Standard control | Gene Tools (Philomath, Oregon, US) | Morpholino | CCTCTTACCTCAGTTACAATTTATA |
| Sequence-based reagent | wnt11 MO | This paper | Morpholino | CTTCATGATGGATGGAGGCTCCGGT |
| Sequence-based reagent | wnt11 PhotoMO | This paper | Morpholino | CGGAGCCTPCATCCATCATG |
| Sequence-based reagent | Oligo annealing wnt11_1 sgRNA template, forward | This paper | TAGGTTCTGTCGGGAGACTTTA | |
| Sequence-based reagent | Oligo annealing wnt11_1 sgRNA template, reverse | This paper | AAACTAAAGTCTCCCGACAGAA | |
| Sequence-based reagent | Oligo annealing wnt11_2 sgRNA template, forward | This paper | TAGGCTGGATGTTTAACGGAG | |
| Sequence-based reagent | Oligo annealing wnt11_2 sgRNA template, reverse | This paper | AAACCTCCGTTAAACATCCAG | |
| Peptide, recombinant protein | BsaI-HF | New England Biolabs (Ipswich, USA) | R3733 | |
| Peptide, recombinant protein | EnGen Spy Cas9 NLS | New England Biolabs (Ipswich, USA) | M0646T | |
| Peptide, recombinant protein | Pancreatin | Wako (Japan) | 163–00142 | |
| Peptide, recombinant protein | Recombinant Human Wnt11 protein (hrWnt11) | R&D systems (Minneapolis, Minnesota, USA) | 6179-WN-010/CF | |
| Peptide, recombinant protein | Trypsin | Nacalai Tesque (Japan) | 35555–54 | |
| Chemical compound, drug | 4-nitro blue tetrazolium chloride (NBT) | Roche (Germany) | 11585029001 | |
| Chemical compound, drug | 5-bromo-4-chloro-3-indolyl phosphate (BCIP) | Roche (Germany) | 11383221001 | |
| Chemical compound, drug | Isogen | Nippon Gene (Japan) | 315–02504 | |
| Chemical compound, drug | KN-93 | Wako (Japan) | 114–00731 | |
| Chemical compound, drug | ML141 | Sigma-Aldrich (St. Louis, Missouri, USA) | SML0407 | |
| Chemical compound, drug | DAPI | Sigma-Aldrich (St. Louis, Missouri, USA) | D9542 | |
| Chemical compound, drug | Mayer’s Hematoxylin Solution | Wako (Japan) | 131–09665 | |
| Chemical compound, drug | Propidium iodine | Life Technologies (Carlsbad, California, USA) | P3566 | |
| Chemical compound, drug | Rhodamine Phalloidin | Life Technologies (Carlsbad, California, USA) | R415 | |
| Commercial assay or kit | HiScribe T7 Quick High Yield RNA Synthesis Kit | New England Biolabs (Ipswich, USA) | E2050S | |
| Commercial assay or kit | KAPA HiFi HotStart ReadyMix | KAPA Biosystems (Wilmington, Massachusetts, USA) | KK2601 | |
| Commercial assay or kit | KAPA Stranded mRNA-seq Kit | KAPA Biosystems (Wilmington, Massachusetts, USA) | KK8420 | |
| Commercial assay or kit | MinElute Kit | Qiagen (Germany) | 28,004 | |
| Commercial assay or kit | Nextera Index Kit | Illumina (San Diego, California, USA) | FC-121–1011 | |
| Commercial assay or kit | Nextera Sample Preparation Kit | Illumina (San Diego, California, USA) | FC-121–1030 | |
| Commercial assay or kit | RNeasy Mini Kit | Qiagen (Germany) | 74,104 | |
| Commercial assay or kit | Super Script III Kit | Invitrogen (Waltham, Massachusetts, USA) | 18080051 | |
| Commercial assay or kit | THUNDERBIRD SYBR qPCR Mix | Toyobo (Japan) | QPS-201 | |
| Software, algorithm | Adobe Illustrator | Adobe (Mountain View, California, USA) | Version 25.2.2 | |
| Software, algorithm | Burrows-Wheeler Aligner (BWA) mapping software | Li and Durbin, 2009 | ||
| Software, algorithm | FluoRender | Wan et al., 2009 | Version 2.19 | |
| Software, algorithm | HOMER | Heinz et al., 2010 | ||
| Software, algorithm | Imagej/ Fiji | Schindelin et al., 2012 | ||
| Software, algorithm | MACS2 | Zhang et al., 2008 | Version 2.1.1.20160309 | |
| Software, algorithm | STAR | Dobin et al., 2013 | ||
| Software, algorithm | Trimmomatic | Bolger et al., 2014 | Version 0.32 |
Additional files
-
Supplementary file 1
Gene expression profiles and distances to nearest Zic1 ChIP peak.
- https://cdn.elifesciences.org/articles/71845/elife-71845-supp1-v1.csv
-
Supplementary file 2
Full list of GO terms enriched in dorsal-high Zic1 target genes.
- https://cdn.elifesciences.org/articles/71845/elife-71845-supp2-v1.xlsx
-
Supplementary file 3
Full list of GO terms enriched in dorsal-low Zic1 target genes.
- https://cdn.elifesciences.org/articles/71845/elife-71845-supp3-v1.xlsx
-
Transparent reporting form
- https://cdn.elifesciences.org/articles/71845/elife-71845-transrepform1-v1.pdf
Download links
A two-part list of links to download the article, or parts of the article, in various formats.
Downloads (link to download the article as PDF)
Open citations (links to open the citations from this article in various online reference manager services)
Cite this article (links to download the citations from this article in formats compatible with various reference manager tools)
Wnt11 acts on dermomyotome cells to guide epaxial myotome morphogenesis
eLife 11:e71845.
https://doi.org/10.7554/eLife.71845


