Aberrant causal inference and presence of a compensatory mechanism in autism spectrum disorder
- Center for Neural Science, New York University, United States
- Brain and Cognitive Sciences, University of Rochester, United States
- Department of Neuroscience, Baylor College of Medicine, United States
Figures
Figure 1
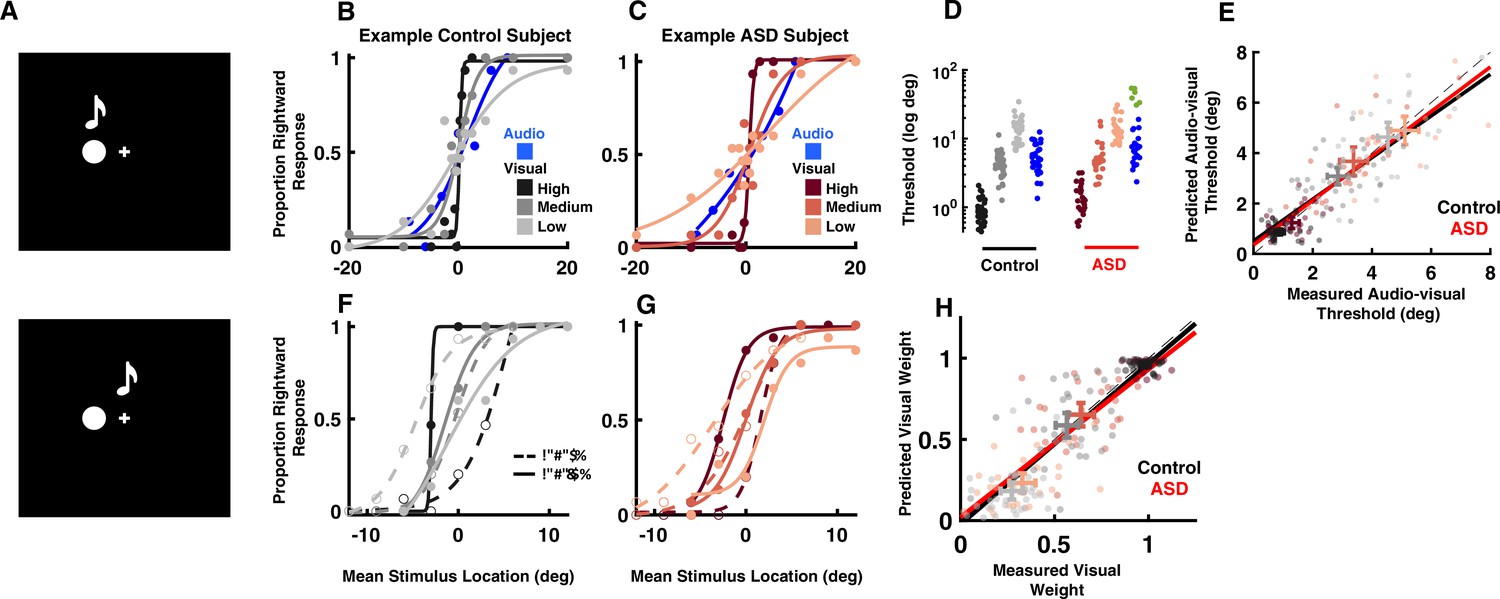
Audio-visual optimal cue combination in autism spectrum disorder (ASD).
(A) Participants (neurotypical control or individual with ASD) viewed a visual disk and heard an auditory tone at different locations and with different small disparities (top = no disparity, bottom = small disparity). They had to indicate the location of the audio-visual event. (B) Rightward (from straight ahead) responses (y-axis) as a function of stimulus location (x-axis, positive = rightward) for an example, control subject. Color gradient (from darkest to lightest) indicates the reliability of the visual cue. (C) As (B), but for an example, ASD subject. (D) Discrimination thresholds in localizing audio (blue) or visual stimuli with different reliabilities (color gradient) for control (black) and ASD (red) subjects. Every point is an individual subject. A subset of six ASD subjects had very poor goodness of fit to a cumulative Gaussian (green) and were excluded from subsequent analyses. (E) Measured (x-axis) vs. predicted (y-axis) audio-visual discrimination threshold, as predicted by optimal cue integration. Black and red lines are the fit to all participants and reliabilities, respectively, for the control and ASD subjects. Two-dimensional error bars are the mean and 95% CI for each participant group and reliability condition. (F) Rightward response of an example control subject as a function of mean stimulus location (x-axis, auditory at +3 and visual –3 would result in mean stimulus location = 0) and disparity, the visual stimuli being either to the right (solid curve) or left (dashed) of the auditory stimuli. Color gradient shows the same gradient in reliability of the visual cue as in (B). (G) As (F), but for an example, ASD subject. (H) Measured (x-axis) vs. predicted (y-axis) visual weights, according to Equation 2 (Methods). Convention follows that established in (E). Both control (black) and ASD (red) subjects dynamically adjust the weight attributed to each sensory modality according to their relative reliability.
Figure 2 with 2 supplements

Audio-visual causal inference.
Participants (black = control; ASD = red) localized auditory tones relative to straight ahead, in the presence of visual cues at different disparities of up to 24°. See Supplementary file 1, Supplementary file 2 for overlap of subjects with Figure 1. (A) Auditory bias (y-axis, central point of the cumulative Gaussian, e.g. Figure 1B) as a function of spatial disparity (x-axis, relative location of the visual cue) and reliability of the visual cue (darker = more reliable) in control subjects. (B) As (A), but for individuals with ASD. (C) Coefficient of the linear fits (y-axis, larger value indicates quicker increase in bias with relative visual location) in control (black) and ASD (red), as a function of visual cue reliability (darker = more reliable). (D) Linear R2 (x-axis) demonstrates that the linear fits account well for observed ASD data. On the other hand, adding a cubic term (y-axis, partial R2) improved fit to control data (at two reliabilities) but not ASD data. Error bars are ±1 S.E.M.
Figure 2—figure supplement 1
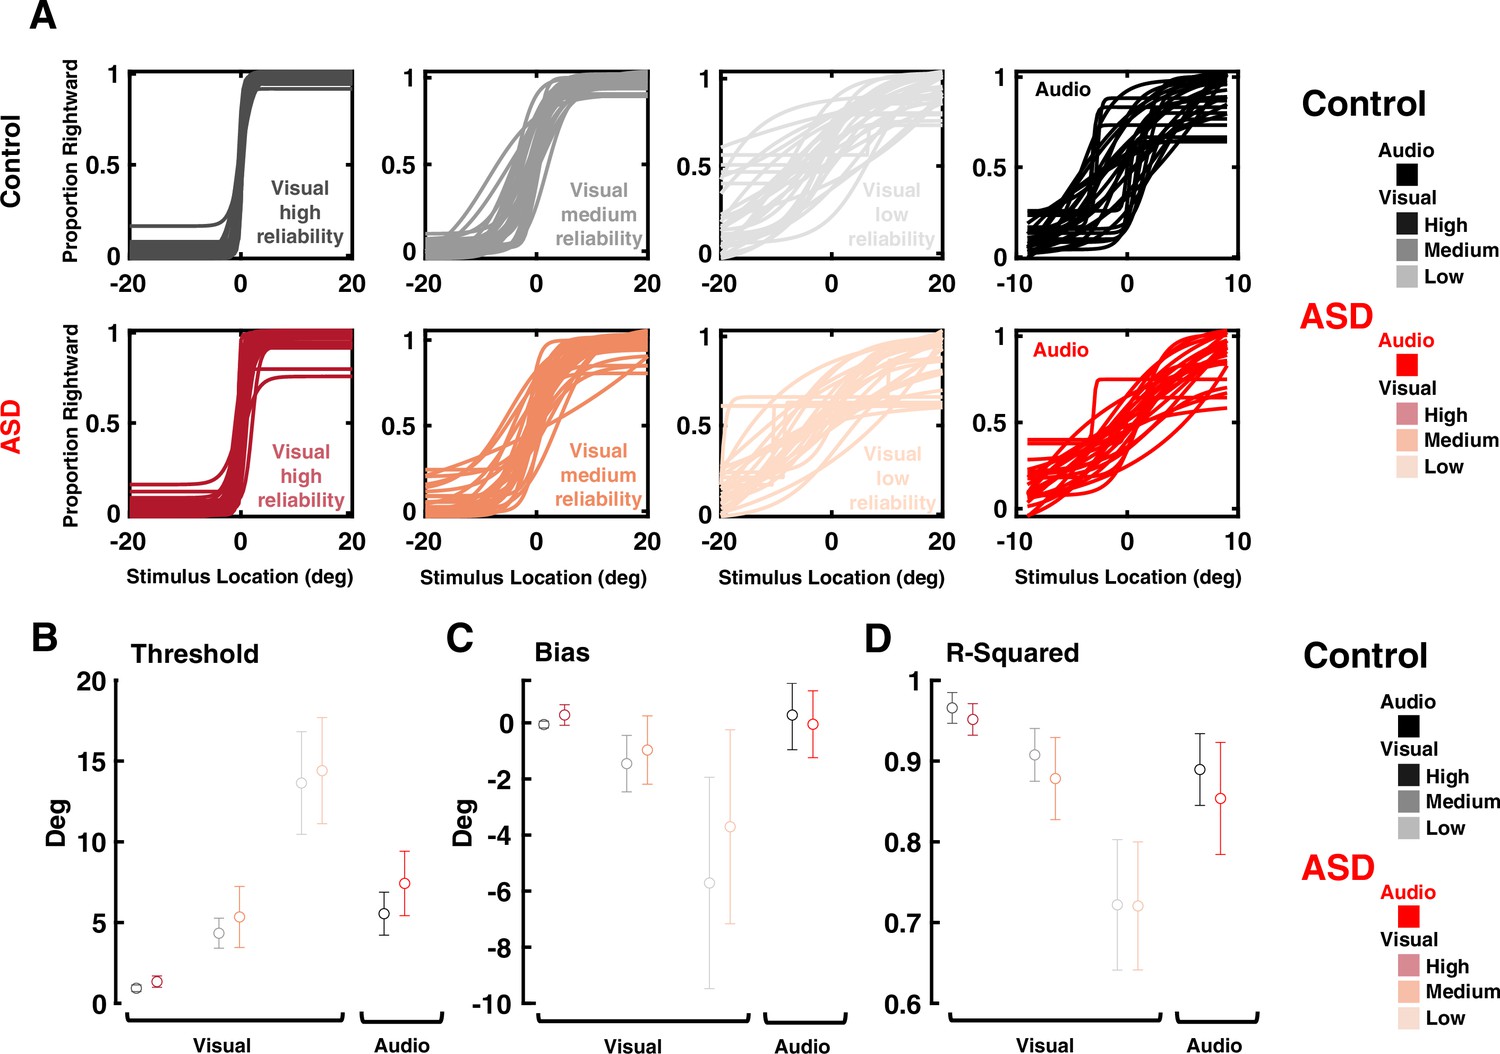
Visual and auditory localization performance of participants in Experiment 2 (audio-visual implicit causal inference).
(A) Proportion of ‘rightward’ report as a function of stimulus location (in deg, x-axis, positive values indicate the right hemifield). Top row: all control subjects. From left to right: visual discrimination at high, medium, and low reliability, and finally auditory discrimination. Bottom row: as top row, for all autism spectrum disorder (ASD) subjects. (B) Discrimination thresholds for ASD and controls subjects, for low, medium, and high reliability visual stimuli, as well as auditory cues. Dots and error bars are the mean and S.E.M for each group and condition. (C) and (D) are, respectively, the bias and R-squared. Format follows that of (B). Results indicate that psychometric thresholds (all p>0.09), bias (all p>0.11), and goodness of fit (all p>0.26) are not different across the ASD and control cohorts, across visual and auditory modalities, and across all reliabilities.
Figure 2—figure supplement 2
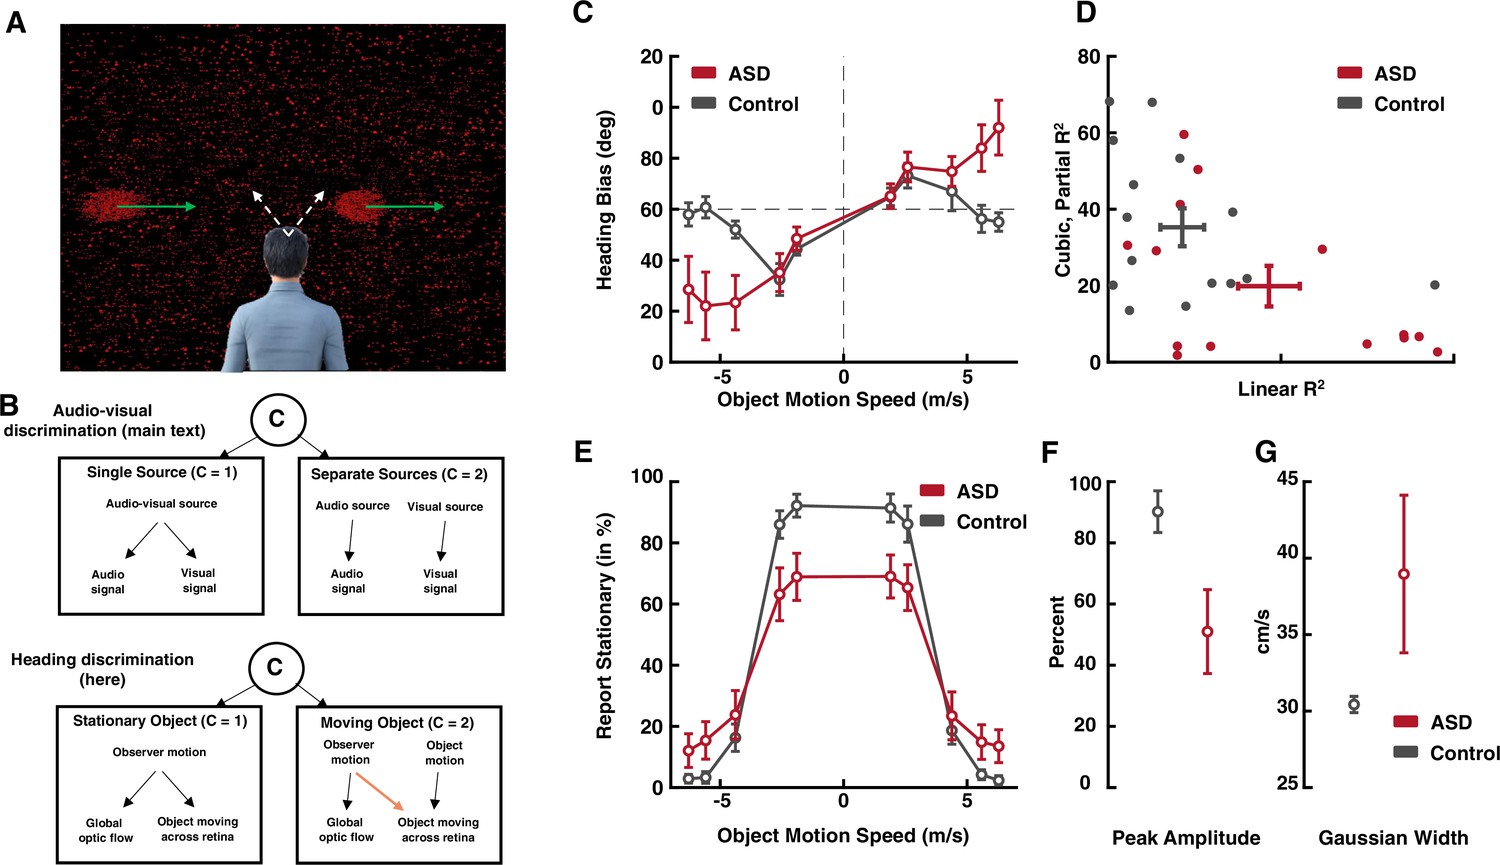
Heading discrimination during concurrent implied self-motion and object motion.
We very briefly present these results, as a conceptual replication and extension of the main audio-visual results, in order to highlight the statistical reliability and generalizability of the main result – an internal model most readily specifying integration in autism spectrum disorder (ASD). (A) Subjects are presented with a wide field of dots (background) that move as to imply self-motion, leftward or rightward, at different angles (white arrows). Simultaneously, an object (red clouds of dots) may move independently, at different speeds. Observers are asked to report on their own self-motion by button press (either leftward or rightward from straight-ahead), as well as to indicate if the object moved or not. (B) This task requires causal inference in attributing motion across our retinas to self-motion or object-motion, yet the generative model is distinct (c.f. orange arrow) from that reported in the main text (audio-visual). (C) Heading bias as a function of object motion speed. As predicted by causal inference, the control group (black), shows a bias peaking at intermediary cue disparities, which then dissipates as the observer infers two separate causes (see Dokka et al., 2019). Instead, the ASD group (dark red) shows a monotonically increasing bias, as if always integrating cues. (D) Linear fits account better for ASD than control data (x-axis), while adding a cubic component to the regression aids in explaining control but not ASD data. (E) Reports of the object being stationary, as a function of its speed in the world. As expected, reports of stationarity occur more often when the object moves at a slow speed. The peak report of stationarity in ASD is lower than that of control subjects (F), and the velocity range over which reports of stationarity are likely, is larger in ASD than control individuals (G). Dots are means, and error bars are ±1 S.E.M.
Figure 3 with 3 supplements
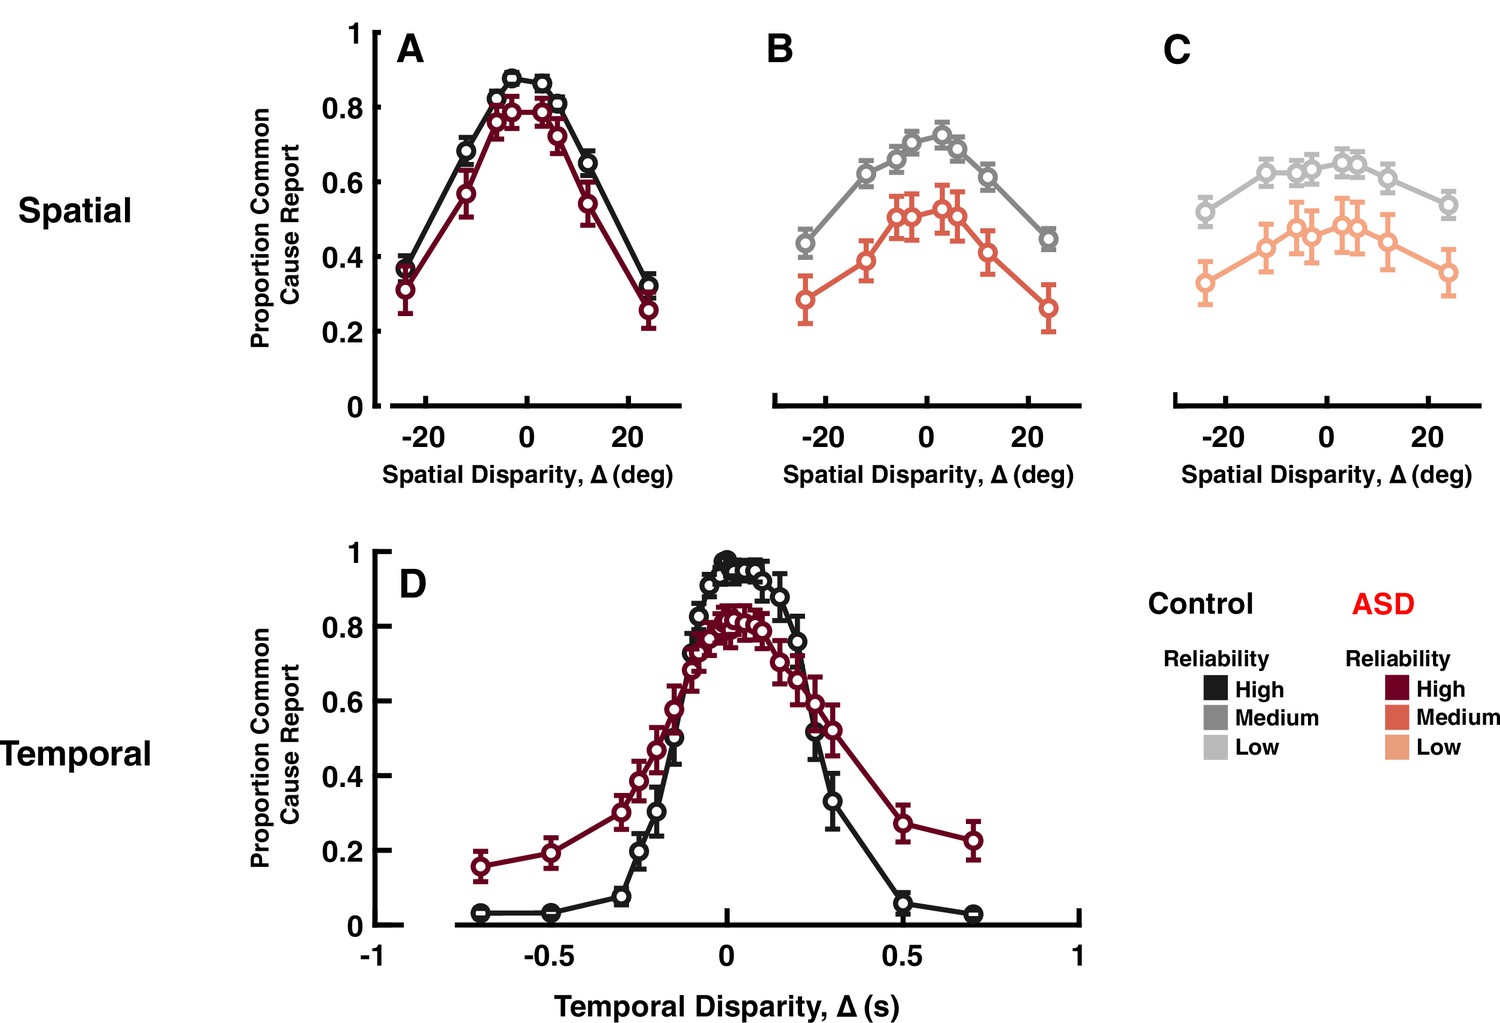
Explicit common cause reports across spatial (top) and temporal (bottom) disparities.
Proportion of common cause reports (y-axis) as a function of spatial disparity (x-axis) and visual cue reliability; high (A), medium (B), or low (C). The most striking characteristic is the reduced likelihood to report common cause, across any disparity or cue reliability. (D) Proportion of common cause reports (y-axis) as a function of temporal disparity. As indexed by many (e.g. Feldman et al., 2018) individuals with autism spectrum disorder (ASD) show larger ‘temporal binding windows’; temporal extent over which they are likely to report common cause. However, these individuals are also less likely to report common cause, when auditory and visual stimuli are in very close temporal proximity (an effect sometimes reported, e.g., Noel et al., 2018b, but many times neglected, given normalization from 0 to 1, to index binding windows; see e.g., Woynaroski et al., 2013; Dunham et al., 2020). See Supplementary file 1, Supplementary file 2 for overlap of subjects with previous figures. Error bars are ±1 S.E.M.
Figure 3—figure supplement 1
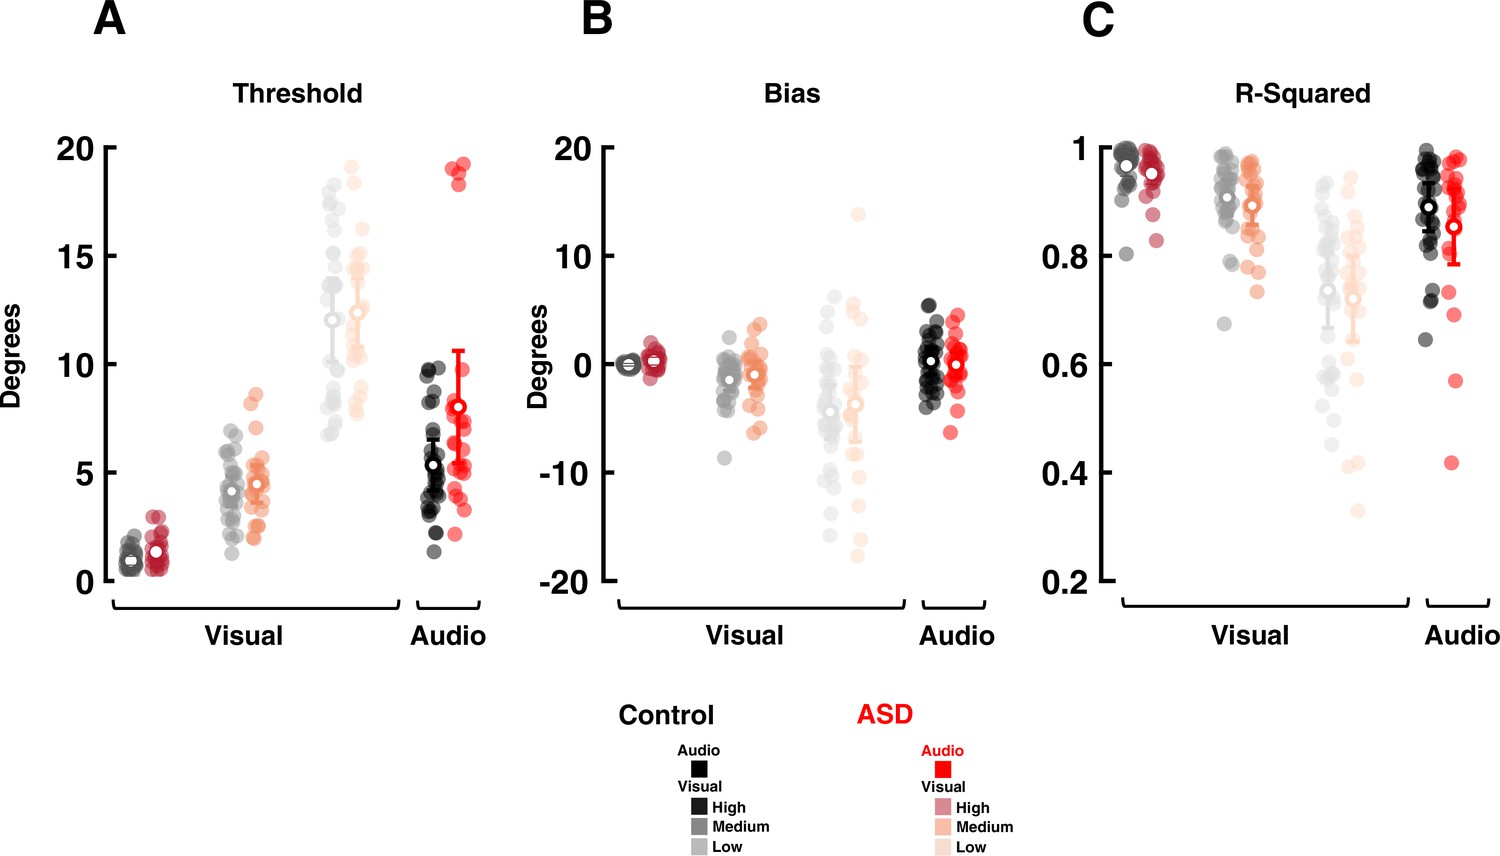
Visual and auditory localization performance of participants in Experiment 3 (audio-visual explicit causal inference).
A) Discrimination thresholds for autism spectrum disorder (ASD) and controls subjects, for low, medium, and high reliability visual stimuli, as well as auditory cues. Transparent dots are individual subjects, while opaque white circles and error bars are mean and S.E.M. (B) and (C) follow the formatting of (A), but respectively, show the bias and R-squared. Four ASD subjects had poor auditory localization performance (as seen in the threshold and R-squared subplots) yet even including these subjects did not differentiate between ASD and control cohorts in threshold, bias, or R-squared.
Figure 3—figure supplement 2
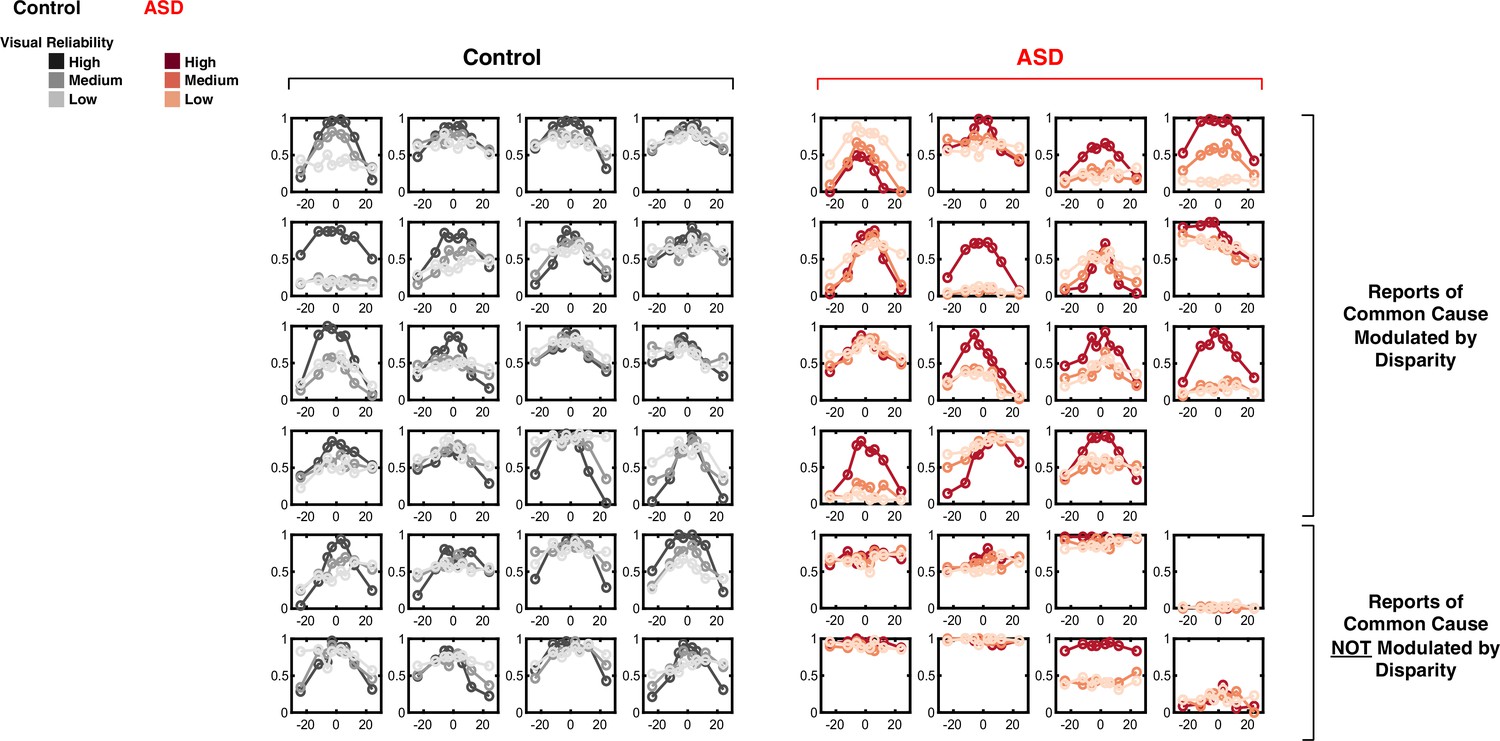
Reports of common cause as a function of spatial disparity.
All individual data is presented. Report of ‘common cause’ (y-axis) as a function of spatial disparity (x-axis) and visual reliability (color gradient). Data of all control subjects (first to fourth column) are modulated by disparity. 15/23 Autism spectrum disorder (ASD) subjects (top four rows of columns five to eight) showed a modulation in explicit reports of common cause by disparity. However, 8 (bottom two rows) did not.
Figure 3—figure supplement 3
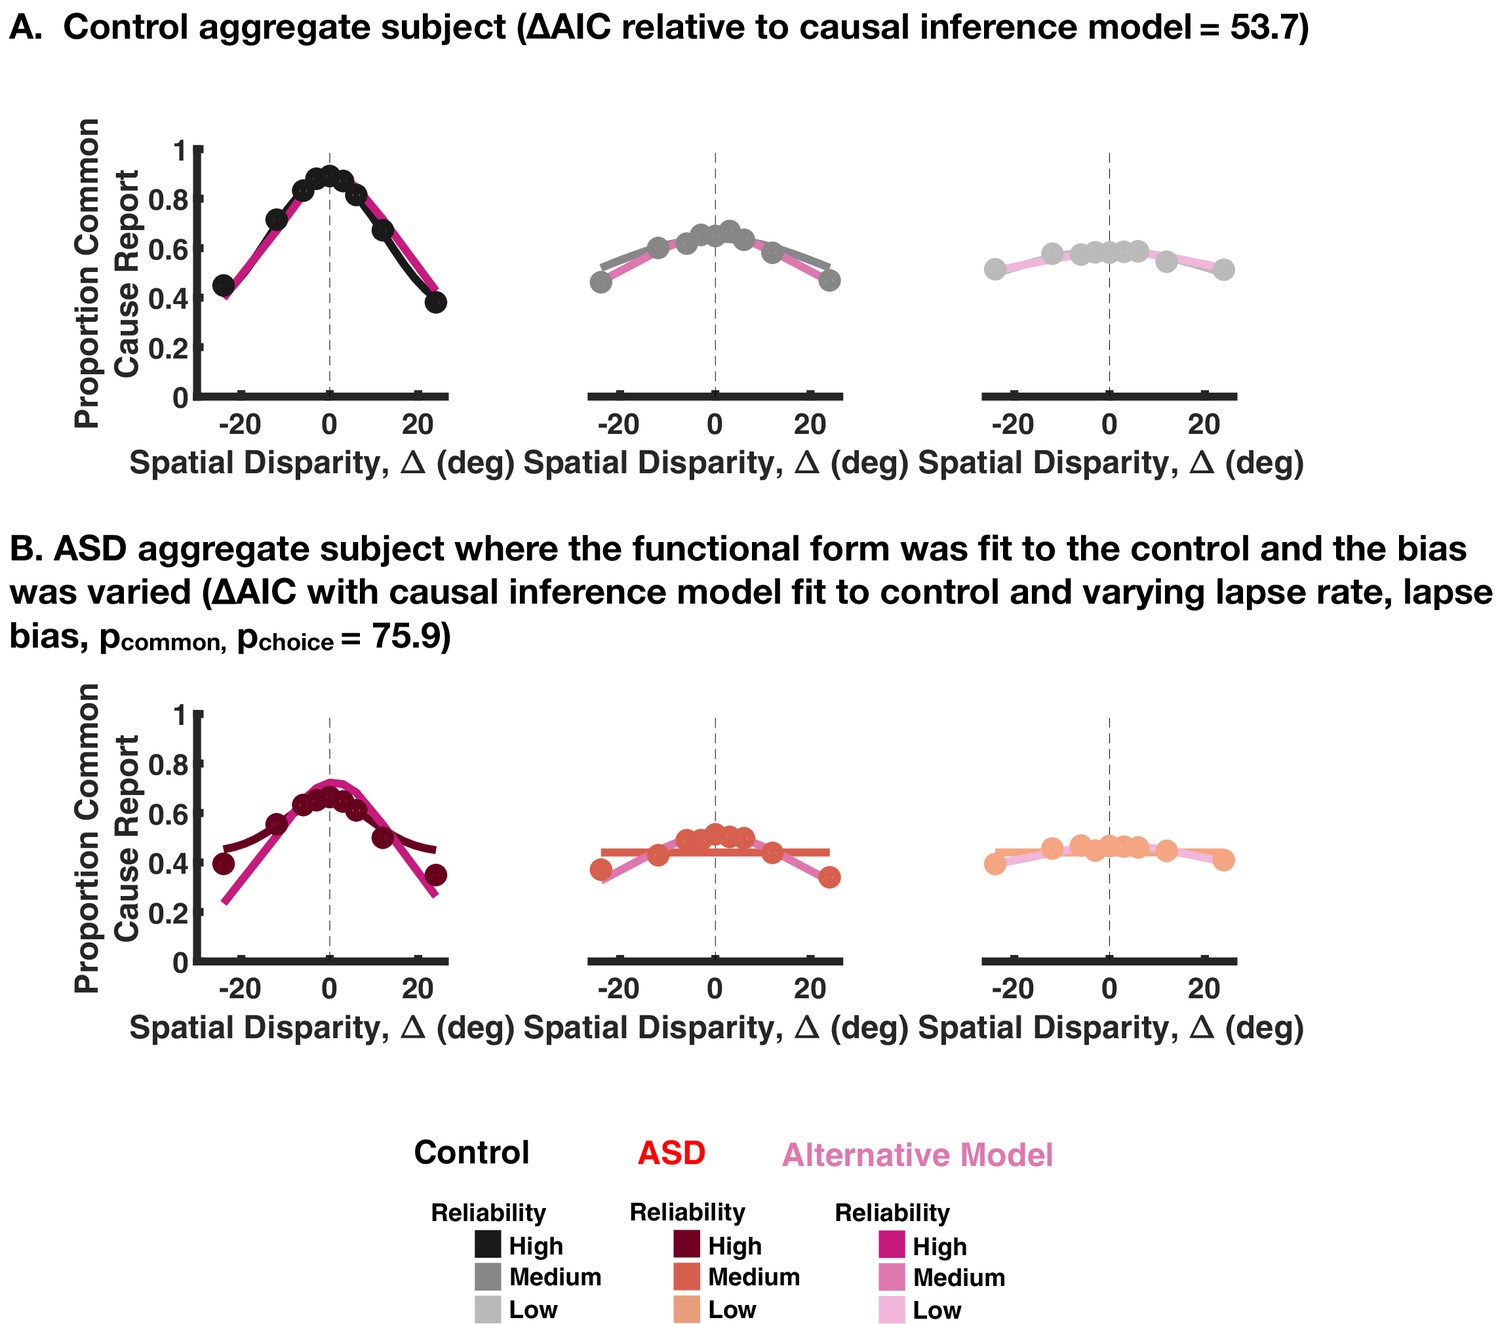
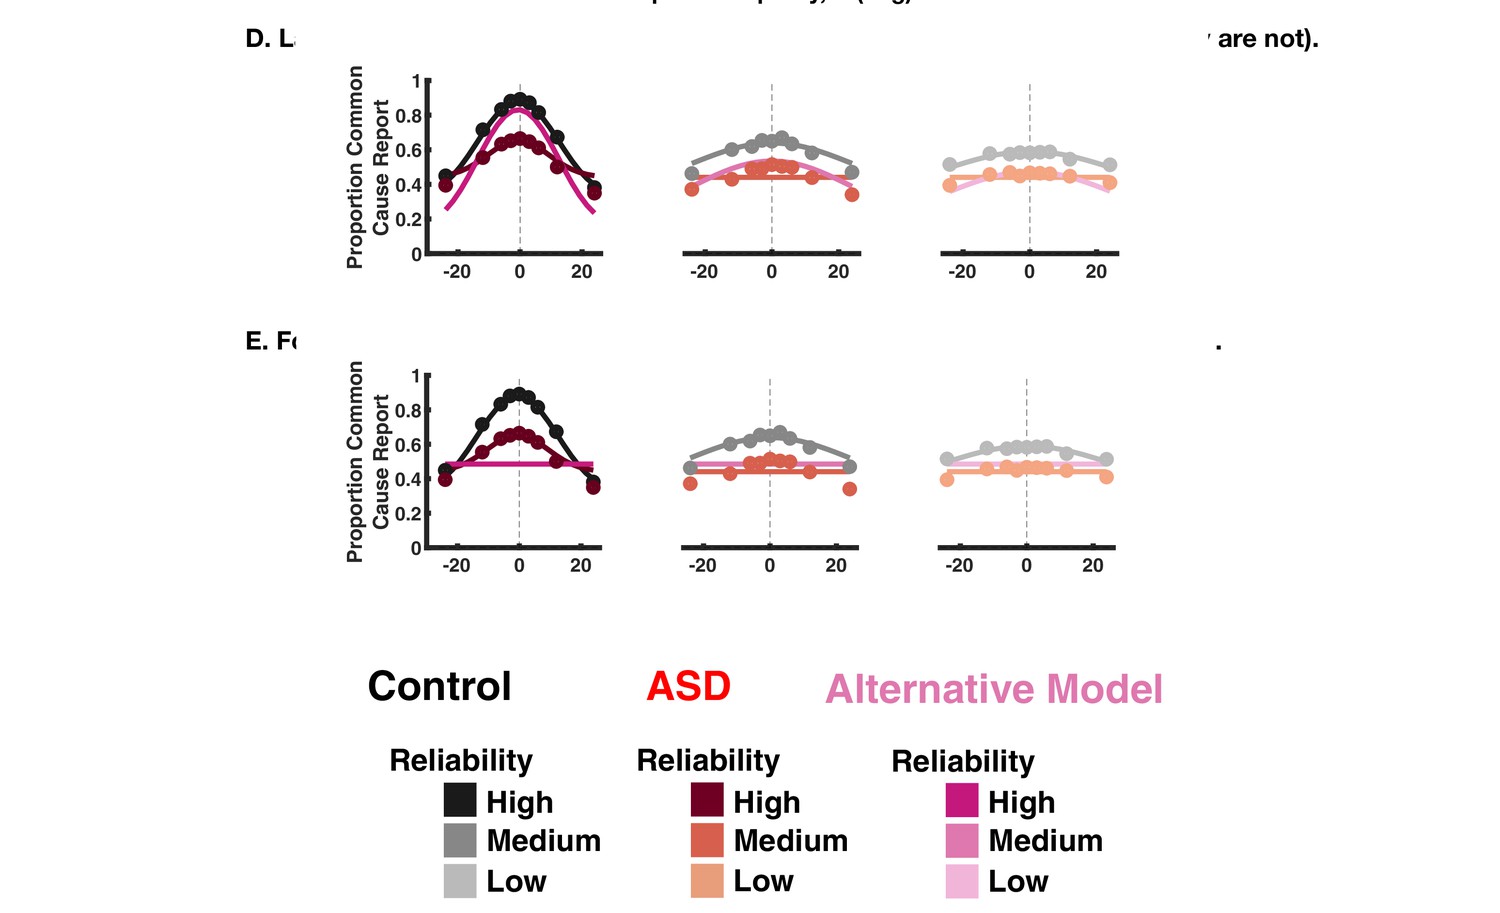
Fitting a functional form to the explicit causal inference reports.
(A) We fit a functional model of the form a*N(X;mu,sd^2)+b where X is the spatial disparity. The model was fit for each reliability therefore with 12 parameters in total. The model predictions are shown in shades of magenta with the causal inference model predictions in gray. The causal inference model performs better than the functional form as quantified by Akaike Information Criterion (AIC) as indicated in the title. (B) The functional form in (A) was fit to control subjects and then the bias (parameter ‘b’ in the equation) was varied to best explain the autism spectrum disorder (ASD) subject responses. This model was outperformed (quantified by AIC) by the causal inference model, which was also fit to the control subjects with choice and inference parameters varied.
Figure 4 with 13 supplements
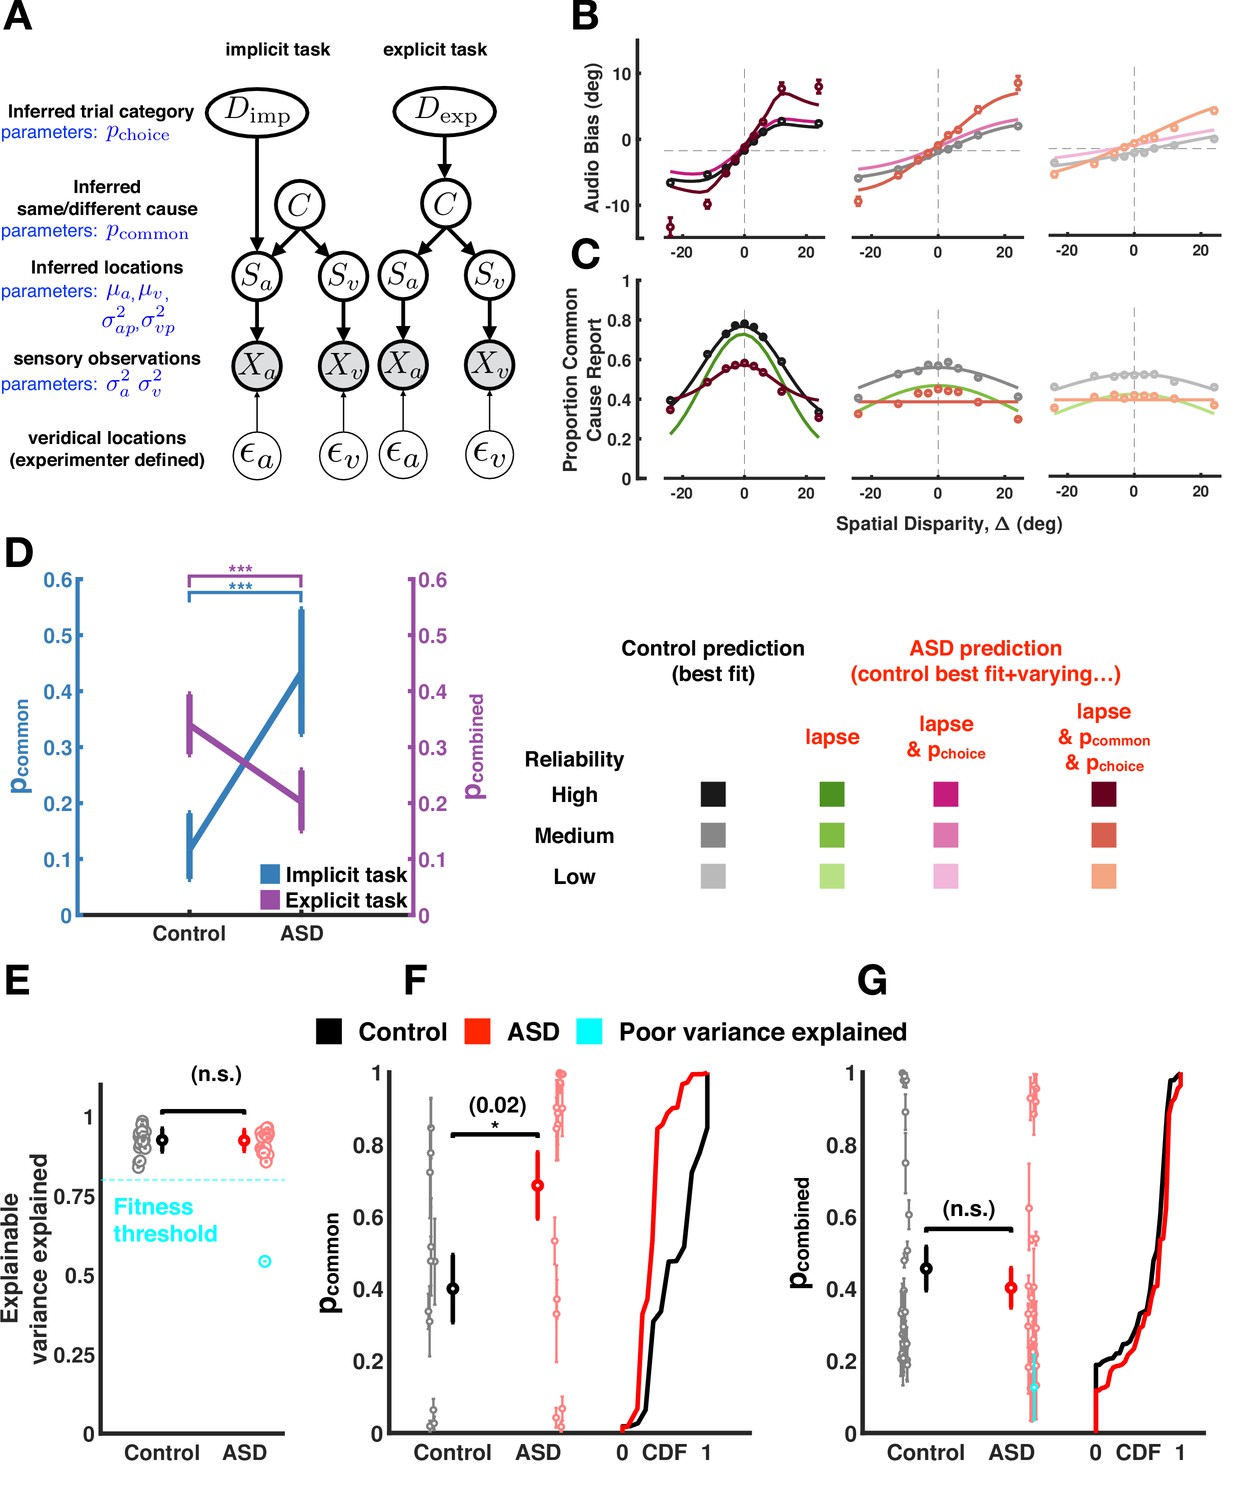
Causal inference modeling of implicit and explicit spatial tasks.
(A) Generative models of the causal inference process in the two tasks (implicit task in left and explicit task in right). The subject makes noisy sensory measurements (X) of the veridical cue locations ( and combines them with their prior belief to obtain their percept (S). To do so optimally, the subject first must infer whether signals came from the same cause (C) and thereby determine if it is useful to combine the information from the two cues for inferring the trial category (D). The causal inference process is shared between the two tasks but the subject infers Dimp (side of the tone) in the implicit task and Dexp (number of causes for the sensory observations) in the explicit task. (B) Aggregate data (dots) and model fits (lines) in the implicit task (the visual reliability varies from high to low from left to right). The causal inference model is fit to the control aggregate subject and different set of parameters are varied to match the autism spectrum disorder (ASD) subject data (see main text). See Figure 4—figure supplement 12 for a fit to the same data while (1) allowing all parameters free to vary, (2) allowing the same parameter as here to vary, but fitting to visual reliabilities separately, or (3) doing both (1) and (2). Of course, these result in better fits, but this is at the expense of interpretability in that they are inconsistent with the empirical data. (C) Same as (B) but fits are to the explicit spatial task. See Figure 4—figure supplement 13 for the equivalent of Figure 4—figure supplement 12, for the implicit task. Data (dots) are slightly different from that in Figures 2 and 3 because in the previous figures data was first averaged within subjects, then psychometric functions were fit, and finally estimates of bias were averaged across subjects. Here, data is first aggregated across all subjects and then psychometric fits are done on the aggregate. Importantly, the difference between ASD and control subjects holds either way. Error bars are 68% CI (see Supplementary file 4 for additional detail regarding deriving CIs for the amalgamated subject). (D). ASD subjects have a higher p-common for the aggregate subject in the implicit task but seemingly compensate in the explicit task where they show a lower aggregate p-common and choice bias. (E). The causal inference model provides an equally good fit (quantified by explainable variance explained), a measure of goodness of fit appropriate for noisy, as opposed to noiseless data (Haefner and Cumming, 2008) for control and ASD subjects. (F) Individual ASD (red) subjects have a higher p-common on average for the implicit task (in agreement with the aggregate subject) but (G) show no significant difference in the combined p-common and choice bias for the explicit task due to considerable heterogeneity across subjects. Subjects were included in the single-subject modeling effort if they had participated in Experiment 1 (and thus we had an estimate of their sensory encoding) in addition to the particular task of interest. That is, for panel (F), we included all participants taking part in Experiments 1 and 2. This included participants deemed poor in Experiment 1, given our attempt to account for participant’s behavior with the causal inference model. For panel (G), we included all participants taking part in Experiments 1 and 3. Individual subject error bars are 68% CI, while group-level error bars are 95% CI (see Supplementary file 4 for additional detail regarding statistical testing). CDF = cumulative density function.
Figure 4—figure supplement 1
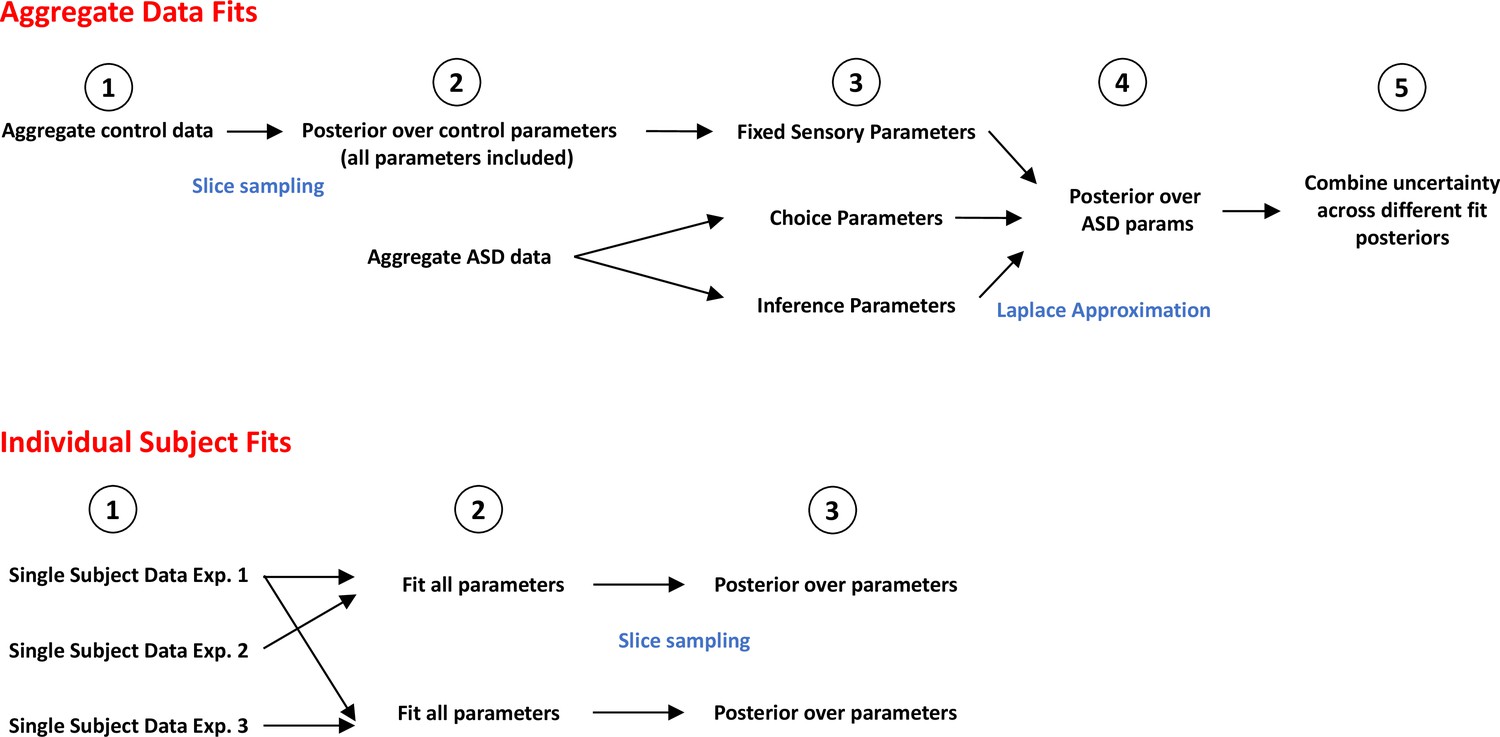
Flowchart detailing steps in fitting procedure.
Top: Fit to aggregate data presented in Figure 4B,C and D. First, we aggregate the control data (1) and estimate posteriors for all parameters in order to best fit the data via slice sampling (2). Next, we attempt to account for the aggregate autism spectrum disorder (ASD) data while fixing the sensory parameters but varying choice and/or inference parameters (3). The empirical data suggests no difference in the sensory parameters between control and ASD (Figure 2—figure supplement 1, Figure 3—figure supplement 1), and including these parameters or allowing them to be free while the inference parameters are not, does not account well for the implicit data (Figure 4—figure supplement 7, Alternative A and B). Next, we estimate the posterior parameters for the ASD cohort (4, 5). Bottom: Fit to the single subject data presented in Figure 4F and G. For each participant data from Experiment 1 (allowing estimation of sensory parameters) and either Experiment 2 (implicit causal inference) or Experiment 3 (explicit causal inference in space) are aggregated (1). Then we fit all parameters in order to best account for the data (2) and estimate posteriors over these parameters by slice sampling (3).
Figure 4—figure supplement 2
Fit to aggregate data for the implicit causal inference task, allowing sensory uncertainty and choice parameters to vary but fixing the inference parameter pcommon (shown in pink).
This model performs worse (quantified by Akaike Information Criterion [AIC] where positive AIC indicates worse fit) as compared to the model in the main paper where pcommon and the choice parameters are allowed to vary (shown in red).
Figure 4—figure supplement 3
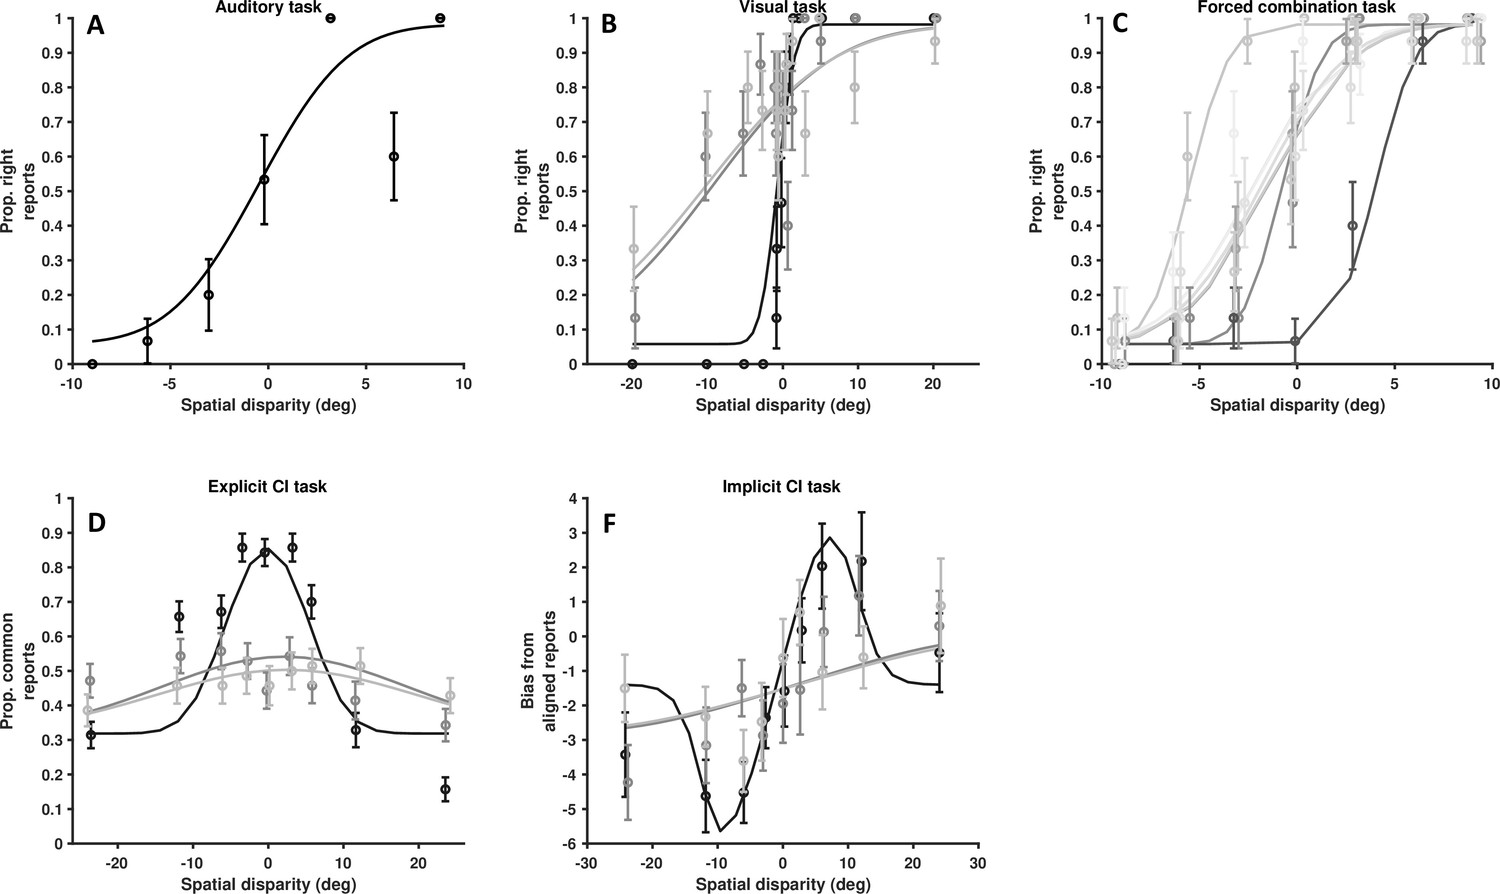
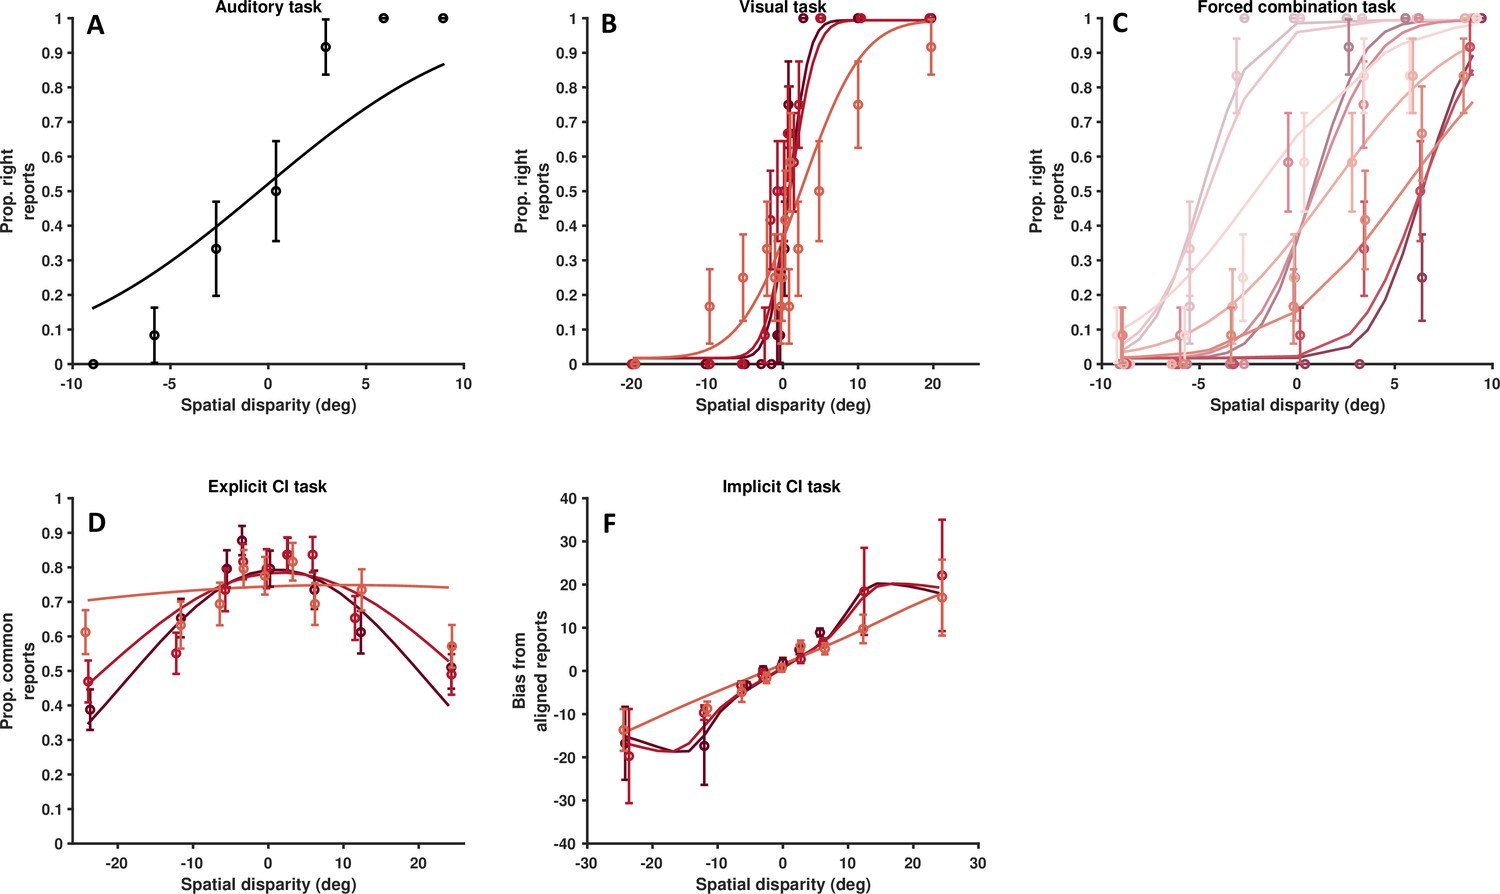
Data from a single, representative control subject.
(A) Auditory localization, proportion rightward (y-axis) as a function of auditory position vis-à-vis straight ahead (x-axis, positive values are rightward). (B) Visual localization across three reliabilities levels, from high reliability in dark, to low reliability in light gray. Follows the format from A. (C) Forced fusion task, where auditory and visual cues are presented congruently or with a slight disparity (±6°). (D) Explicit causal inference task, where participants report whether auditory and visual cues originated from the same source (y-axis), according to different spatial disparities (x-axis) and visual reliability levels (darker = more reliable). (F) Implicit causal inference. Auditory bias (y-axis, in degree) as a function of audio-visual disparity (x-axis, up to 24° ) and visual reliability (darker = more reliable). Errors bars are ±1 S.E. The parameters of the causal inference model are simultaneously fit to all tasks, considerable constraining the model estimates.
Figure 4—figure supplement 4
Data from another single, representative control subject.
As Figure 4—figure supplement 3, for a second representative control subject. (A) Auditory localization, proportion rightward (y-axis) as a function of auditory position vis-à-vis straight ahead (x-axis, positive values are rightward). (B) Visual localization across three reliability levels, from high reliability in dark, to low reliability in light gray. Follows the format from A. (C) Forced fusion task, where auditory and visual cues are presented congruently or with a slight disparity (±6°). (D) Explicit causal inference task, where participants report whether auditory and visual cues originated from the same source (y-axis), according to different spatial disparities (x-axis) and visual reliability levels (darker = more reliable). (F) Implicit causal inference. Auditory bias (y-axis, in degree) as a function of audio-visual disparity (x-axis, up to 24°) and visual reliability (darker = more reliable). Errors bars are ±1 S.E. The parameters of the causal inference model are simultaneously fit to all tasks, considerable constraining the model estimates.
Figure 4—figure supplement 5
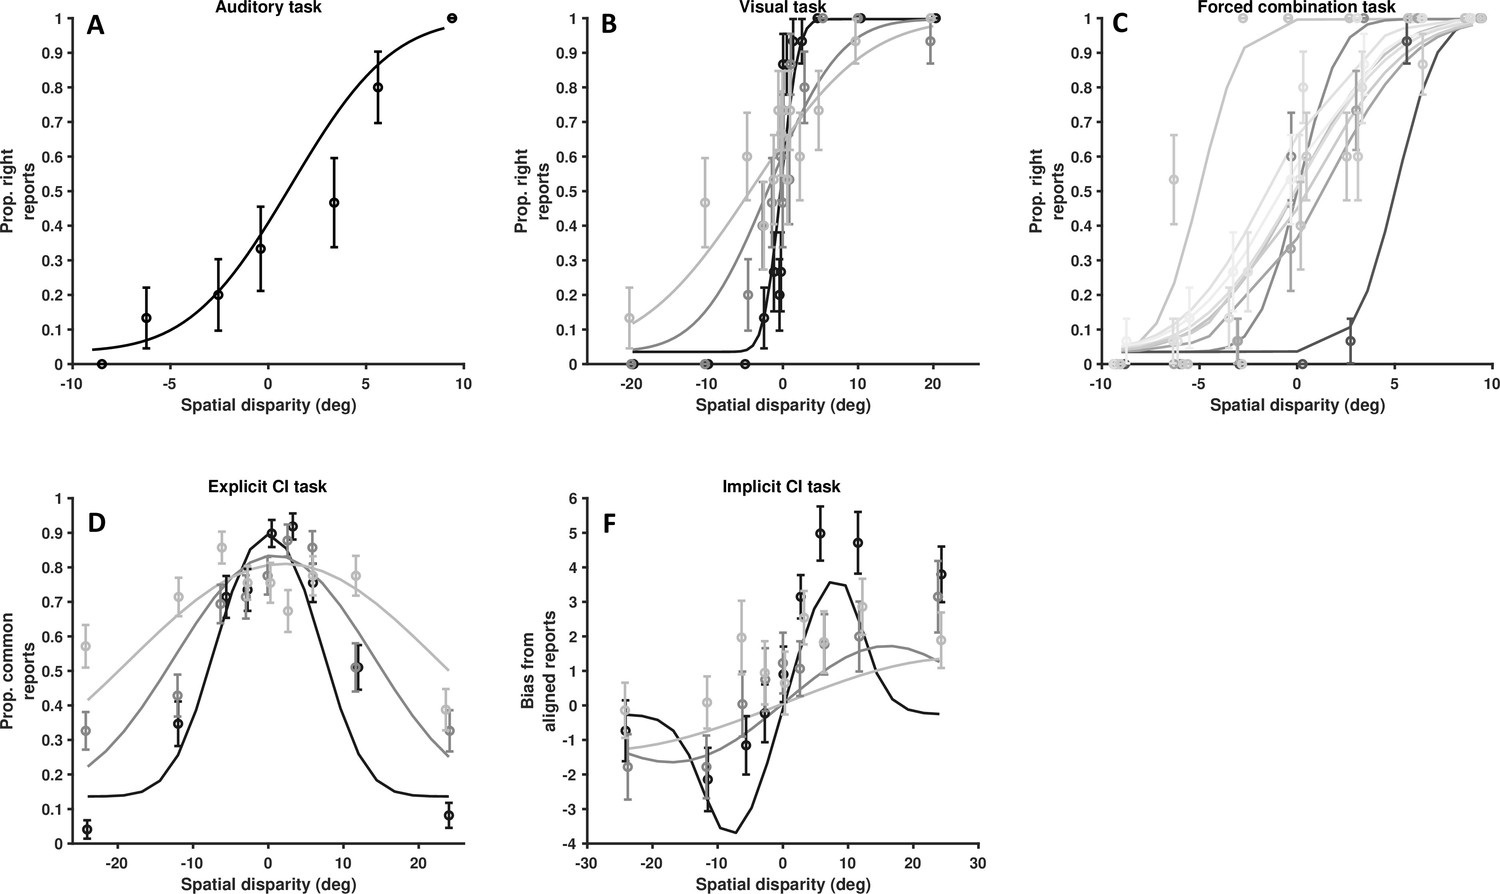
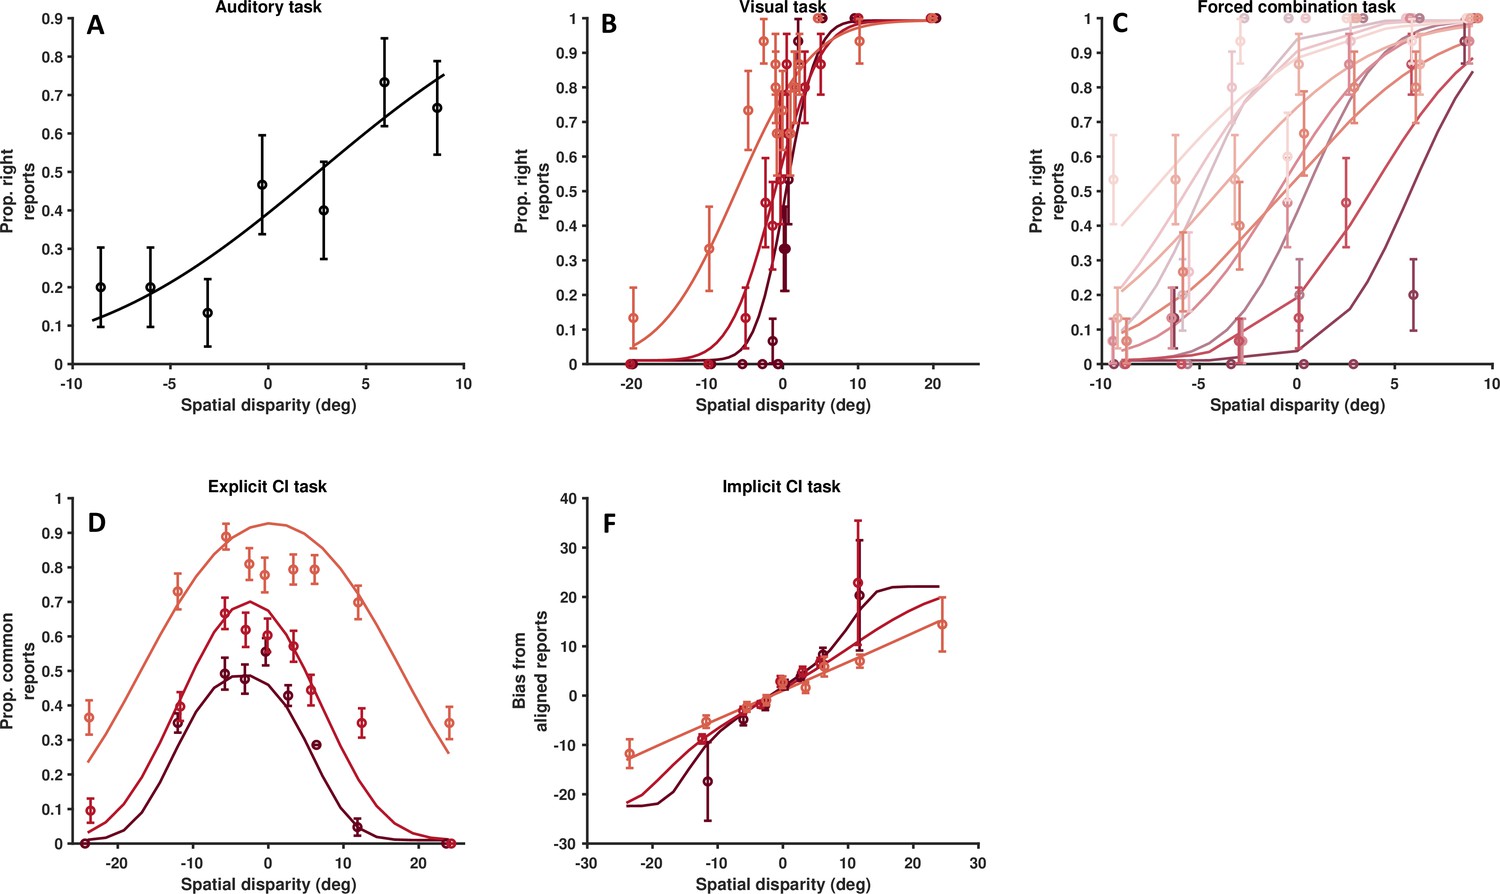
Data from a single, representative autism spectrum disorder (ASD) subject.
As Figure 4—figure supplements 3 and 4, for a representative ASD subject. (A) Auditory localization, proportion rightward (y-axis) as a function of auditory position vis-à-vis straight ahead (x-axis, positive values are rightward). (B) Visual localization across three reliability levels, from high reliability in dark, to low reliability in light gray. Follows the format from A. (C) Forced fusion task, where auditory and visual cues are presented congruently or with a slight disparity (±6°). (D) Explicit causal inference task, where participants report whether auditory and visual cues originated from the same source (y-axis), according to different spatial disparities (x-axis) and visual reliability levels (darker = more reliable). (F) Implicit causal inference. Auditory bias (y-axis, in degree) as a function of audio-visual disparity (x-axis, up to 24°) and visual reliability (darker = more reliable). Errors bars are ±1 S.E. The parameters of the causal inference model are simultaneously fit to all tasks, considerable constraining the model estimates.
Figure 4—figure supplement 6
Data from another single, representative autism spectrum disorder subject.
As Figure 4—figure supplement 5, for a second representative control subject. (A) Auditory localization, proportion rightward (y-axis) as a function of auditory position vis-à-vis straight ahead (x-axis, positive values are rightward). (B) Visual localization across three reliabilities levels, from high reliability in dark, to low reliability in light gray. Follows the format from A. (C) Forced fusion task, where auditory and visual cues are presented congruently or with a slight disparity (±6°). (D) Explicit causal inference task, where participants report whether auditory and visual cues originated from the same source (y-axis), according to different spatial disparities (x-axis) and visual reliability levels (darker = more reliable). (F) Implicit causal inference. Auditory bias (y-axis, in degree) as a function of audio-visual disparity (x-axis, up to 24°) and visual reliability (darker = more reliable). Errors bars are ±1 S.E. The parameters of the causal inference model are simultaneously fit to all tasks, considerable constraining the model estimates.
Figure 4—figure supplement 7
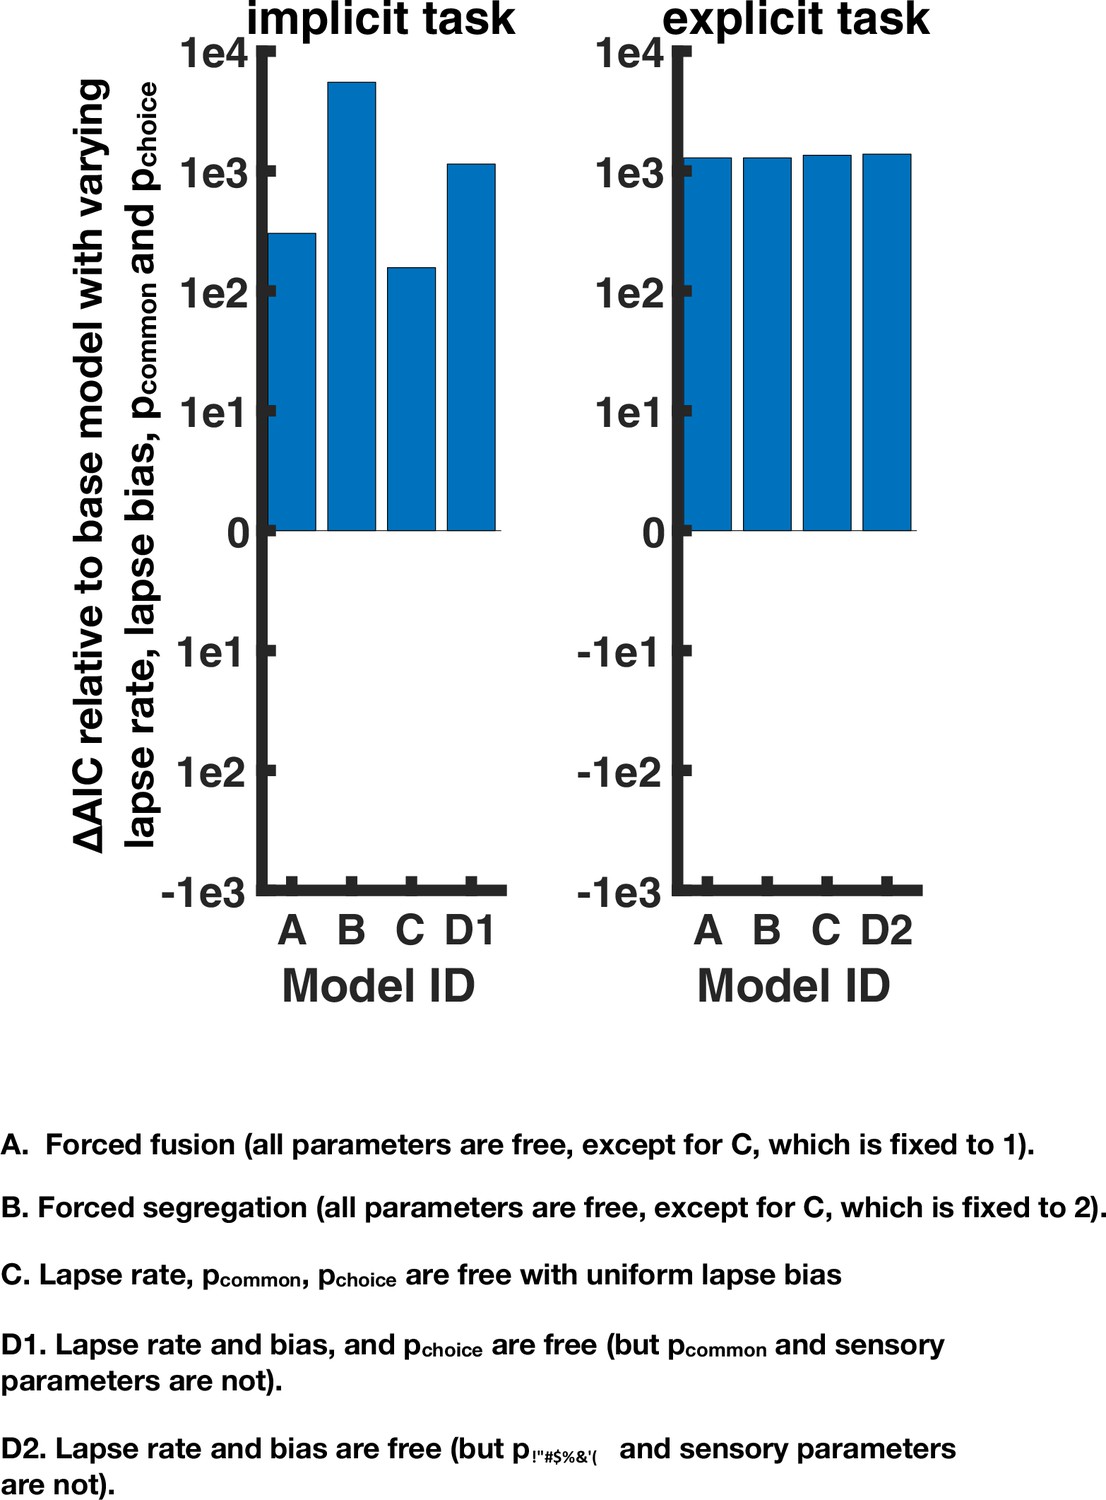
Goodness of fit of alternative models for the implicit and explicit spatial causal inference task.
Four alternatives were tested: (A) a forced fusion model where C is set to 1. (B) A forced segregation model where C is set to 2. (C) A model where there is no lapse bias. (D1) An alternative where solely choice parameters are varied for implicit task: the lapse parameters and pchoice (D2). For the explicit task, pchoice cannot be separately constrained from pcommon so only the lapse parameters are varied. For the implicit task, two main observations must be noted. First, all models perform worse than that presented in the main text (y-axis is difference to the model presented in the main text, with higher Akaike Information Criterion [AIC] indicating a worse quality of fit). Second, Alternative A is substantially better than Alternative B, but still worse than the model in the main text. Thus, seemingly individuals with autism spectrum disorder do perform causal inference and not pure forced fusion, yet they overweight integration (vs. segregation) compared to their neurotypical counterparts. For the explicit task, all alternative models perform worse than the model in the main text where the choice and inference parameters were varied.
Figure 4—figure supplement 8
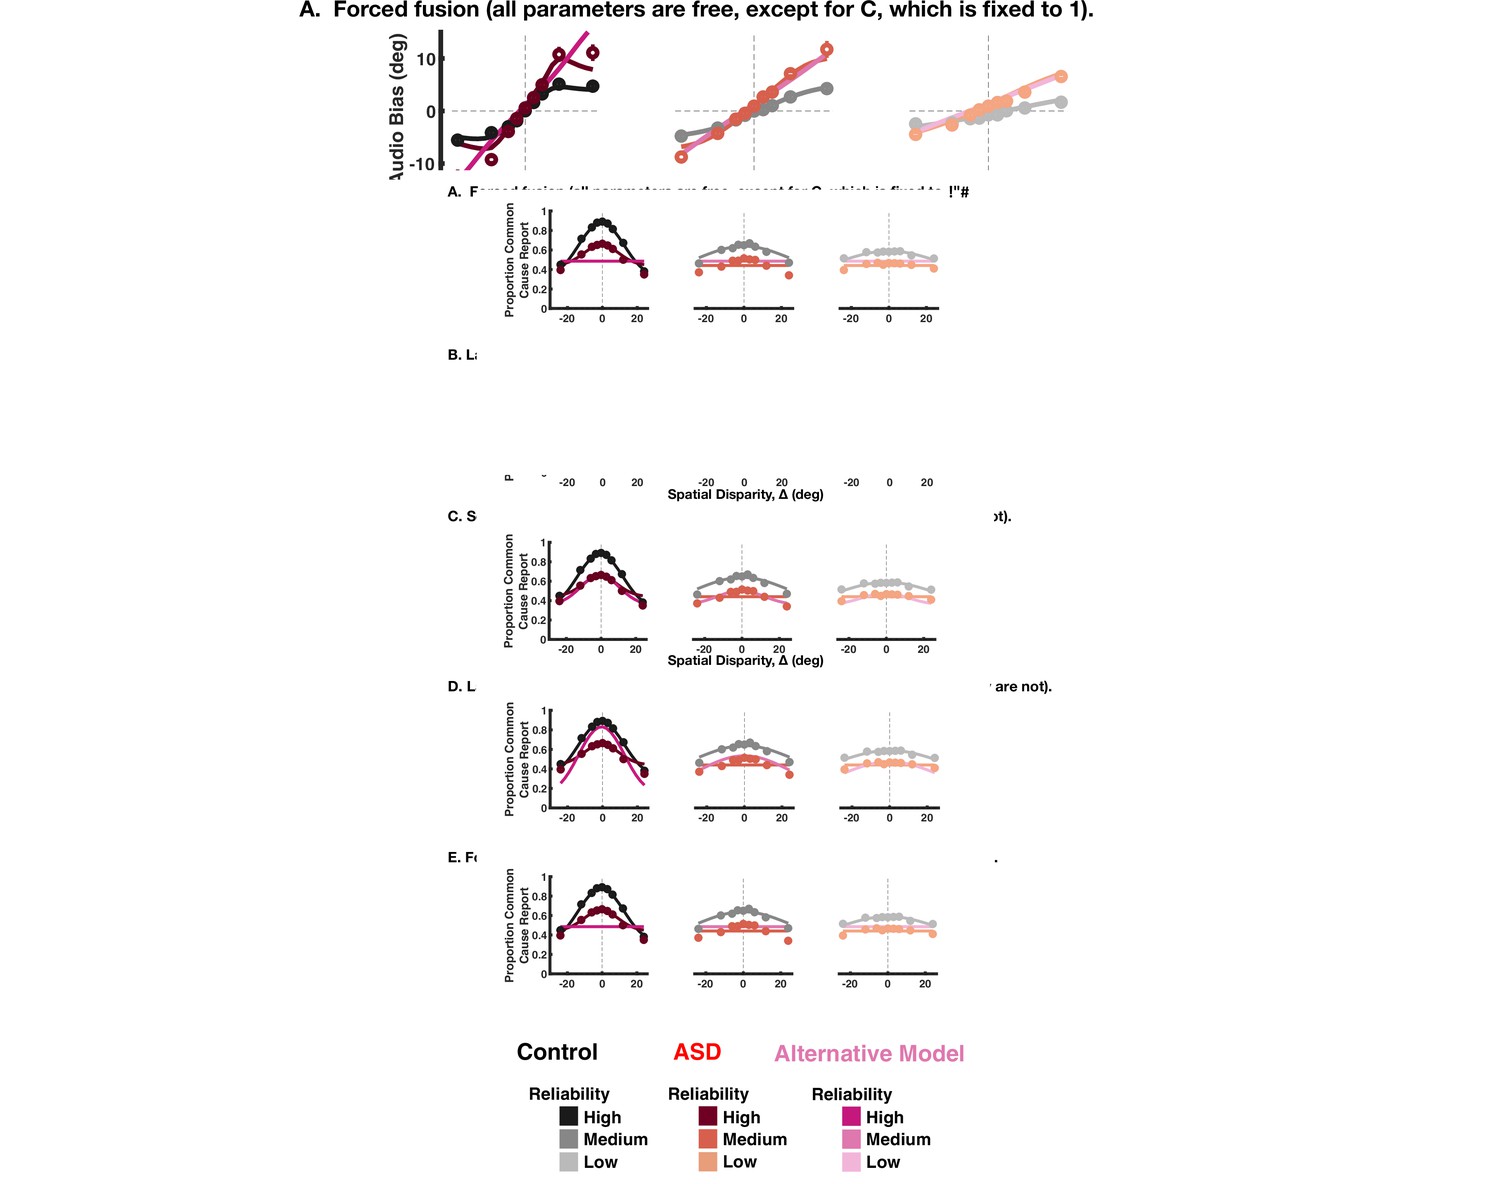
Illustration of the alternative models fits to implicit causal inference model data.
The rows show the four alternative models tested, while the columns show data in decreasing order of reliability. For each panel, the model presented in the main text is shown, in shades of black for the control subjects and shades of red for the autism spectrum disorder subjects. The alternative tested in each panel is shown in shades of magenta.
Figure 4—figure supplement 9
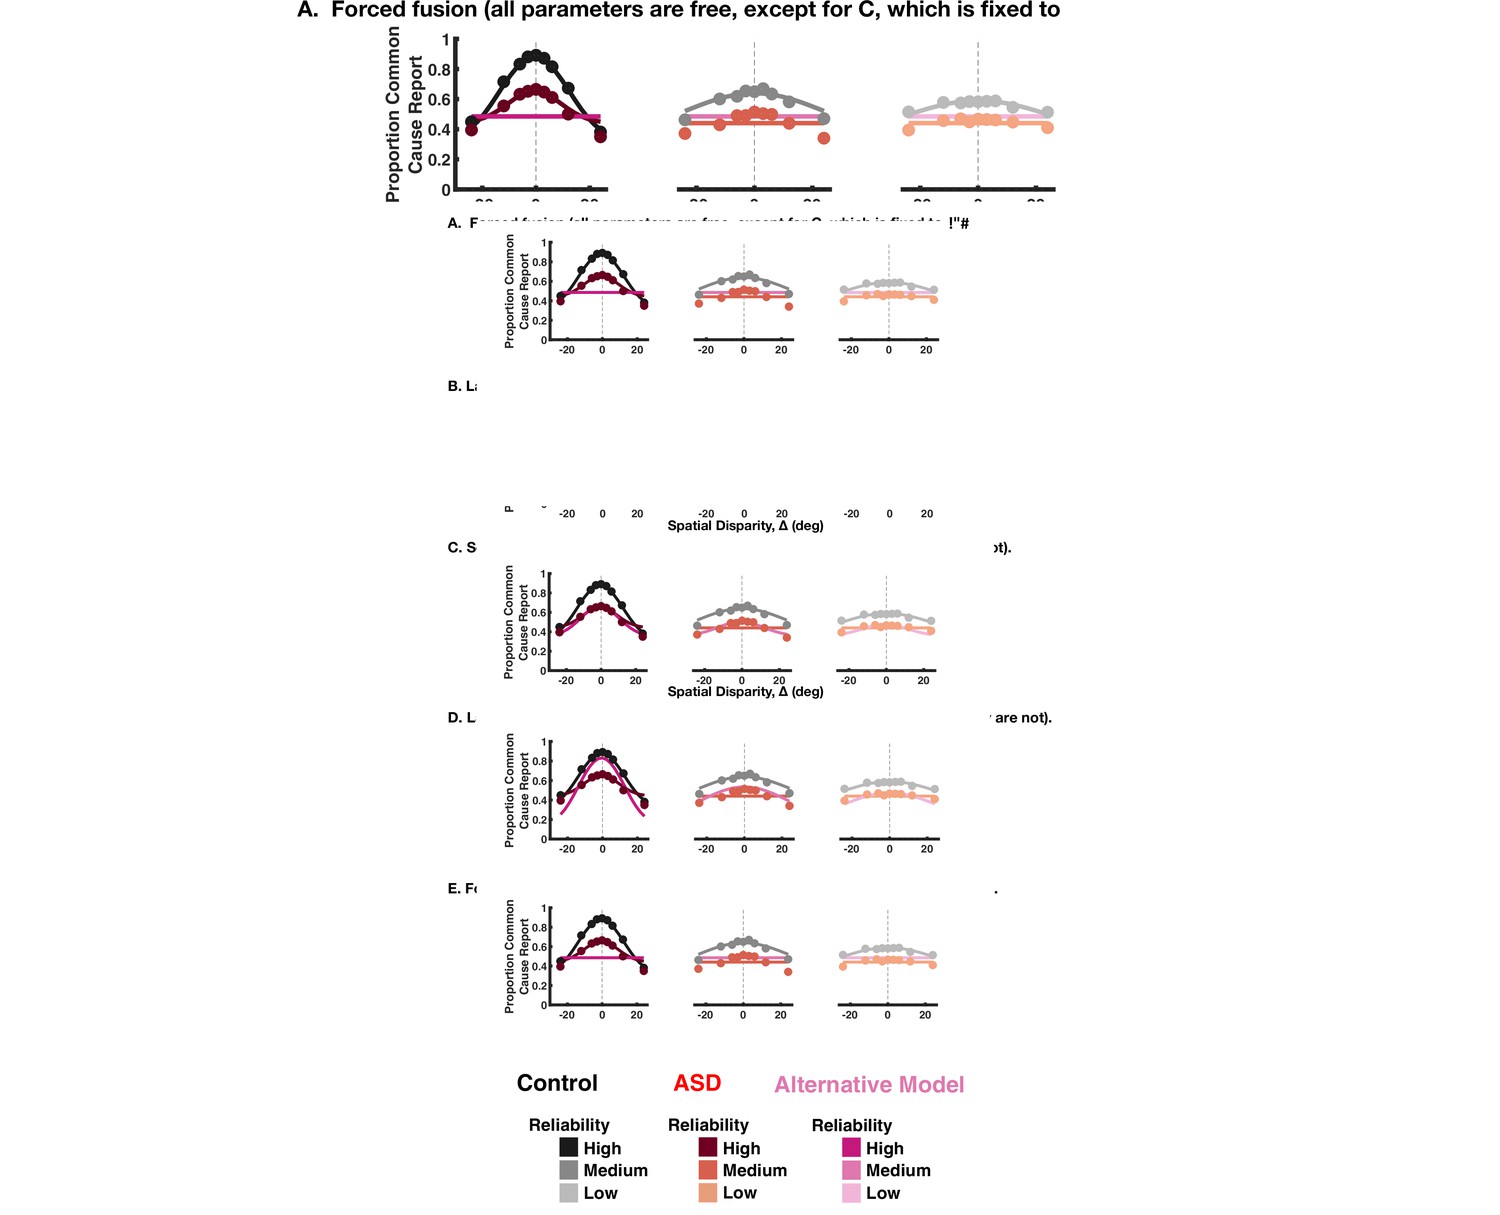
Illustration of the alternative models fits to explicit causal inference model data.
The rows show the four alternative models tested, while the columns show data in decreasing order of reliability. For each panel, the model presented in the main text is shown, in shades of black for the control subjects and shades of red for the autism spectrum disorder subjects. The alternative tested in each panel is shown in shades of magenta.
Figure 4—figure supplement 10
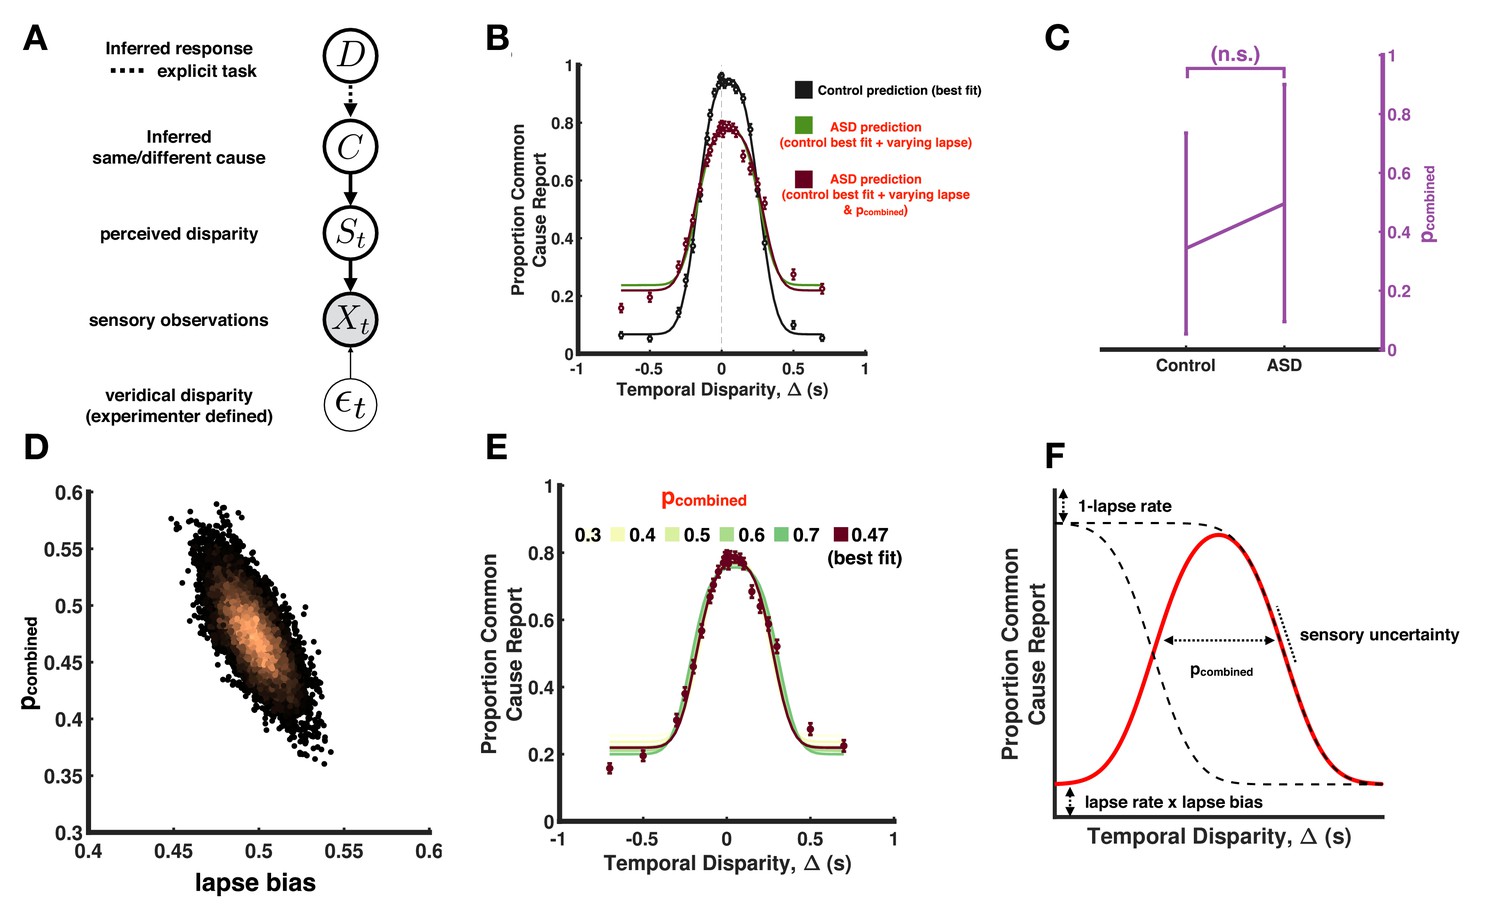
Causal inference modeling of temporal, simultaneity judgment task.
(A) Causal inference model for auditory-visual simultaneity judgement. This model is a simplified version from the full model in Figure 4A by measuring temporal judgments relative to a reference cue (the auditory cue in this case). (B) Model fits to aggregate subjects in the explicit temporal task. The causal inference model is fit to the control aggregate subject and different set of parameters are varied to match the autism spectrum disorder (ASD) subject data (similar to Figure 4). (C) Estimated pcombined cannot be accurately constrained using the given data, as illustrated by the large error bars. (D) Scatter plots of samples from the joint posterior distribution between the pcombined parameter and the lapse bias parameter. The two parameters are (negatively) correlated (r=−0.72) making them hard to separate. (E) Illustration of the correlation between the parameters in B. Fixing the pcombined to a range of values between 0.3 and 0.7, we can estimate the lapses such that the model provides a qualitatively good prediction to the data, hence making it hard to constrain the pcombined as seen in C. (F) The predicted responses from the causal inference model can be visualized as a difference between two cumulative Gaussian functions with a vertical scaling and offset determined by the lapse rate and lapse biases. The slope of the cumulative Gaussian is a function of the sensory uncertainty, whereas the separation is a function of pcombined. By fixing the slope, offset, and scaling from the sensory uncertainties and lapses, the differences between the curves for different pcombined are small, making it hard to separate using reasonable amount of empirical data.
Figure 4—figure supplement 11
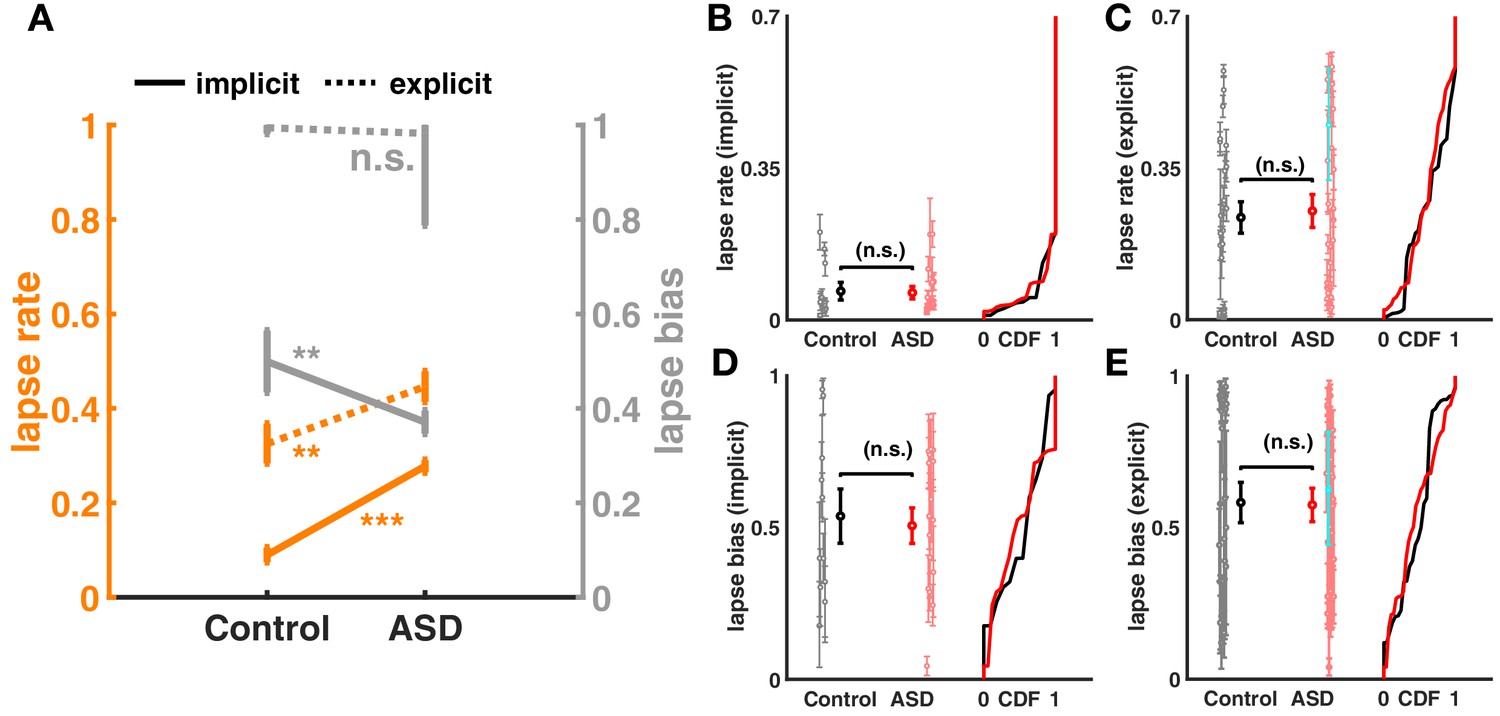
Lapse rate and lapse bias for aggregate and individual subjects during the implicit and explicit spatial tasks.
(A) Aggregate lapse rate and lapse bias for controls and autism spectrum disorder (ASD) (plotted similar to main text Figure 4D). We find that in both implicit and explicit causal inference tasks, ASD subjects have a higher lapse rate. ASD subjects also seem to have a larger deviation from a uniform lapse bias of 0.5. (B–D) Lapse rate and lapse bias fit to individual subjects. There is no significant difference in the lapse rate and lapse bias for both tasks due to considerable heterogeneity across subjects. Subject depictured in blue is the same as in Figure 4, main text.
Figure 4—figure supplement 12
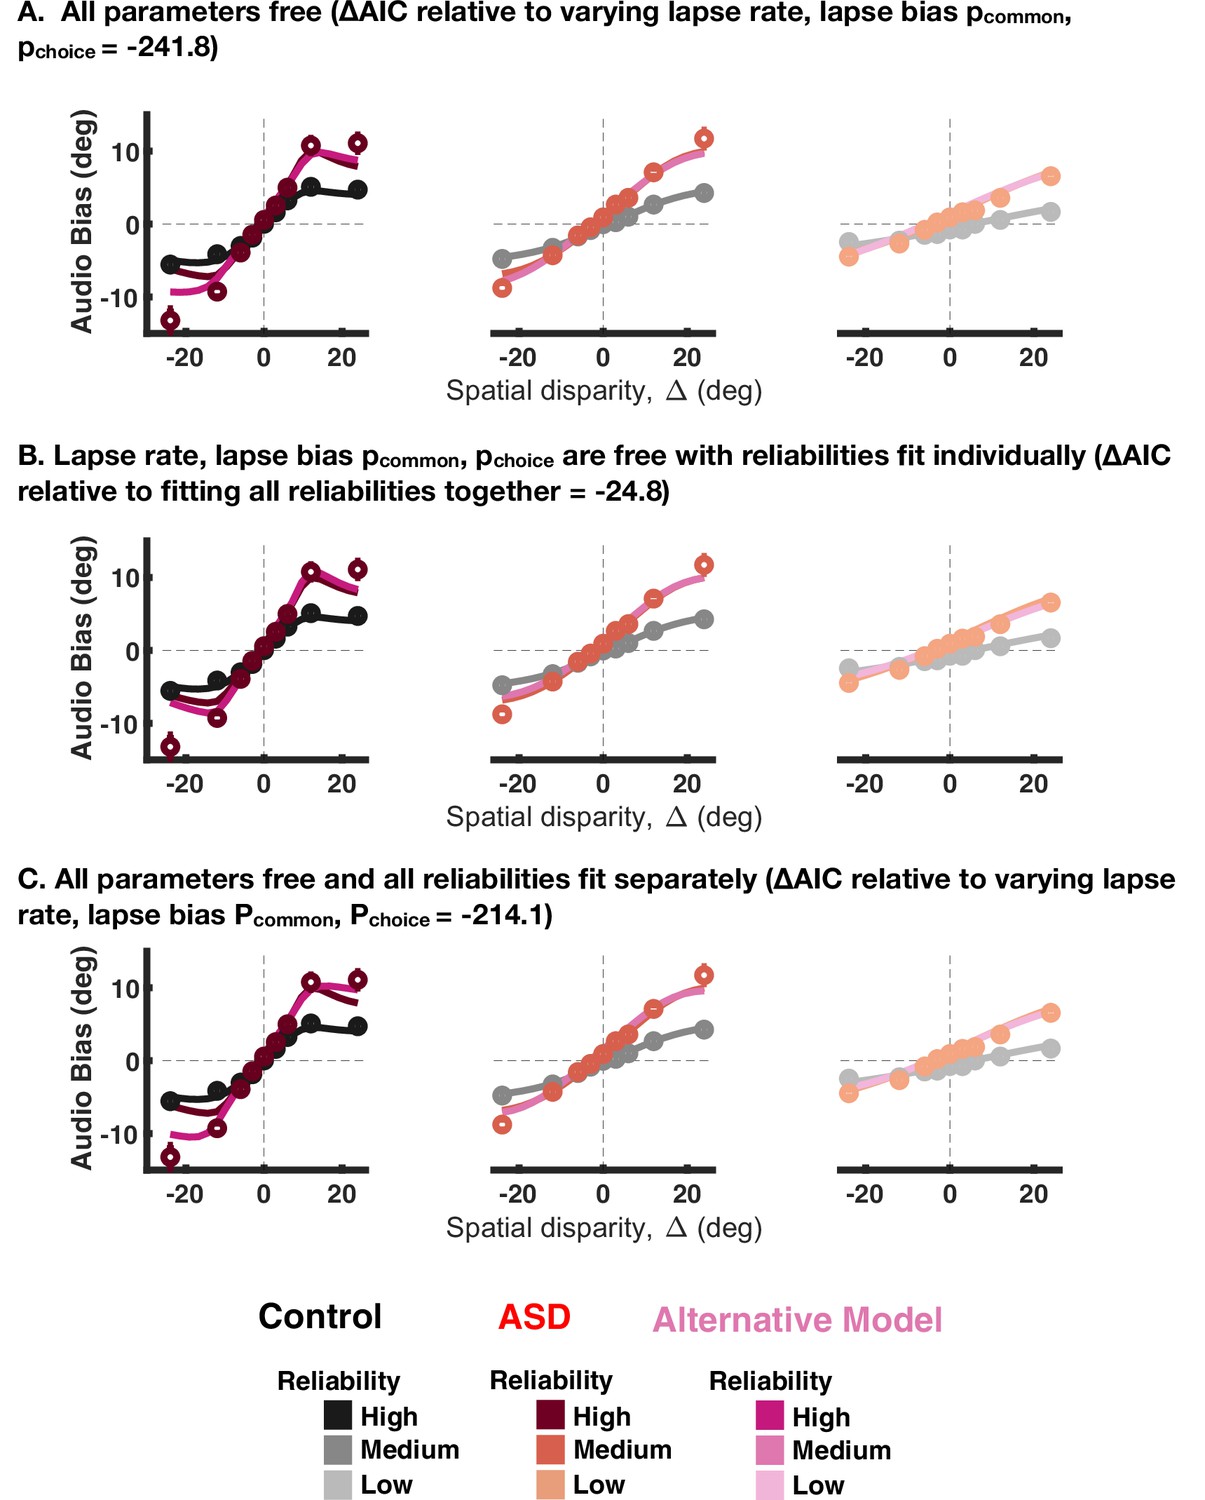
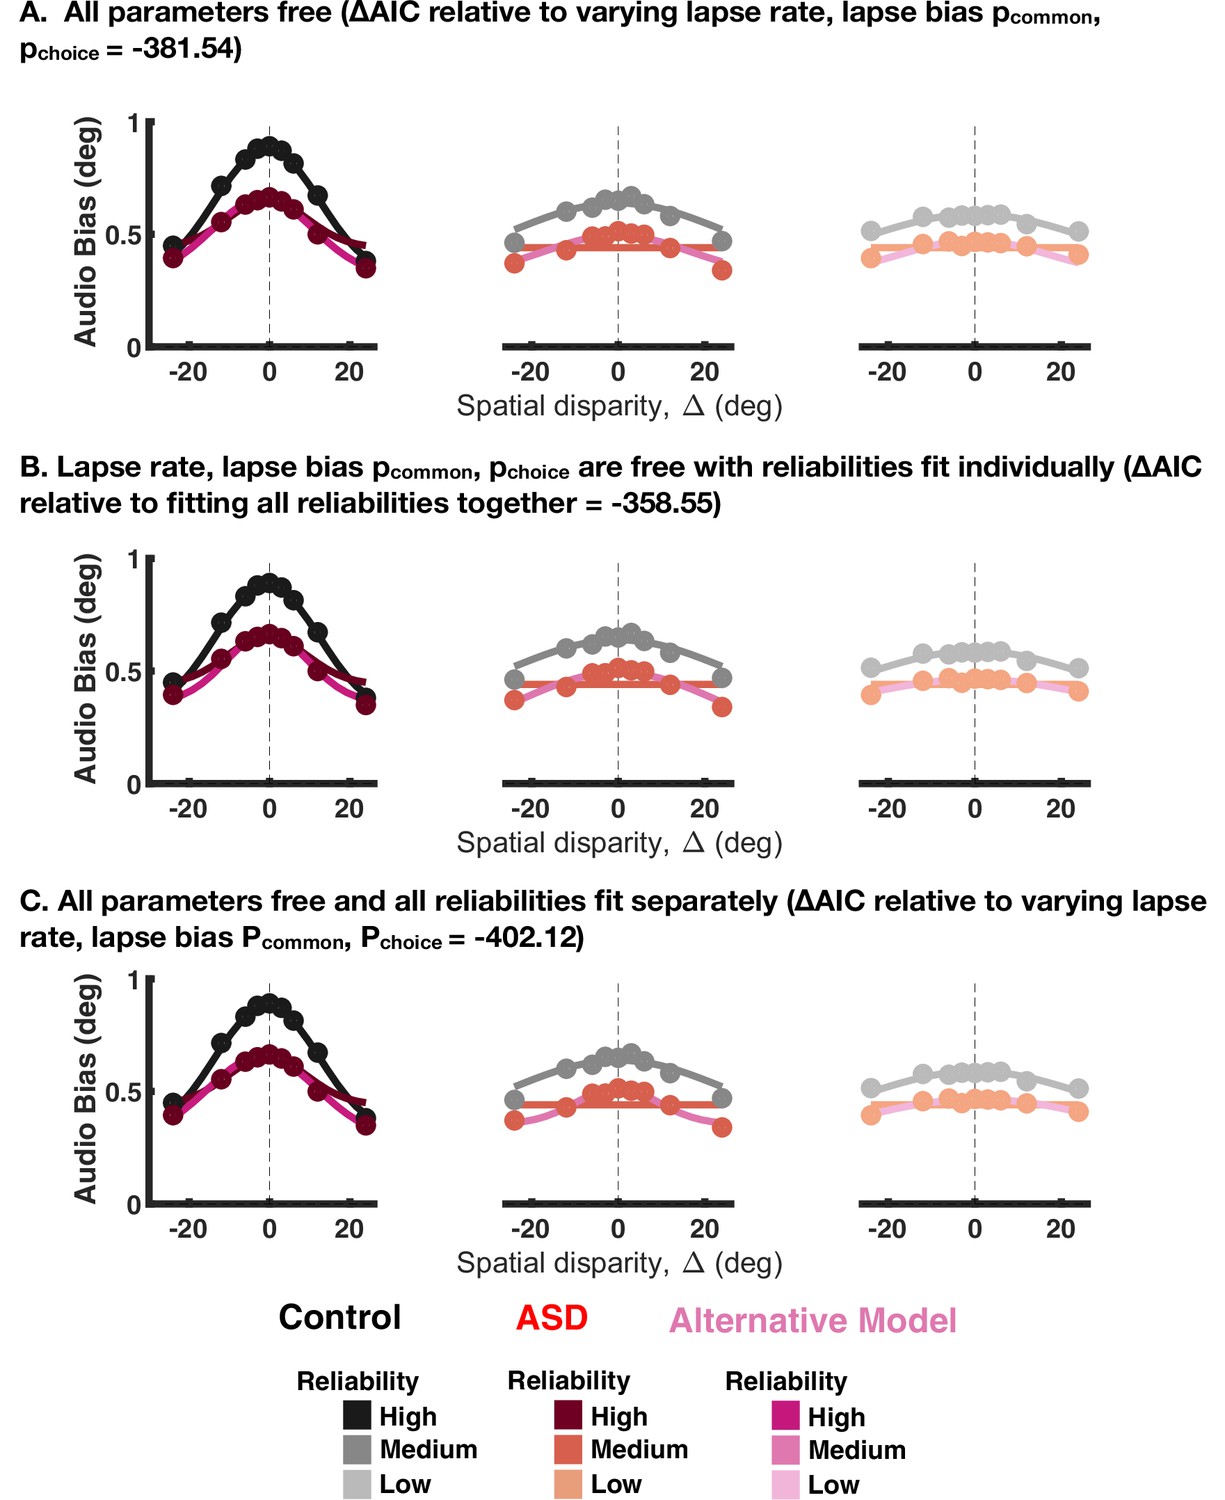
Fit to aggregate data for the implicit causal inference task, given that all parameters are free to vary (A), the different visual reliabilities are fit separately (B) or both of the above (C).
The change in Akaike Information Criterions (AICs) is reported in the panel title, with all values being smaller than the baseline model, suggesting better fits. Shades of black and red are, respectively, the baseline model for control and autism spectrum disorder (ASD) subjects, while shades of magenta are the comparison model.
Figure 4—figure supplement 13
Fit to aggregate data for the explicit causal inference task, given that all parameters are free to vary (A), the different visual reliabilities are fit separately (B) or both of the above (C).
The change in Akaike Information Criterions (AICs) is reported in the panel title, with all values being smaller than the baseline model, suggesting better fits. Shades of black and red are, respectively, the baseline model for control and autism spectrum disorder (ASD) subjects, while shades of magenta are the comparison model.
Author response image 1

Z-score of all parameters for all ASD subjects, both included in the main text (black) and not (poor performers, in red).
Dashed lines are +/- 2 standard deviations. There are a few outliers, both poor (red) and good (black) performers, but overall there is no categorical difference between sub-groups.
Additional files
-
Supplementary file 1
Control participants.
The table indexes each control participant by a unit ID, and indicates in which experiment did each participant take part in. Green indicates that the participant took part in the given experiment, while red indicates that they did not. Experiment 1 is the unisensory discrimination task and audio-visual cue combination that does not require causal inference (i.e. imperceptible disparities). Experiment 2 is the audio-visual implicit causal inference experiment. Experiment 3 is the explicit causal inference experiment with spatial disparities. Experiment 4 is the explicit causal inference experiment with temporal disparities. Experiment 5 is the visual heading discrimination task during concurrent object-motion.
- https://cdn.elifesciences.org/articles/71866/elife-71866-supp1-v2.docx
-
Supplementary file 2
ASD participants.
The table indexes each ASD participant by a unit ID, and indicates in which experiment did each participant take part in. Green indicates that the participant took part in the given experiment, while red indicates that they did not. An orange box indicates that the participant took part in the experiment, but their data was excluded in presentation of the empirical results (but not the modeling of individual subjects, as indicated in the main text). Experiment 1 is the unisensory discrimination task and audio-visual cue combination that does not require causal inference (i.e. imperceptible disparities). Experiment 2 is the audio-visual implicit causal inference experiment. Experiment 3 is the explicit causal inference experiment with spatial disparities. Experiment 4 is the explicit causal inference experiment with temporal disparities. Experiment 5 is the visual heading discrimination task during concurrent object-motion.
- https://cdn.elifesciences.org/articles/71866/elife-71866-supp2-v2.docx
-
Supplementary file 3
Priors distributions over model parameters.
- https://cdn.elifesciences.org/articles/71866/elife-71866-supp3-v2.docx
-
Supplementary file 4
Causal inference model inference and fitting details.
- https://cdn.elifesciences.org/articles/71866/elife-71866-supp4-v2.docx
-
Supplementary file 5
Causal inference modeling for simultaneity judgments.
- https://cdn.elifesciences.org/articles/71866/elife-71866-supp5-v2.docx
-
Transparent reporting form
- https://cdn.elifesciences.org/articles/71866/elife-71866-transrepform1-v2.pdf
Download links
A two-part list of links to download the article, or parts of the article, in various formats.
Downloads (link to download the article as PDF)
Open citations (links to open the citations from this article in various online reference manager services)
Cite this article (links to download the citations from this article in formats compatible with various reference manager tools)
Aberrant causal inference and presence of a compensatory mechanism in autism spectrum disorder
eLife 11:e71866.
https://doi.org/10.7554/eLife.71866


