Microglia and CD206+ border-associated mouse macrophages maintain their embryonic origin during Alzheimer’s disease
- School of Biological Sciences, Nanyang Technological University, Singapore
- Department of Neurocognitive Science, Institute of Brain Science, Nagoya City University Graduate School of Medical Sciences, Japan
- Laboratory for Proteolytic Neuroscience, RIKEN Center for Brain Science, Japan
- Lee Kong Chian School of Medicine, Nanyang Technological University, Singapore
Figures
Figure 1 with 2 supplements
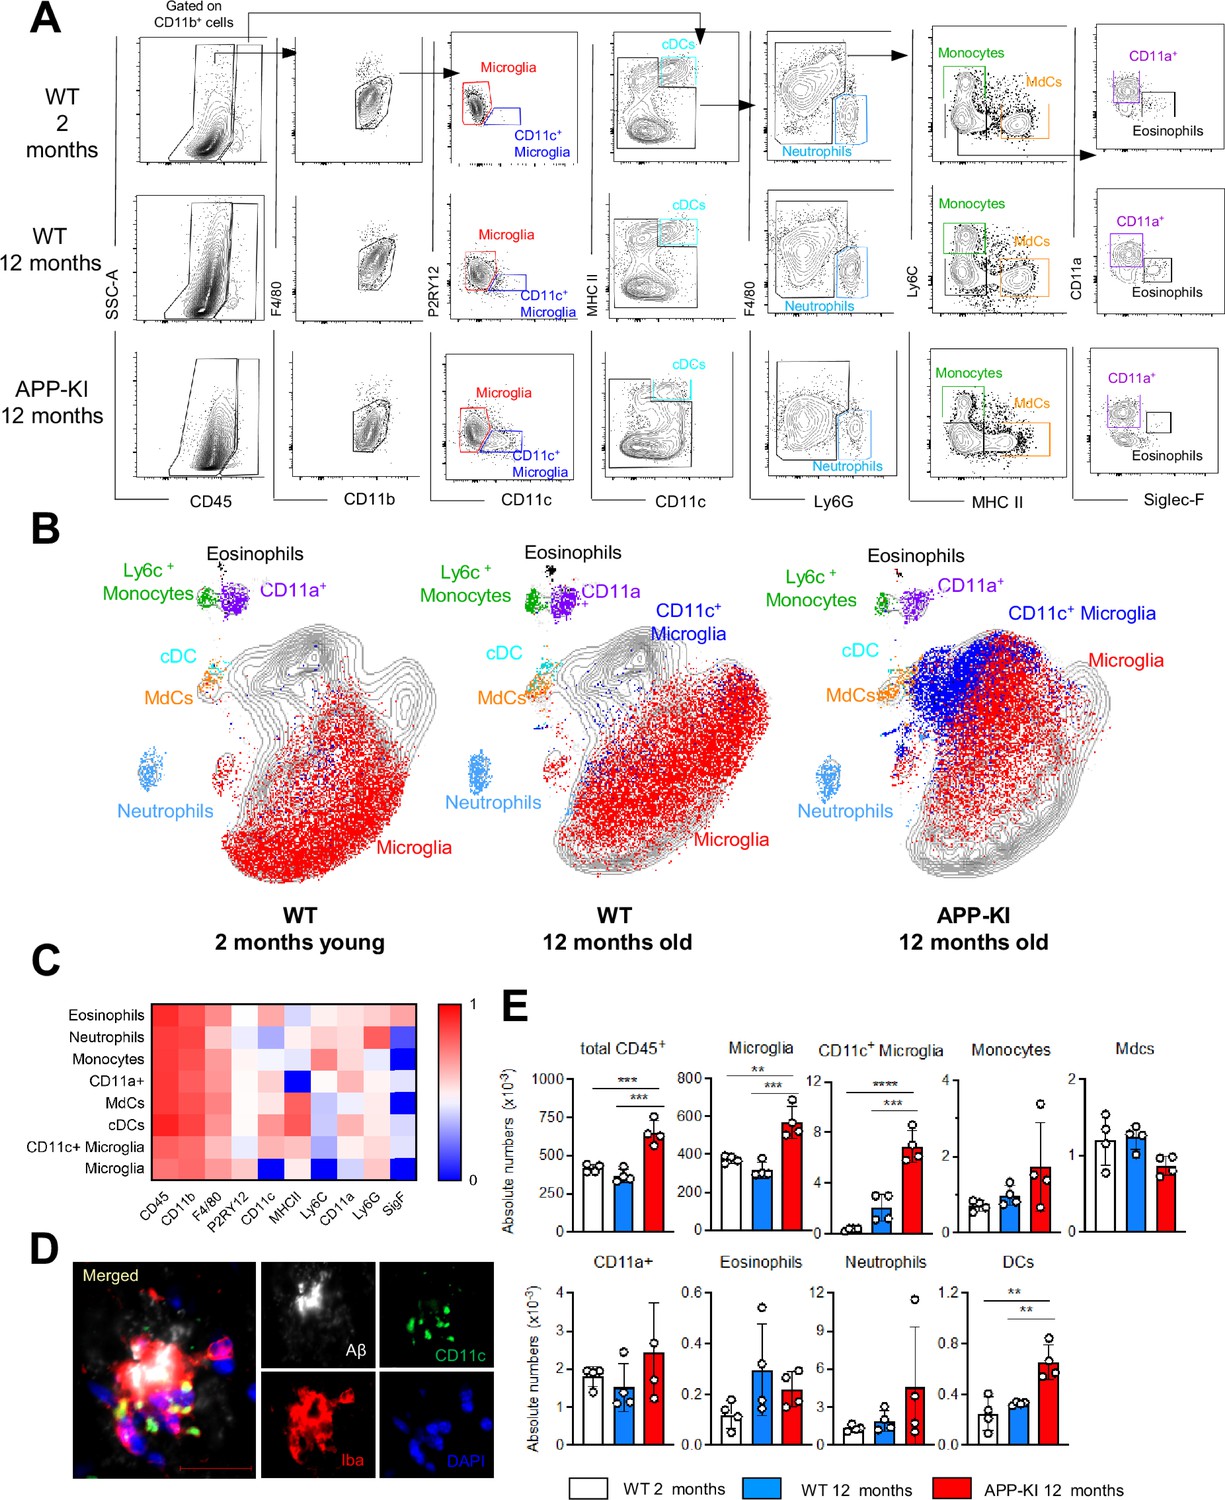
Myeloid cell profiling in healthy and AD parenchymal brains.
(A) Representative gating strategy used to visualize distinct myeloid cell subpopulations in young WT (aged 2 months), WT (aged 12 months), and diseased APP-KI (aged 12 months) mice. Microglia: CD45intF4/80hiP2RY12+CD11c−; activated microglia: CD45intF4/80hiP2RY12lowCD11c+; cDCs: CD45hiCD11chiMHCII+; neutrophils: CD45hiCD11bhiLy6G+; monocytes: CD45hiF4/80intCD11bintLy6C+MHCII−; monocyte-derived macrophages (MdCs): CD45hiF4/80intCD11bintLy6C−MHCII+; CD11a+ cells: CD45hiF4/80intCD11bintLy6C−MHCII−CD11a+ and eosinophils: CD45hiF4/80intCD11bintSiglec-F+. (B) UMAP analysis displaying 30,000 randomly sampled cells from young WT, aged WT, and APP-KI mouse brains analyzed by multicolor flow cytometry (n=3 mice/group). (C) Heatmap demonstrating the mean fluorescent intensity of 10 myeloid lineage markers across eight different brain parenchyma myeloid cell populations. The color in the heatmap varies from blue for lower expression to red for higher expression. (D) Representative confocal image of Iba-1+ (red), CD11c+ (green) microglia accumulating around Aβ plaques (white) in a 12-month-old APP-KI mouse brain. Blue visualizes DAPI positive nuclei. Scale bar, 20 μm. (E) Bar charts with individual dots illustrating the absolute numbers of different myeloid cell populations within the total parenchymal brain CD45+ cell population. Each dot represents the percentage of cells obtained from one brain (n=4 mice/group). Young mice: gray, aged mice: blue, and APP-KI mice: red. Samples were analyzed by two-way ANOVA. **p<0.01; ***p<0.001; ****p<0.0001. For clarity, non-significant values are not shown. AD, Alzheimer’s disease.
-
Figure 1—source data 1
Absolute numbers of different myeloid cell populations within the total parenchymal brain CD45+ cell population.
- https://cdn.elifesciences.org/articles/71879/elife-71879-fig1-data1-v2.xlsx
Figure 1—figure supplement 1
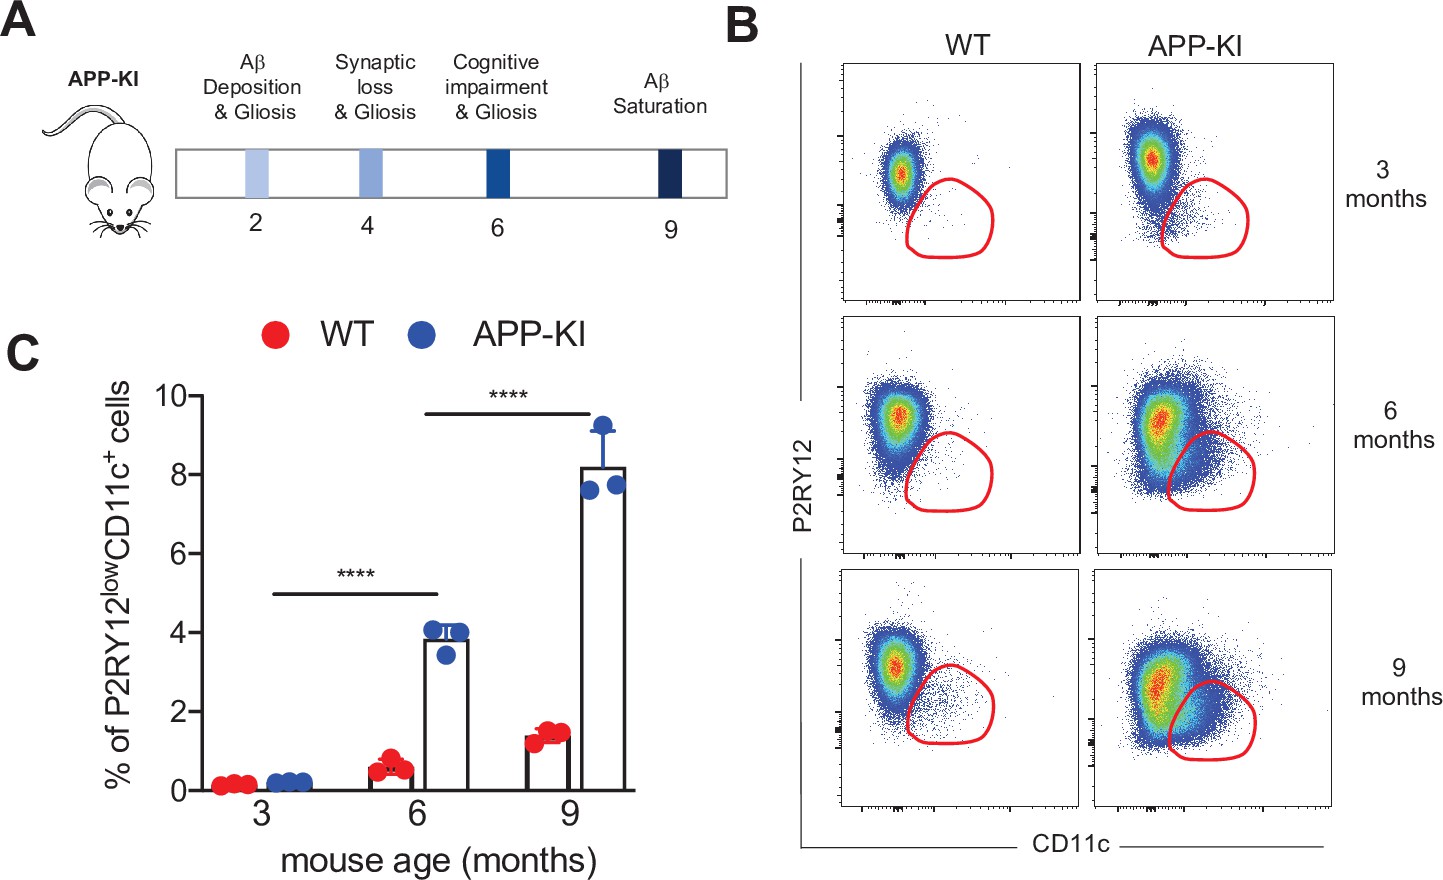
APP-KI AD mouse model.
(A) Schematic representation of distinct stages during the progression of AD in the experimental APP-KINL-G-F transgenic mouse model. (B) Representative flow cytometric analysis showing disease-associated microglia at different stages of AD progression (3, 6, and 9 months) in WT and APP-KI mice. Dot plots showing CD11c on the x-axis and PR2Y12 on the y-axis. (C) Bar charts with individual data points representing activated CD11c+ microglia obtained from WT mice (red dots) and APP-KI mice (blue dots) aged 3, 6, and 9 months. Statistical significance was determined using unpaired Student’s t-test; ****p<0.0001. AD, Alzheimer’s disease.
-
Figure 1—figure supplement 1—source data 1
Frequency of activated CD11c+ microglia obtained from WT and AAP-KI mice aged 3, 6 and 9 months.
- https://cdn.elifesciences.org/articles/71879/elife-71879-fig1-figsupp1-data1-v2.xlsx
Figure 1—figure supplement 2
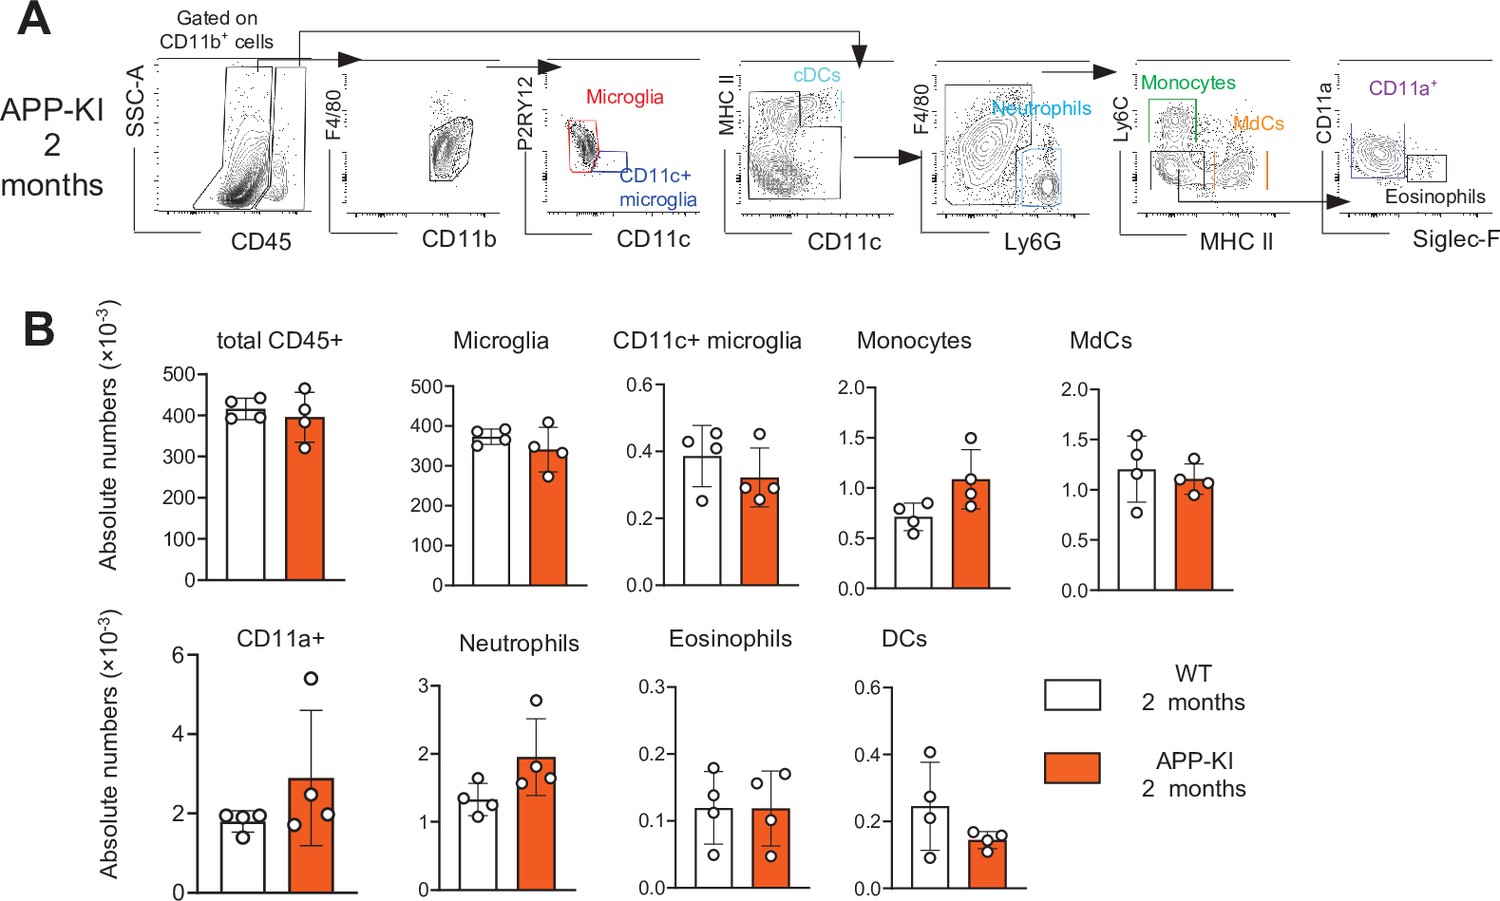
No difference in myeloid cells between 8-week young WT and APP-KI mice.
(A) Representative gating strategy used to visualize distinct myeloid cell subpopulations in young APP-KI (aged 2 months). Microglia: CD45intF4/80hiP2RY12+CD11c−; activated microglia: CD45intF4/80hiP2RY12lowCD11c+; cDCs: CD45hiCD11chiMHCII+; neutrophils: CD45hiCD11bhiLy6G+; monocytes: CD45hiF4/80intCD11bintLy6C+MHCII−; monocyte-derived macrophages (MdCs): CD45hiF4/80intCD11bintLy6C−MHCII+; CD11a+ cells: CD45hiF4/80intCD11bintLy6C−MHCII−CD11a+ and eosinophils: CD45hiF4/80intCD11bintSiglec-F+. (B) Bar charts with individual dots illustrating the absolute numbers of different myeloid cell populations within the total parenchymal brain CD45+ cell population of young WT and APP-KI (2 months). Each dot represents the percentage of cells obtained from one brain (n=5 mice/group). Statistical significance was determined using unpaired Student’s t-test; For clarity, non-significant values are not shown.
-
Figure 1—figure supplement 2—source data 1
Absolute numbers of different myeloid cell populations within the total parenchymal brain CD45+ cell population of young WT and APP-KI (2 months).
- https://cdn.elifesciences.org/articles/71879/elife-71879-fig1-figsupp2-data1-v2.xlsx
Figure 2 with 2 supplements
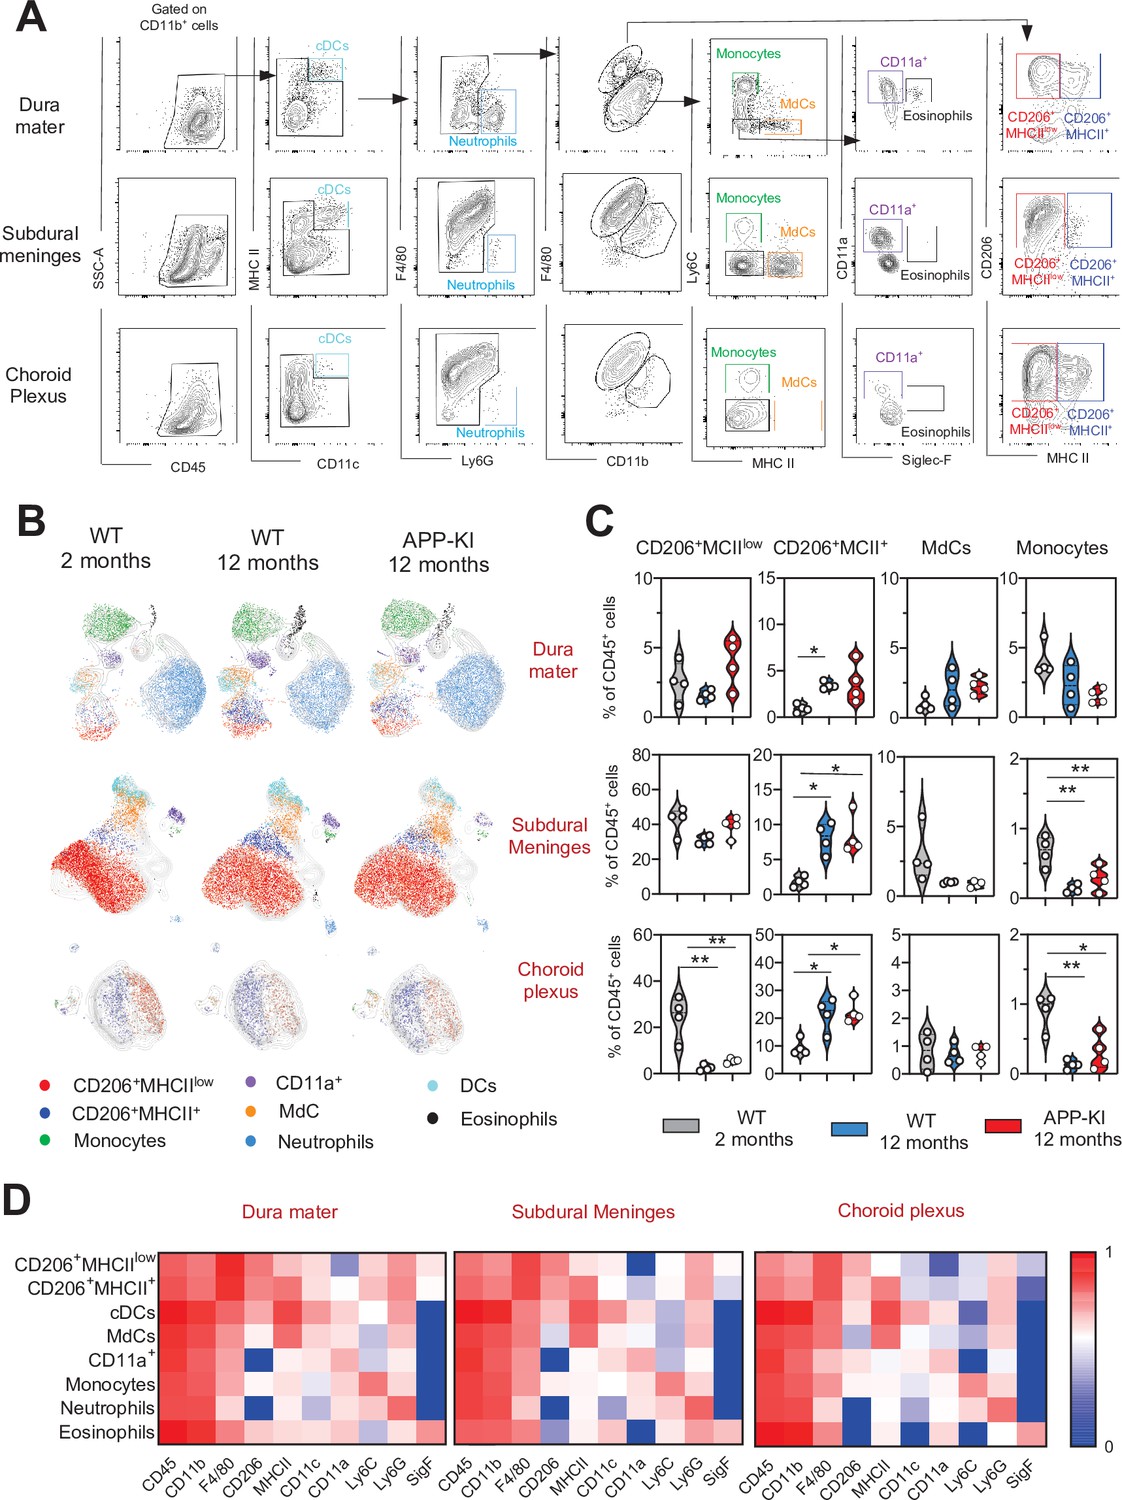
Characterization of myeloid cells in distinct brain border regions in health and AD.
(A) Representative gating strategy used to visualize distinct myeloid cell subpopulations in the dura mater (DM), subdural meninges (SDM), and choroid plexus (CP). Young WT mice (aged 2 months) were analyzed. Cell classification as shown in the legend of Figure 1. (B) UMAP analysis displaying 8500 (DM), 13,000 (SDM), and 3700 (CP) randomly sampled cells from young WT, aged WT, and aged APP-KI DM, SDM, and CP analyzed by multicolor flow cytometry (n=9 mice). (C) Violin plots with individual dots illustrating the frequency of BAMs (CD206+MHCIIlow and CD206+MHCII+), Mdc, and monocytes within the total non-parenchymal CD45+ cell population of the DM, SDM, and CP. Young mice: gray, aged mice: blue, and APP-KI mice: red. Each dot represents the percentage of cells obtained from pooled border regions (n=2–3 pooled mice). Samples were analyzed by two-way ANOVA. *p<0.05; **p<0.01. For clarity, non-significant values are not shown. (D) Heatmap demonstrating the mean fluorescent intensity of 10 myeloid lineage markers across eight different myeloid cell populations in DM, SDM, and CP. The colour in the heatmap varies from blue for lower expression to red for higher expression. AD, Alzheimer’s disease; UMAP, uniform manifold approximation and projection.
-
Figure 2—source data 1
Frequency of BAMs (CD206+MHCIIlow and CD206+MHCII+), Mdc, and monocytes within the total non-parenchymal CD45+ cell population of the DM, SDM, and CP.
- https://cdn.elifesciences.org/articles/71879/elife-71879-fig2-data1-v2.xlsx
Figure 2—figure supplement 1
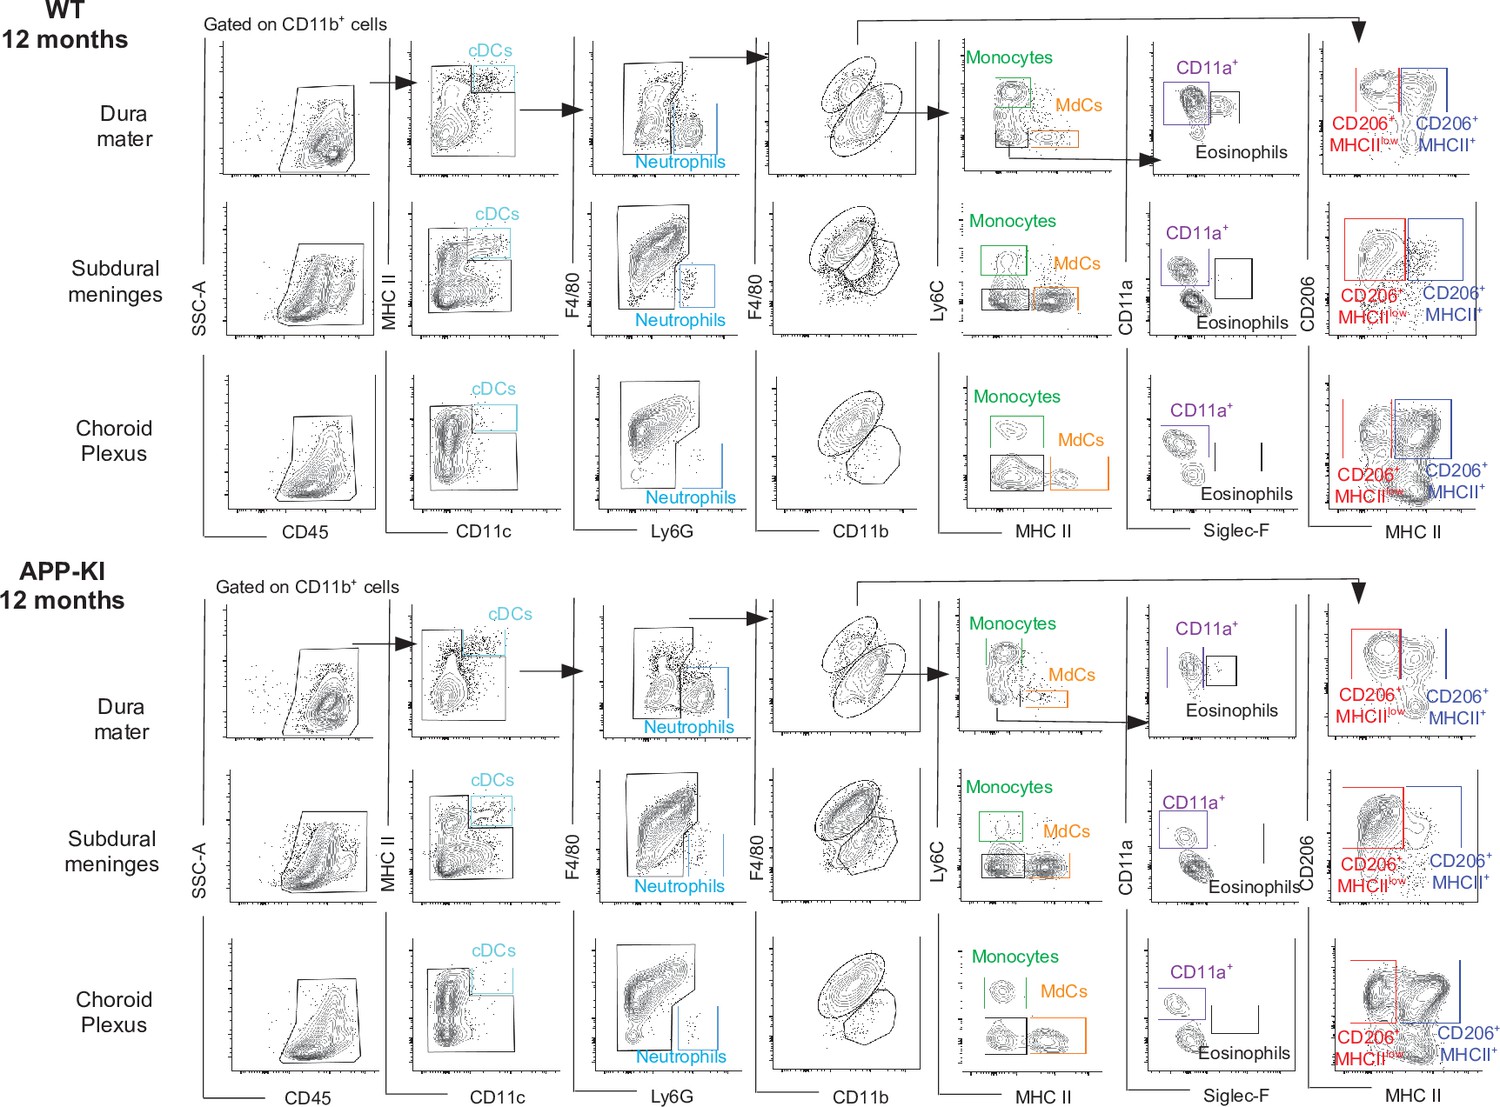
Characterization of myeloid cells in distinct brain border regions in health and AD.
(A) Representative gating strategy used to visualize distinct myeloid cells subpopulations in the dura mater (DM), subdural meninges (SDM), and choroid plexus (CP) of WT and APP-KI mice aged 12 months. Cell classification as shown in the legend of Figure 1. AD, Alzheimer’s disease.
Figure 2—figure supplement 2
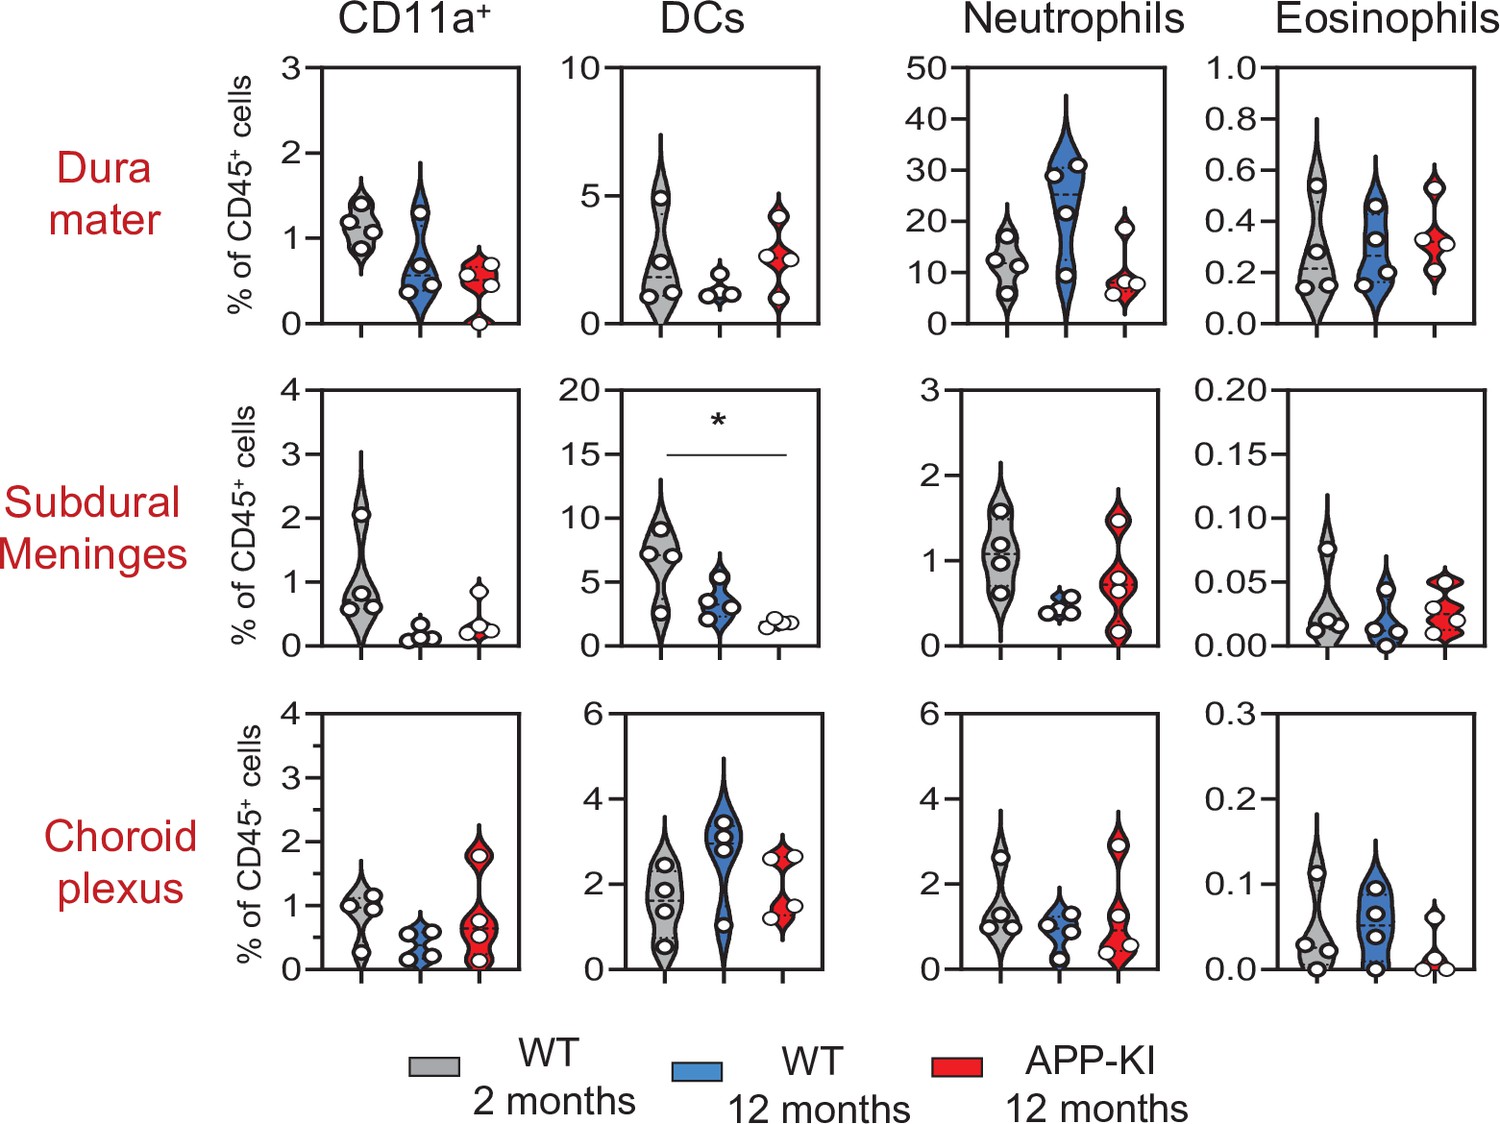
Violin plots with individual dots illustrating the frequency of different myeloid cell populations (CD11a+ macrophages, DCs, neutrophils, and eosinophils) within the total non-parenchymal CD45+ of the DM, SDM, and CP.
Young mice: gray, aged mice: blue, and APP-KI mice: red. Each dot represents the percentage of cells obtained from pooled border regions (n=2–3 pooled mice). Samples were analyzed by two-way ANOVA. *p<0.05; For clarity, non-significant values are not shown. CP, choroid plexus; DM, dura mater; SDM, subdural meninges.
-
Figure 2—figure supplement 2—source data 1
Frequency of different myeloid cell populations (CD11a+ macrophages, DCs, neutrophils, and eosinophils) within the total non-parenchymal CD45+ of the DM, SDM, and CP.
- https://cdn.elifesciences.org/articles/71879/elife-71879-fig2-figsupp2-data1-v2.xlsx
Figure 3
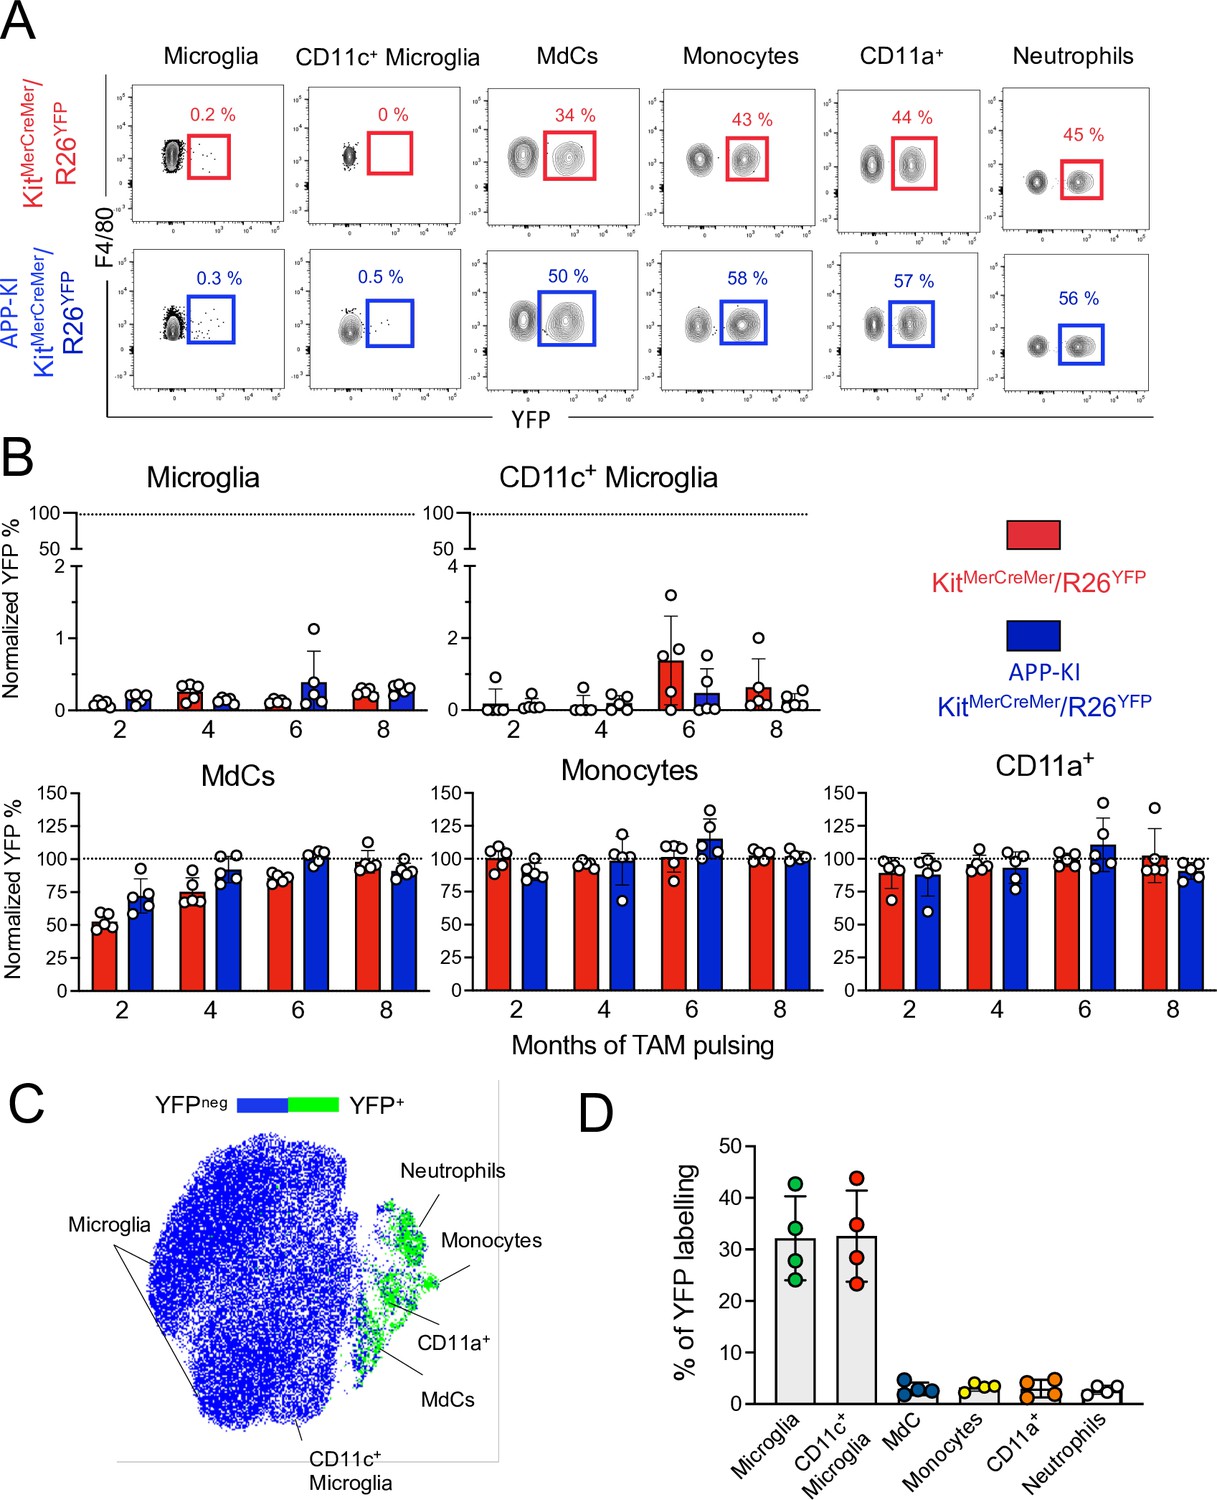
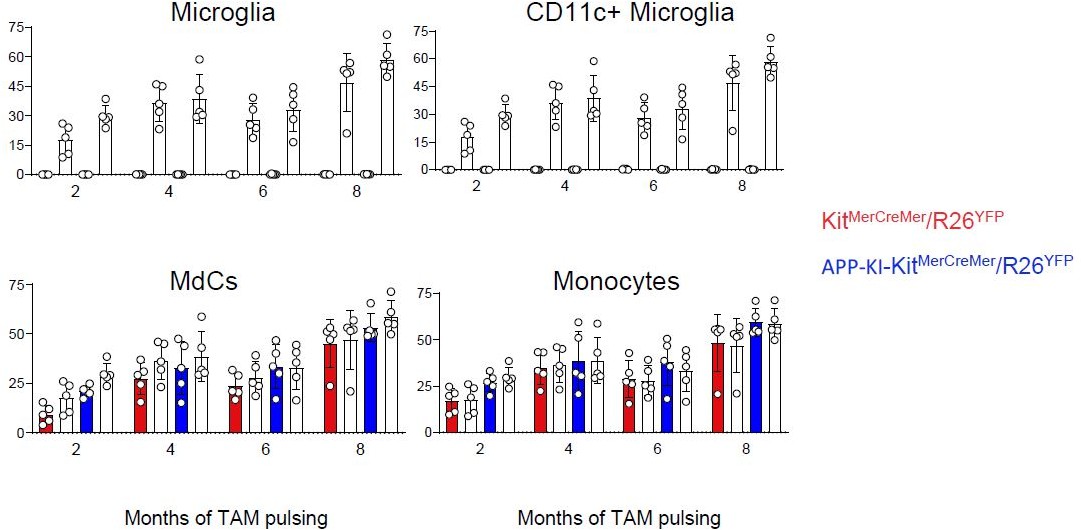
Microglia and disease-associated microglia maintain their embryonic origin during Alzheimer’s disease.
KitMerCreMer/R26YFP and APP-KI/ KitMerCreMer/R26YFP mice (aged 2, 4, 6, and 8 months) received 4 mg tamoxifen (TAM) by oral gavage for 5 consecutive days and were sacrificed at 10 months of age. (A) Representative flow cytometry contour plots indicating the YFP-labeling of parenchymal microglia, activated CD11c+ microglia, MdCs, CD11a+ cells, monocytes, and neutrophils obtained from KitMerCreMer/R26YFP and APP-KI/KitMerCreMer/R26YFP mice ( 8-month labeled mice). (B) Bar charts with individual data points showing the percentage of YFP+ parenchymal microglia, activated CD11c+ microglia, MdCs, monocytes, and CD11a+ cells obtained from KitMerCreMer/R26YFP (red bars) and APP-KI/KitMerCreMer/R26YFP mice (blue bars) after normalization to the percentage of YFP+ neutrophils. Data represent the mean± SD (n=5 mice). Student’s t-test (two-tailed). For clarity, non-significant values are not shown. (C) UMAP representation showing the YFP-labeled myeloid cell populations in green and the YFP-negative fraction in blue. (D) Embryonic fate-mapping. A single pulse of tamoxifen was administered to APP-KI/KitMercreMer/R26YFP pregnant mice at E7.5. Offspring were analyzed at 9 months of age. Bar charts with individual data show the percentages of YFP-labeled parenchymal microglia, activated CD11c+ microglia, MdCs, monocytes, CD11a+ cells and neutrophils. Data represent the mean± SD (n=4 mice). UMAP, uniform manifold approximation and projection.
-
Figure 3—source data 1
Frequency of YFP+ parenchymal microglia, activated CD11c+ microglia, MdCs, monocytes, and CD11a+ cells.
- https://cdn.elifesciences.org/articles/71879/elife-71879-fig3-data1-v2.xlsx
Figure 4 with 2 supplements
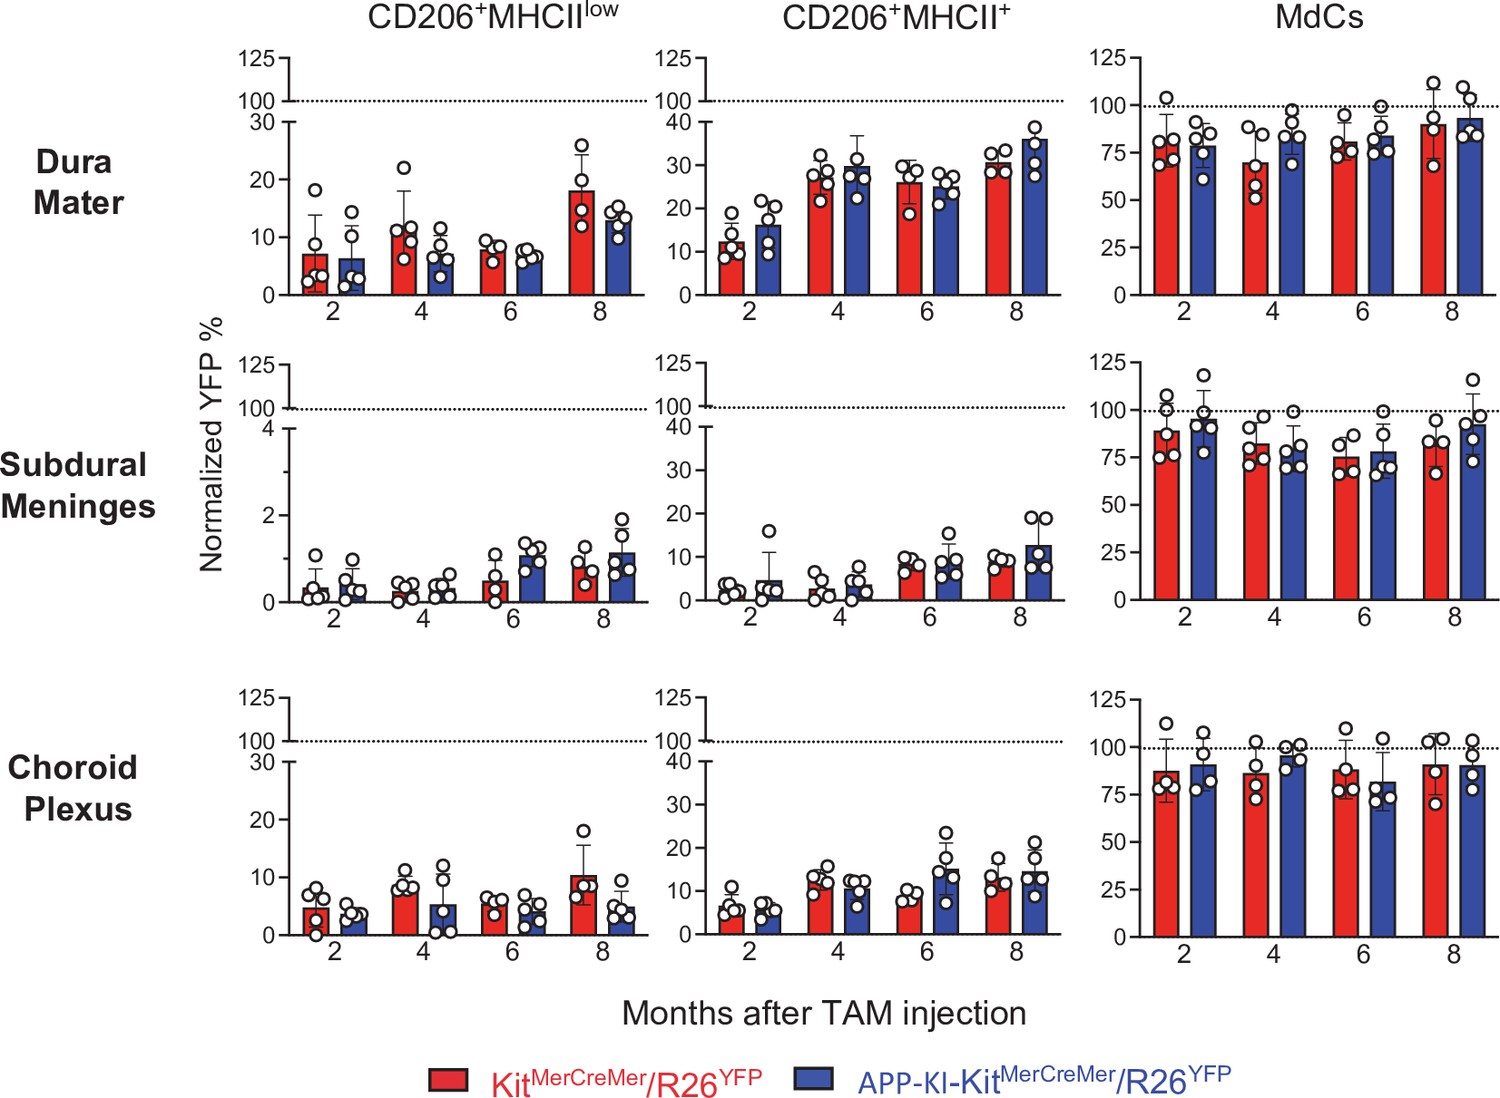
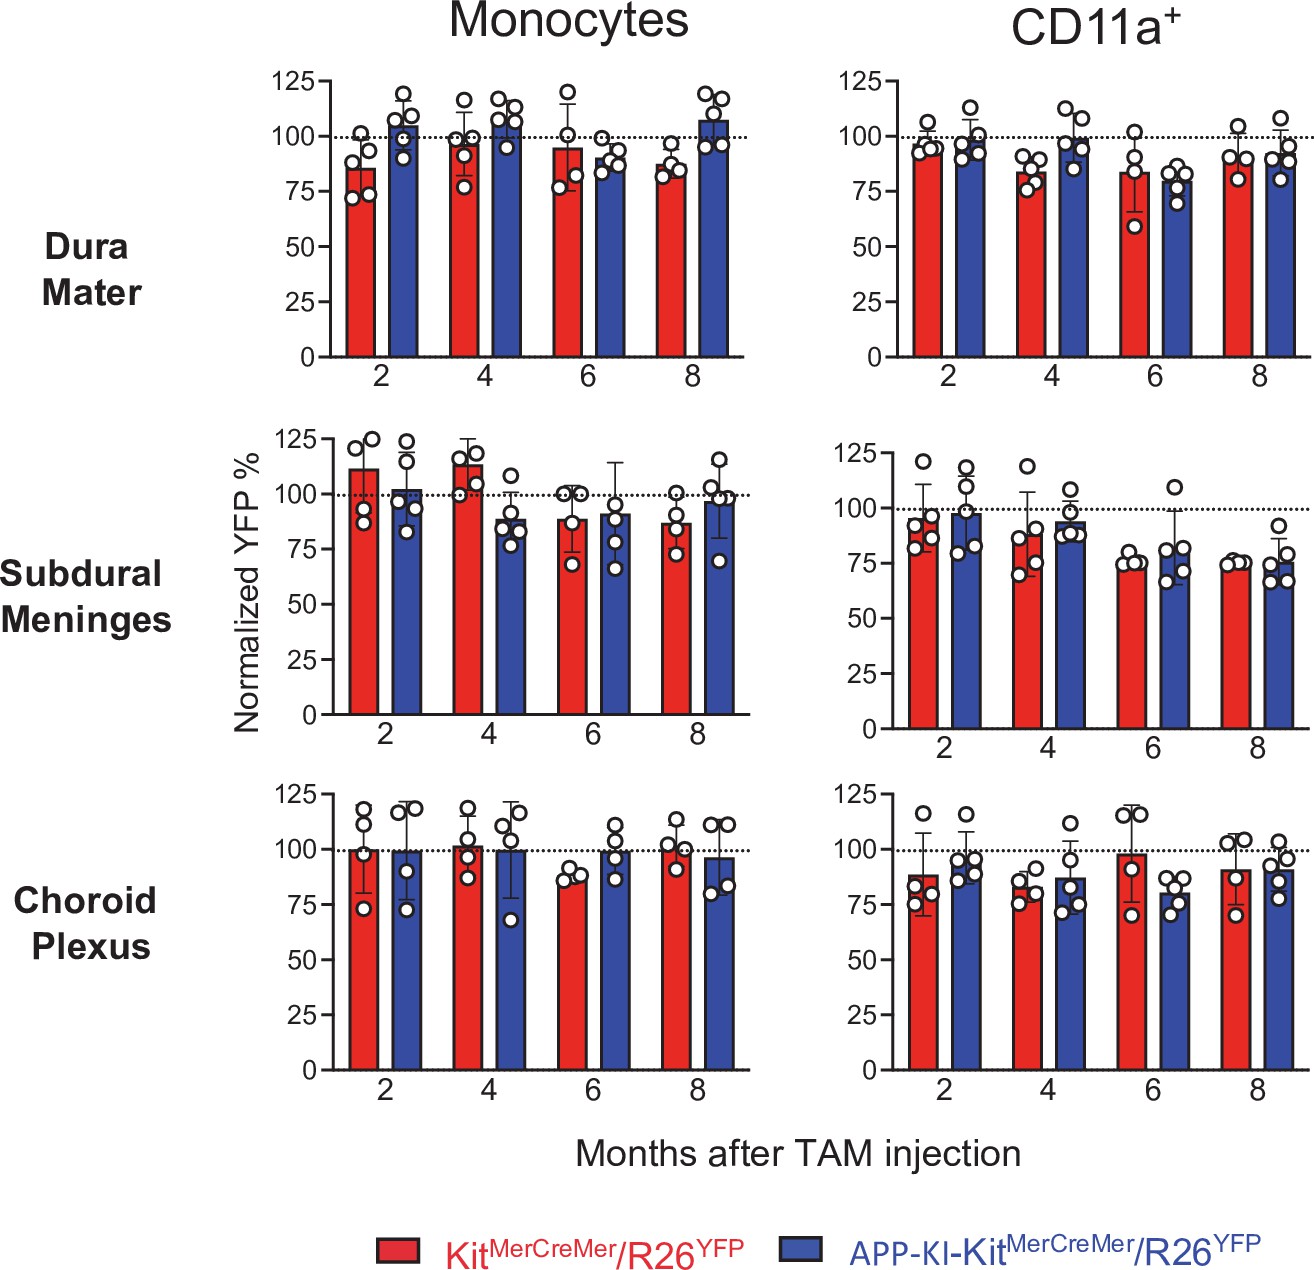
AD does not accelerate the turnover kinetics of border-associated macrophages (BAMs).
Mice were treated and analyzed as described in the legend of Figure 3. Bar charts with individual data points showing the percentages of YFP+ non-parenchymal BAMs (CD206+MHCIIlow and CD206+MHCII+ cells) and MdCs obtained from KitMerCreMer/R26YFP (red bars) and APP-KI/KitMerCreMer/R26YFP mice (blue bars) after normalization to the percentage of YFP+ neutrophils. Upper panel: DM; middle panel: SDM; and lower panel: CP. Data represent the mean± SD (n=4 samples of 2–3 pooled mice). Student’s t-test (two-tailed). For clarity, non-significant values are not shown. AD, Alzheimer’s disease; CP, choroid plexus; DM, dura mater; MdC, monocyte-derived macrophage; SDM, subdural meninges.
-
Figure 4—source data 1
Percentages of YFP+ non-parenchymal BAMs (CD206+MHCIIlow and CD206+MHCII+ cells) and MdCs.
- https://cdn.elifesciences.org/articles/71879/elife-71879-fig4-data1-v2.xlsx
Figure 4—figure supplement 1
Bar charts with individual data points showing the percentages of YFP+ non-parenchymal CD11a+ cells and monocytes obtained from KitMerCreMer/R26YFP (red bars) and APP-KI/KitMerCreMer/R26YFP mice (blue bars) after normalization to the percentage of YFP+ neutrophils.
Data represent the mean± SD (n=4 samples of 2–3 pooled mice). Student’s t-test (two-tailed). For clarity, non-significant values are not shown. Mice were treated and analyzed as described in the legend of Figure 3.
-
Figure 4—figure supplement 1—source data 1
Percentages of YFP+ non-parenchymal CD11a+ cells and monocytes.
- https://cdn.elifesciences.org/articles/71879/elife-71879-fig4-figsupp1-data1-v2.xlsx
Figure 4—figure supplement 2
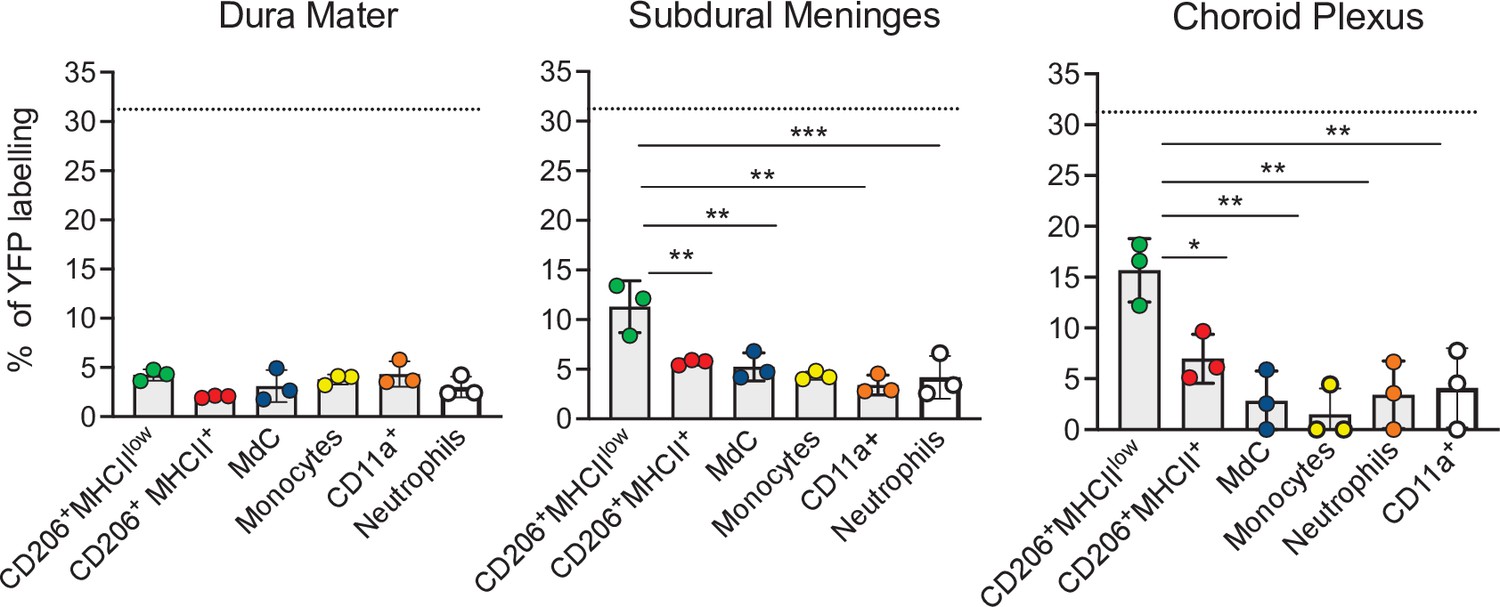
Embryonic E7.5 fate-mapping of border-associated myeloid cells.
Bar charts with individual data show the percentages of YFP-labeled non-parenchymal BAMs (CD206+MHCIIlow and CD206+MHCII+ cells), MdCs, CD11a+ cells, monocytes, and neutrophils. Data represent the mean± SD (n=4 samples of 2–3 pooled mice). Samples were analyzed by two-way ANOVA. *p<0.05; **p<0.01; ***p<0.001. For clarity, non-significant values are not shown. BAM, border-associated macrophage; MdC, monocyte-derived macrophage.
-
Figure 4—figure supplement 2—source data 1
Embryonic E7.5 fate-mapping of border-associated myeloid cells.
- https://cdn.elifesciences.org/articles/71879/elife-71879-fig4-figsupp2-data1-v2.xlsx
Author response image 1

Author response image 2
Tables
Key resources table
| Reagent type (species) or resource | Designation | Source or reference | Identifiers | Additional information |
|---|---|---|---|---|
| Antibody | Anti-CD45(rat, monoclonal) | BD Biosciences | Cat#: 748719; RRID:AB_2873123 | FACS (1:600; 100 μl per test) |
| Antibody | Anti-Siglec-F(rat, monoclonal) | BD Biosciences | Cat#: 746668; RRID:AB_2743940 | FACS (1:600; 100 μl per test) |
| Antibody | Anti-CD11b(rat, monoclonal) | BioLegend | Cat#: 101226; RRID:AB_830642 | FACS (1:600; 100 μl per test) |
| Antibody | Anti-CD11b(rat, monoclonal) | BD Biosciences | Cat#: 565976; RRID:AB_2738276 | FACS (1:600; 100 μl per test) |
| Antibody | Anti-F4/80(rat, monoclonal) | BioLegend | Cat#: 123110; RRID:AB_893486 | FACS (1:600; 100 μl per test) |
| Antibody | Anti-F4/80 (rat, monoclonal) | BioLegend | Cat#: 123114; RRID:AB_893490 | FACS (1:600; 100 μl per test) |
| Antibody | Anti-Ly6c(rat, monoclonal) | BioLegend | Cat#: 128030; RRID:AB_2562617 | FACS (1:600; 100 μl per test) |
| Antibody | Anti-I-A/I-E(rat, monoclonal) | BioLegend | Cat#: 107636; RRID:AB_2734168 | FACS (1:1000; 100 μl per test) |
| Antibody | Anti-CD11c(hamster, monoclonal) | BioLegend | Cat#: 117318; RRID:AB_493568 | FACS (1:600; 100 μl per test) |
| Antibody | Anti-CD11c(hamster, monoclonal) | BioLegend | Cat#: 117336; RRID:AB_2565268 | FACS (1:600; 100 μl per test) |
| Antibody | Anti-P2RY12(rat, monoclonal) | BioLegend | Cat#: 848006; RRID:AB_2721469 | FACS (1:600; 100 μl per test) |
| Antibody | Anti-CD11a(rat, monoclonal) | Invitrogen | Cat#: 48-0111-82; RRID:AB_11064445 | FACS (1:600; 100 μl per test) |
| Antibody | Anti-CD206(rat, monoclonal) | BioLegend | Cat#: 141734; RRID:AB_2629637 | FACS (1:600; 100 μl per test) |
| Antibody | Anti-Ly6G(rat, monoclonal) | BioLegend | Cat#: 127606; RRID:AB_1236494 | FACS (1:600; 100 μl per test) |
| Antibody | Anti-Iba-1(rabbit, polyclonal) | Fujifilm Wako Shibayagi | Cat#: 019-19741; RRID:AB_839504 | IHC (1:200; 100 µl per test) |
| Antibody | Anti-CD11c(hamster, monoclonal) | Self-made | N/A | IHC (1:100; 100 µl per test) |
| Antibody | Anti-amyloid beta (mouse, monoclonal) | IBL-Immuno-Biological- Laboratories Co. | Cat#: 10323; RRID:AB_10707424 | IHC (1:200; 100 µl per test) |
| Antibody | Anti-IgG(goat, polyclonal) | BioLegend | Cat#: 405502RRID:AB_315020 | IHC (1:200; 100 µl per test) |
| Antibody | Anti-IgG(donkey, polyclonal) | BioLegend | Cat#: 406418RRID:AB_2563306 | IHC (1:200; 100 µl per test) |
| Antibody | Anti-IgG(goat, polyclonal) | BioLegend | Cat#: 405308RRID:AB_315011 | IHC (1:200; 100 µl per test) |
| Antibody | Anti CD16/32(rat, monoclonal) | Self-made | N/A | Blocking step (1:100; 1000 μl per sample) |
| Chemical compound, drug | DAPI | Thermo Fisher Scientific | Cat#: D1306 | (1:1000) |
| Chemical compound, drug | Collagenase D | Roche | Cat#: 11088882001 | 1 mg/ml |
| Chemical compound, drug | Dispase II | Gibco | Cat#: 17105041 | 2 U/ml |
| Chemical compound, drug | DNase | Roche | Cat#: 04536282001 | 2 U/ml |
| Chemical Compound, drug | Percoll | Merck | Cat#: P4937-500ML | |
| Chemical compound, drug | Progesterone | Sigma-Aldrich | Cat#: P0130 | 1 mg/mouse |
| Chemical compound, drug | Tamoxifen | Sigma-Aldrich | Cat#: T5648 | For adult labeling, 4 mg TAM for 5 consecutive days by oral gavage; For embryo labeling, pregnant mice (E7.5) were injected via oral gavage once with 2 mg TAM |
| Chemical compound, drug | IMDM | Thermo Fisher Scientific | Cat#: 12440046 | |
| Software, algorithm | FlowJo | TreeStar | FlowJo 10.6RRID:SCR_008520 | |
| Software, algorithm | GraphPad Prism | GraphPad Software | GraphPad 9.0RRID:SCR_002798 | |
| Strain, strain background (mouse) | APPNL-G-F(called APP-KI) | Japan Saito et al., 2014 | ||
| Strain, strain background (mouse) | KitMerCreMer/Rosa26- LSL-eYFP (called KitMerCreMer/R26YFP) | Nanyang Technological University, Singapore Sheng et al., 2015 | ||
| Strain, strain background (mouse) | APP-KI/ KitMerCreMer/R26YFP | Nanyang Technological University, Singapore | Described here |
Additional files
Download links
A two-part list of links to download the article, or parts of the article, in various formats.
Downloads (link to download the article as PDF)
Open citations (links to open the citations from this article in various online reference manager services)
Cite this article (links to download the citations from this article in formats compatible with various reference manager tools)
Microglia and CD206+ border-associated mouse macrophages maintain their embryonic origin during Alzheimer’s disease
eLife 10:e71879.
https://doi.org/10.7554/eLife.71879


