A survey of optimal strategy for signature-based drug repositioning and an application to liver cancer
- State Key Laboratory of Oncogenes and Related Genes, Department of Liver Surgery & Shanghai Cancer Institute, Renji Hospital, Shanghai Jiao Tong University School of Medicine, China
- Key Laboratory of Gastroenterology and Hepatology, Division of Gastroenterology and Hepatology, Renji Hospital, Shanghai Jiao Tong University School of Medicine, China
- Hepatic Surgery Center, Tongji Hospital, Tongji Medical College, Huazhong University of Science and Technology, China
Figures
Figure 1 with 2 supplements
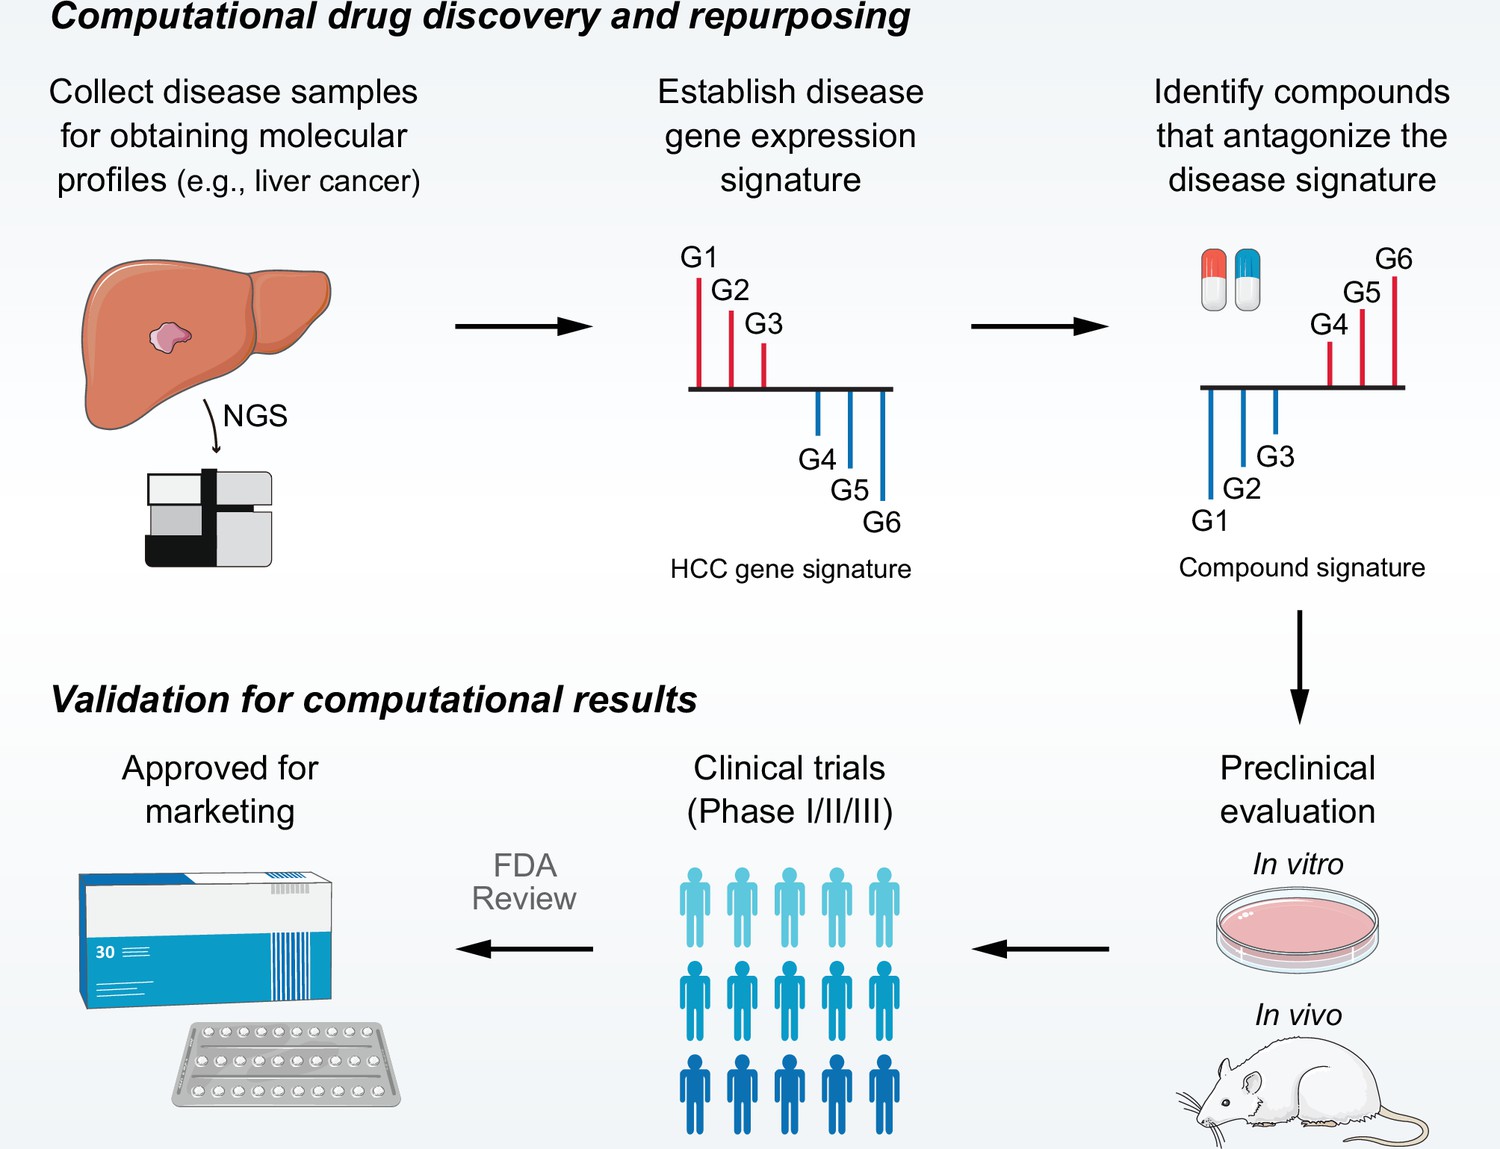
Overview of LINCS data-driven therapeutic discovery.
The working principle of ‘signature reversion’-based computational approach. A disease signature representing discordant expression pattern needs first to be identified (G1, G2, and G3 stand for upregulated genes while G4, G5, and G6 stand for down-regulated genes in disease state). With this signature, pharmacologic perturbation data sets can be queried to find compounds with the ability to reverse disease expression pattern (suppress expression of G1, G2, and G3 and induce expression of G4, G5, and G6). After determining the candidate compounds, experimental and clinical validation are required to translate computational findings to clinical applications. LINCS, Library of Integrated Network-based Cellular Signatures.
Figure 1—figure supplement 1
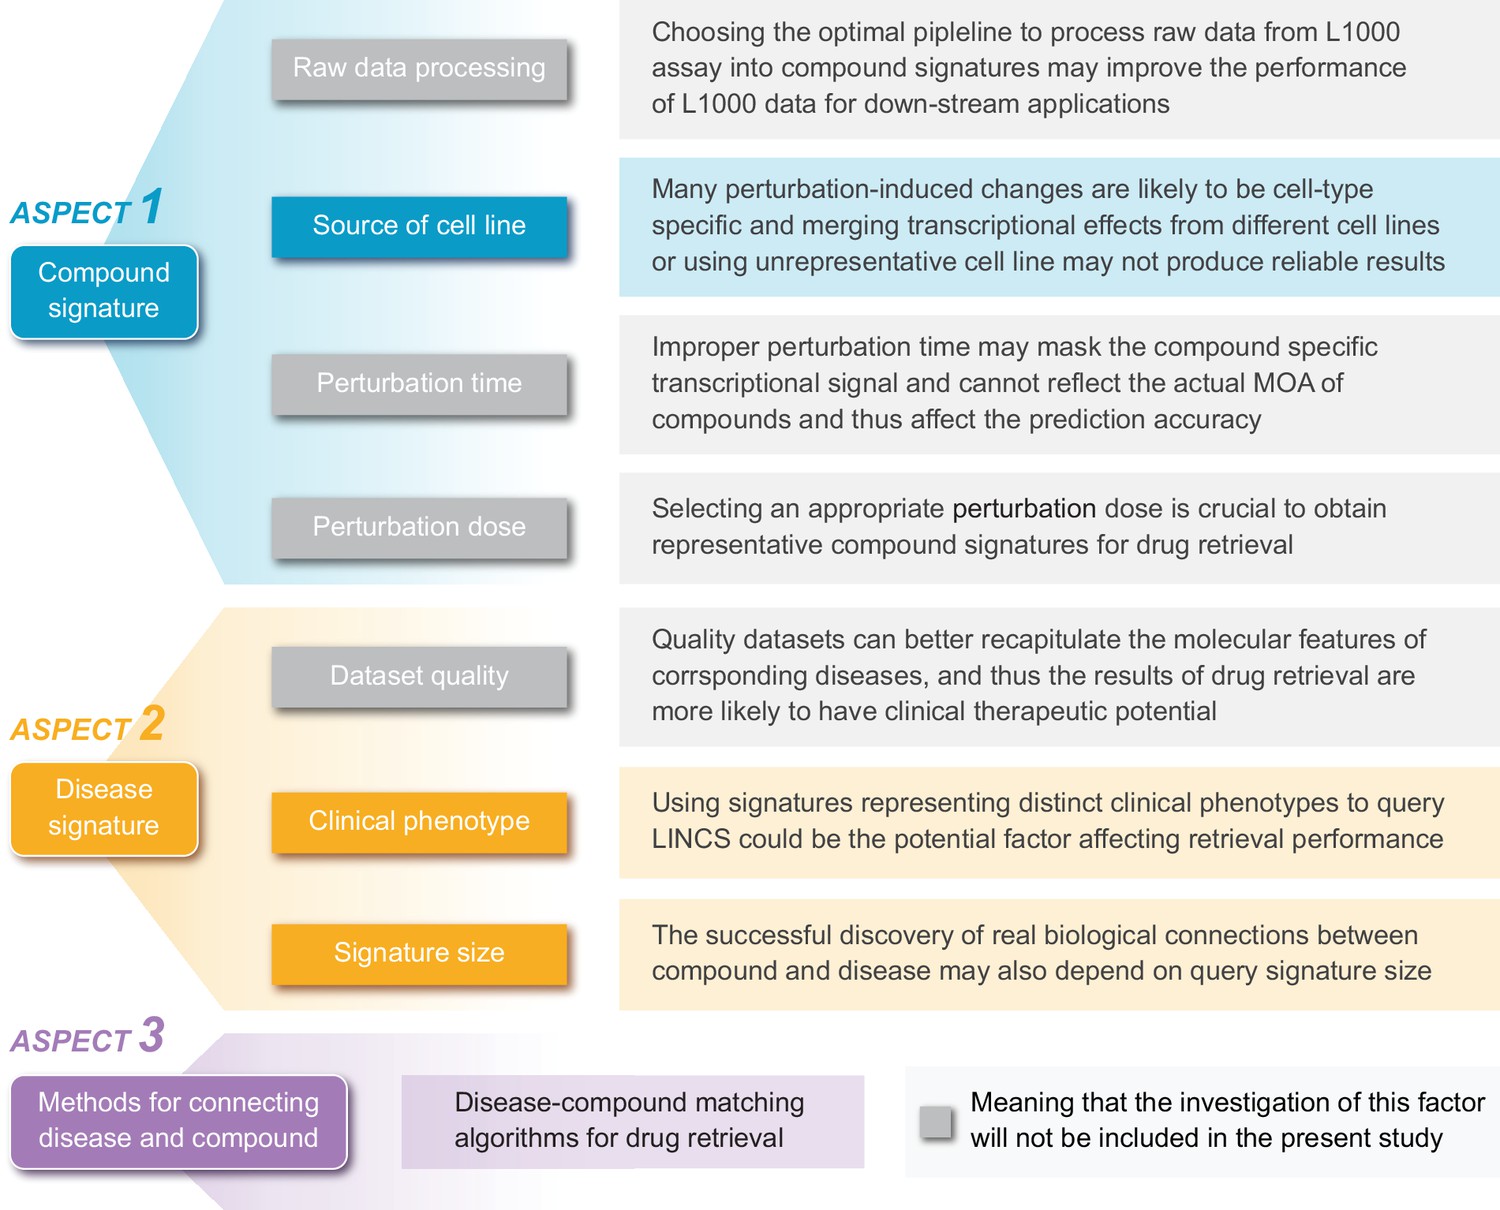
A summary of potential factors influencing the accuracy of signature reversion-based computational approach.
Within the framework of this approach, there are mainly three components: compound signature, disease signature, and signature matching methods. Each component is likely to be influenced by several factors. In addition to the brief descriptions illustrated in this figure, we also discussed these factors in more detail in Supplementary Discussion.
Figure 1—figure supplement 2
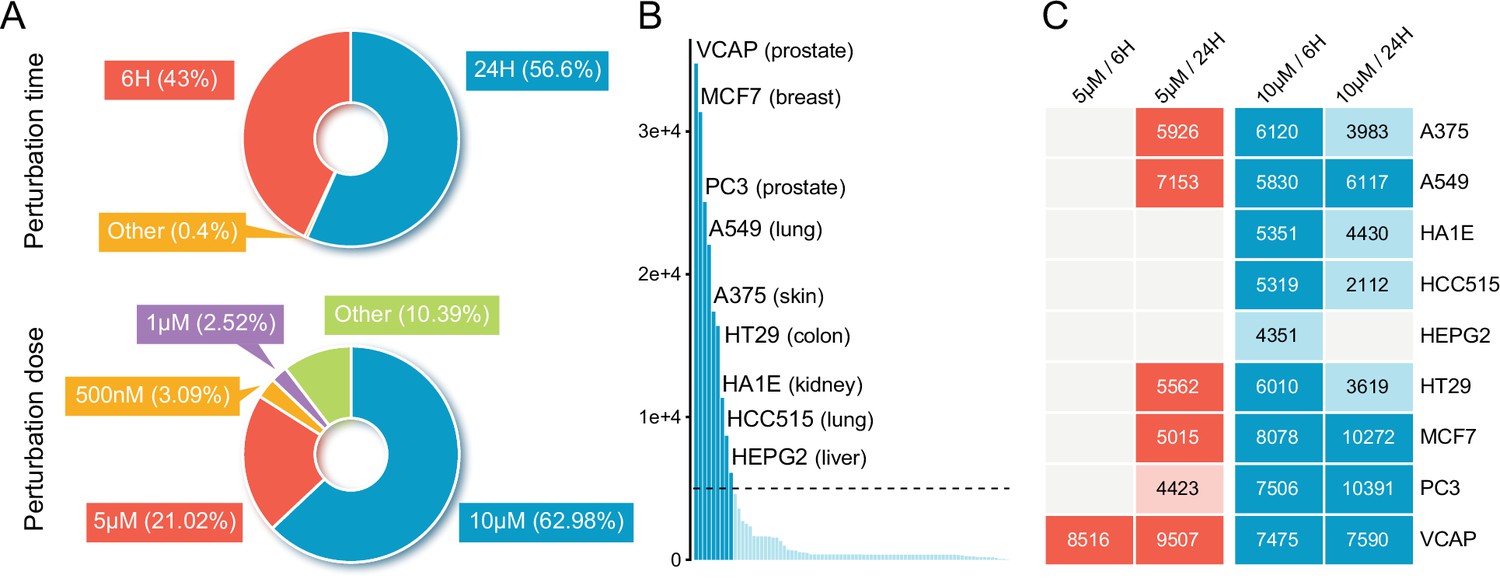
An overview of compound-induced expression profiles in LINCS.
(A) The distribution of compound profiles of different perturbation times (upper) and concentrations (lower) across all the compound experiments in LINCS data set. (B) The profile count distribution of all 71 cell lines in LINCS. Each bar represents the number of available compound profiles per cell line. The nine most profiled cell lines were labeled in the figure. (C) Heatmap integrating annotation of the cell lines with perturbation time and concentration. The specific values have not been displayed if there are less than 2000 profiles in the combination of cell line and experimental conditions. LINCS, Library of Integrated Network-based Cellular Signatures.
Figure 2 with 1 supplement
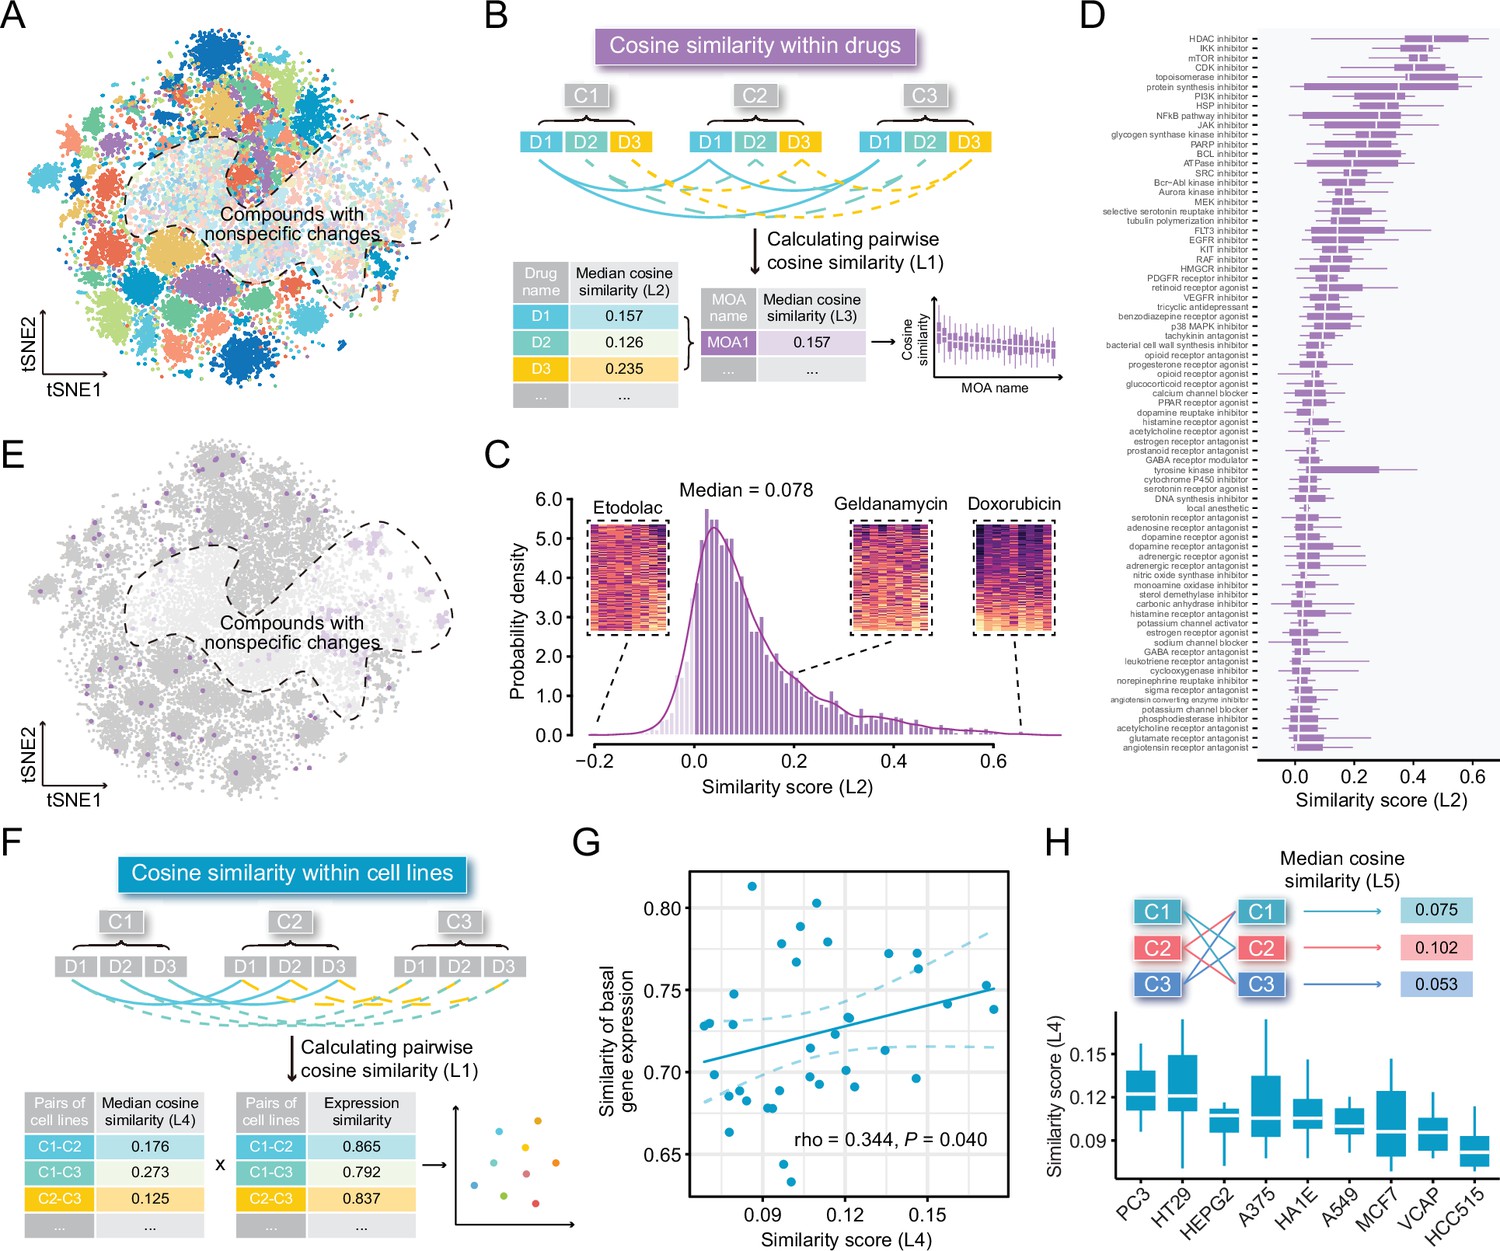
Highly cell-type specific compound-induced expression changes.
(A) Two-dimensional t-SNE projection based on cosine distance between compound signatures. Each dot represents a unique perturbation-induced expression profile, and each color represents one type of cell line. Drug perturbation data was obtained from GSE92742 and GSE70138. (B) Schematic diagram displaying the calculation process of compound-level (L2) and MOA-level (L3) similarity scores. (C) Distribution of compound-level (L2) cosine similarity scores, which range from –1 (completely opposite pattern) to 1 (perfectly identical pattern). Three examples are presented (left to right: etodolac, geldanamycin, and doxorubicin). (D) Illustration of MOA-level (L3) similarities. Only MOAs with more than five compounds included are shown in the figure. (E) A t-SNE projection showing the distribution of compounds (indicated by purple dots) in top ranked five MOAs (including HDAC inhibitors, IKK inhibitors, mTOR inhibitors, CDK inhibitors, and topoisomerase inhibitors). (F) Schematic diagram displaying the calculation process of cell line pair-level (L4) similarity scores. (G) Correlation between basal expression similarities and perturbed expression similarities (L4) of 36 cell line pairs (nine cell lines in total). Statistical significance and correlation coefficient were determined by ranked-based Spearman correlation. (H) Schematic view of the calculation of cell line-level (L5) similarity scores (upper) and the presentation of L5 similarity scores of nine cell lines in the boxplot (lower). Data are presented as median±quartiles. MOA, mechanism of action; t-SNE, t-distributed stochastic neighbor embedding.
Figure 2—figure supplement 1
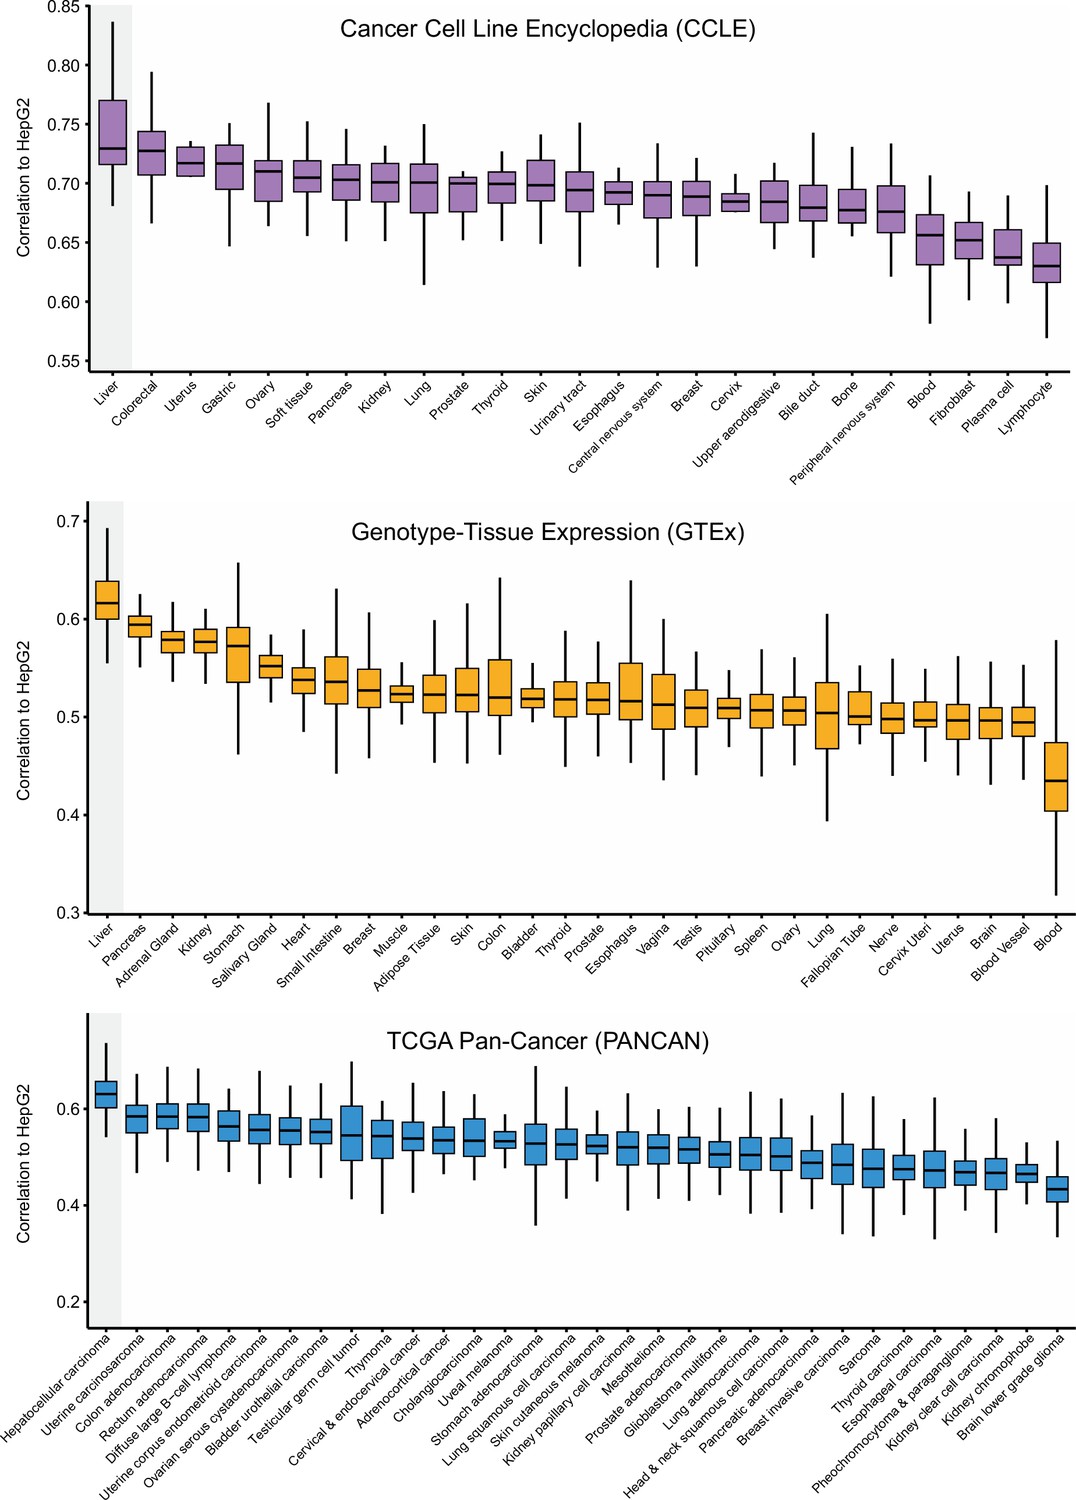
Correlations between HepG2 cell line and other cancer cell lines or normal/tumor tissues.
Expression data were derived from CCLE, GTEx, and TCGA Pan-Cancer, respectively. Correlations were determined by ranked-based Spearman correlation analysis. The line within the boxes represents the median value, the bottom and top of the boxes denote the interquartile range, and the vertical line represents 1.5 times the interquartile range.
Figure 3
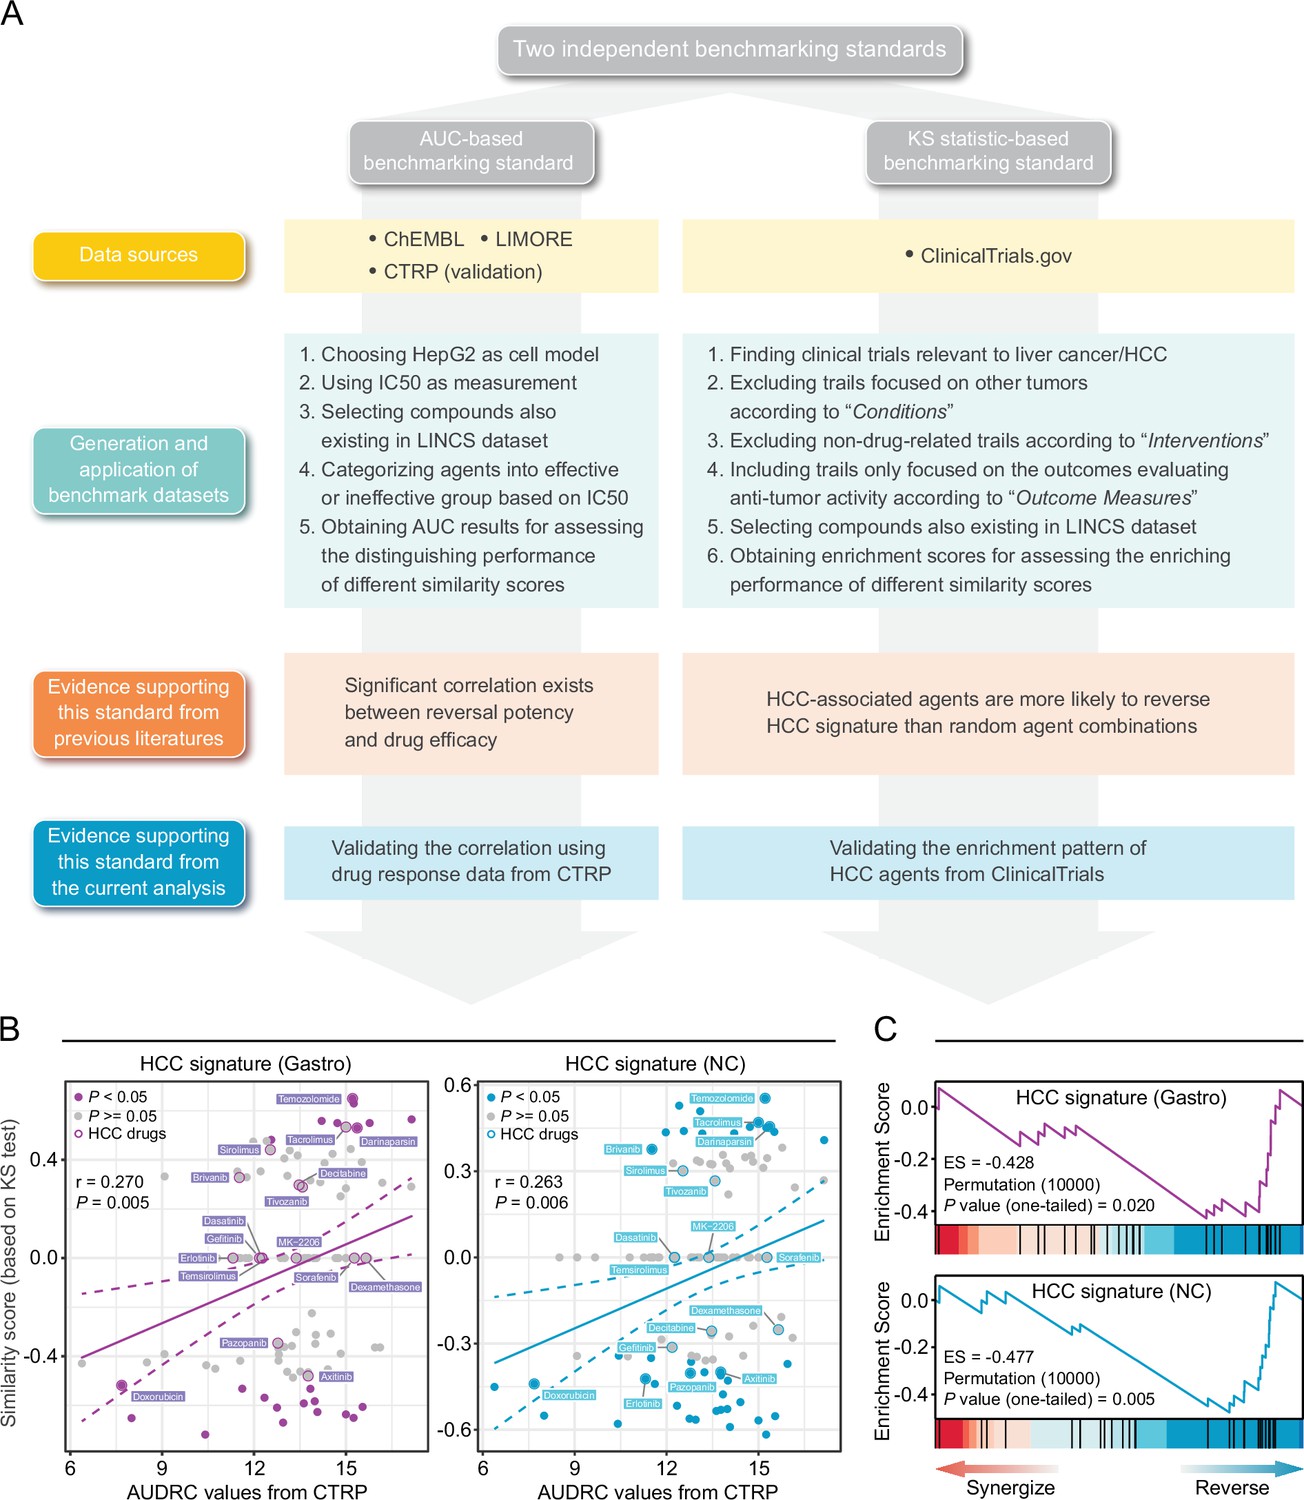
Establishment of novel benchmarking standards.
(A) Flow chart of the data collection and hypothesis validation for the AUC-based (left) and KS statistic-based (right) benchmarking standards. (B) Correlation between drug efficacy (AUDRC values) and reversal potency (KS-based similarity scores). Two previously published query signatures, including Siggastro (left) and SigNC (right), were utilized to calculate similarity scores. Drug response data was achieved from CTRP data set. Note that lower similarity scores indicate higher reversal potency and lower AUDRC values imply greater drug sensitivity. Color toward gray indicates no statistical significance determined by KS test. (C) Reversal potency of HCC agents demonstrated by enrichment analysis. Siggastro (upper) and SigNC (lower) were used to compute similarity scores. AUC, area under the curve; HCC, hepatocellular carcinoma; KS, Kolmogorov-Smirnov.
Figure 4 with 2 supplements
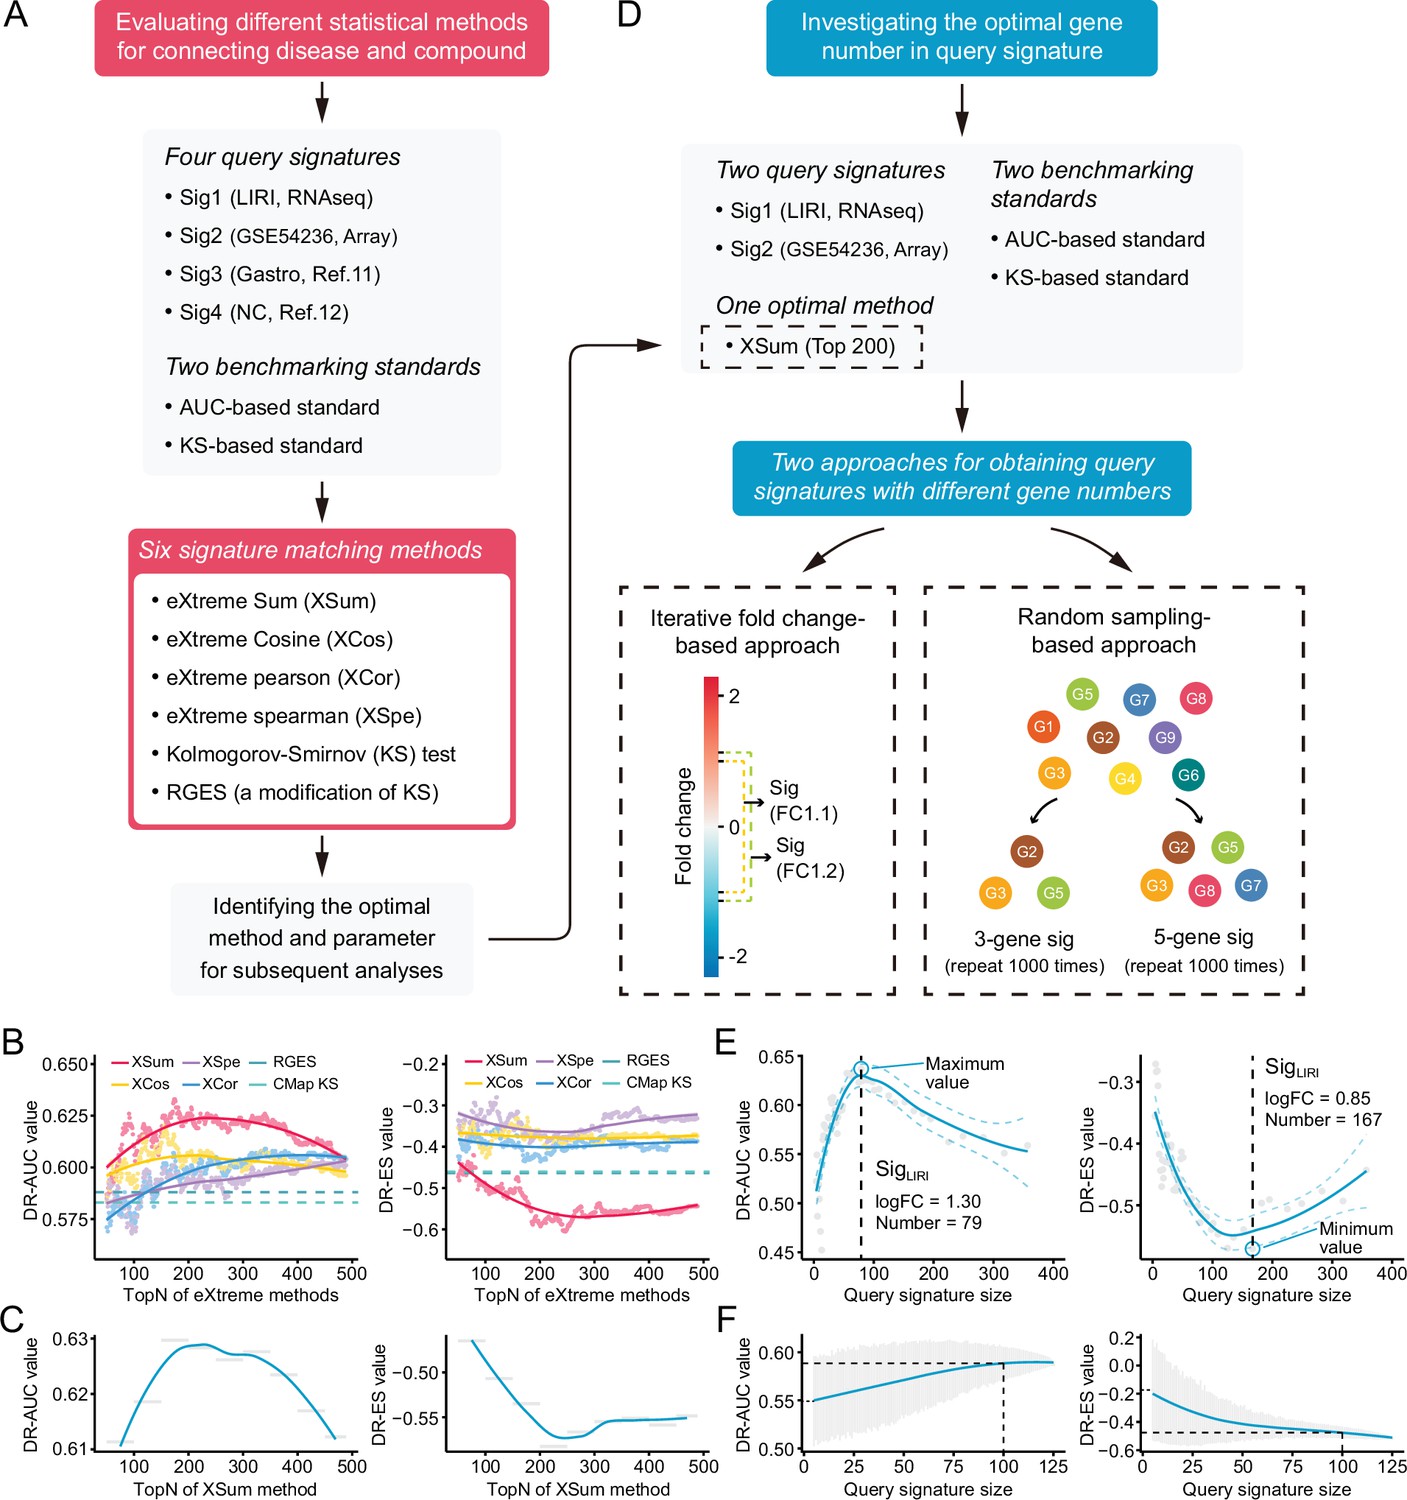
Benchmarking different methodologies and parameters.
(A) Diagram summarizing the workflow and the important components involved in the evaluation process of drug retrieval performance of six different signature matching methods. (B) Retrieval performance of six matching methods evaluated by AUC-based benchmarking standard (left) and KS statistic-based benchmarking standard (right). Query signature was generated based on LIRI cohort. (C) Visualization of AUC-based (left) and KS statistic-based (right) performance measurements of XSum method on standardized data for discerning the optimal operating parameter. (D) Diagram summarizing the workflow and the important components associated with the investigation process of the optimal query signature size. (E) Relationship between query signature size determined by iterative fold change-based approach and retrieval performance evaluated by AUC-based standard (left) and KS statistic-based standard (right). (F) Relationship between query signature size determined by random sampling-based approach and retrieval performance evaluated by AUC-based standard (left) and KS statistic-based standard (right). LOESS polynomial regression analysis was performed for curve fitting. AUC, area under the curve; KS, Kolmogorov-Smirnov.
Figure 4—figure supplement 1
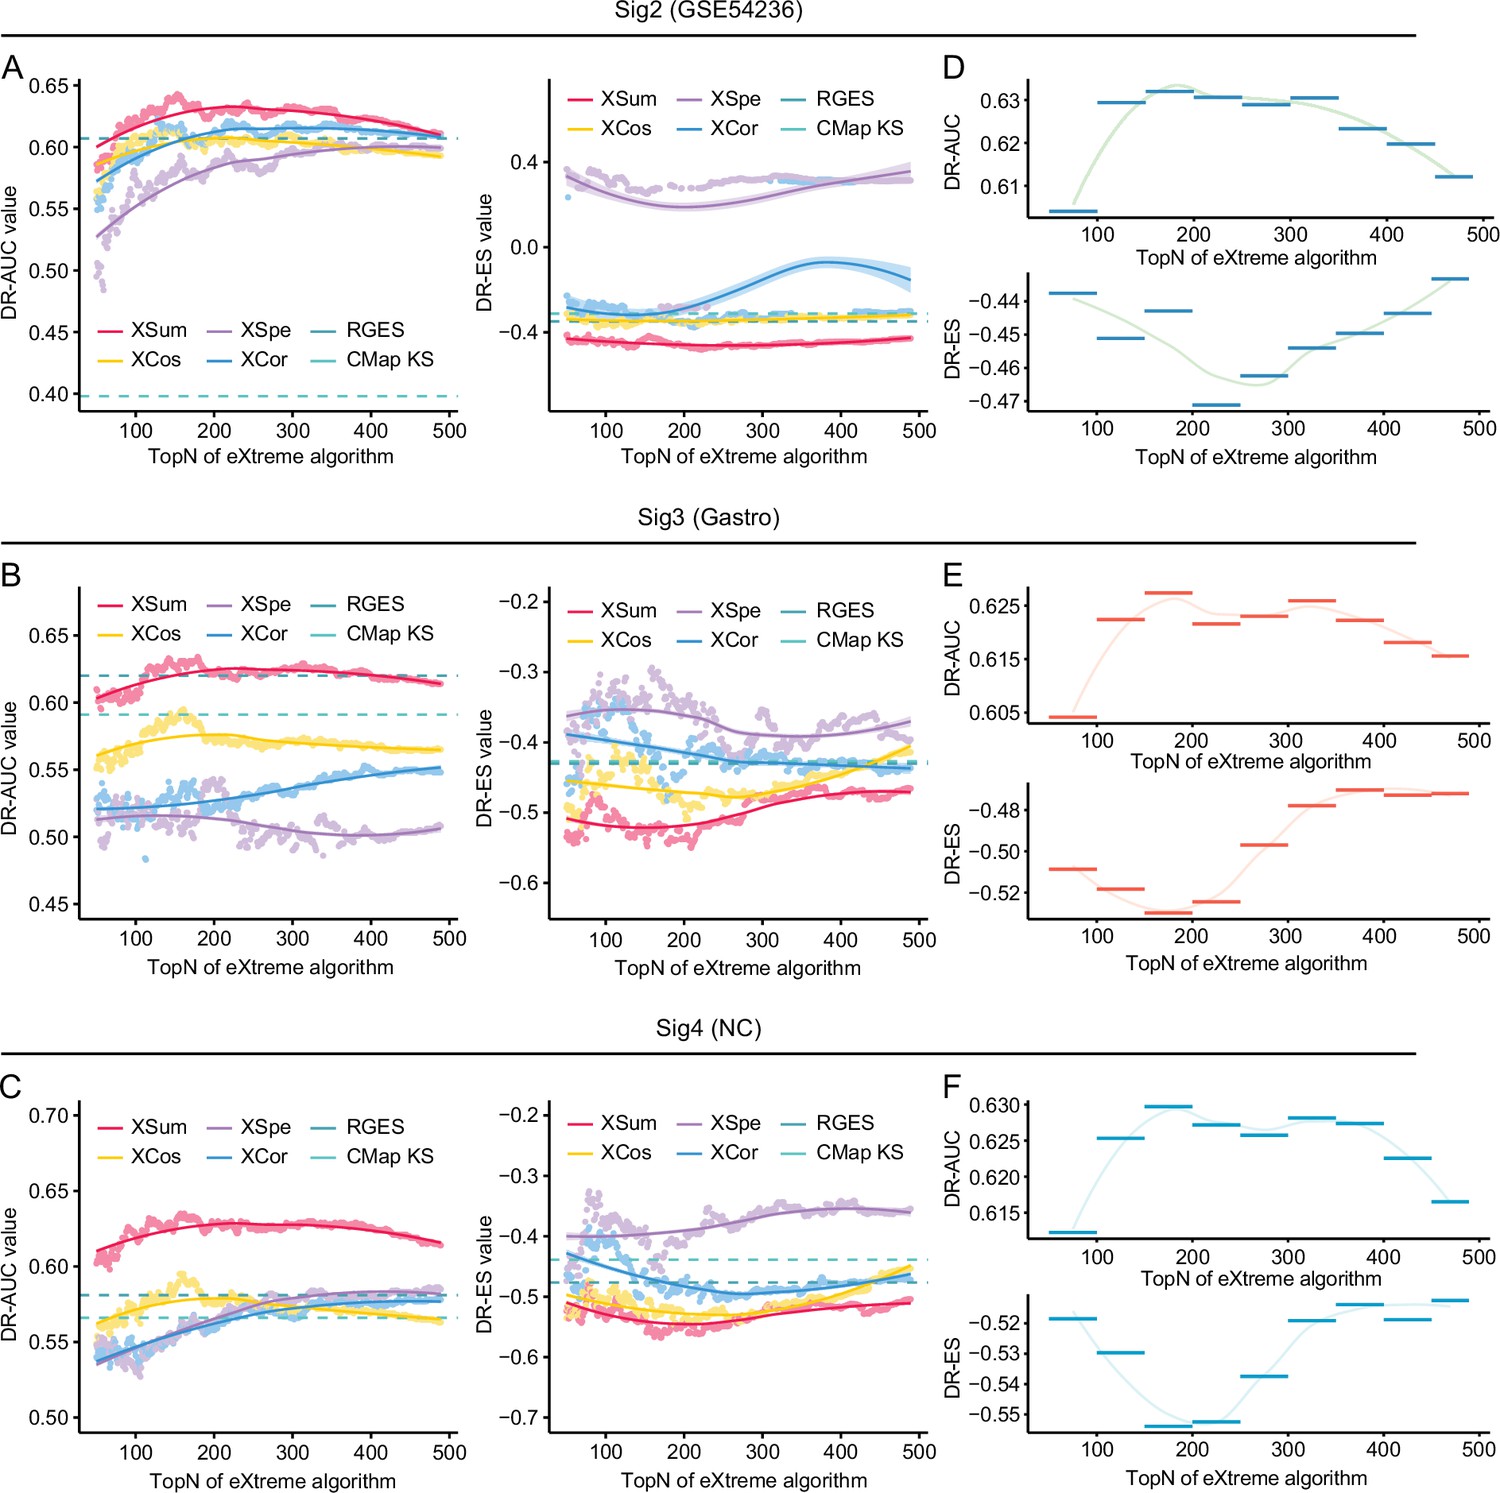
Benchmarking methodologies and parameters in the conditions of using different query signatures.
Retrieval performance of six matching methods evaluated by AUC-based benchmarking standard (left) and KS statistic-based benchmarking standard (right) in the conditions of using SigGSE54236 (A), Siggastro (B), and SigNC (C) for querying LINCS. AUC-based (upper) and KS statistic-based (lower) standardized performance measurements of XSum method in the conditions of using SigGSE54236 (D), Siggastro (E), and SigNC (F) as query signatures. AUC, area under the curve; KS, Kolmogorov-Smirnov.
Figure 4—figure supplement 2
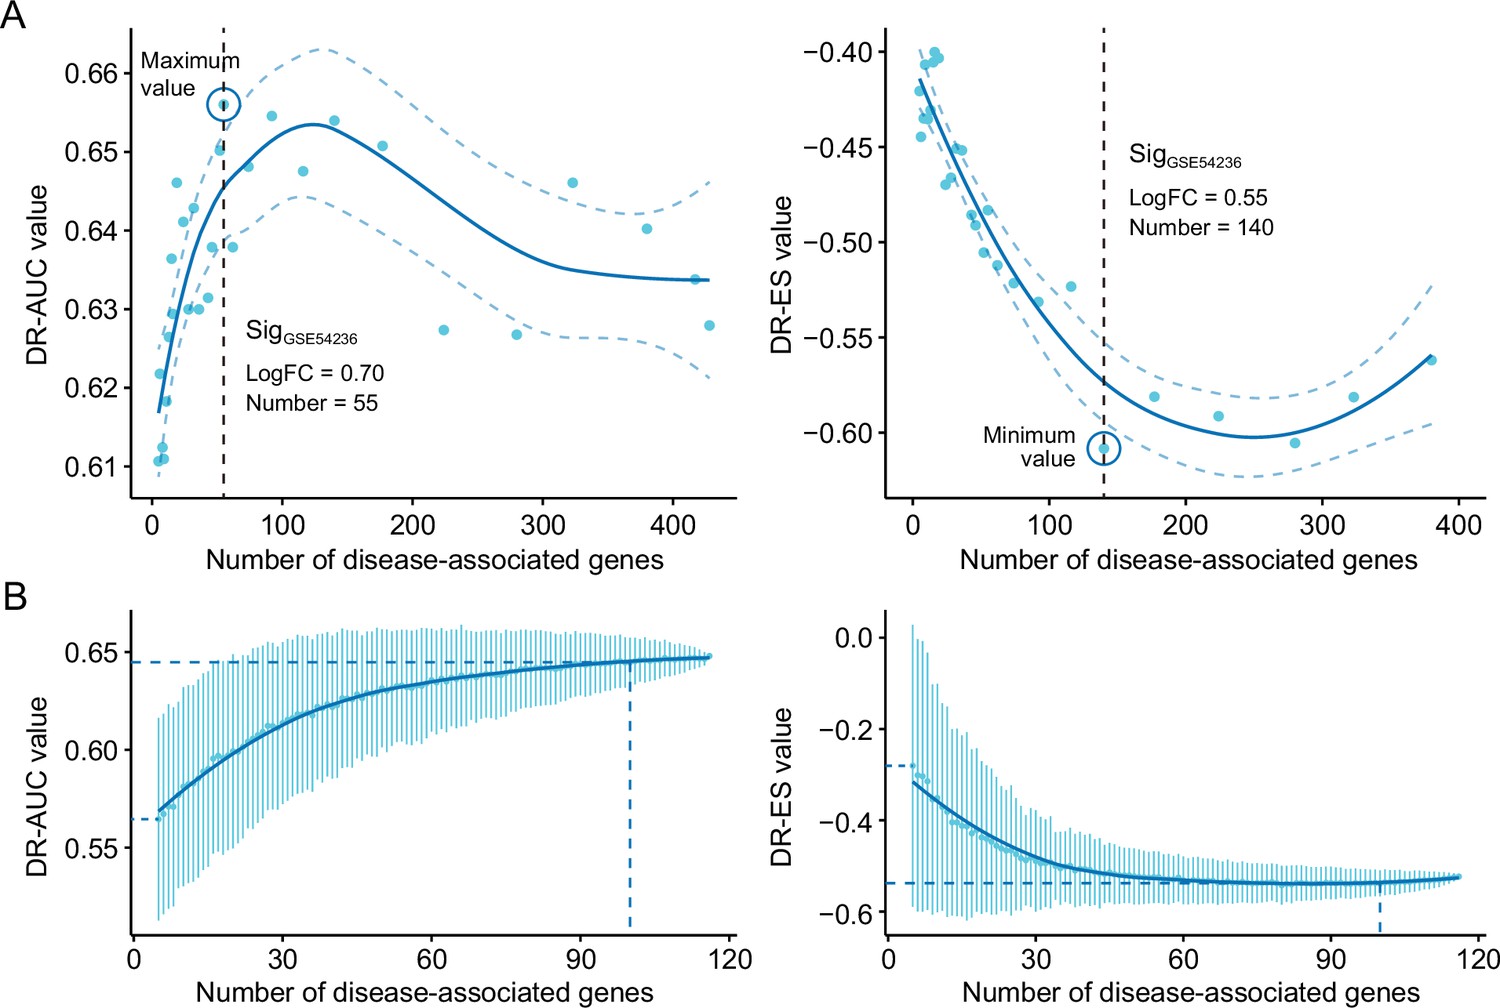
The influences of query signature size on retrieval performance.
Relationship between query signature size determined by iterative fold change-based approach (A) or random sampling-based approach (B) and retrieval performance evaluated by AUC-based standard (left) and KS statistic-based standard (right). GSE54236 cohort was used for generating candidate query signatures for evaluation. AUC, area under the curve; KS, Kolmogorov-Smirnov.
Figure 5 with 1 supplement
Necessary properties of a good query signatures.
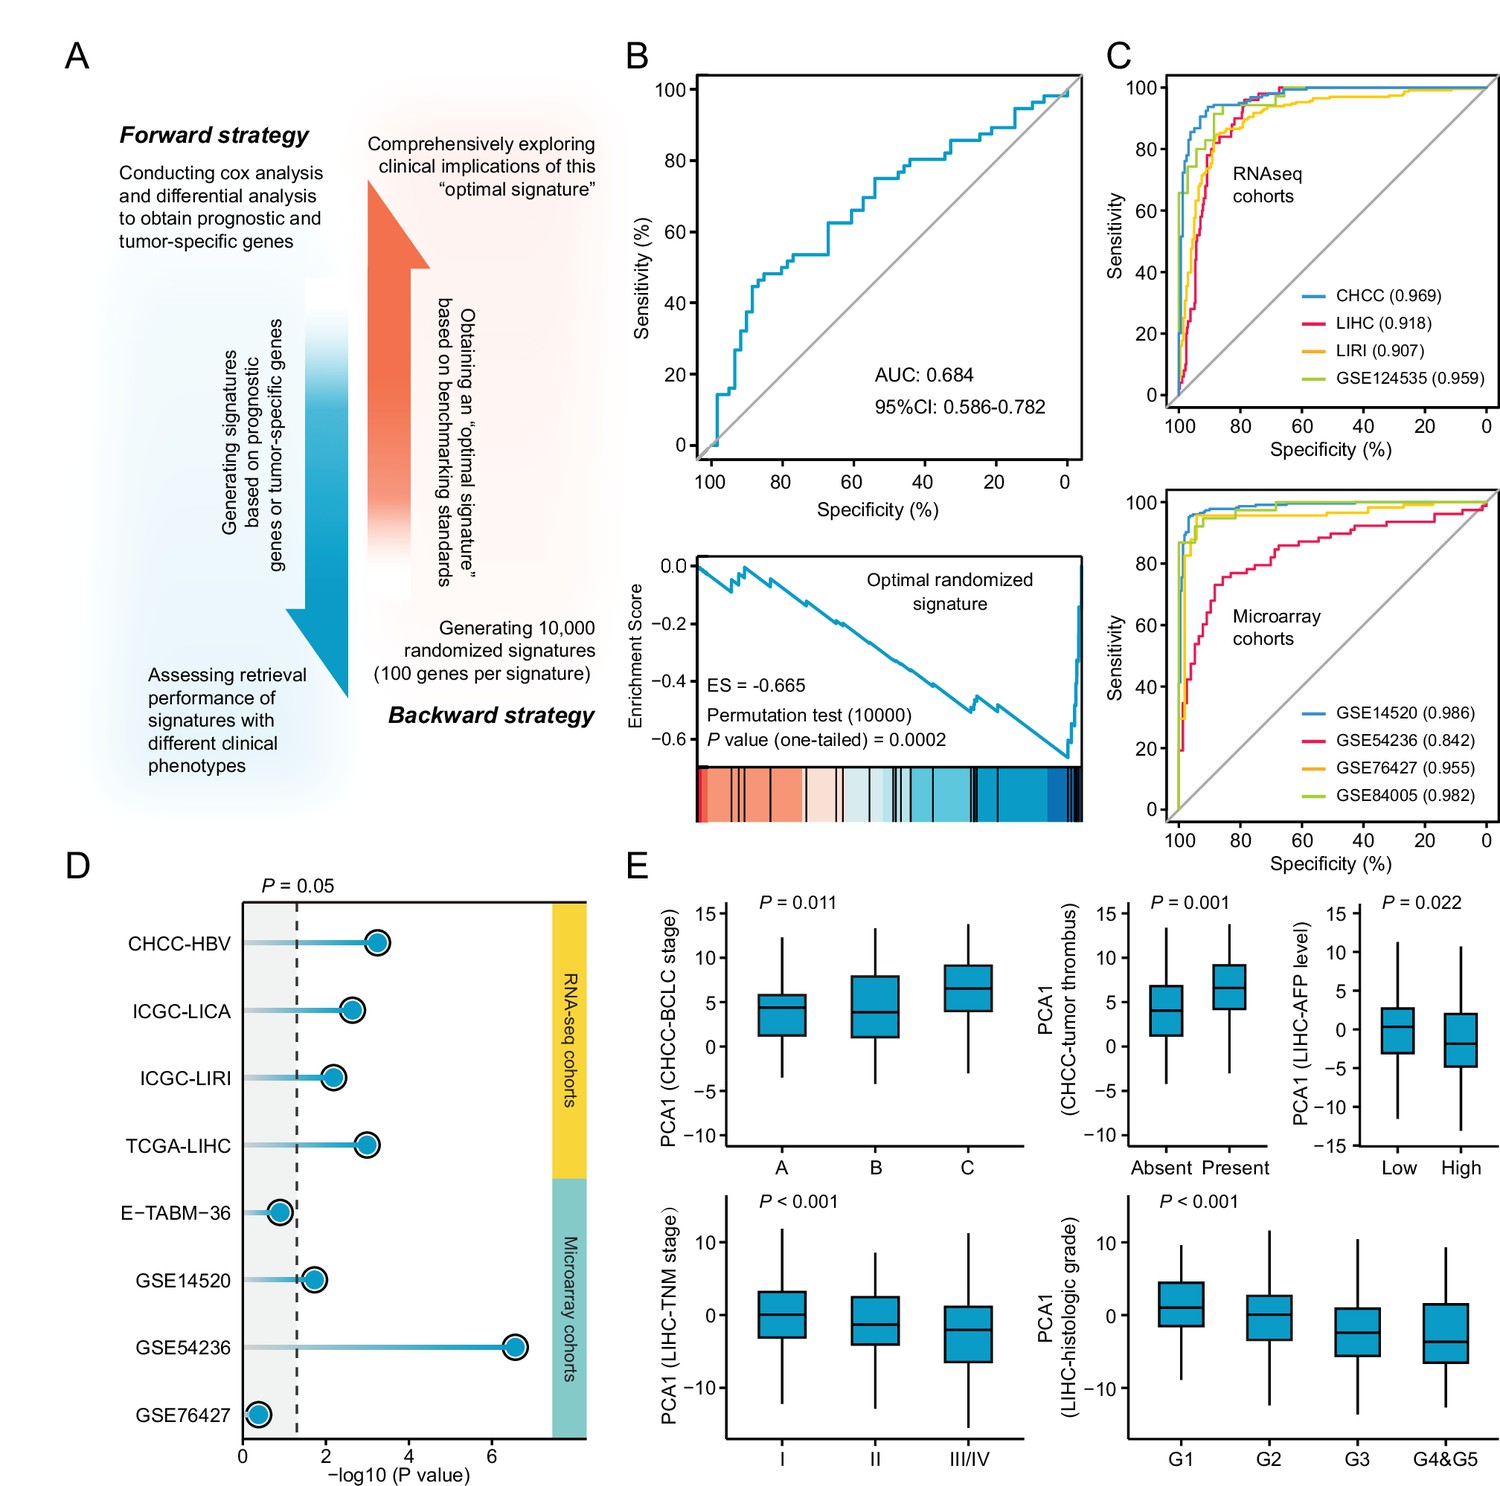
(A) Schematic illustration of forward and backward strategy adopted to investigate whether the factor associated with clinical phenotype of query signature can affect computational therapeutic discovery. (B) The DR-AUC value and DR-ES value of the optimal randomized signature showed by ROC curve (upper) and enrichment plot (lower). (C) The association between the optimal signature and the clinical phenotype of discordant expression pattern suggested by ROC curves based on RNA sequencing cohorts (upper) and Microarray cohorts (lower). (D) The association between the optimal signature and the clinical phenotype of prognosis. Color toward gray indicates no statistical significance. (E) The association between the optimal signature and multiple clinical features, including BCLC and TNM stage, tumor thrombus, AFP level, and histologic grade. Data are presented as median±quartiles. N≥100. Statistical significance of difference between groups was determined using either Kruskal-Wallis or Wilcoxon sum rank tests.
Figure 5—figure supplement 1
The influences of query signature phenotype on retrieval performance.
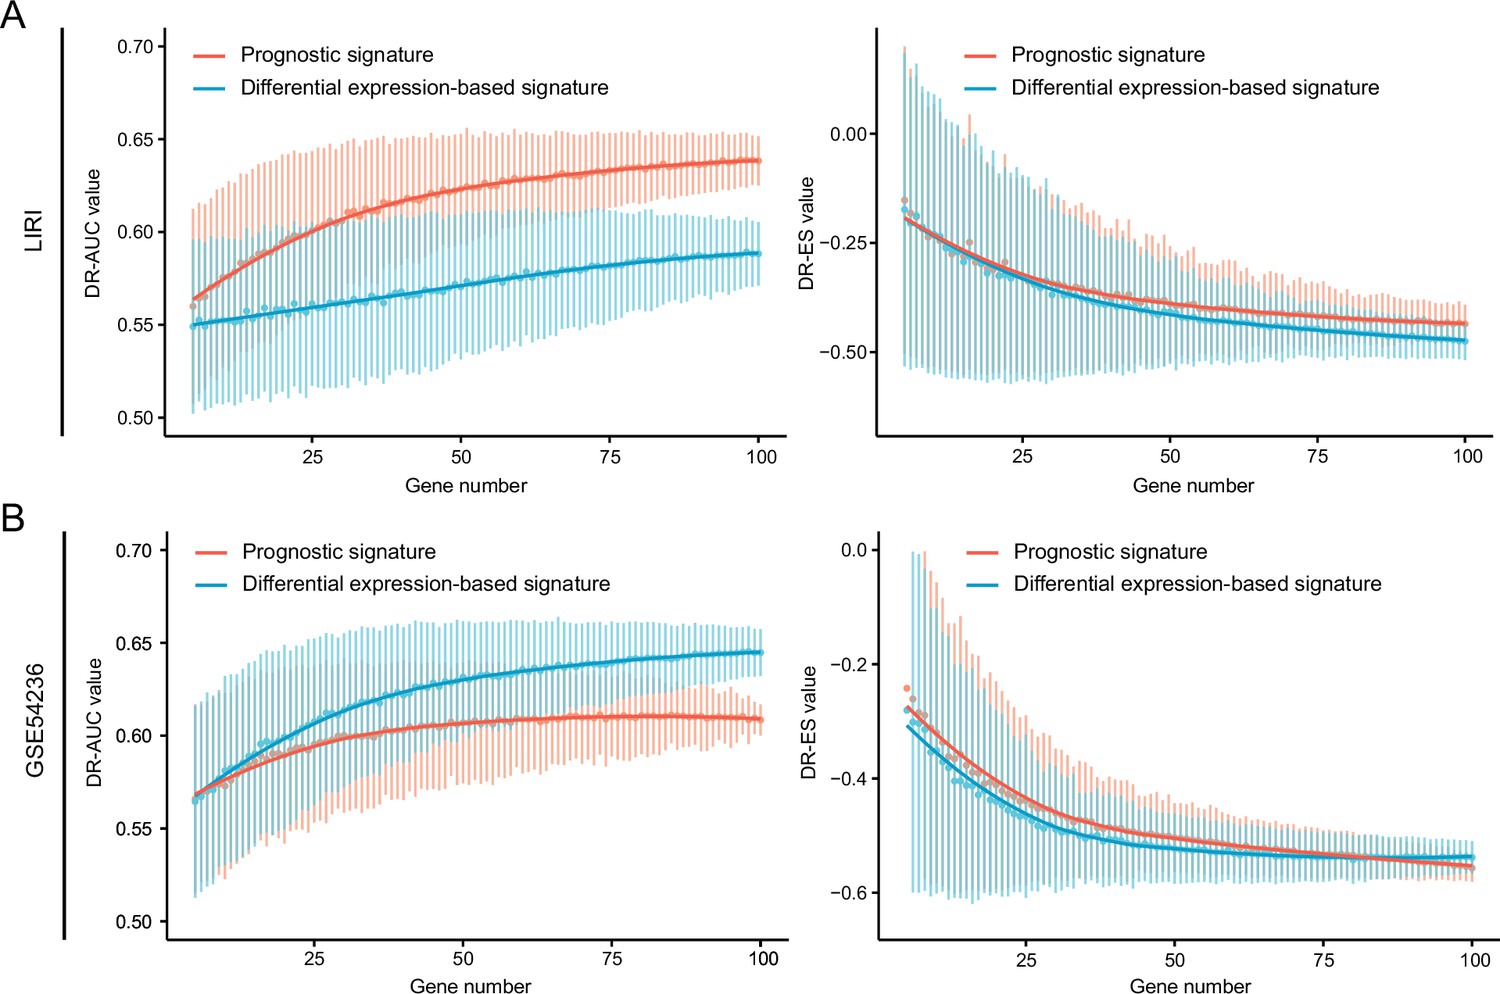
Comparison of retrieval performance evaluated by AUC-based standard (left) and KS statistic-based standard (right) between prognosis-associated signatures and discordant expression-associated signatures generated by LIRI cohort (A) or GSE54236 cohort (B). AUC, area under the curve; KS, Kolmogorov-Smirnov.
Figure 6 with 2 supplements
Development of a novel signature representing the initiation and progression of liver cancer.
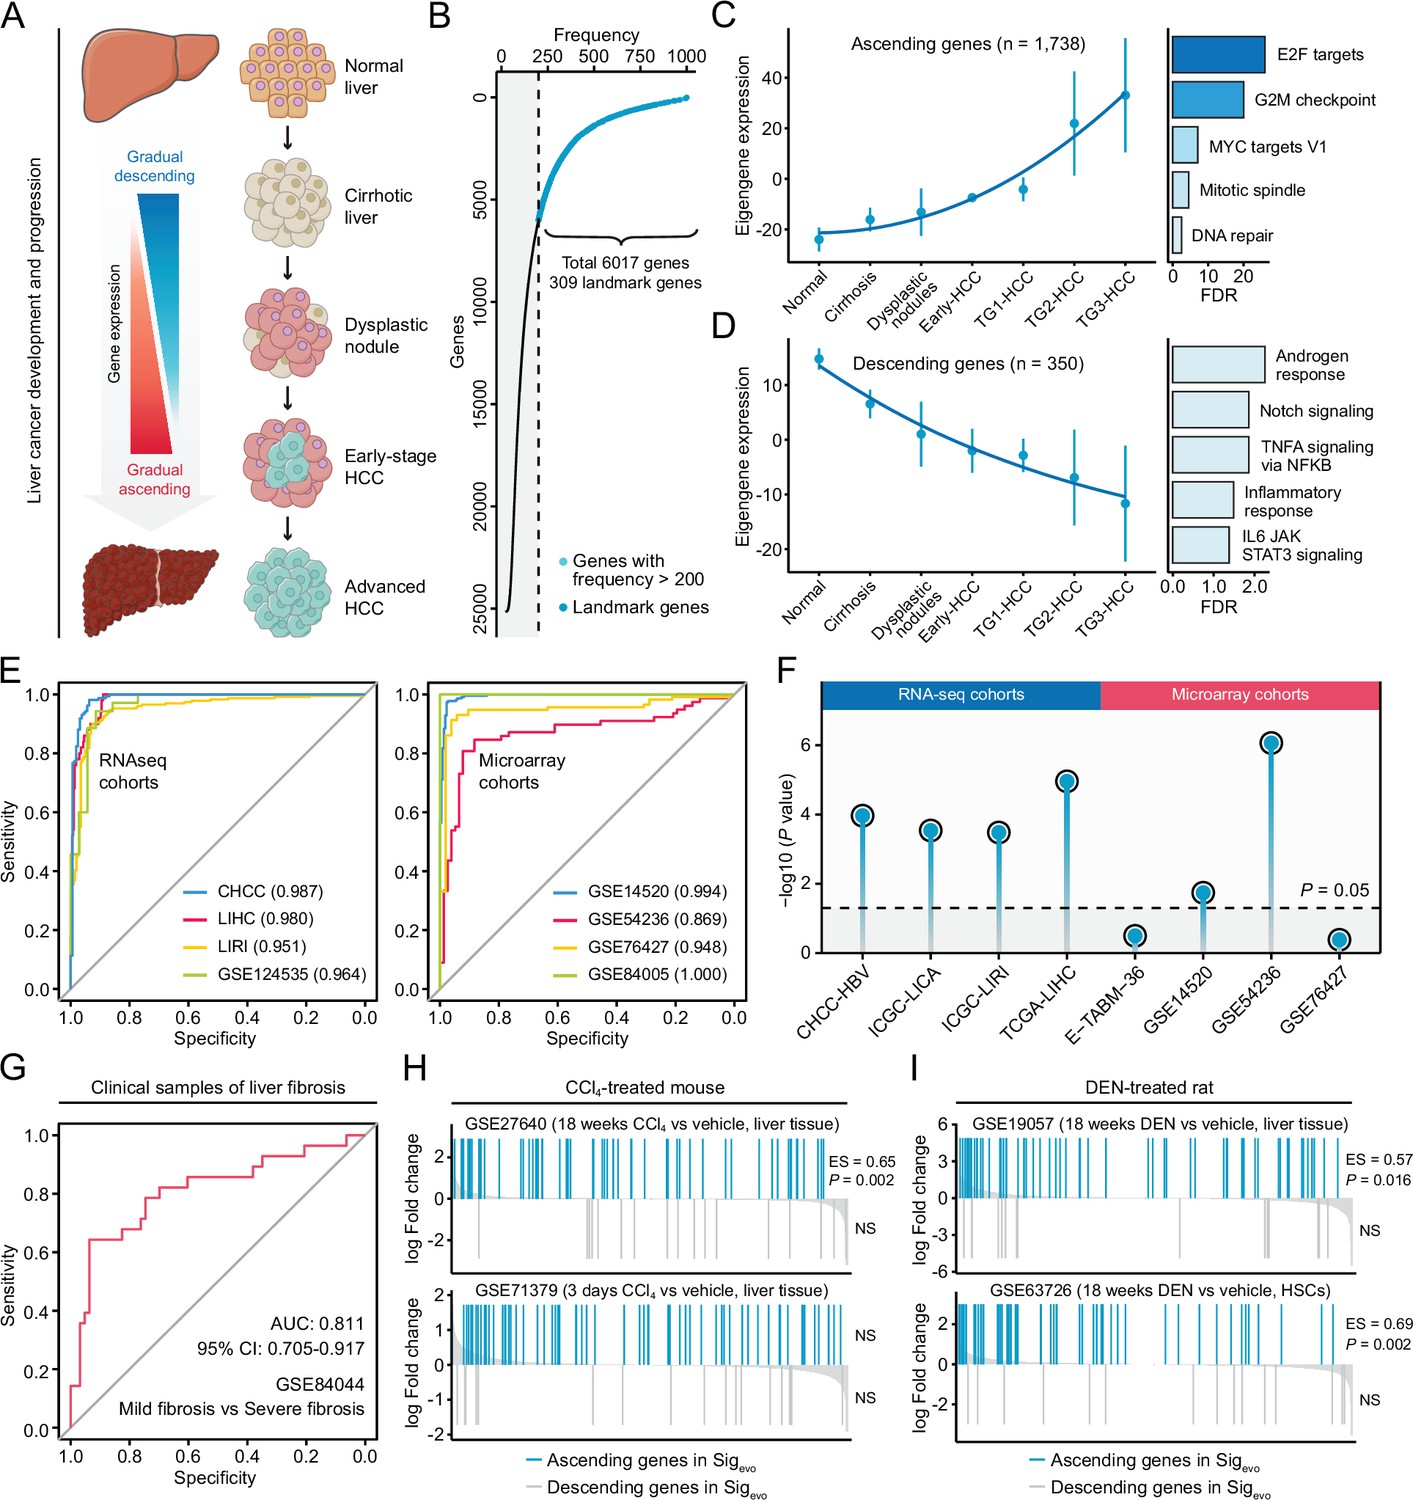
(A) Schematic of the stepwise process of liver cancer initiation and progression. (B) Preliminary screening of developmental stage-associated genes by random forests algorithm based on GSE89377. (C) The expression pattern of the ‘ascending’ module discerned by WGCNA analysis (left) and the enriched biological processes determined by hypergeometric test (right). (D) The expression pattern of the ‘descending’ module (left) and the enriched biological processes (right). (E) The performance evaluation of the Sigevo for discerning the difference between tumor and normal tissues based on RNA sequencing cohorts (left) and microarray cohorts (right). (F) The association between the Sigevo and the clinical phenotype of prognosis. Color toward gray indicates no statistical significance. (G) The association between the Sigevo and fibrosis-related phenotype suggested by ROC curve. (H) The association between Sigevo and CCl4-induced expression changes in liver tissues of mice. The enrichment scores and statistical significance were determined by gene set enrichment analysis. (I) The association between Sigevo and DEN-induced expression changes in liver tissues of rats. WGCNA, weighted gene co-expression network analysis.
Figure 6—figure supplement 1
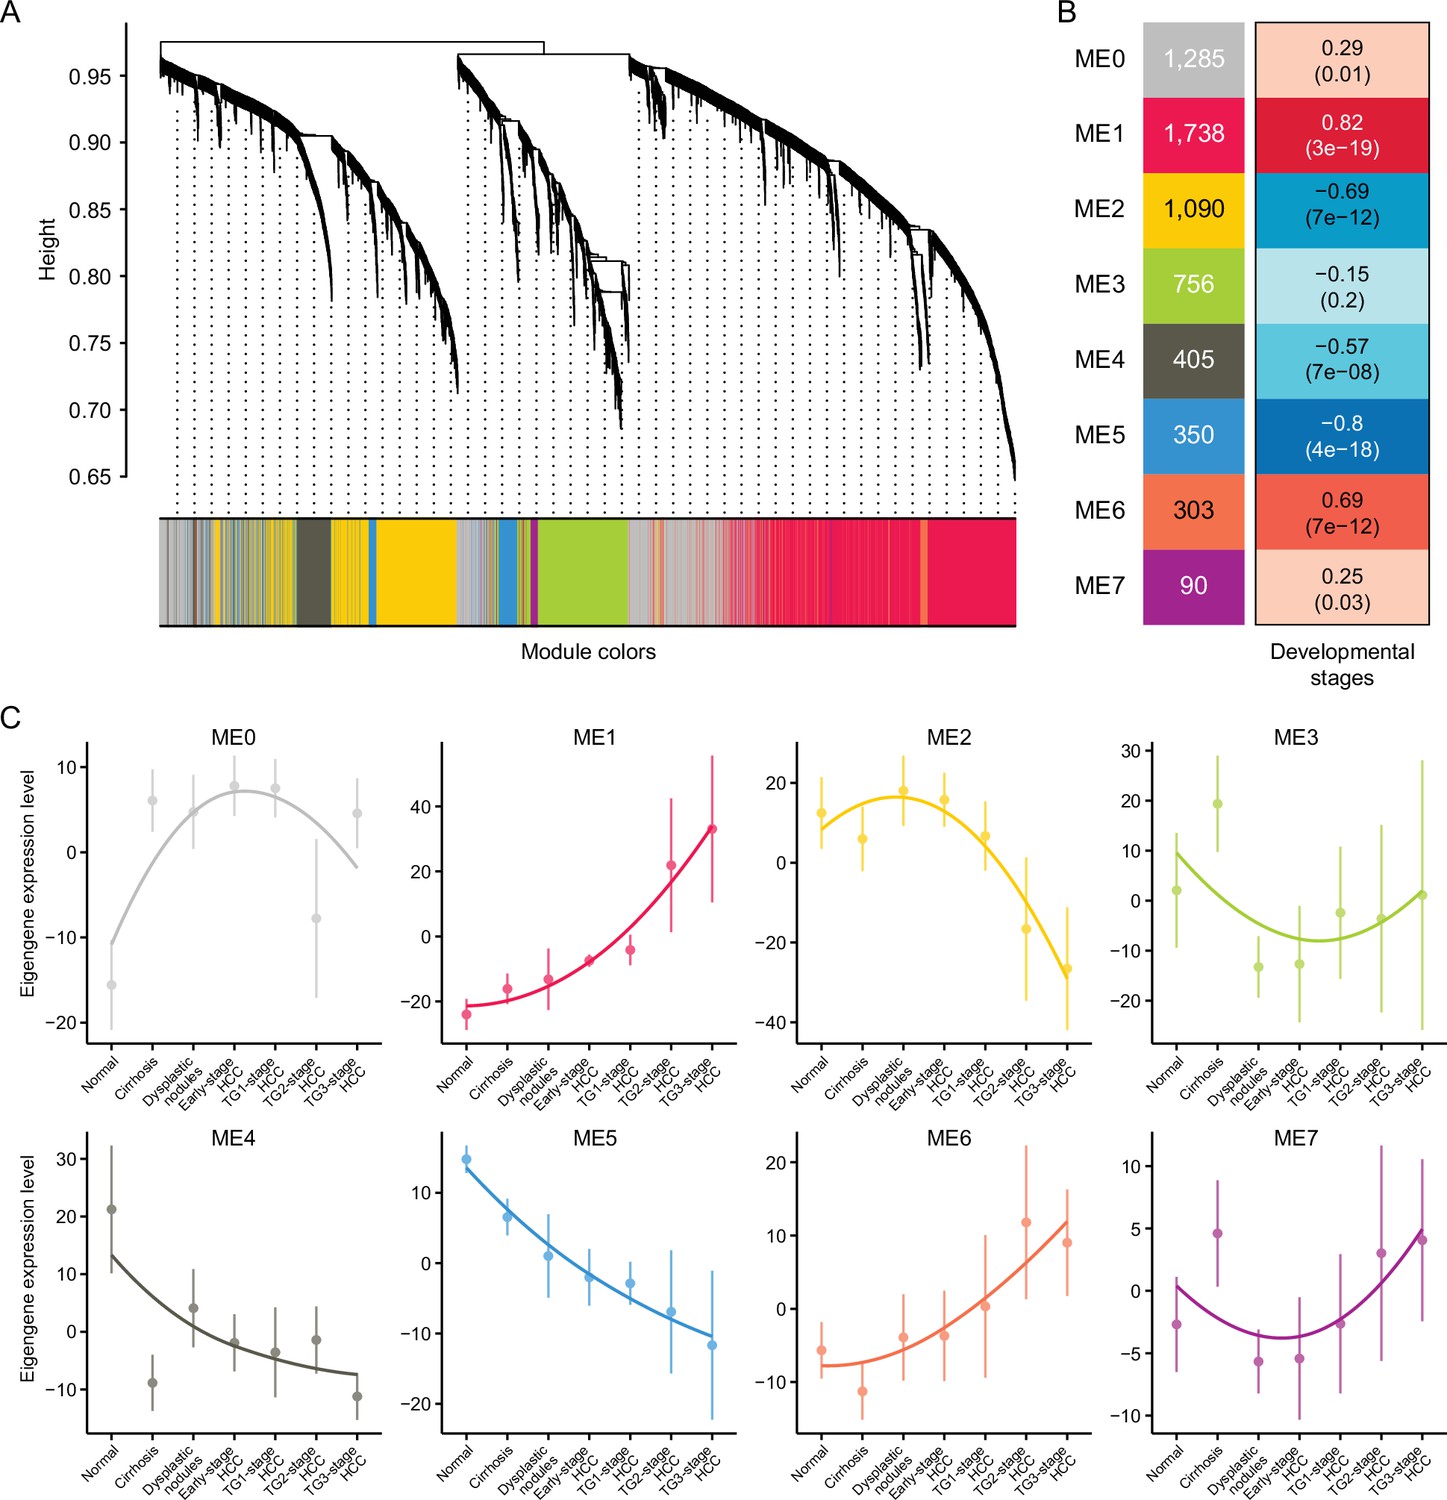
Weighted gene co-expression network analysis (WGCNA).
(A) Hierarchical cluster tree showing eight modules of co-expressed genes identified by WGCNA. Each of the stage-associated genes is represented by a leaf in the tree, and each of the eight modules by a major tree branch. (B) Module-trait (developmental stage) relationship and corresponding p values. The left panel shows the eight modules and the number of genes in each module, and the color scale on right shows module-trait correlation from –1 (blue) to 1 (red). (C) The expression pattern of eight modules. Note that gray module represents unassigned genes.
Figure 6—figure supplement 2
Identification and validation of the novel query signature.
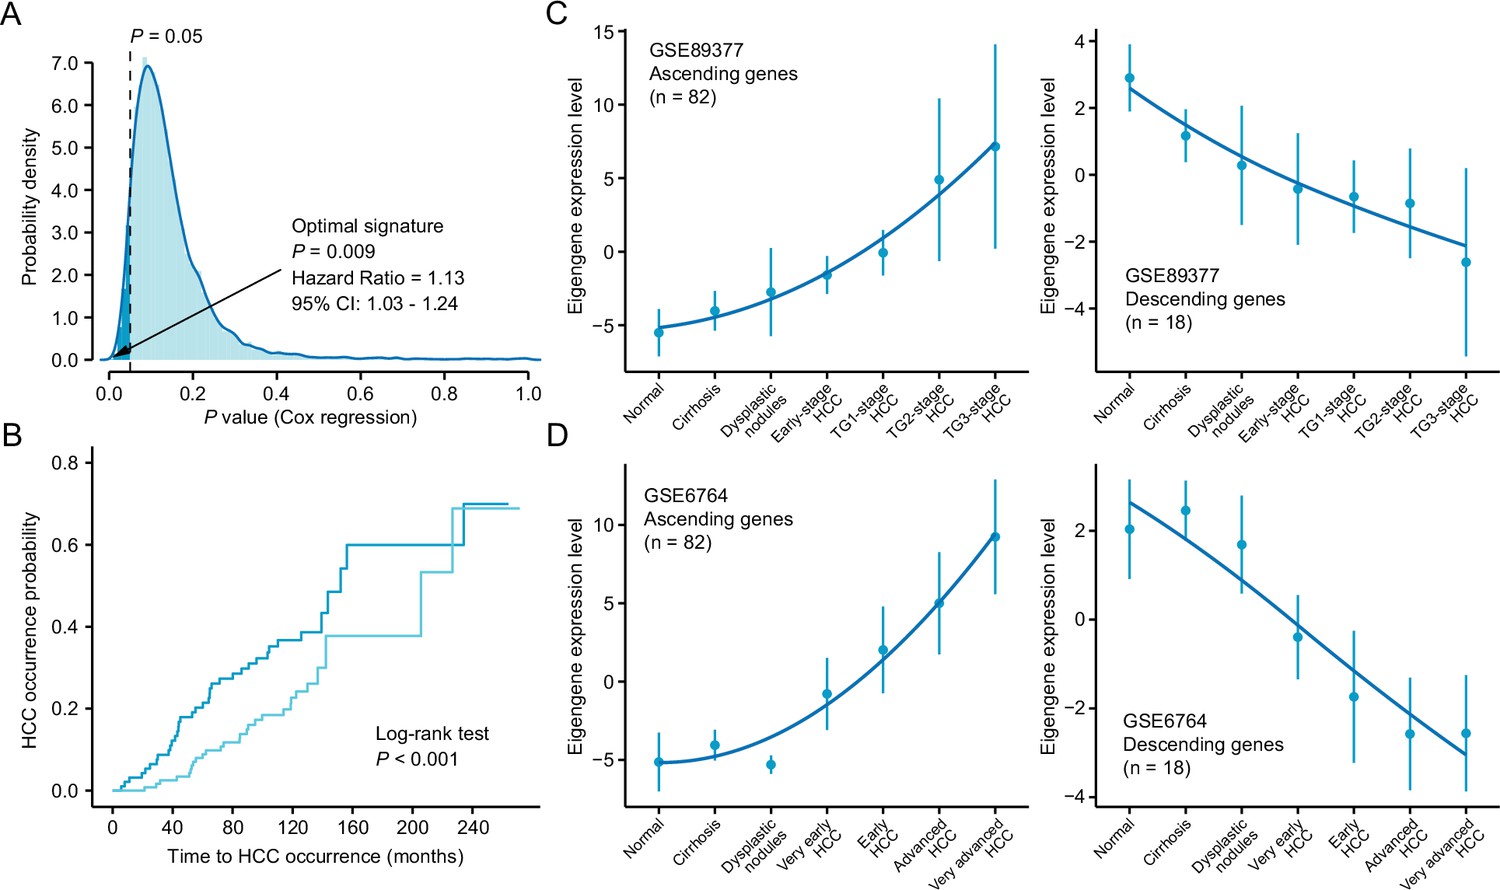
(A) The distribution of the statistical significance results of 10,000 cox proportional hazards regression analysis. The optimal signature with the most significant relevance to HCC occurrence was labeled in the figure. (B) Kaplan-Meier cumulative hazard rates for HCC occurrence according to the groups determined by the optimal signature expression. (C) Validation of the expression pattern of the ‘ascending’ (left) and ‘descending’ (right) module based on the optimal signature in GSE89377 cohort. (D) Validation of the expression pattern of the ‘ascending’ (left) and ‘descending’ (right) module based on the optimal signature in GSE6764 cohort. HCC, hepatocellular carcinoma.
Figure 7 with 5 supplements
Homoharringtonine (HHT) has significant tumor killing activity both in vitro and in vivo.
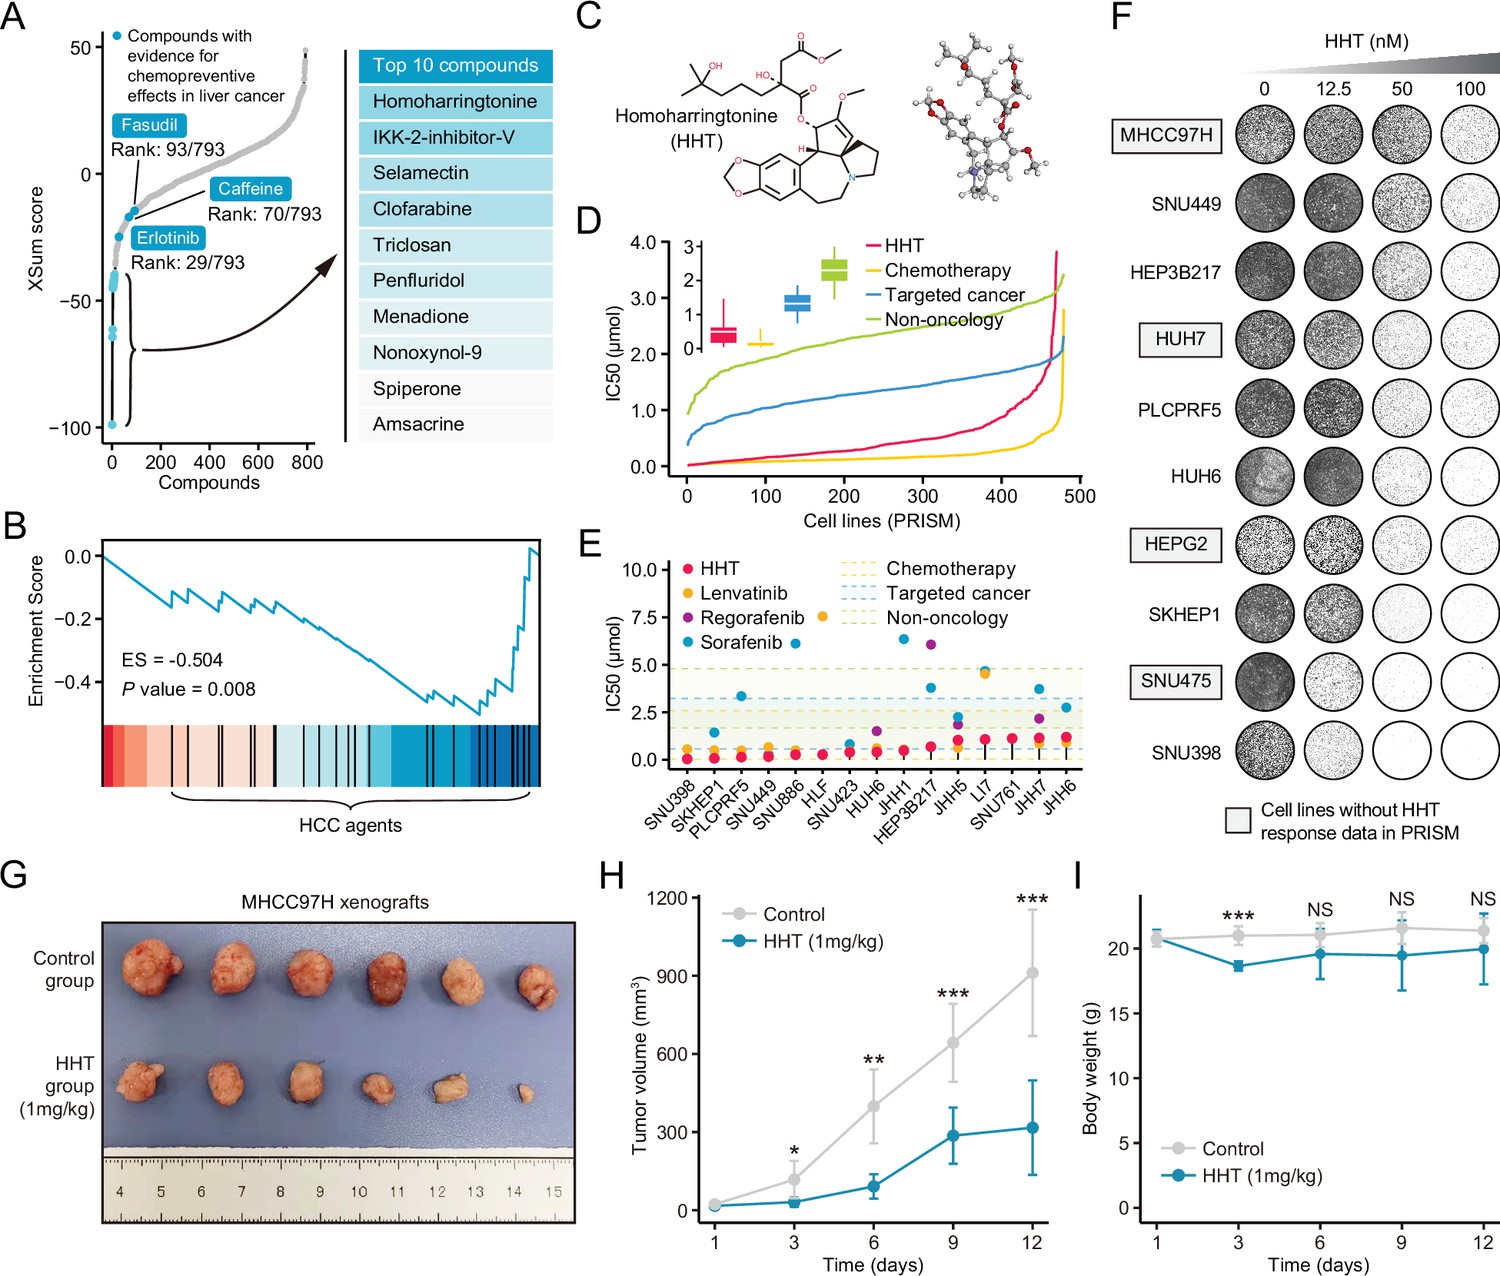
(A) Results of best practice approach-based computational drevo as query signature. Top ranked 10 compounds with highest reversal potency were illustrated in the right panel. (B) Enrichment of HCC agents in compounds with reversal potency (XSum score<0). Statistical significance was determined based on the null distribution formed by 10,000 permutations. (C) 2D (left) and 3D (right) chemical structure of HHT. (D) Comparison of distribution of compound activity between HHT and three different drug categories, including chemotherapy (N=45 compounds), targeted cancer agents (N=419 compounds), and non-oncology (N=362 compounds). The IC50 values (from PRISM data set) of each drug category in each cell line (N=482) were determined through calculating the median IC50 value across all the compounds in this category. Data are presented as median±quartiles, N≥100. (E) The drug sensitivity data of HHT (achieved from PRISM data set) across liver cancer cell lines. The drug sensitivities of two HCC agents in the first-line (sorafenib and lenvatinib) and one HCC agent in the second-line (regorafenib) were also presented for comparison. Areas with different colors denote the interquartile range of median IC50 values of compounds within different drug categories. (F) Long-term cell proliferation assay for testing the anti-tumor activity of HHT across 10 liver cancer cell lines. Of these, four cell lines have not been profiled by PRISM for the sensitivity to HHT. (G) Macroscopic image of tumors harvested from xenograft mice treated with vehicle (upper) and HHT (lower). (H) Longitudinal tumor volume progression of subcutaneous MHCC97H xenograft tumors treated with vehicle (N=6) and HHT (N=6). The statistical significance of difference between groups was determined using Student’s t-test. Data are represented as mean ± SD. (I) Body weight changes of mice in control (N=6) and HHT-treated (N=6) groups. Statistical significance was determined using Student’s t-test. Data are represented as mean ± SD. *p<0.05, **p<0.01, ***p<0.001. NS, not significant. HCC, hepatocellular carcinoma.
-
Figure 7—source data 1
Drug-induced expression changes across different cell lines as well as different concentrations.
- https://cdn.elifesciences.org/articles/71880/elife-71880-fig7-data1-v2.xlsx
Figure 7—figure supplement 1
Reversal effect of HHT on Sigevo across different conditions.
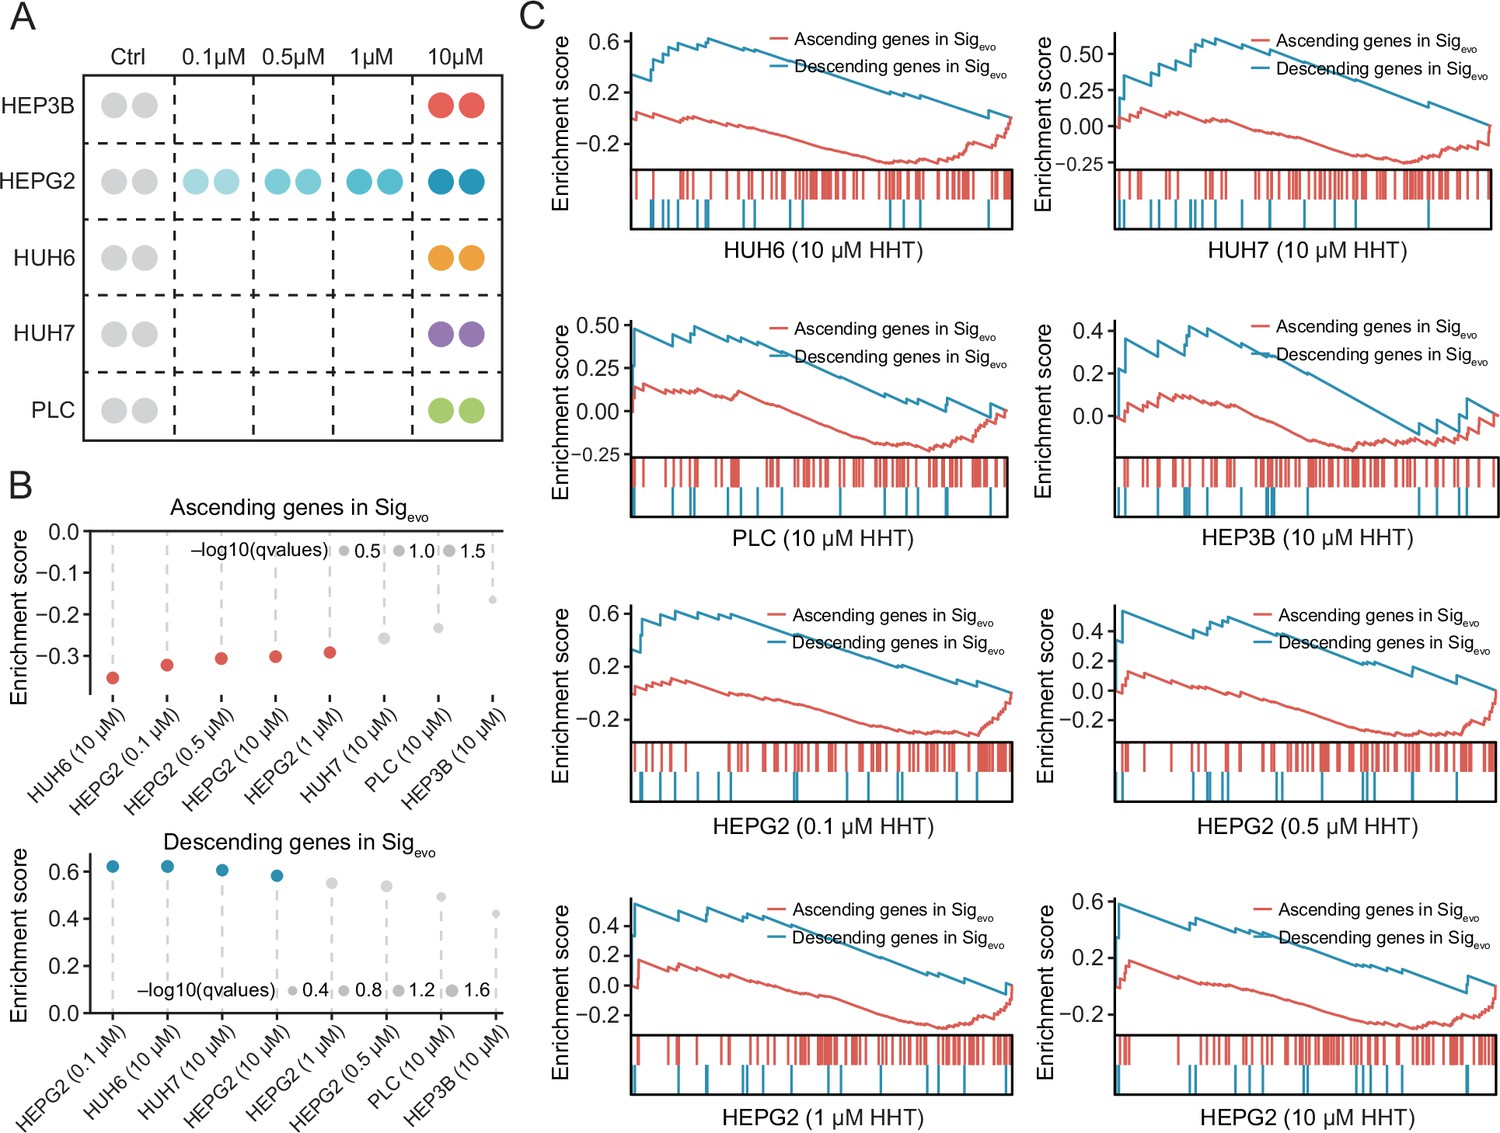
(A) Schematic figure illustrating the experimental design. (B) Enrichment scores of ascending (upper) and descending (lower) gene sets in the condition of different cell types as well as different concentrations. A positive enrichment score of a given gene set indicates the enrichment of HHT-induced upregulated genes and a negative enrichment score indicates the enrichment of HHT-induced downregulated genes. Color toward gray indicates no statistical significance. (C) GSEA plots of ascending and descending gene sets in different conditions. HHT, homoharringtonine.
Figure 7—figure supplement 2
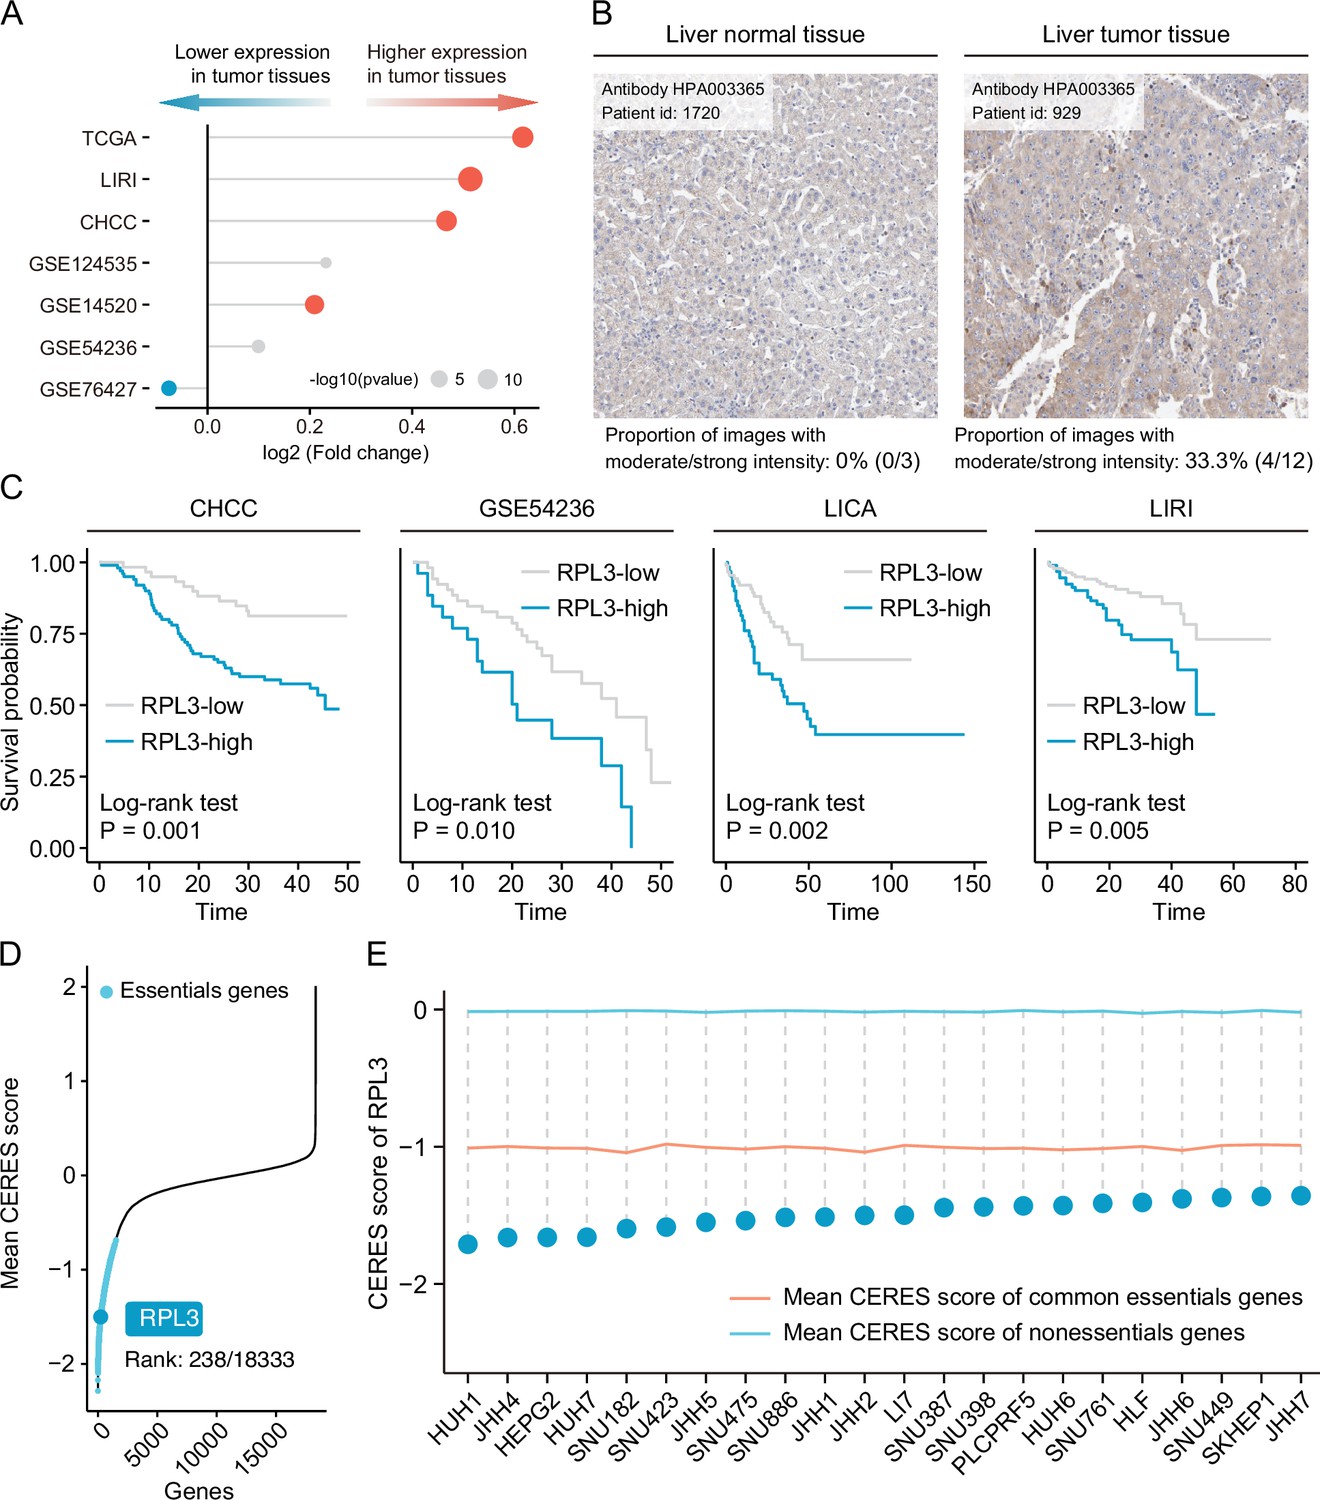
Clinical and biological characterization of RPL3 in liver cancer.
(A) The comparison of mRNA expression level of RPL3 between tumor and non-tumor tissues across seven HCC clinical cohorts. Statistical significance of difference was determined using Wilcoxon rank-sum test. Color toward gray indicates no statistical significance. (B) Representative images of immunohistochemical staining of RPL3 in liver normal (left) and tumor tissues (right) from the Human Protein Atlas (HPA) program. (C) Comparison of survival curves between high RPL3 expression and low RPL3 expression groups. (D) Distribution of gene dependency score (CERES score) of 18,333 protein-coding genes in liver cancer cell lines. A lower CERES score of certain gene indicates a higher likelihood that this gene is essential in cell growth and survival. (E) The gene dependency of RPL3 across 22 liver cancer cell lines.
Figure 7—figure supplement 3
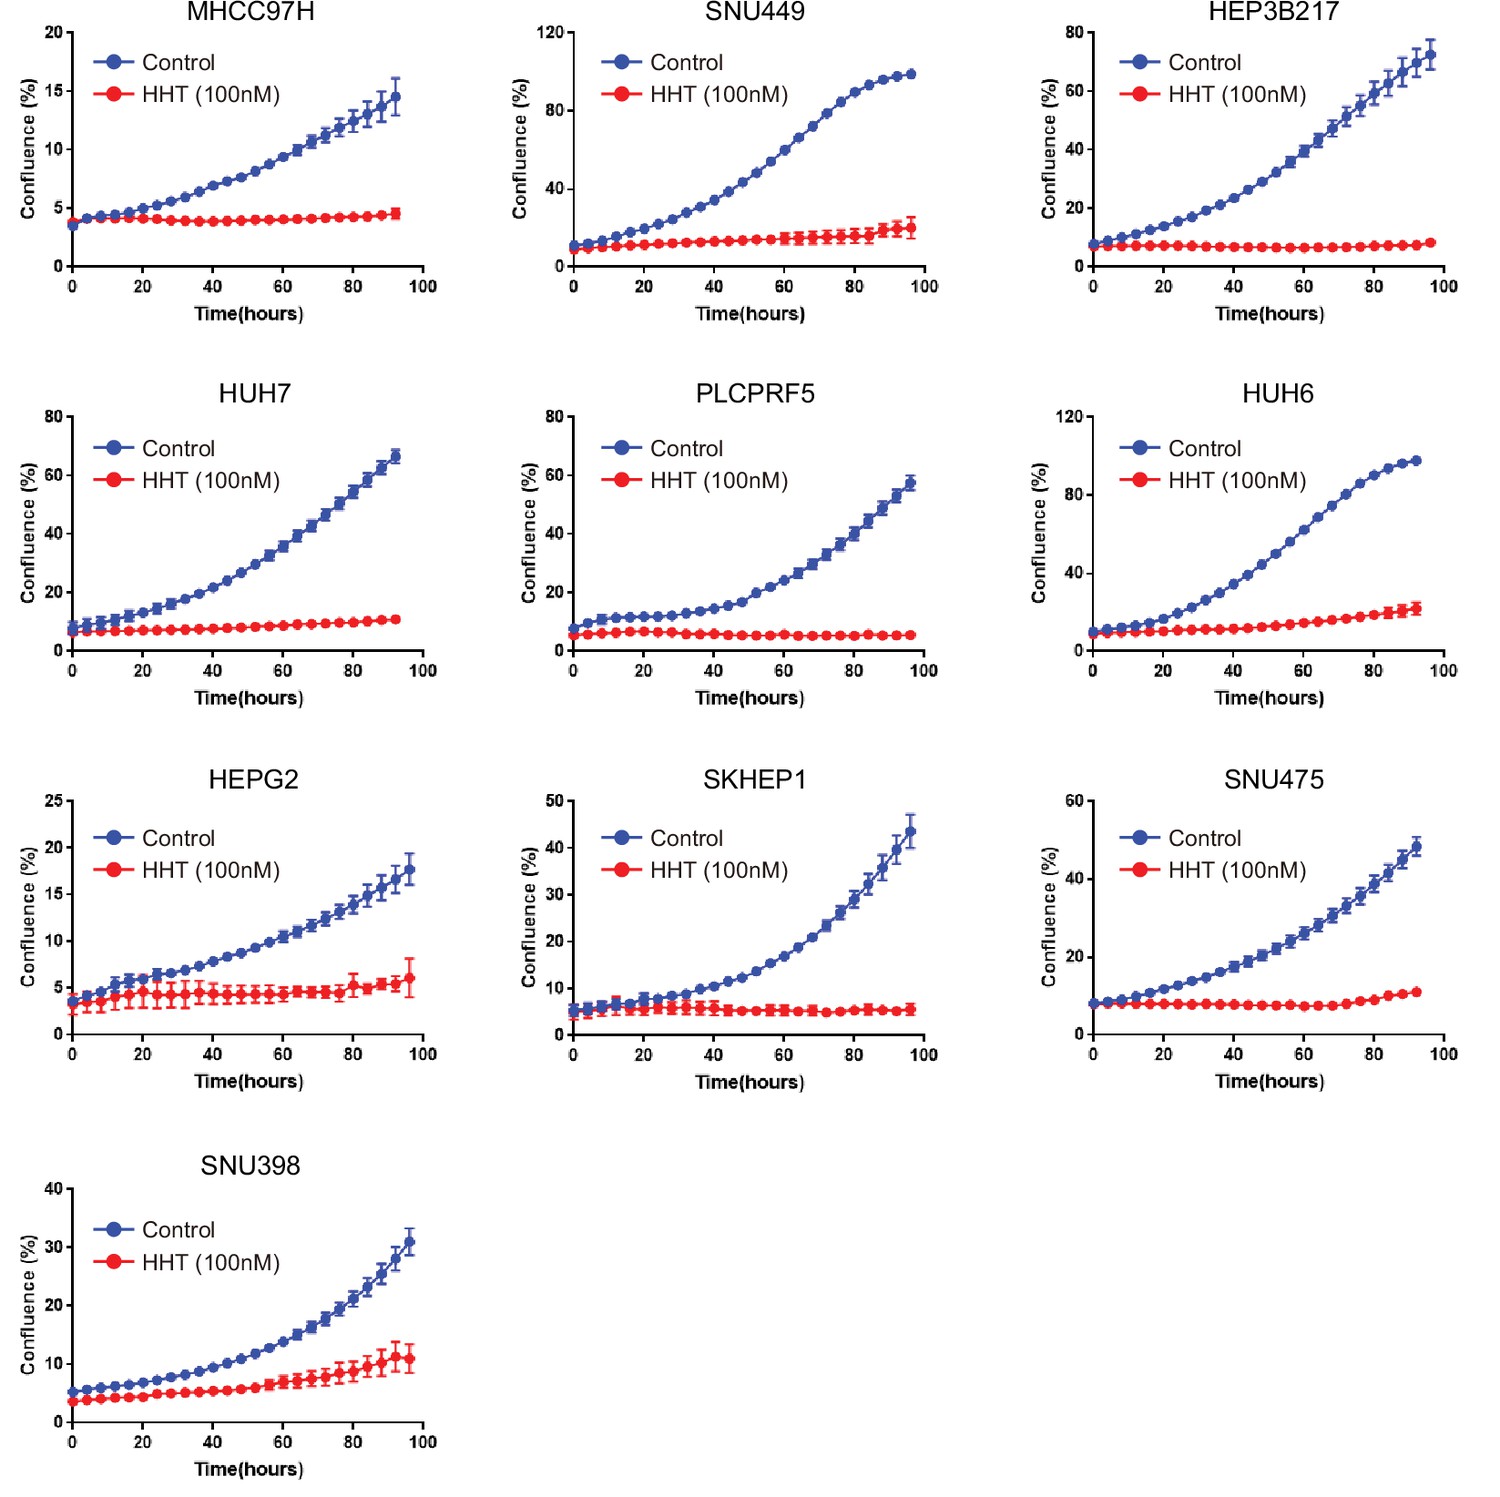
The effect of HHT on cell proliferation across 10 liver cancer cell lines.
Cell proliferation rate was analyzed by IncuCyte ZOOM system every 4 hr for 100 hr. HHT, homoharringtonine.
Figure 7—figure supplement 4
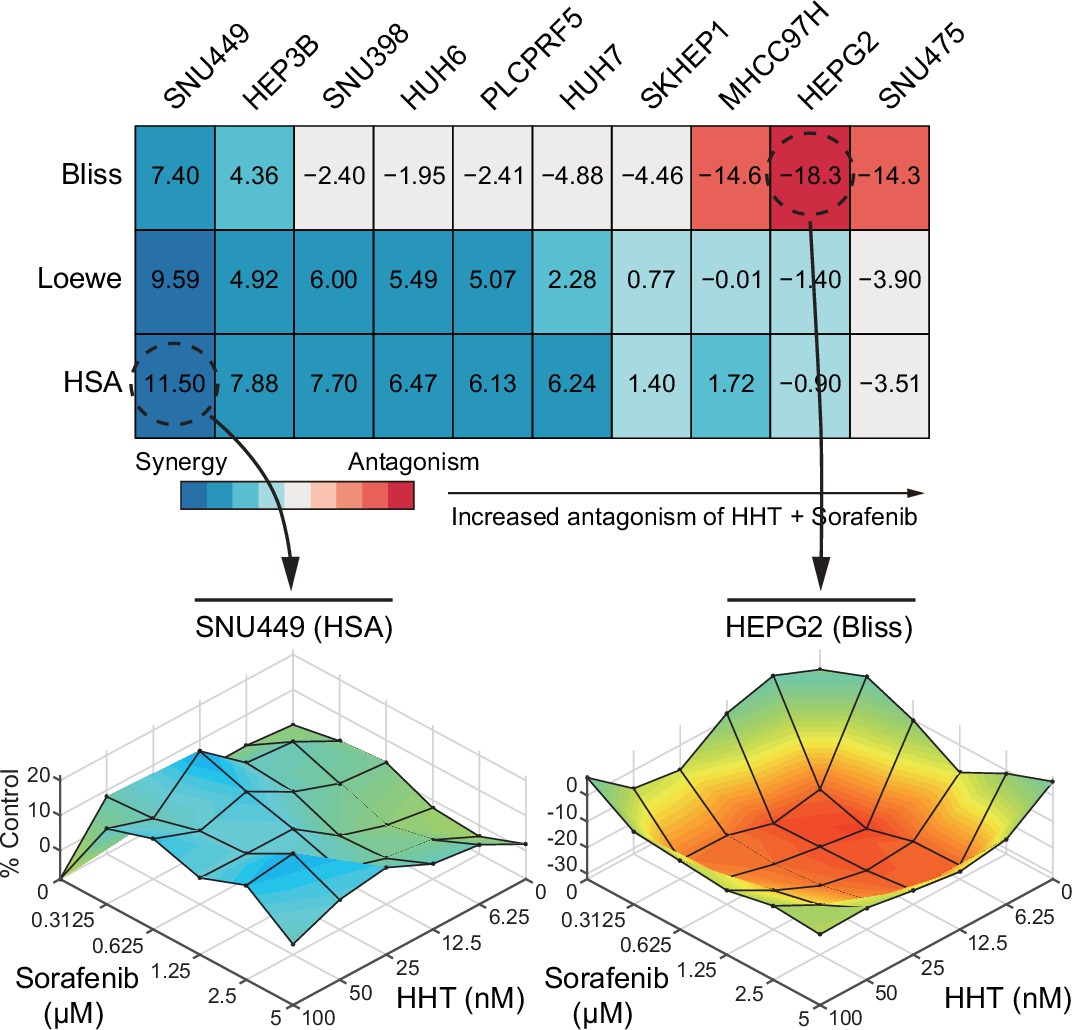
Summary of the anti-tumor effect of HHT-sorafenib combination across 10 liver cancer cell lines.
Heatmap represents the summary of the synergistic effects of HHT-sorafenib combination. Higher score indicates greater synergism. The lower panel displays two representative surface plots that show the overall synergistic (left) and antagonistic (right) effects of the combination treatments. HHT, homoharringtonine.
Figure 7—figure supplement 5
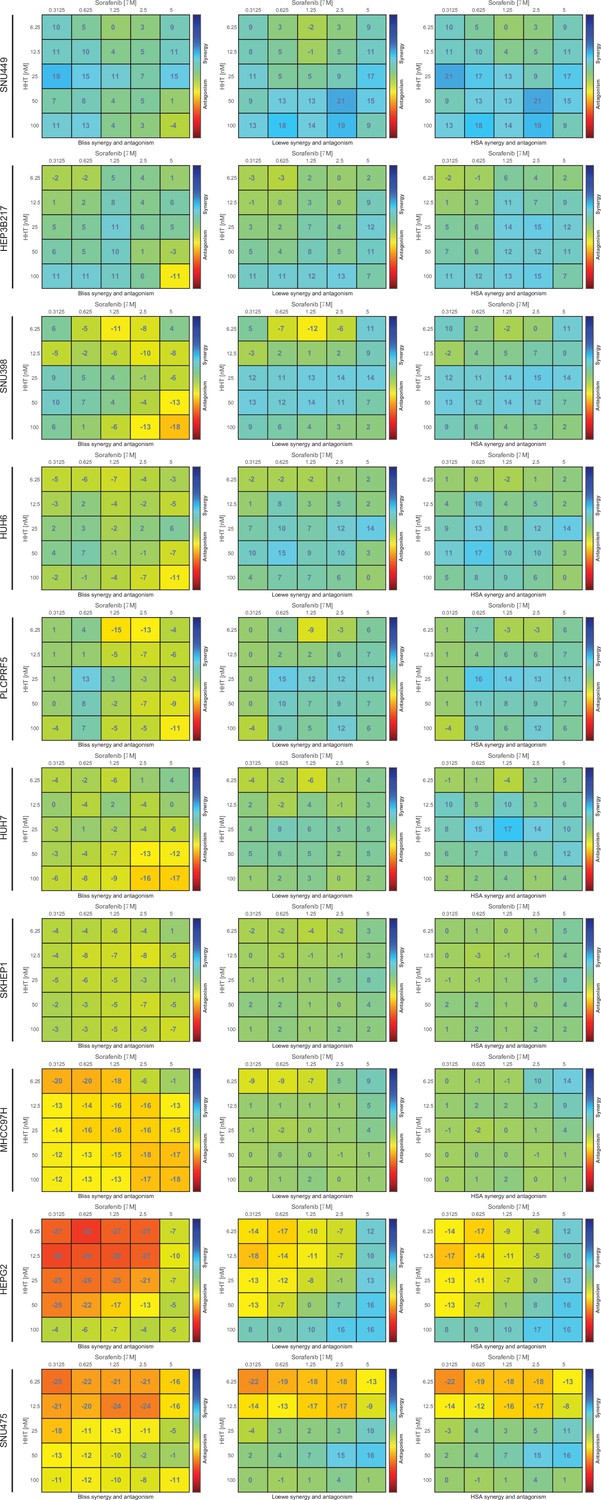
Detailed information of the anti-tumor effect of HHT-sorafenib combination across 10 liver cancer cell lines.
Combinational effects were measured using three models, including Bliss independence model, Loewe additivity model, and Highest single agent (HAS) model. HHT, homoharringtonine.
Figure 8 with 2 supplements
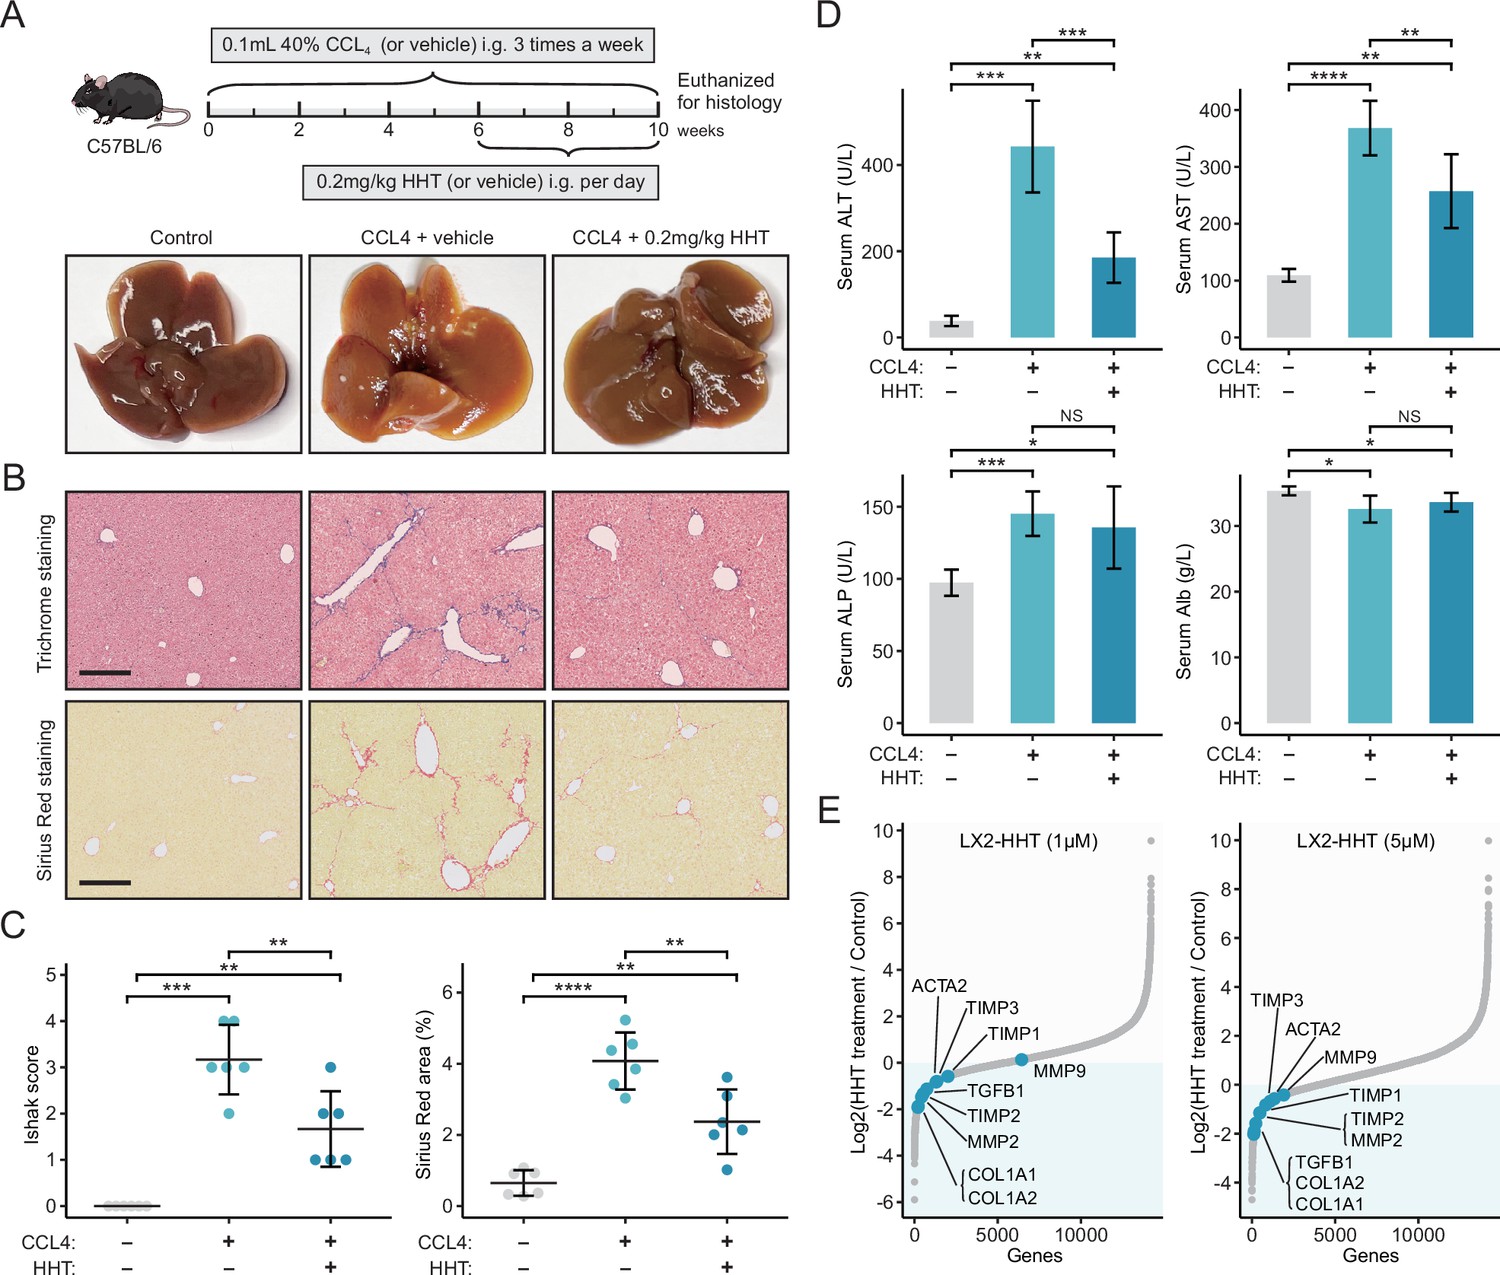
HHT has significant in vivo anti-fibrotic effects.
(A) Schematic diagram (upper) of the experimental design for validating the anti-fibrotic ability of HHT and representative photographs (lower) of the livers harvested from different groups at the time of sacrifice. (B) Representative images of Masson’s trichrome staining and Sirius Red staining of liver tissues from different groups (scale bars: 250 µm). (C) Comparisons of Ishak scores (left) and Sirius Red-based collagen quantification (right) between different groups. Statistical significance was determined using one-way ANOVA followed by Tukey multiple comparison test. Data are represented as mean ± SD (N=6 in each group). (D) Comparisons of serum levels of ALT, AST, ALP, and Alb between different groups. Statistical significance was determined using one-way ANOVA followed by Tukey multiple comparison test. Data are represented as mean ± SD (N=6 in each group). (E) Differential expression of nine fibrosis-associated genes between HHT-treated and HHT-untreated LX-2 cells. *p<0.05, **p<0.01, ***p<0.001, ****p<0.0001. HHT, homoharringtonine; NS, not significant.
-
Figure 8—source data 1
Sequencing results of HHT-treated LX2 cells.
- https://cdn.elifesciences.org/articles/71880/elife-71880-fig8-data1-v2.xlsx
-
Figure 8—source data 2
Raw unedited plots.
- https://cdn.elifesciences.org/articles/71880/elife-71880-fig8-data2-v2.pdf
Figure 8—figure supplement 1
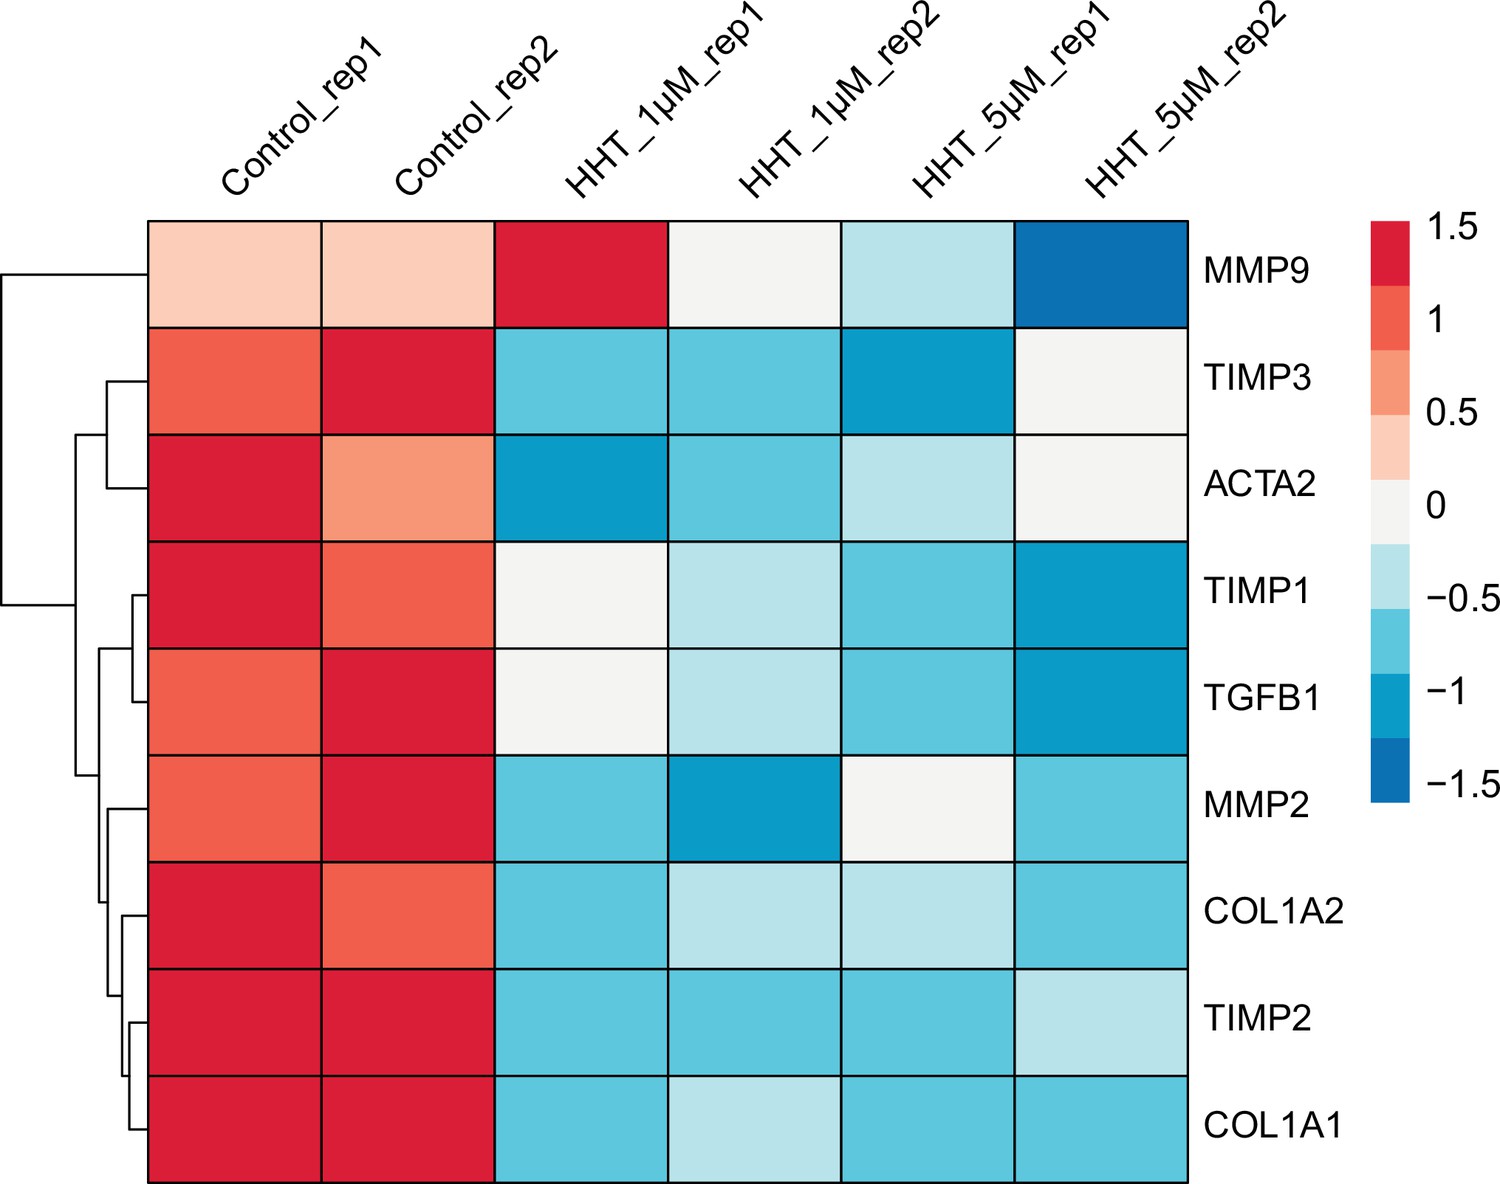
Comparison of the expression of nine fibrosis-associated genes between control LX2 and HHT-treated LX2.
Gene expression was measured by RNA-seq and the processed data has been provided as the source data file.
Figure 8—figure supplement 2

In vitro anti-fibrotic effects of HHT.
(A) Quantitative real-time PCR-based mRNA expression level of collagen I (upper) and α-SMA (lower) of LX-2 cells treated with gradient concentrations of HHT for 6 hr. Statistical significance was determined using Student’s t-test. Data are represented as mean ± SD, N=3. (B) Western blot-based protein expression level of collagen I and α-SMA of LX-2 cells treated with gradient concentrations of HHT for 24 hr. (C) Representative images of immunofluorescence staining of LX-2 cells with antibody against collagen I (upper) and α-SMA (lower). HHT, homoharringtonine.
Author response image 1
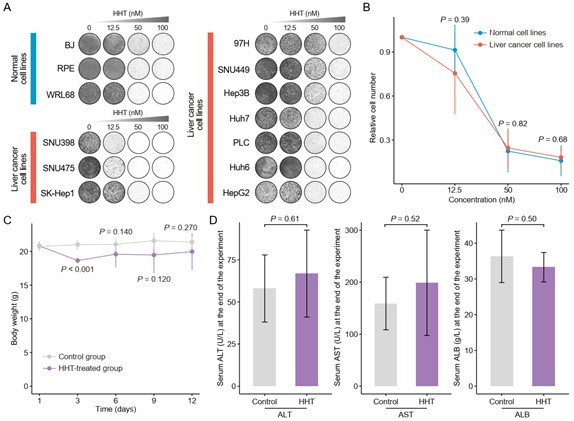
Validation of cancer-selective inhibitory effect of HHT.
(A) Long-term cell proliferation assays of normal and liver cancer cell lines. (B) Quantitative results of long-term cell proliferation assays. Crystal violet was solubilized using 33% glacial acetic acid for 20 min and the absorbance was measured at 590 nm. The statistical significance of difference between groups was determined using Student’s t test. Data are represented as mean ± SD. (C) Body weight changes of mice in control (N = 6) and HHT-treated (N = 6) groups. The statistical significance was determined using Student’s t test. Data are represented as mean ± SD. (D) Comparison of serum levels of ALT, AST and ALB between control (n = 4) and HHT-treated (n = 4) groups. The statistical significance of difference between groups was determined using Student’s t test. Data are represented as mean ± SD.
Author response image 2
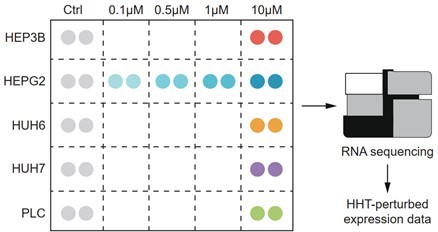
Schematic figure illustrating the experimental design.
The expression profiles of 26 samples (16 HHT-treated and 10 control samples) were generated by RNA sequencing.
Author response image 3
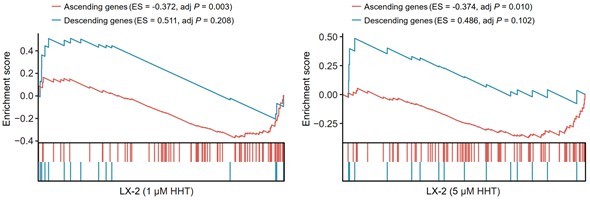
Reversal effect of HHT on LX-2 cells.
A positive ES of a given gene set indicates the enrichment of HHT-induced up-regulated genes and a negative ES indicates the enrichment of HHT-induced down-regulated genes.
Author response image 4
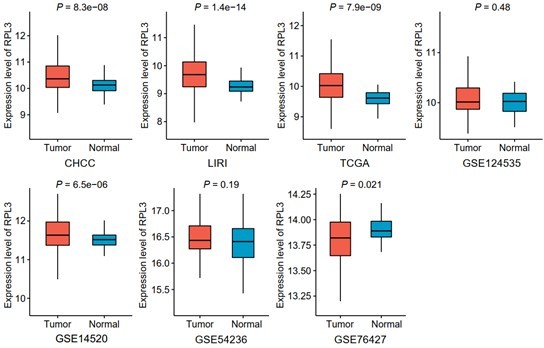
Comparisons of RPL3 expression between tumor and non-tumor tissues across seven liver cancer clinical cohorts.
Data are presented as median ± quartiles, N ≥ 100. The statistical significance of difference between groups was determined using Wilcoxon sum rank tests.
Author response image 5
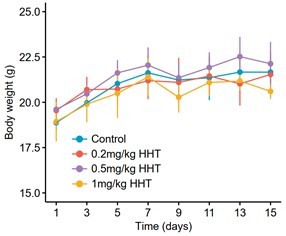
Body weight changes of C57BL/6 mice receiving different treatments.
Twelve mice were stratified into four groups, including vehicle group (N = 3), 0.2mg/kg HHT group (N = 3), 0.5mg/kg HHT group (N = 3) and 1mg/kg HHT group (N = 3). Data are represented as mean ± SD.
Tables
Key resources table
| Reagent type (species) or resource | Designation | Source or reference | Identifiers | Additional information |
|---|---|---|---|---|
| Cell line (Homo sapiens) | Hep3B | ATCC | Cat#: HB-8064;RRID:CVCL_0326 | |
| Cell line (H. sapiens) | HepG2 | ATCC | Cat#: HB-8065; RRID:CVCL_0027 | |
| Cell line (H. sapiens) | Huh6 | RCB | Cat#: RCB1367; RRID:CVCL_4381 | |
| Cell line (H. sapiens) | Huh7 | JCRB | Cat#: JCRB0403; RRID:CVCL_0336 | |
| Cell line (H. sapiens) | MHCC97H | Zhongshan Hospital | RRID:CVCL_4972 | Liver Cancer Institute of Zhongshan Hospital (Shanghai, China) |
| Cell line (H. sapiens) | PLC/PRF/5 | ATCC | Cat#: CRL-802;RRID:CVCL_0485 | |
| Cell line (H. sapiens) | SNU398 | ATCC | Cat#: CRL-2233; RRID:CVCL_0077 | |
| Cell line (H. sapiens) | SNU449 | ATCC | Cat#: CRL-2234; RRID:CVCL_0454 | |
| Cell line (H. sapiens) | SNU475 | ATCC | Cat#: CRL-2236;RRID:CVCL_0497 | |
| Cell line (H. sapiens) | SK-Hep1 | ATCC | Cat#: HTB-52; RRID:CVCL_0525 | |
| Cell line (H. sapiens) | LX2 | ATCC | Cat#: SCC064;RRID:CVCL_5792 | |
| Chemical compound, drug | Homoharringtonine | Selleck Chemicals | S9015 | |
| Antibody | Anti-HSP90 (Mouse monoclonal) | Santa Cruz Biotechnology | Cat#: sc-13119;RRID:AB_675659 | WB (1:5000) |
| Antibody | Anti-α-SMA (Mouse monoclonal) | Sigma-Aldrich | Cat#: A5228; RRID:AB_262054 | WB (1:2000)IF (1:200) |
| Antibody | Anti-Collagen I (Rabbit polyclonal) | ProteinTech | Cat#: 14695-1-AP; RRID:AB_2082037 | WB (1:2000)IF (1:200) |
| Sequence-based reagent | ACTA2_F | This paper | PCR primer | 5′GACAATGGCTCTGGGCTCTGTAA3′ |
| Sequence-based reagent | ACTA2_R | This paper | PCR primer | 5′CTGTGCTTCGTCACCCACGTA3′ |
| Sequence-based reagent | COL1A1_F | This paper | PCR primer | 5′TCCTGGTCCTGCTGGCAAAGAA3′ |
| Sequence-based reagent | COL1A1_R | This paper | PCR primer | 5′CACGCTGTCCAGCAATACCTTGA3′ |
| Software, algorithm | R software, version 3.6.0 | https://cran.r-project.org/ | RRID:SCR_001905 | |
| Software, algorithm | ImageJ, version 1.53k | http://imagej.net/ | RRID:SCR_003070 | |
| Software, algorithm | Combenefit, version 2.02 | https://sourceforge.net/projects/combenefit/ |
Additional files
-
Supplementary file 1
Pharmacogenomic and transcriptomic datasets used in this study.
- https://cdn.elifesciences.org/articles/71880/elife-71880-supp1-v2.xlsx
-
Supplementary file 2
Cosine similarity within different drugs of LINCS.
- https://cdn.elifesciences.org/articles/71880/elife-71880-supp2-v2.xlsx
-
Supplementary file 3
Benchmarking dataset for AUC-based standard.
- https://cdn.elifesciences.org/articles/71880/elife-71880-supp3-v2.xlsx
-
Supplementary file 4
Benchmarking dataset for KS statistic-based standard.
- https://cdn.elifesciences.org/articles/71880/elife-71880-supp4-v2.xlsx
-
Supplementary file 5
A summary of four query signatures used for benchmarking signature matching methods.
- https://cdn.elifesciences.org/articles/71880/elife-71880-supp5-v2.xlsx
-
Supplementary file 6
Results of AUC/KS-based performance evaluation of six signature matching methods.
- https://cdn.elifesciences.org/articles/71880/elife-71880-supp6-v2.xlsx
-
Supplementary file 7
The list of genes in Sig(evo).
- https://cdn.elifesciences.org/articles/71880/elife-71880-supp7-v2.xlsx
-
Supplementary file 8
Results of computational drug repositioning for liver cancer.
- https://cdn.elifesciences.org/articles/71880/elife-71880-supp8-v2.xlsx
-
Transparent reporting form
- https://cdn.elifesciences.org/articles/71880/elife-71880-transrepform1-v2.docx
Download links
A two-part list of links to download the article, or parts of the article, in various formats.
Downloads (link to download the article as PDF)
Open citations (links to open the citations from this article in various online reference manager services)
Cite this article (links to download the citations from this article in formats compatible with various reference manager tools)
A survey of optimal strategy for signature-based drug repositioning and an application to liver cancer
eLife 11:e71880.
https://doi.org/10.7554/eLife.71880


