Partial connectomes of labeled dopaminergic circuits reveal non-synaptic communication and axonal remodeling after exposure to cocaine
- Department of Neurobiology, University of Chicago, United States
- Argonne National Laboratory, United States
- Department of Anesthesia & Critical Care, University of Chicago, United States
Figures
Figure 1

Experimental design for dopamine connectomics.
(A) Adeno-associated viruses (AAVs) expressing Cre-dependent Apex2 were bilaterally injected into the ventral tegmental area (VTA) of transgenic mice expressing Cre in dopamine transporter positive neurons (Slc6a3 (DAT)-CRE). (B) Approximately 4 weeks after AAV injections, vibratome sections (~300 µm thick) show strong Apex2 labeling in VTA and nucleus accumbens (NAc) after staining with 3’3’-diaminobenzidene (DAB) and hydrogen peroxide (H2O2) before electron microscopy (EM) processing (see Materials and methods). Black arrows point to an Apex2-positive region and black arrowhead points to an Apex2-negative region. Green rectangles highlight the VTA and medial shell of the NAc region dissected out and processed for EM. Red ovals highlight areal landmarks to ensure the same region was dissected across all animals. (C–D) Representative EM images of cytoplasmic (C, top row) and mitochondrial (D, bottom row) Apex2+ DA neurons. Left panel: Apex2 soma in the VTA (red arrows). Middle panel: Apex2 top panel shows a DA dendritic spine forming a synapse (purple arrow) with presynaptic bouton (orange) in the VTA, and the bottom panel shows a narrow DA dendrite expressing mitochondrial Apex. Right panel: Apex2 axon in the NAc with narrow (yellow arrow) and thick varicosities (yellow arrowhead). Cytosolic Apex2 does not obscure mitochondria (top panel, asterisk), and mitochondrial Apex2 (bottom) only fills up mitochondria. Scale bar = C,D, soma = 10 µm, dendrite and axon = 1 μm.
Figure 2
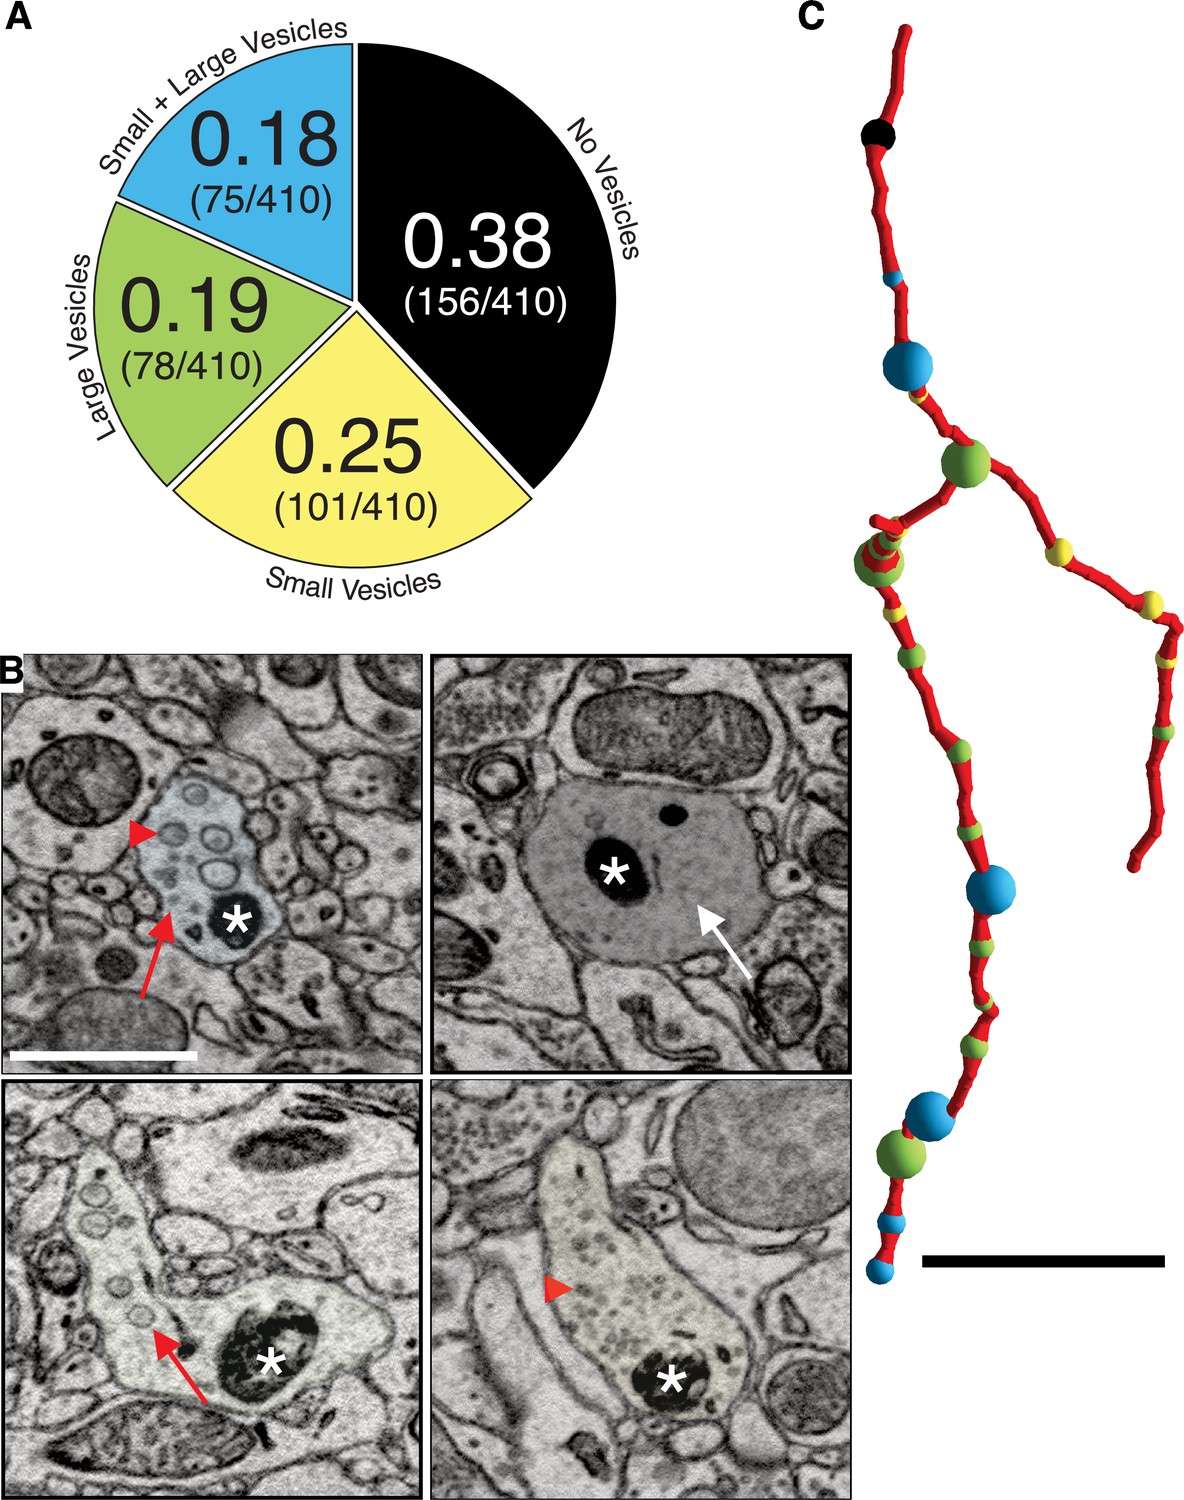
Dopaminergic (DA) axon varicosities are either empty or filled with different sized vesicles.
(A) Pie chart showing ratio of each kind of DA varicosity across a population of DA axons (n = 409 varicosities scored across 75 axons, 1 mouse). (B) Single 2D images showing representative examples of each kind of DA axon varicosity with color overlay corresponding to each type (refer to pie chart in A). Red arrowheads point to small vesicles, red arrows point to large vesicles, and the white arrow points to an empty varicosity. Asterisks marks Apex2+ mitochondria. (C) Reconstruction of a single Mito-Apex2 DA axon with each class of varicosity marked as a differently colored spheres: black = no vesicles, yellow = small vesicles, green = large vesicles, and blue = small and large vesicle-filled varicosity. Spheres are scaled to the size of the bouton. Scale bar (B) = 1 µm, (C) = 10 µm.
Figure 3 with 1 supplement
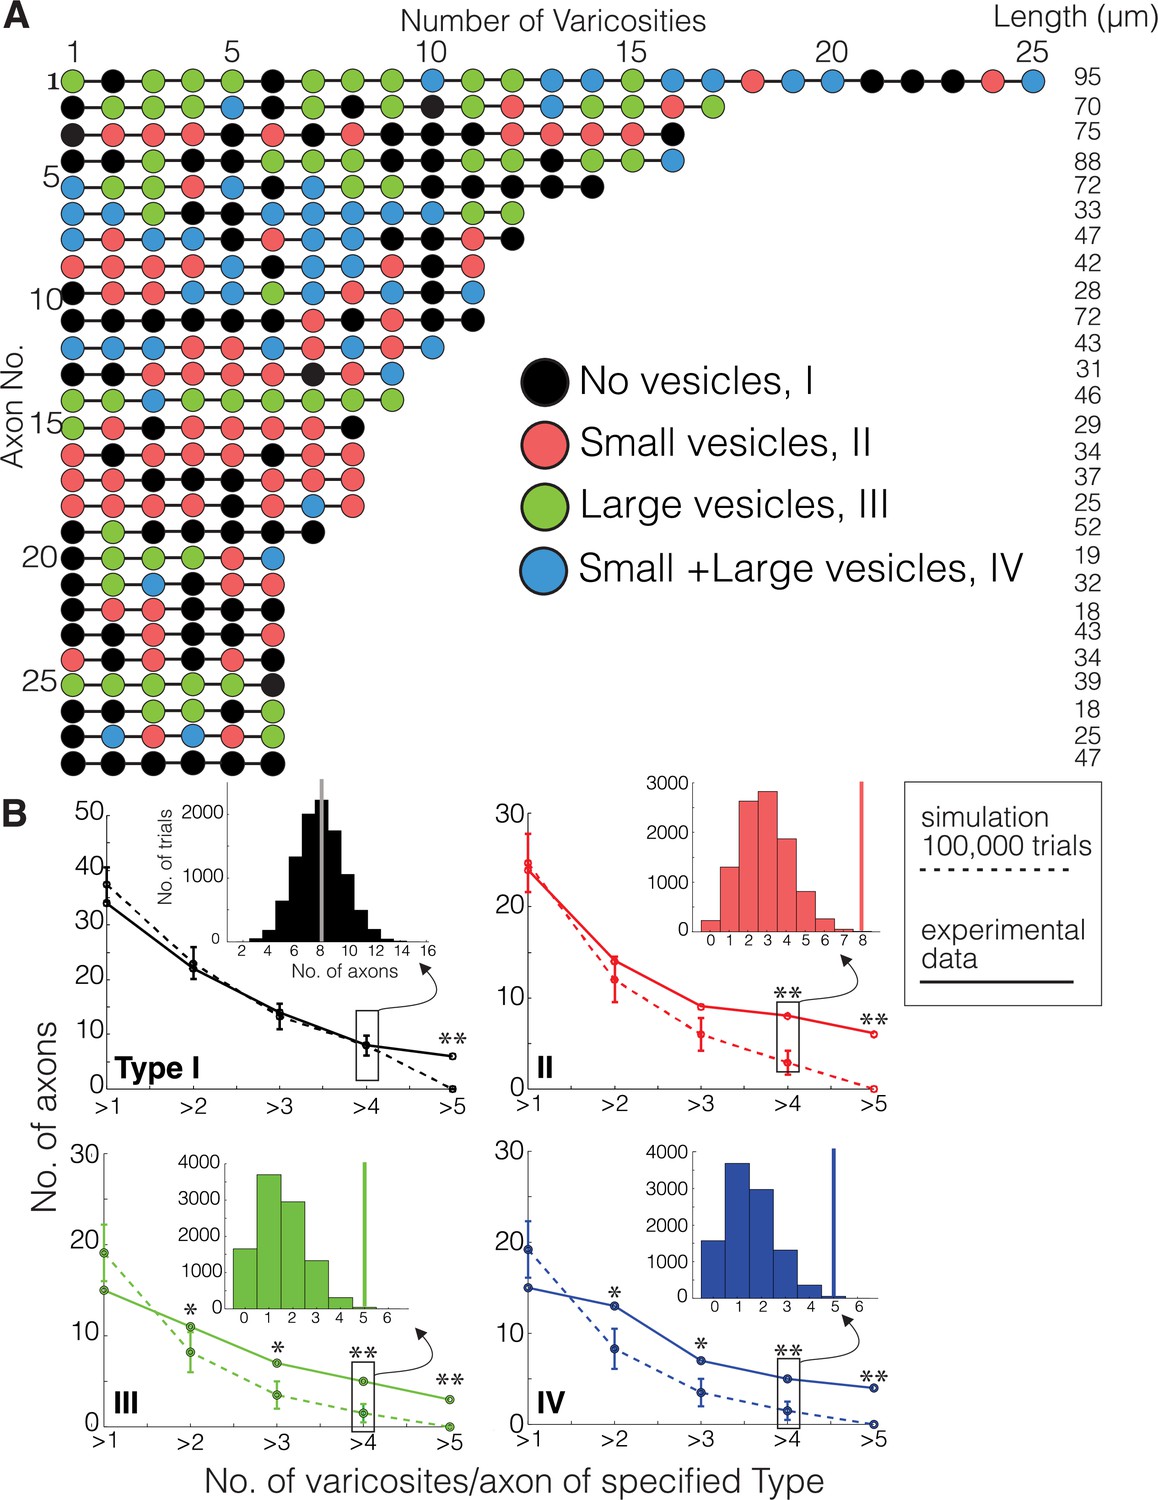
Monte Carlo simulation of dopaminergic (DA) varicosity types.
(A) Mito-Apex2 DA axons containing six or more varicosities in the field of view are depicted with the linear order of their varicosities. Each varicosity is shown as a colored circle with each color representing a different varicosity type. The length (µm) of each reconstructed DA axon is listed on the right. (B) For every DA axon with three or more varicosities reconstructed from the real dataset, a simulated DA axon was created to match the number of varicosities/axon (e.g., a simulated DA axon was made with three varicosities to match a real DA axon with three varicosities). A Monte Carlo simulation was then ran 100,000 times to randomly assign varicosity types based on their population frequency reported in Figure 2A. For both simulated (dashed line) and real (solid line) DA axons, the number of axons was plotted against the number of varicosities/axon containing the specified type for each graph (e.g., in the top left graph, all axons containing more than one Type I varicosity were counted at the ‘>1’ position of the x-axis). Inset: example of the simulated distribution and real axon (solid vertical line) data generated for these analyses for the number of axons that had more than four varicosities of each type. Asterisks denote statistically significant differences between the simulated and real data when the p-value is between 0.01 and 0.05 (*) or lower than 0.01 (**). p-Values are shown for each data point in Figure 3—source data 1. See Source code 1 for MATLAB scripts used for Monte Carlo simulations.
-
Figure 3—source data 1
Table of p-values for Monte Carlo simulations.
The top row (light blue) represents each data point in the x-axis of Figure 3B that counts the number of axons containing greater than the specified number of varicosities/axon. The left column (light yellow) separates each varicosity type. p-values were calculated by dividing the number of times the simulated axon had a specified varicosity type (yellow column) appear more than the number of specified times (blue row) by the total number of Monte Carlo simulations (100,000).
- https://cdn.elifesciences.org/articles/71981/elife-71981-fig3-data1-v1.pdf
Figure 3—figure supplement 1
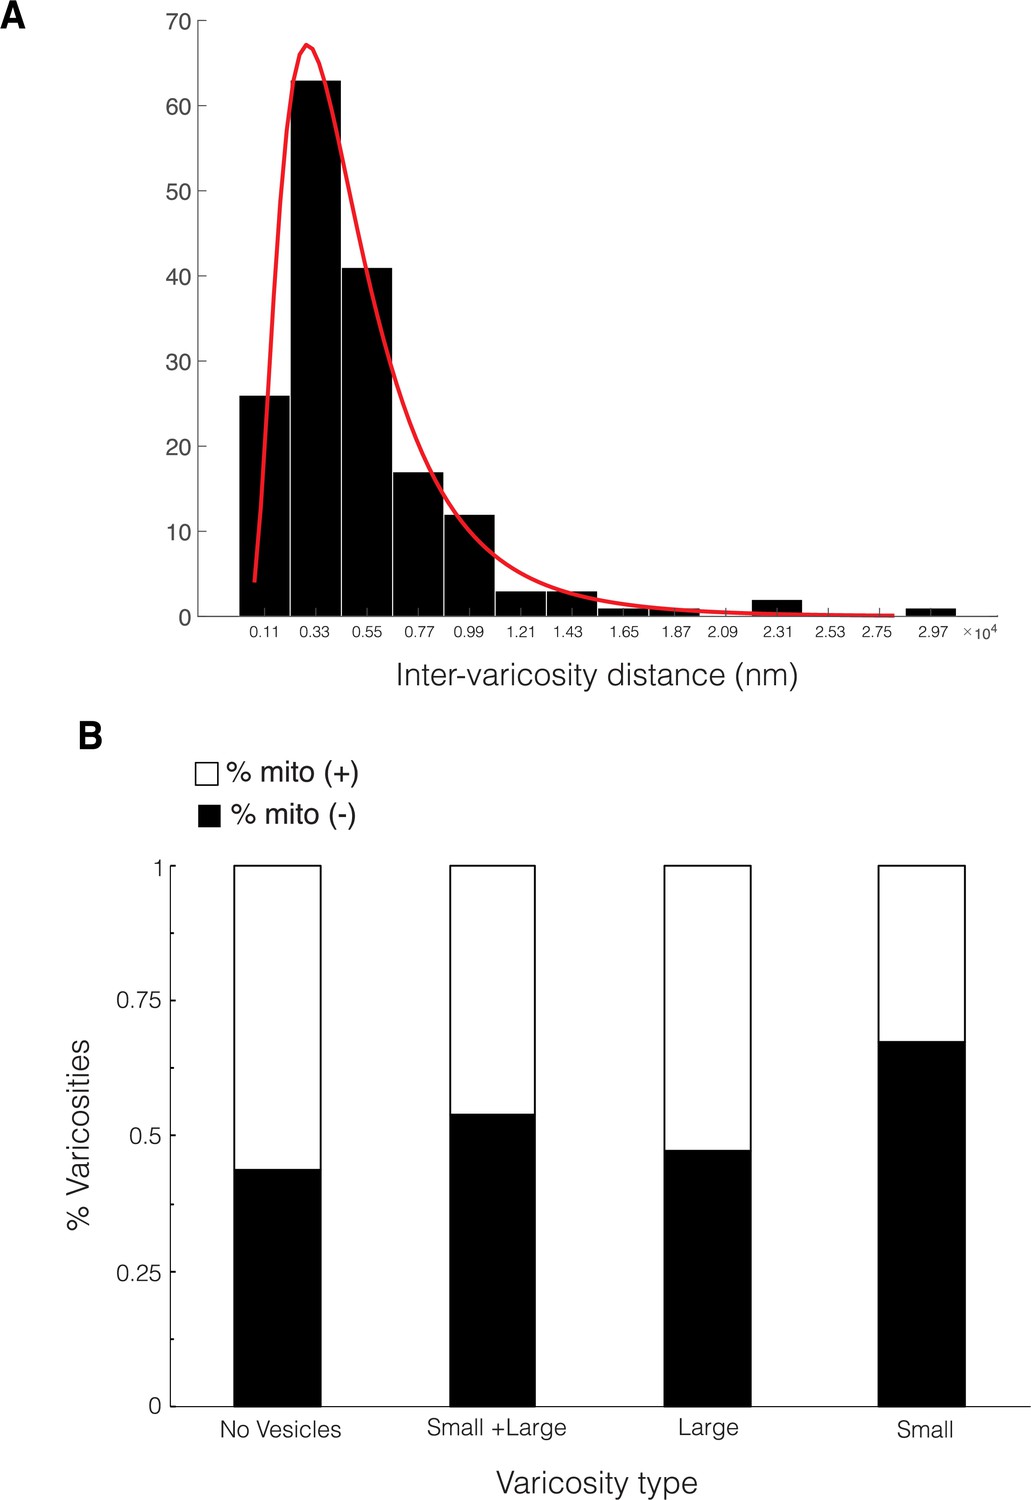
Inter-varicosity distances and frequency of mitochondria at varicosity sites in dopaminergic (DA) axons.
(A) Histogram of pair-wise inter-varicosity distances for all DA axon varicosity types (n = 170 varicosities across 29 axons). Average inter-varicosity distance is 5.3 µm, 4.1 µm standard deviation. Red line shows a curve fit to a log-normal distribution with mu = [8.27752, 8.46656], and sigma = 0.624272 [0.56422, 0.698742], with confidence intervals indicated in brackets. (B) Stacked bar plot showing the percent varicosity with and without mitochondria for each varicosity type.
Figure 4 with 3 supplements

Dopaminergic (DA) axons make rare synapses on the soma and shaft of nucleus accumbens (NAc) resident neurons.
Three examples of DA axons making synapses on the soma (left column) and shaft (right column) are depicted. Mito-Apex2 DA axons are shaded in light blue with an asterisk marking an Apex2-positive mitochondria which are significantly darker than Apex2-negative mitochondria (green arrowhead). Red arrows point to the post-synaptic density (PSD) formed between the DA axon and soma. Pie chart in upper left corner shows ratio of synaptic to non-synaptic DA axon varicosities. Scale bar = 500 nm.
Figure 4—figure supplement 1
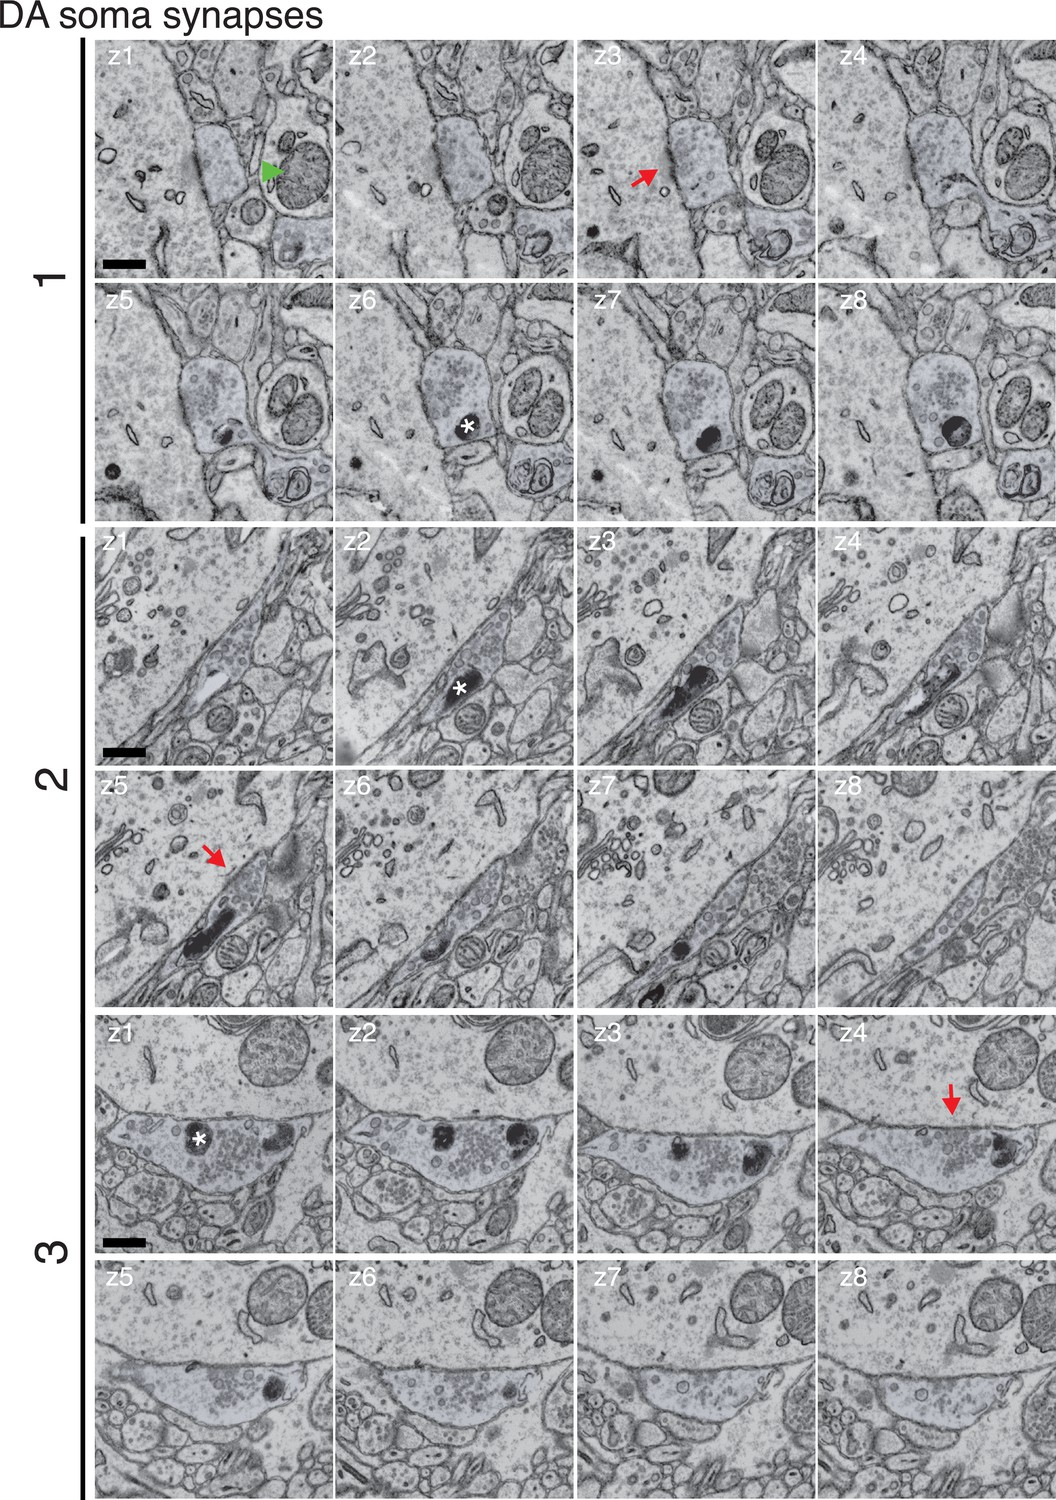
Montage of identified dopaminergic (DA) axons making soma synapses.
Three (1–3) putative DA soma synapses shown in Figure 4 are more clearly depicted by showing eight serial electron microscopy (EM) sections spanning the synapse (z1–z8). Red arrows point to the post-synaptic density (PSD), green arrowhead shows Apex2-negative mitochondria for comparison to Apex2+ mitochondria, marked with an asterisk. Scale bar = 0.5 µm.
Figure 4—figure supplement 2
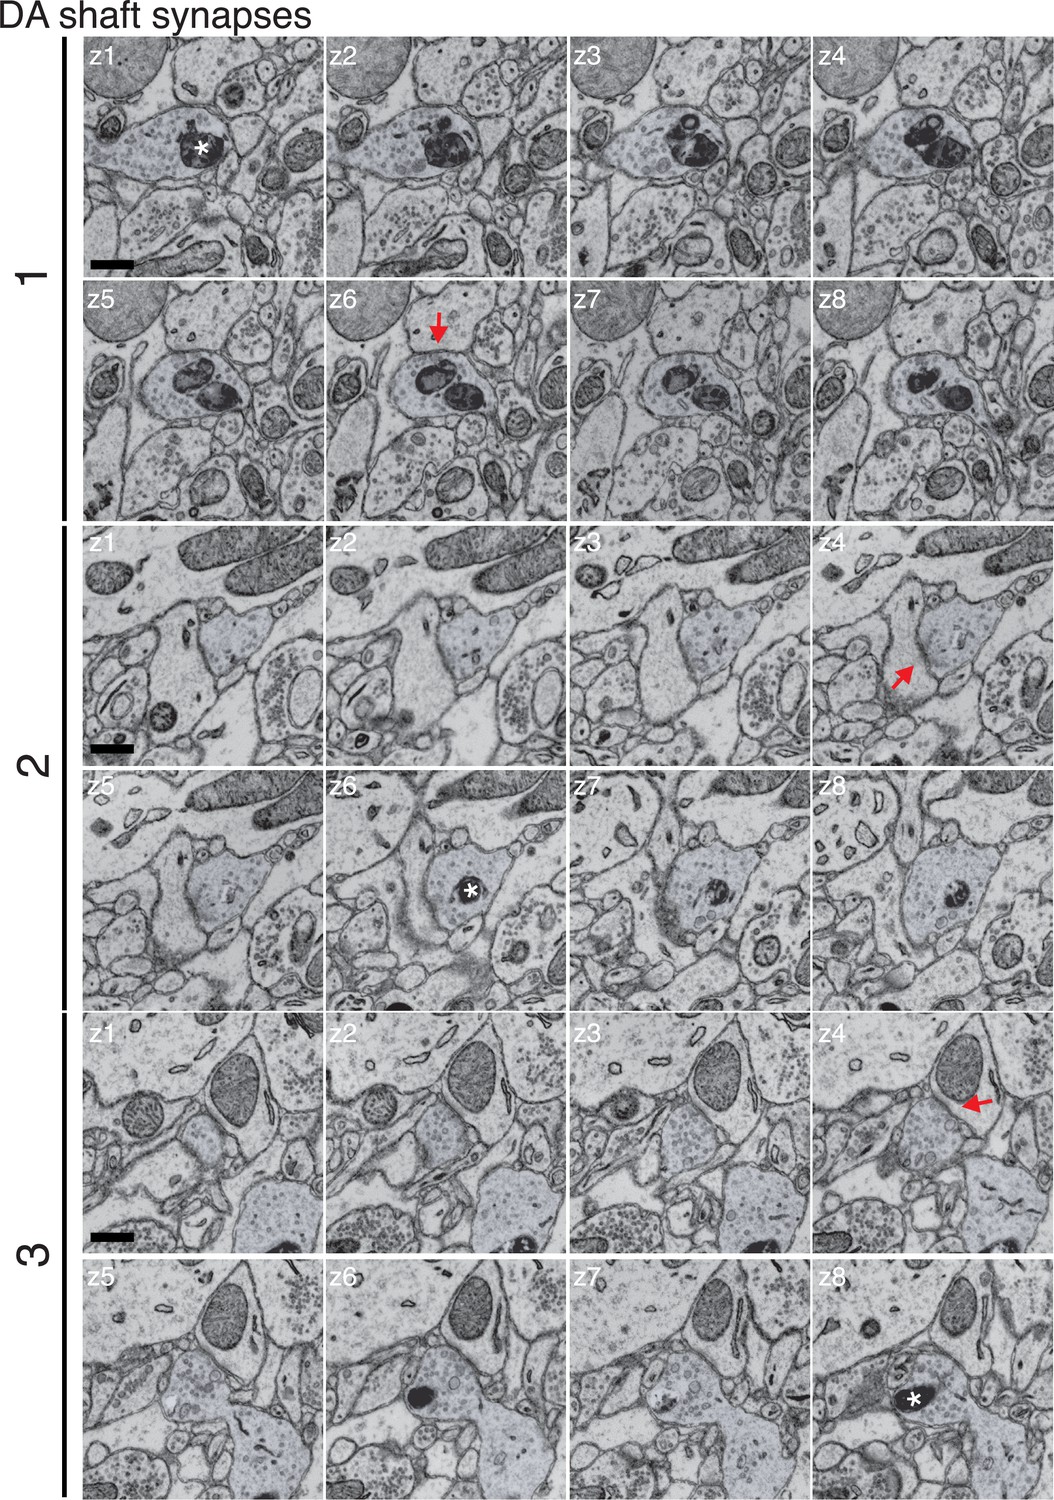
Montage of identified dopaminergic (DA) axons making shaft synapses.
Three (1–3) putative DA shaft synapses shown in Figure 4 are more clearly depicted by showing eight serial electron microscopy (EM) sections spanning the synapse (z1–z8). Red arrows point to the post-synaptic density (PSD), asterisks marks the Apex2+ mitochondria. Scale bar = 0.5 µm.
Figure 4—figure supplement 3
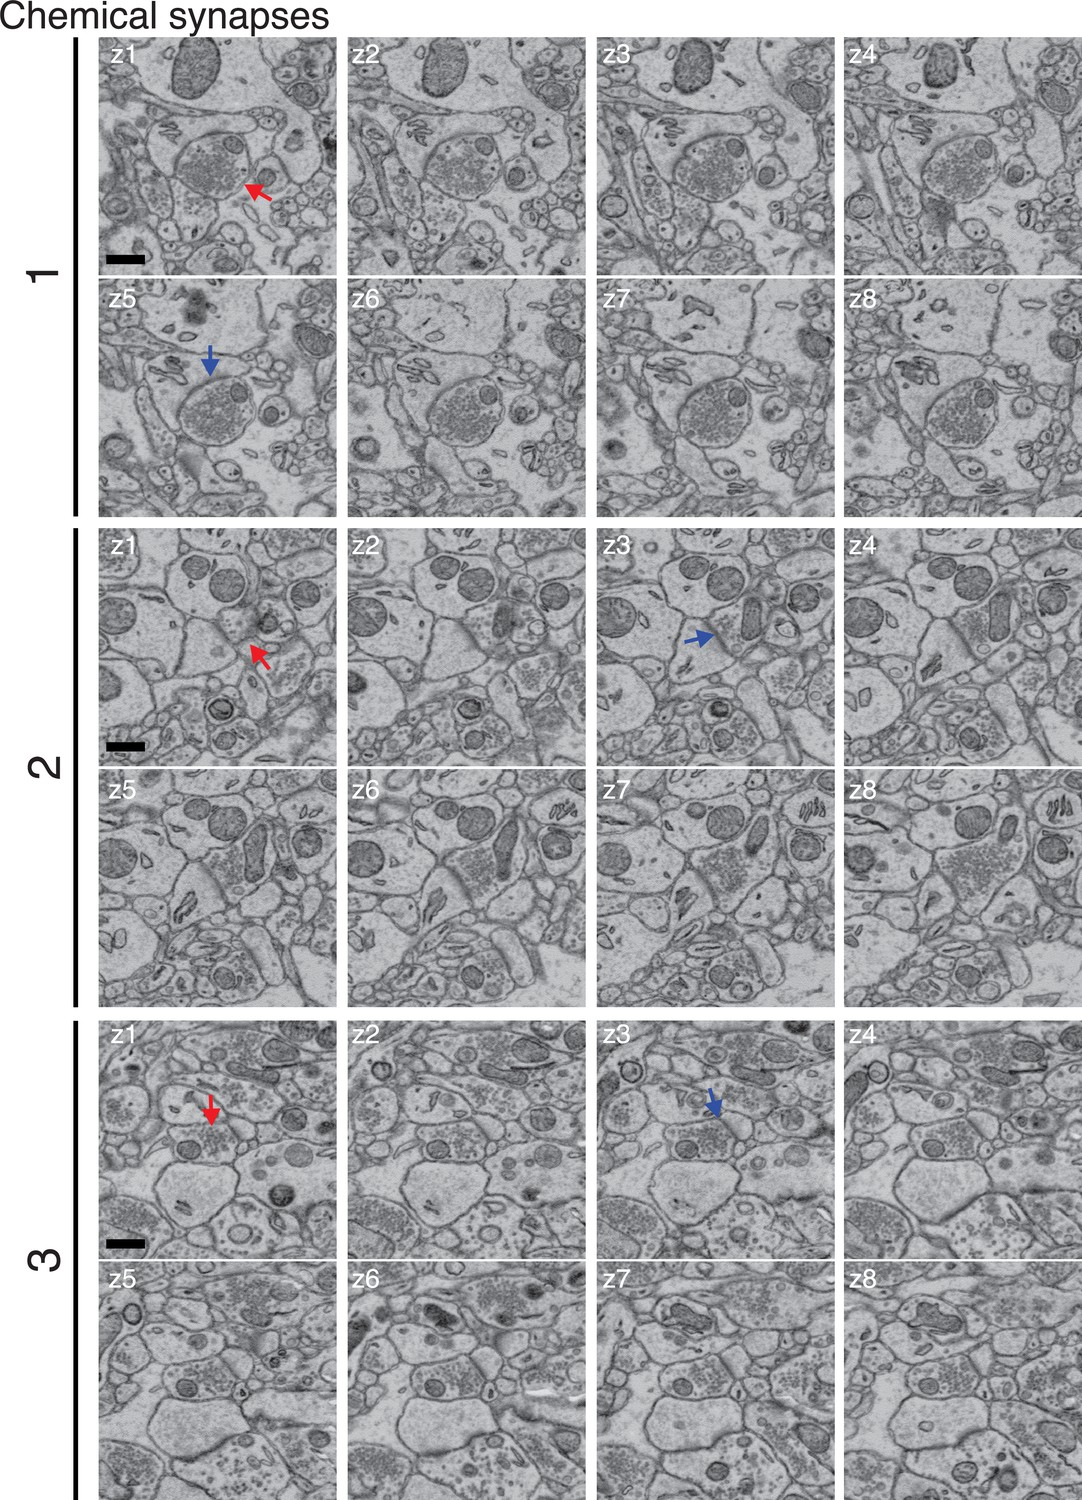
Montage of representative chemical synapses.
Three (1–3) chemical synapses identified by a prominent vesicle cloud and post-synaptic density (PSD) in apposition to a post-synaptic neurite were identified in the 6 nm resolution mito-Apex2 dataset. For each example, eight serial electron microscopy (EM) sections spanning the synapse were placed in order (z1–z8). Red arrows point to vesicle cloud and blue arrows point to the PSD. Scale bar = 0.5 µm.
Figure 5 with 1 supplement
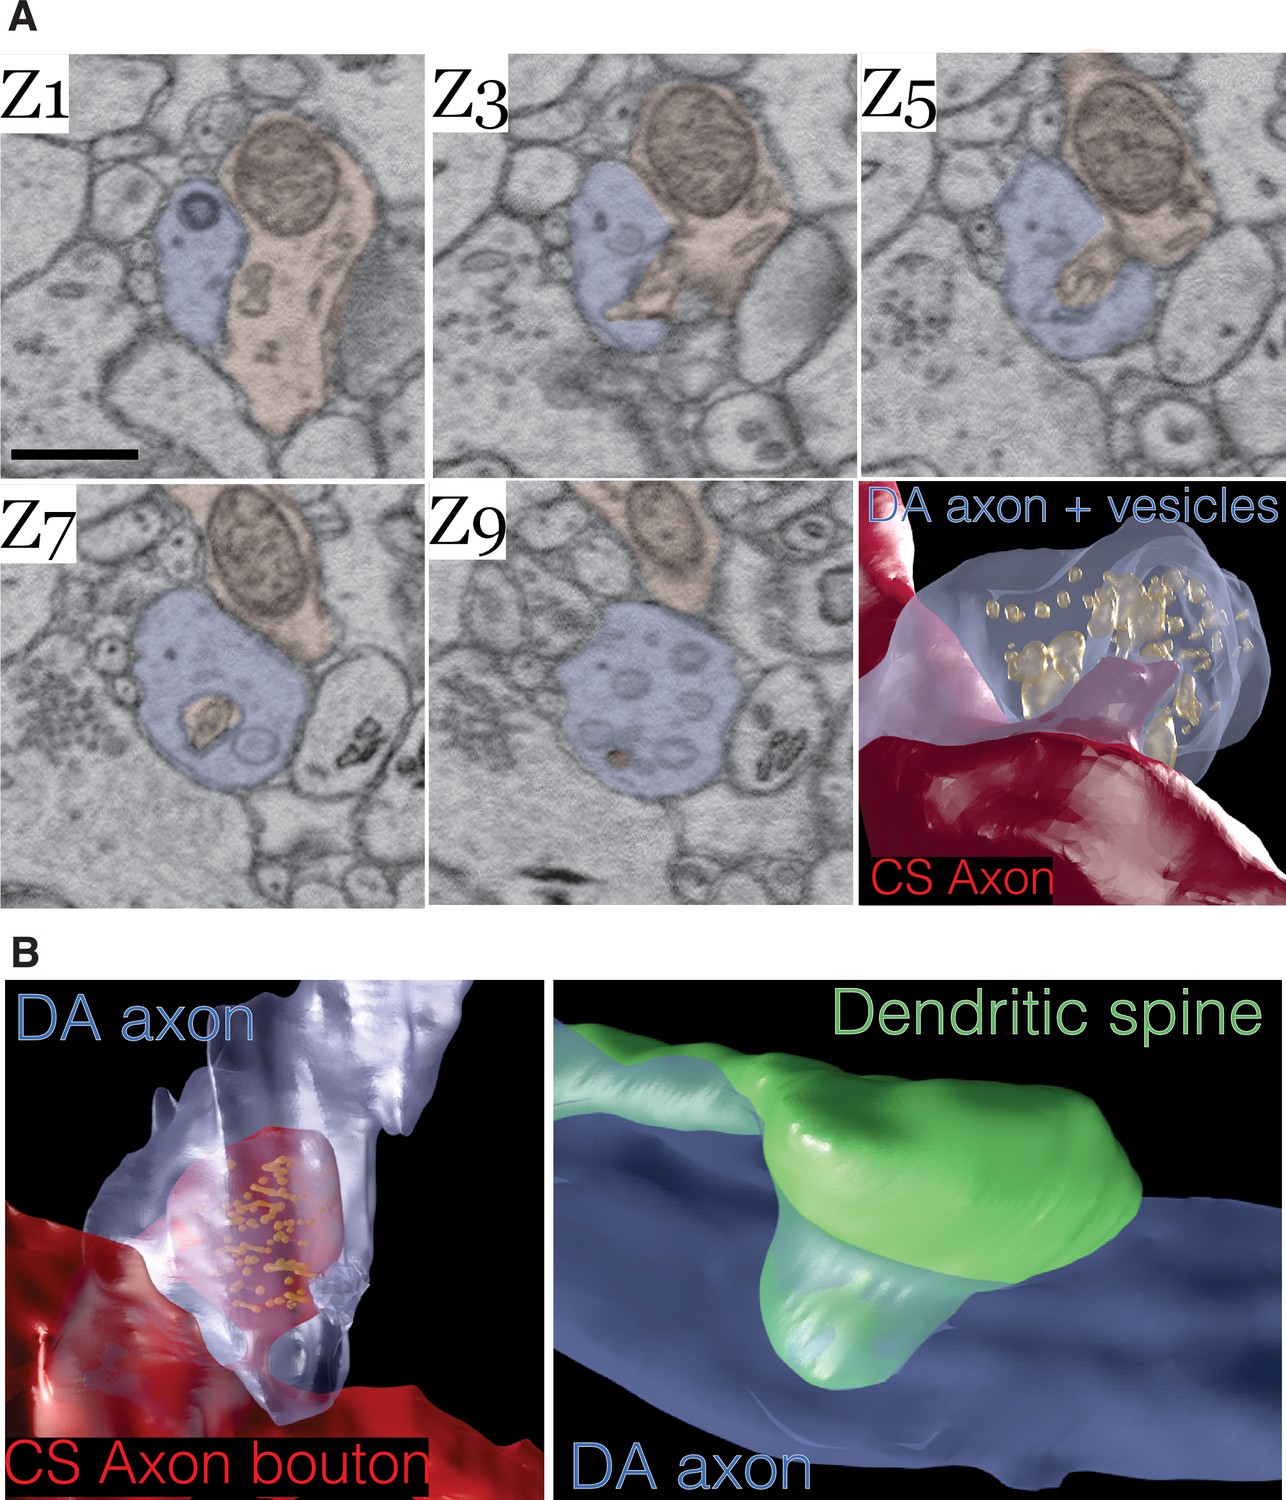
Dopamine contact points are physical interdigitations between dopaminergic (DA) axons and either afferent axons or nucleus accumbens (NAc) dendrites.
(A) Image montage of every other electron microscopy (EM) serial section (Z1–Z9) from a mouse expressing mito-Apex2 in DA neurons. Highlighted in blue is the mito-Apex2 DA axon, and in red is the interdigitating chemical synapse (CS) axon. Bottom right: 3D rendering showing interdigitation of a CS axon (red) into the vesicle-filled DA axon (blue). (B) 3D renderings of two other examples of DA axon interdigitations. A vesicle-filled CS axon (red) or dendritic spine (green) interdigitate into a DA axon (blue) in the left and right images, respectively. Scale bar = (A) 1 µm.
Figure 5—figure supplement 1
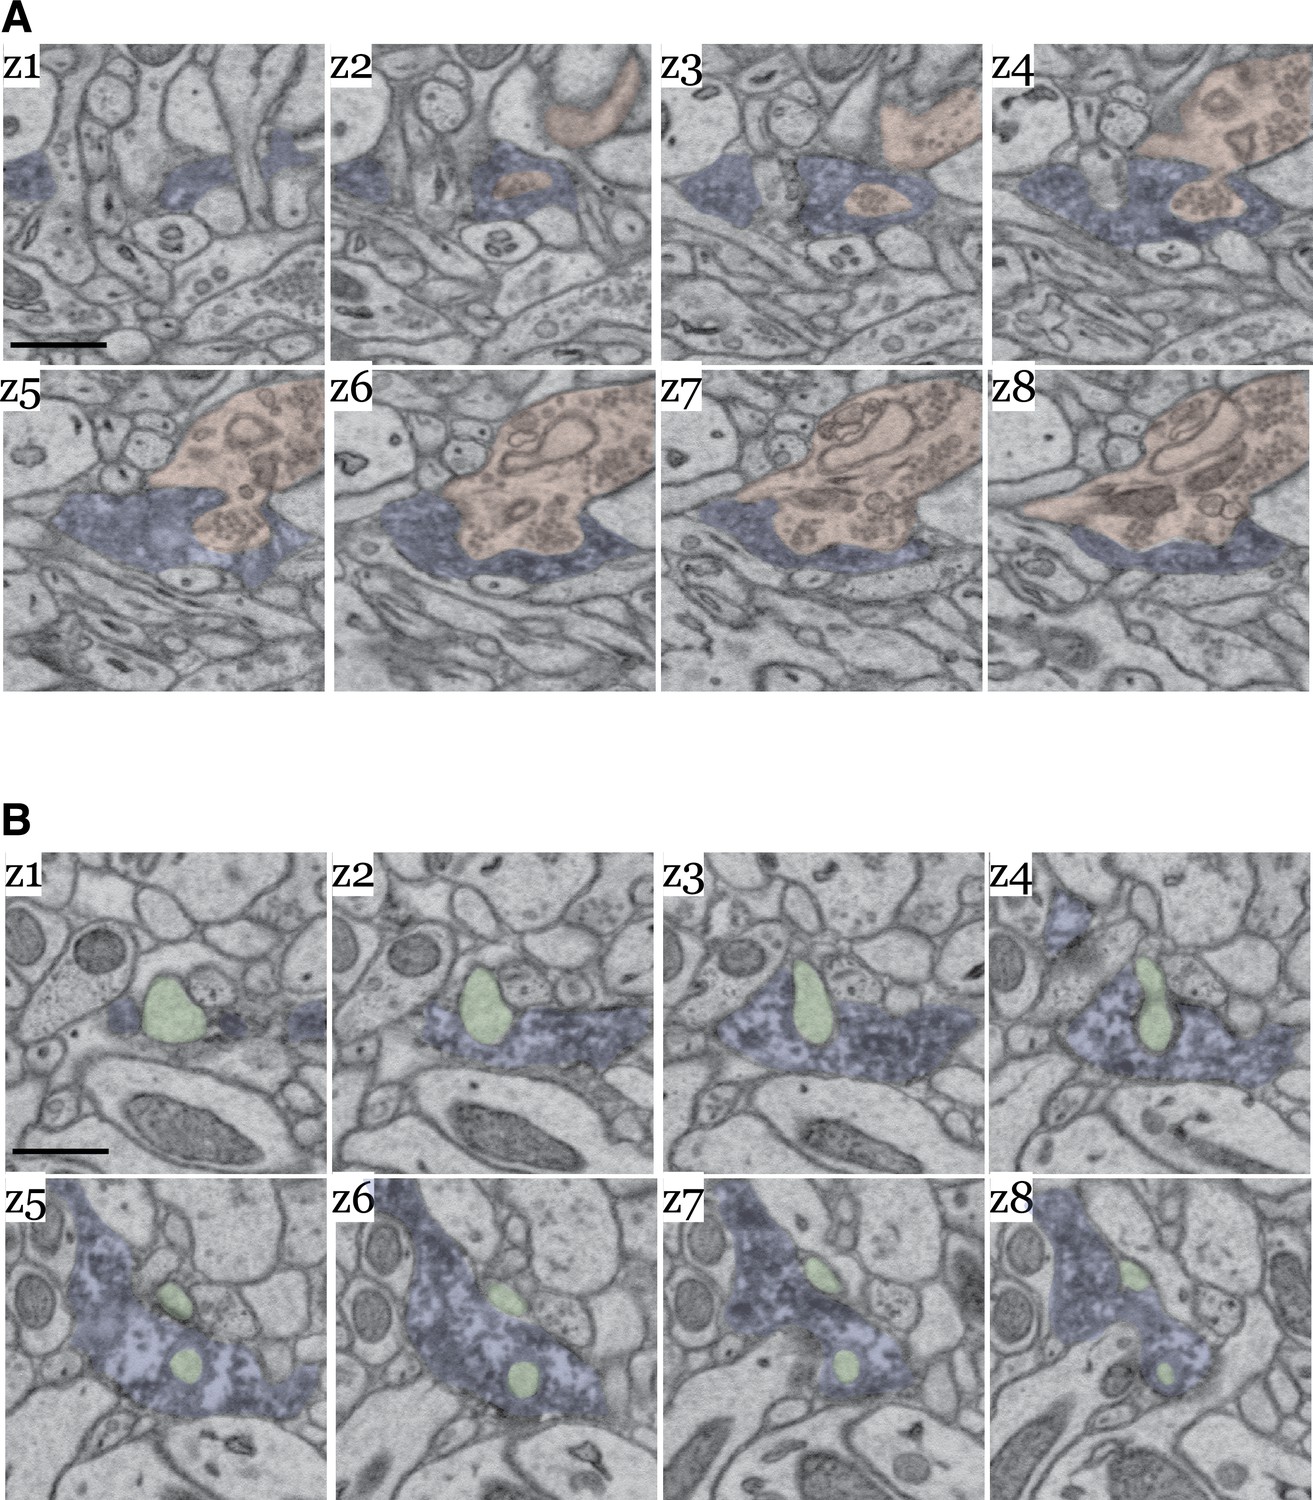
Image montage of dopaminergic (DA) axon interdigitations.
(A) Electron microscopy (EM) z-series of the interdigitation between a cyto-Apex2 DA axon (blue) and vesicle-filled chemical synapse (CS) axon (red) that corresponds to the 3D rendering in Figure 5B, left image. (B) EM z-series of the interdigitation between a cyto-Apex2 DA axon (blue) and nucleus accumbens (NAc) dendritic spine (green) that corresponds to the 3D rendering in Figure 5B, right image. Scale bar = (A,B) 1 µm.
Figure 6 with 3 supplements
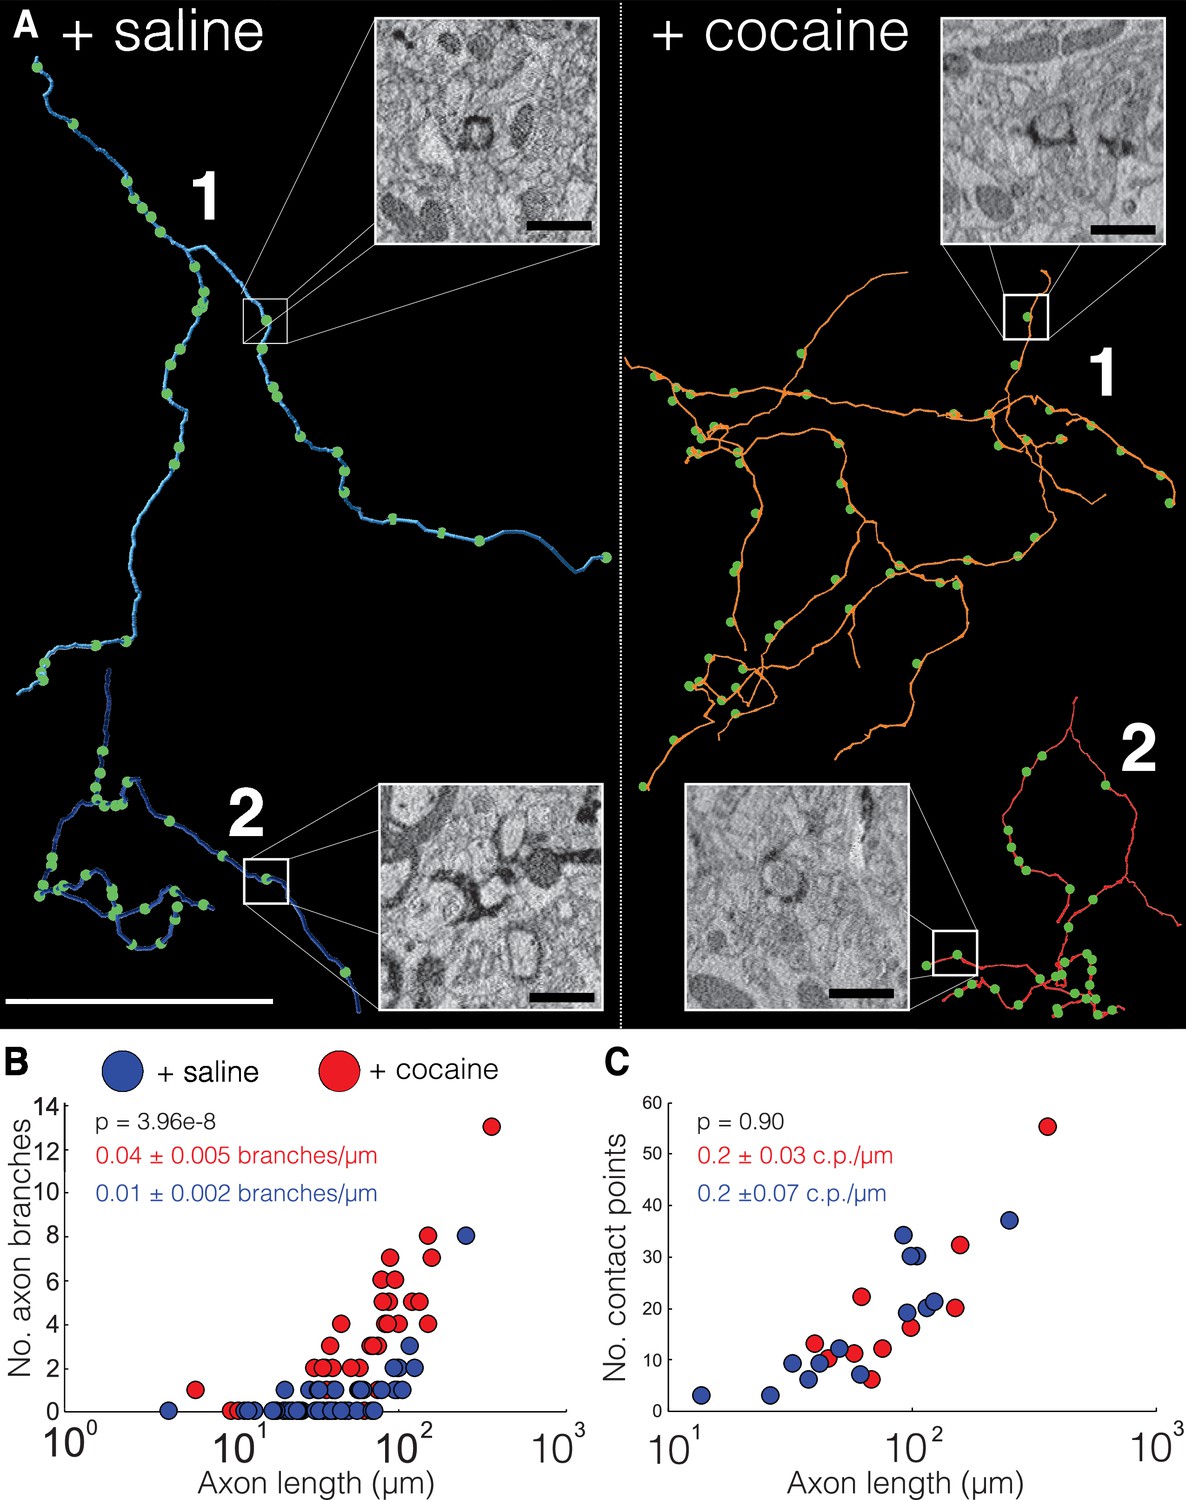
Cocaine increases branching of Apex2 dopamine axons in cocaine sensitized mice.
(A) Two representative reconstructions of dopaminergic (DA) axons each from saline- (left, blue) and cocaine- (right, red) treated mice. Green circles represent contact points (i.e., spinules) where other neurons interdigitate with the DA axon. Electron microscopy (EM) insets: four examples of contact points identified in 20 nm resolution datasets from control and cocaine datasets. (B) Scatter plot of the number of DA axons branches versus axon length (μm) (+saline: 0.01 ± 0.002 branches/µm length of axon, n = 44 axons, two mice; +cocaine: 0.04 ± 0.005 branches/µm length of axon, n = 41 axons, two mice. p = 3.96e-8. (C) Scatter plot of the number of contact points (i.e., ‘spinules’) versus axon length (µm) + saline: 0.2 ± 0.07 contact points (c.p.)/µm length of axon, n = 240 contact points over 14 axons, two mice; +cocaine: 0.2 ± 0.03 c.p./µm length of axon, n = 142 contact points over nine axons, two mice. p = 0.90). Data: mean ± SEM. p-Values: two-tailed Mann-Whitney U test. Scale bar = (A) reconstructions = 40 µm, EM insets = 1 µm.
Figure 6—figure supplement 1
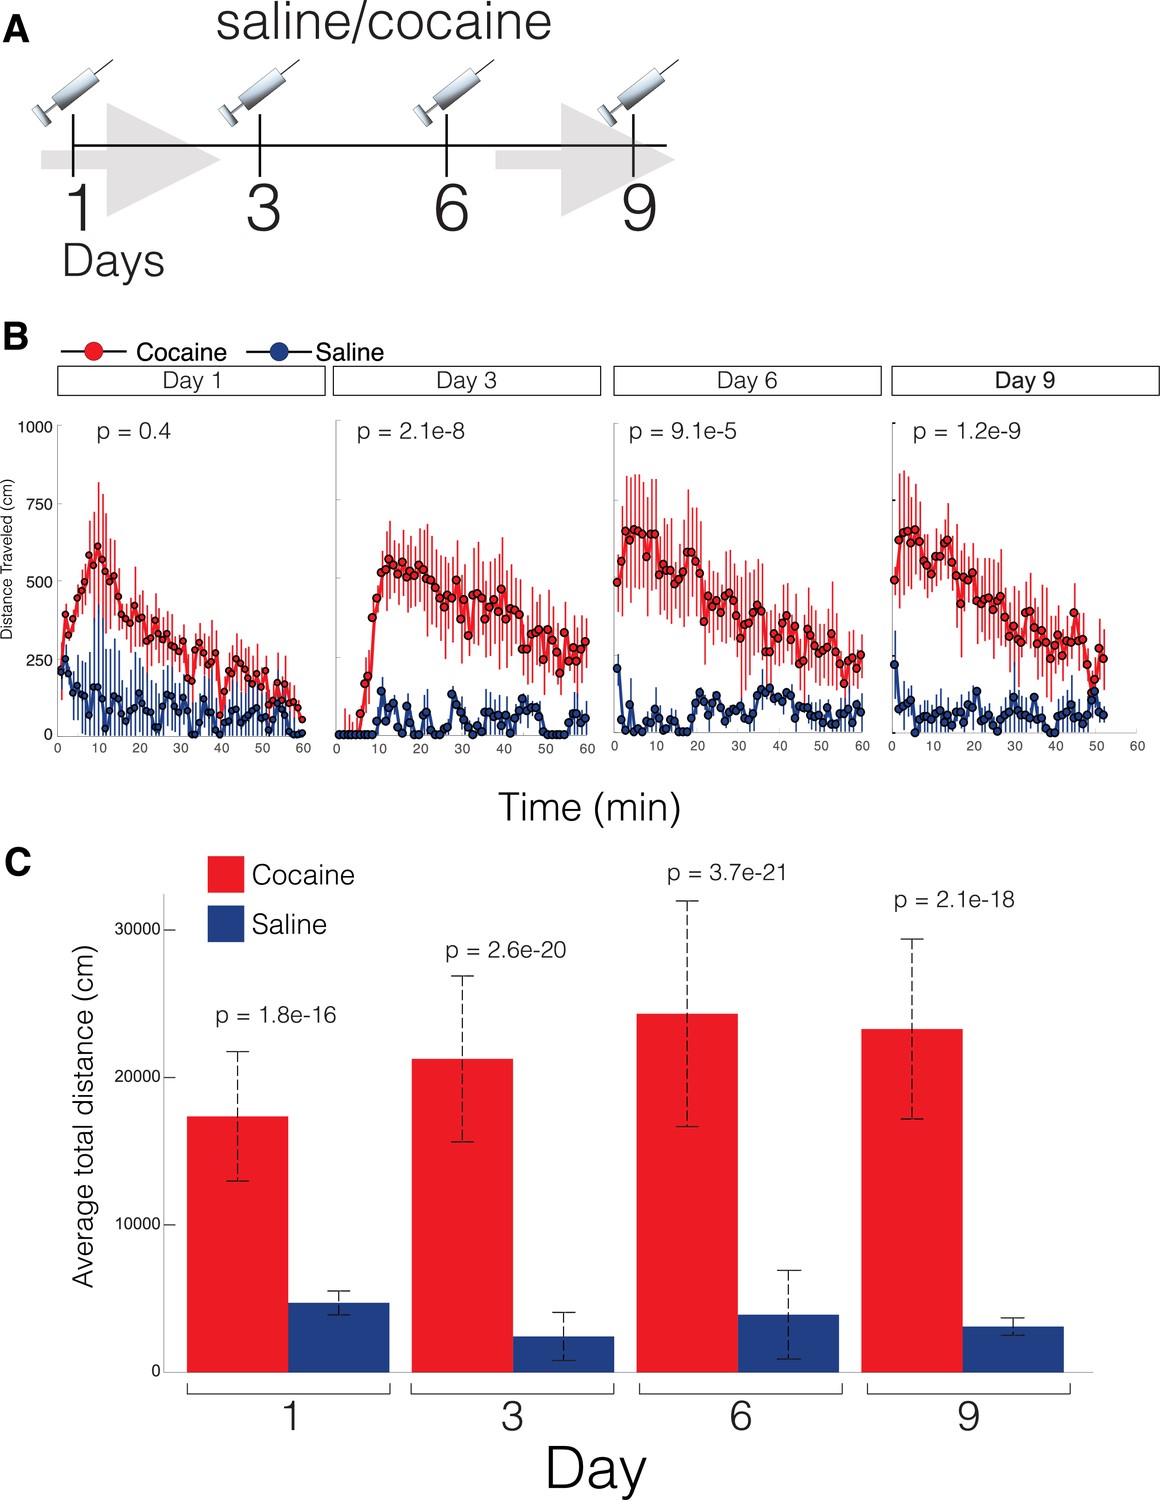
Cocaine-treated mice have increased locomotor activity.
(A) Cartoon depicting cocaine sensitization protocol: Mice received a single intraperitoneal (IP) injection of cocaine (10 mg/kg) or equivalent volume of saline, placed in a novel cage environment, and their locomotor activity was monitored for 1 hr. This procedure was repeated every third day for four rounds of injections. Four days following the last injection (e.g., day 13), mice were perfused and brains processed for Apex2/EM staining (see Materials and methods). (B) Scatter plot of the average distance traveled (cm) versus time for the first day of cocaine or saline injection. (C) Total average velocity (cm) of mice immediately following IP cocaine or saline injections. For cocaine and saline, n = 3 mice each; data = mean ± SEM. p-Value: two-tailed Mann-Whitney U test.
Figure 6—figure supplement 2
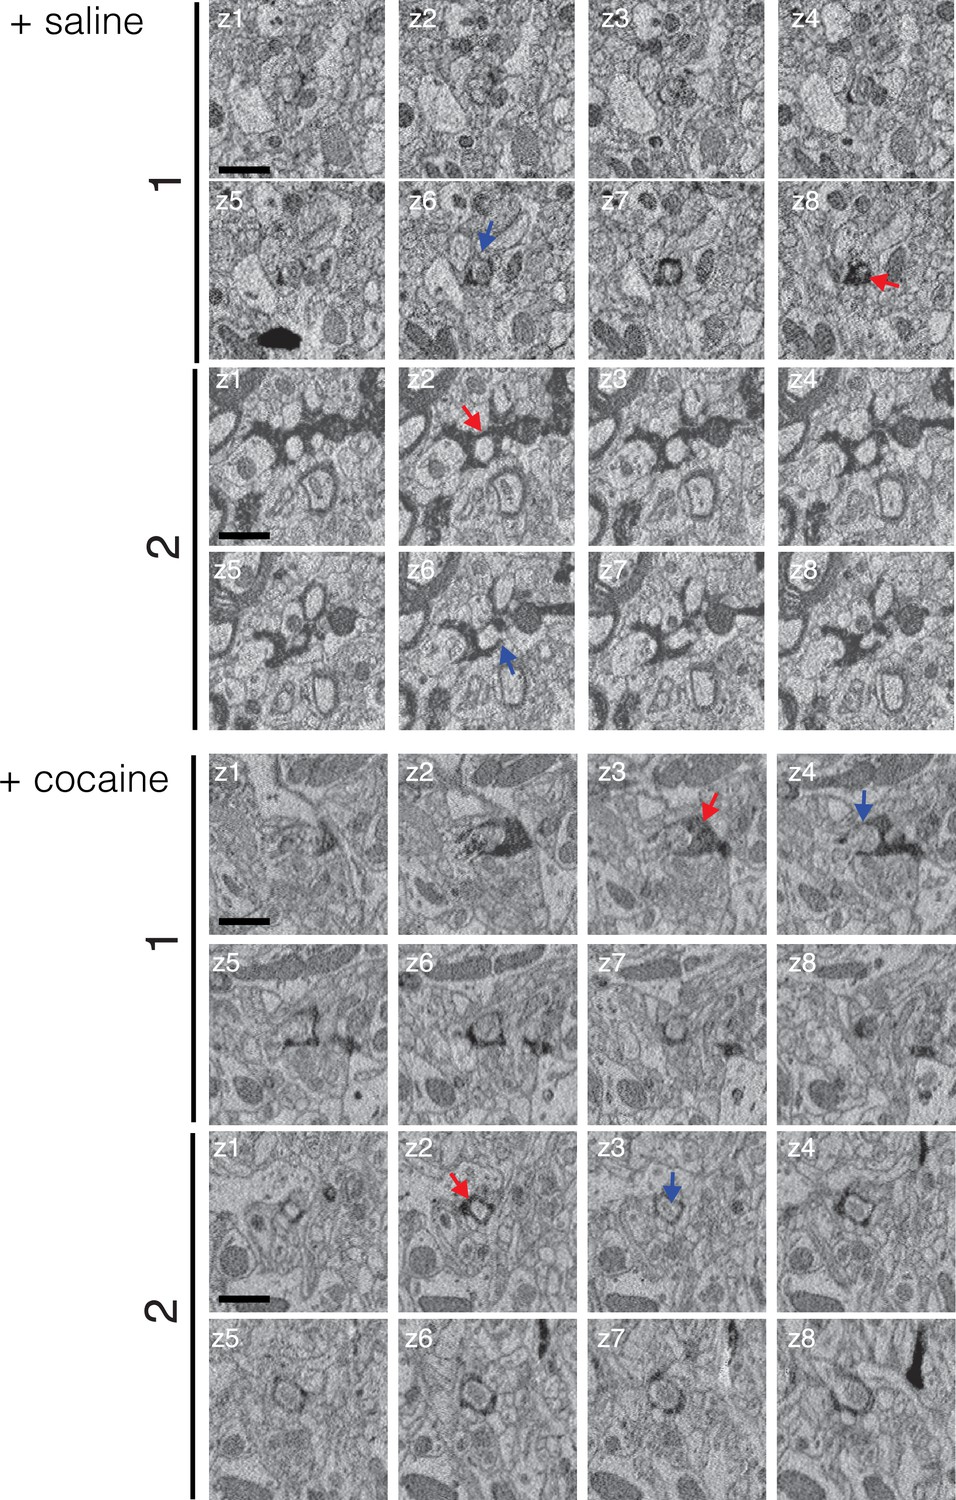
Contact points from control and cocaine 20 nm resolution datasets.
Two image montages of electron microscopy (EM) serial section (Z1–Z8) from either a saline- (top: 1,2) or cocaine- (bottom: 1,2) treated mice expressing cyto-Apex2 in dopaminergic (DA) neurons, and imaged at 20 nm in plane resolution. Red arrow points to the cyto-Apex2 DA axon, and blue arrow points to the Apex2-negative neurite interdigitating with the DA axon. Note how the Apex2-negative neurite becomes wholly contained within the DA axon. Scale bar = 1 µm.
Figure 6—figure supplement 3
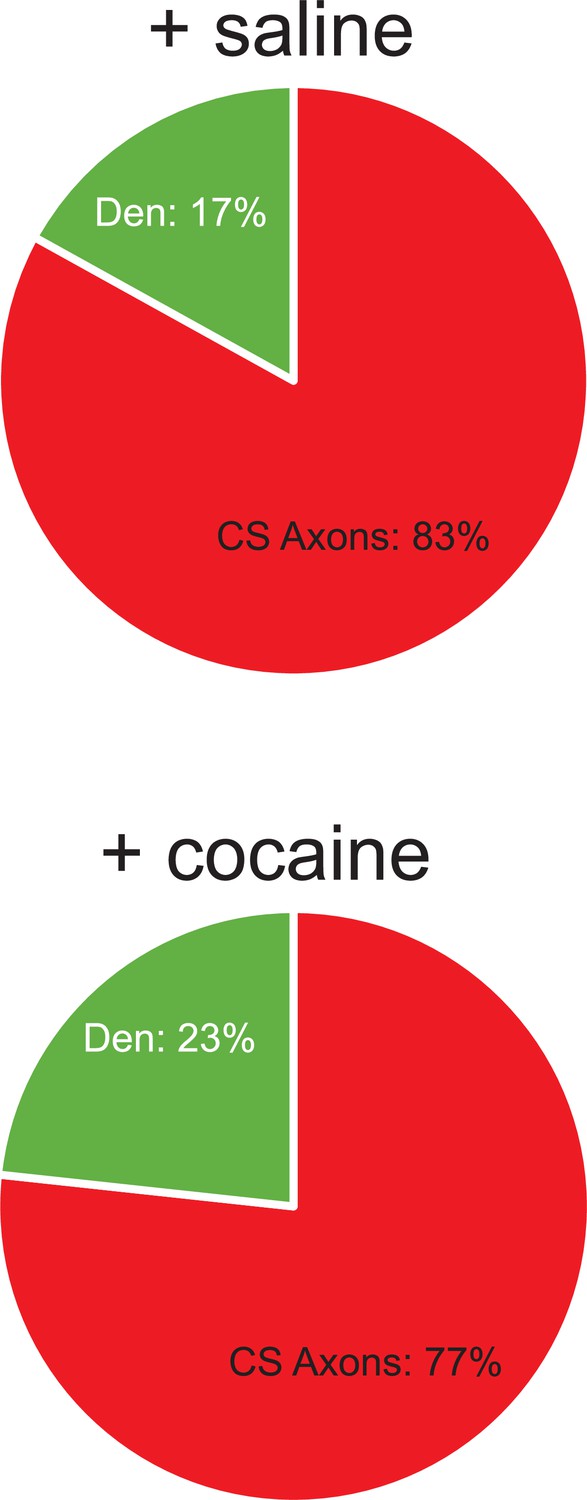
Cocaine does not change the proportion of dopamine targets.
Pie charts showing proportion of contact points (i.e., ‘spinules’) that are with chemical synapse (CS) axons (red) and dendrites (green) in saline- (top) and cocaine- (bottom) treated mice (+saline: 83% (49/59) axo-axonic, 17% (10/59) axo-dendritic, n = 19 dopaminergic (DA) axons with 59 contact points scored; +cocaine: 77% (56/73) axo-axonic, 23% (17/73) axo-dendritic, n = 20 DA axons with 73 contact points scored).
Figure 7
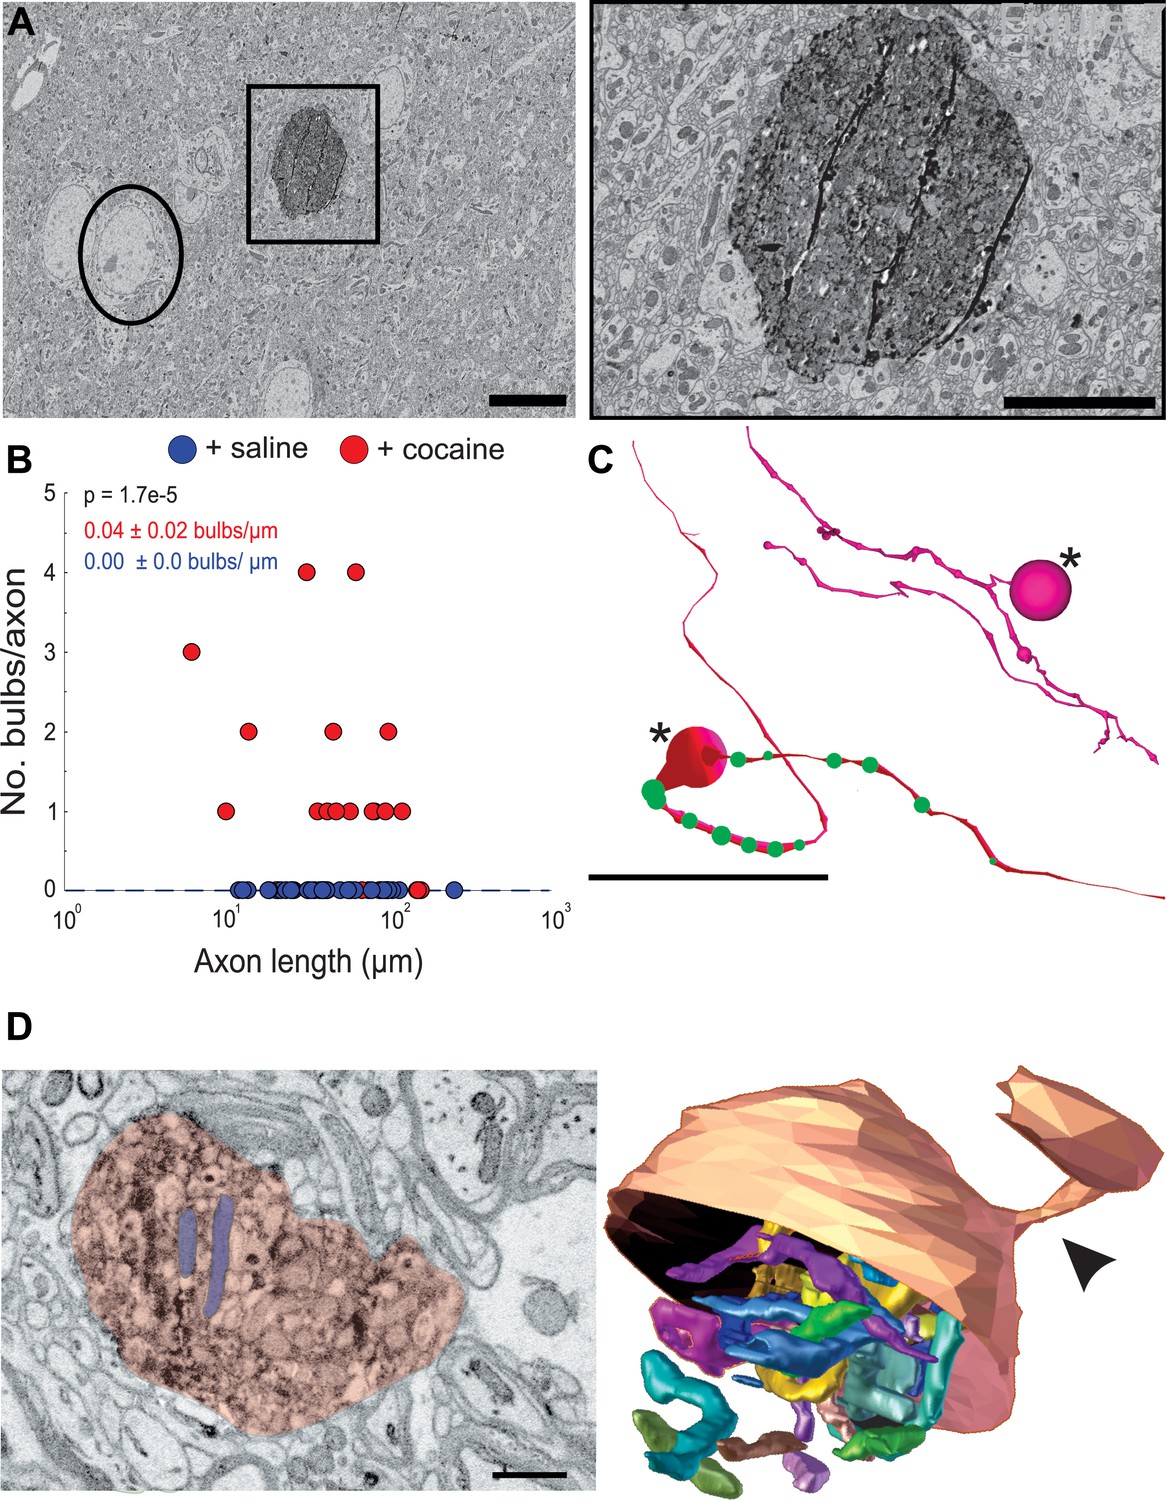
Cocaine results in the formation of large swellings filled with mitochondria in Apex2+ dopaminergic (DA) axons.
(A) Left: 2D electron microscopy (EM) image of Apex2 labeled DA axon bulb in cocaine-treated mouse (square) as compared to a neighboring neuronal soma (circle). Right: zoomed in 2D EM image of Apex2 DA axon bulb from left panel. (B) Scatter plot of the number of large swellings versus axon length (μm) + saline: 0.00 ± 0.0 swellings/µm length of axon, n = 29 axons; two mice + cocaine: 0.04 ± 0.02 swellings/µm length of axon, n = 30 axons, two mice. p = 1.7e-5. (C) Reconstructions of two representative Apex+ dopamine axons with large swellings (asterisk) and medium sized swellings (green spheres). Top reconstruction depicts an axon with a terminal axon bulb and bottom reconstruction shows one along the axon. (D) Left: 2D EM image of Apex+ large DA axon swellings (red) filled with mitochondria (two examples highlighted in purple) found in the nucleus accumbens (NAc) of cocaine-treated animals. Both swellings are filled with mitochondria (examples highlighted in blue). Right: 3D segmentation of swelling and extremely long and coiled mitochondria found inside. Only the top half of the DA axon swelling is depicted to illustrate the mitochondria contained within. In this example, the swelling is at the end of the DA axon where it is attached to a thinner portion of the axon (arrowheads). Scale bar: (A) left: 10 µm, right: 5 µm, (C) 20 μm, (D) 500 nm. Data: mean ± SEM. p-Values: two-tailed Mann-Whitney U test.
Figure 8
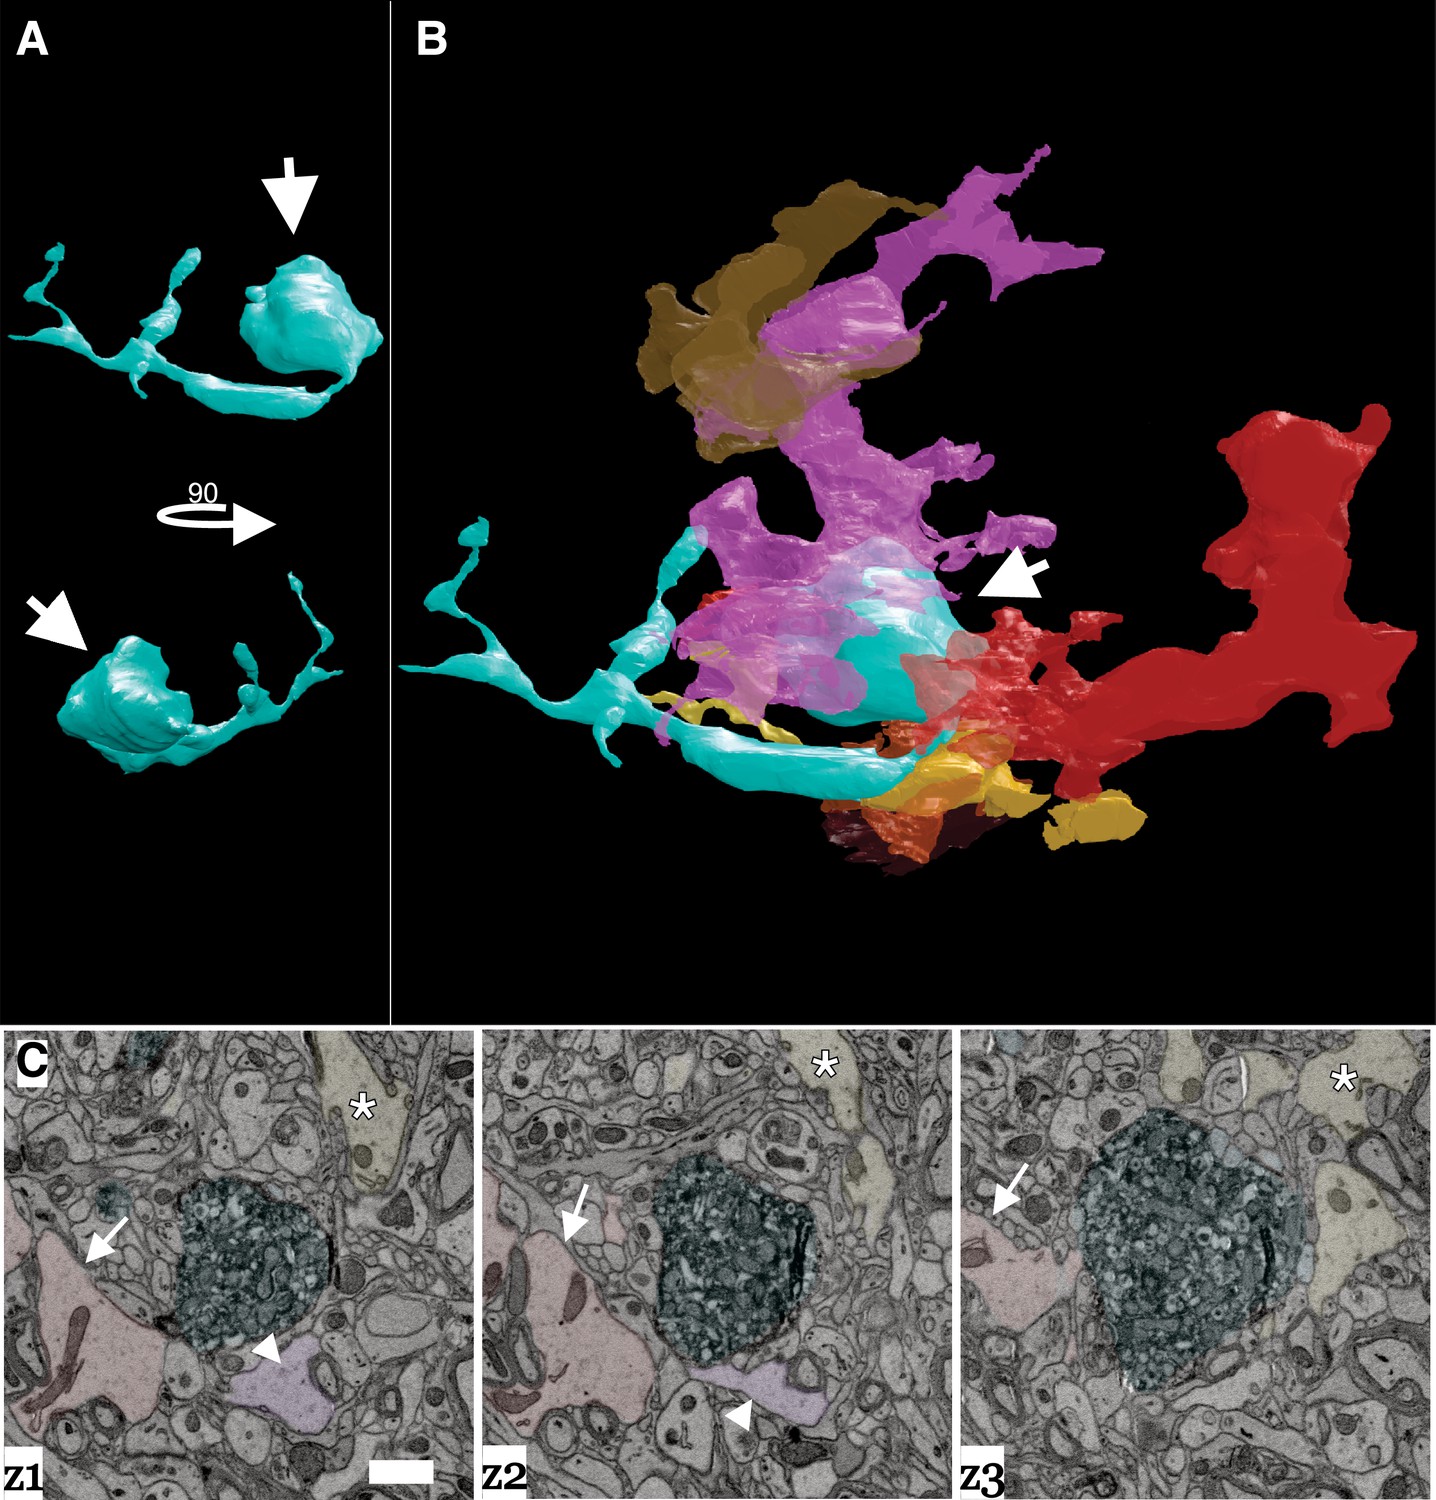
Dopamine axon swellings are surrounded by glia.
(A) 3D reconstruction of a dopamine axon swelling from a cocaine sensitized mouse. Bottom image is rotated 90 degrees relative to top view. White arrows point to swelling. (B) 3D reconstruction of dopamine axon swelling (arrow) from (A) with glia surrounding it. Each differently colored object represents a different glial cell. (C) Montage of three serial electron microscopy (EM) images color-coded to highlight the dopamine axon swelling (green), and three example glial cells (red/arrow, pink/arrowhead, yellow/asterisk) that correspond to (A) and (B). Scale bar: (C) 1 µm.
Figure 9 with 1 supplement
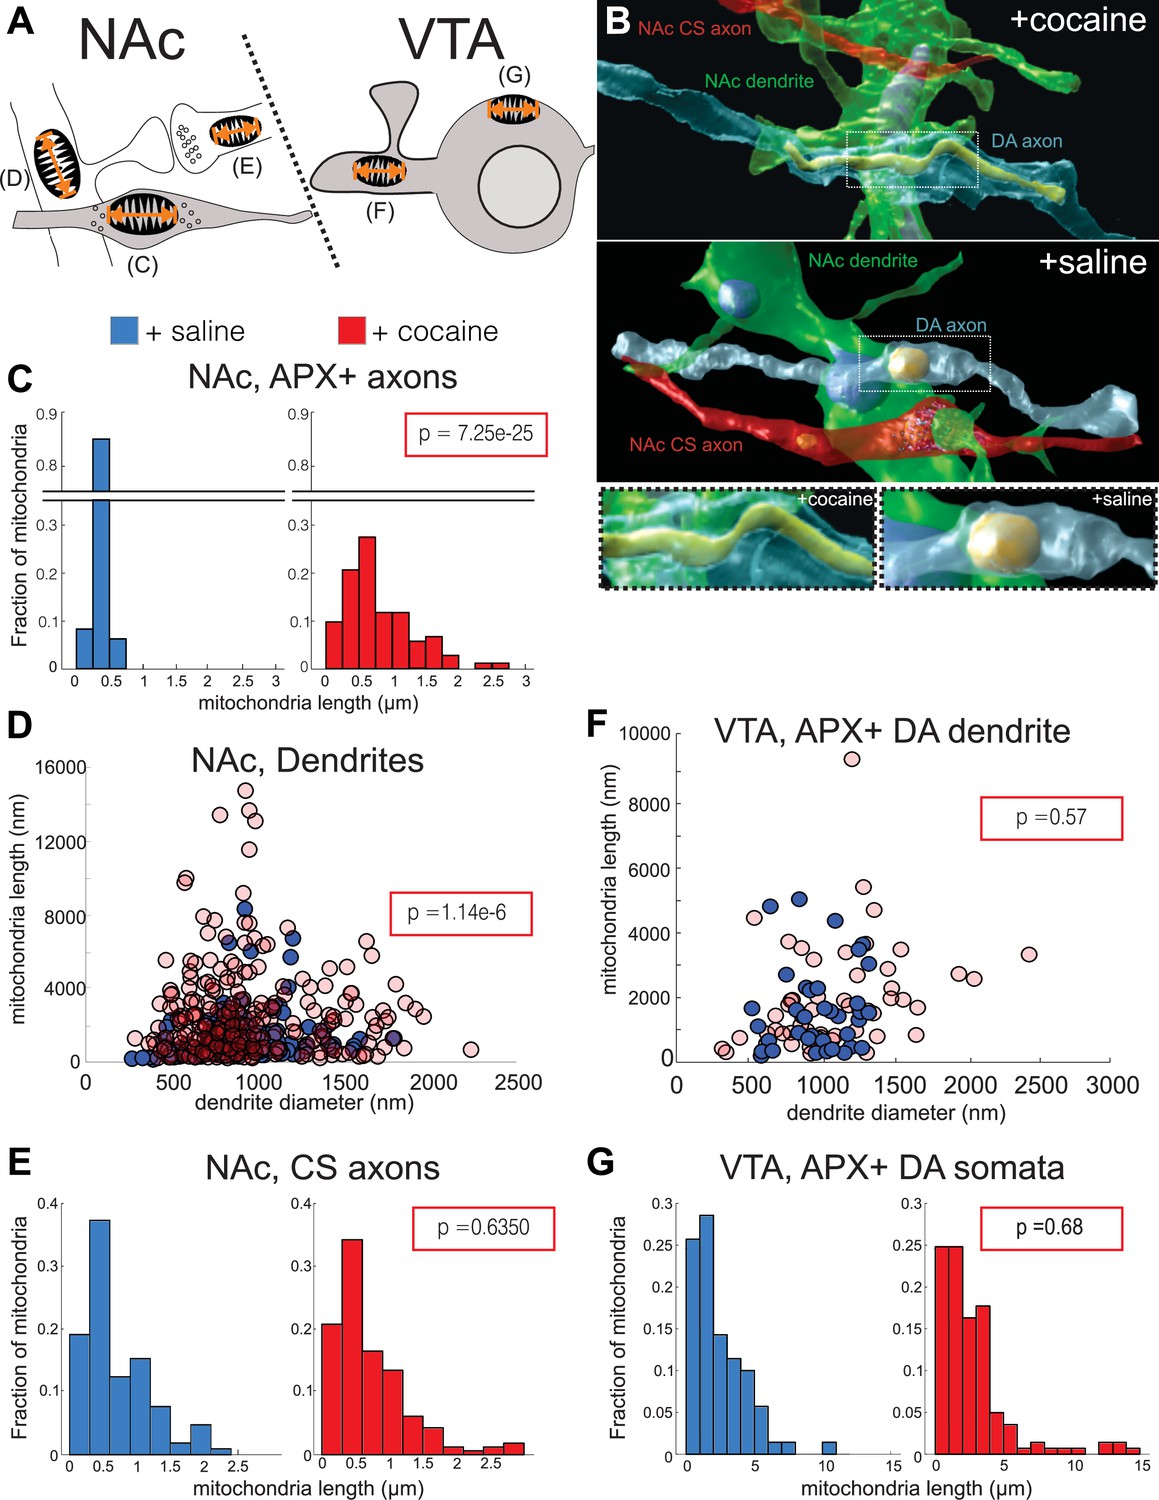
Cocaine results in increased mitochondrial length in dopaminergic (DA) axons and medium spiny neuron (MSN) dendrites.
(A) Cartoon depicting neurons where mitochondrial length was measured. Left: in the nucleus accumbens (NAc), we measured mitochondria in: (C) Apex2+ DA axons, (D) MSN dendrites, and (E) excitatory axons making chemical synapses (chemical synapse [CS] axons). Right: in the ventral tegmental area (VTA), we measured mitochondria in: (F) Apex2+ DA dendrites, and (G) Apex2+ DA soma. (B) 3D reconstructions from cocaine- (top) and saline- (bottom) treated mice of a DA axon (blue), afferent CS axon (red), and MSN dendrite (green) from the NAc. Shown is just the mitochondria reconstructed within the DA axon. Bottom images show zoomed views centered on the DA axon mitochondria from cocaine- (left) and saline- (right) treated mice. (C) Histograms of mitochondrial length in NAc, Apex2+ (‘APX+’) DA axons +saline: 0.36 ± 0.01 μm, n = 162 mitochondria across 42 axons, 2 mice; +cocaine: 0.79 ± 0.05 μm, n = 162 mitochondria across 35 axons, two mice. p = 7.25e-25. (D) Scatter plot of mitochondrial lengths versus dendrite diameter of NAc MSN dendrites (+saline: 1.39 ± 0.12 mitochondrial length (nm)/dendrite diameter (nm), n = 132 mitochondria across 50 dendrites, two mice; +cocaine: 3.0 ± 0.2 μm mitochondrial length (nm)/dendrite diameter (nm), n = 260 mitochondria across 41 dendrites, two mice. p = 1.14e-6). (E) Histogram of mitochondrial lengths in NAc CS axons (+saline: 0.70 ± 0.05 μm, n = 104 mitochondria across 30 axons, two mice; +cocaine: 0.73 ± 0.04 μm, n = 164 mitochondria across 57 axons, two mice. p = 0.64). (F) Scatter plot of mitochondrial lengths versus dendrite diameter of VTA Apex2+ DA dendrites + saline: 1.74 ± 0.25 mitochondrial length (nm)/dendrite diameter (nm), n = 37 mitochondria across four dendrites, one mouse; +cocaine: 1.85 ± 0.22 mitochondrial length (nm)/dendrite diameter (nm), n = 53 mitochondria across 10 dendrites, one mouse. p = 0.57. (G) Histogram of mitochondrial length in Apex2+ DA Soma (+saline: 2.46 ± 0.24 μm, n = 70 mitochondria across four soma, one mouse; +cocaine: 2.78 ± 0.23 μm, n = 141 mitochondria across five soma, one mouse. p = 0.68). Blue histograms and data points on scatter plots = +saline-treated mice, and red histograms and data points = +cocaine-treated mice. Data: mean ± SEM. p-Value: two-tailed Mann-Whitney U test.
Figure 9—figure supplement 1
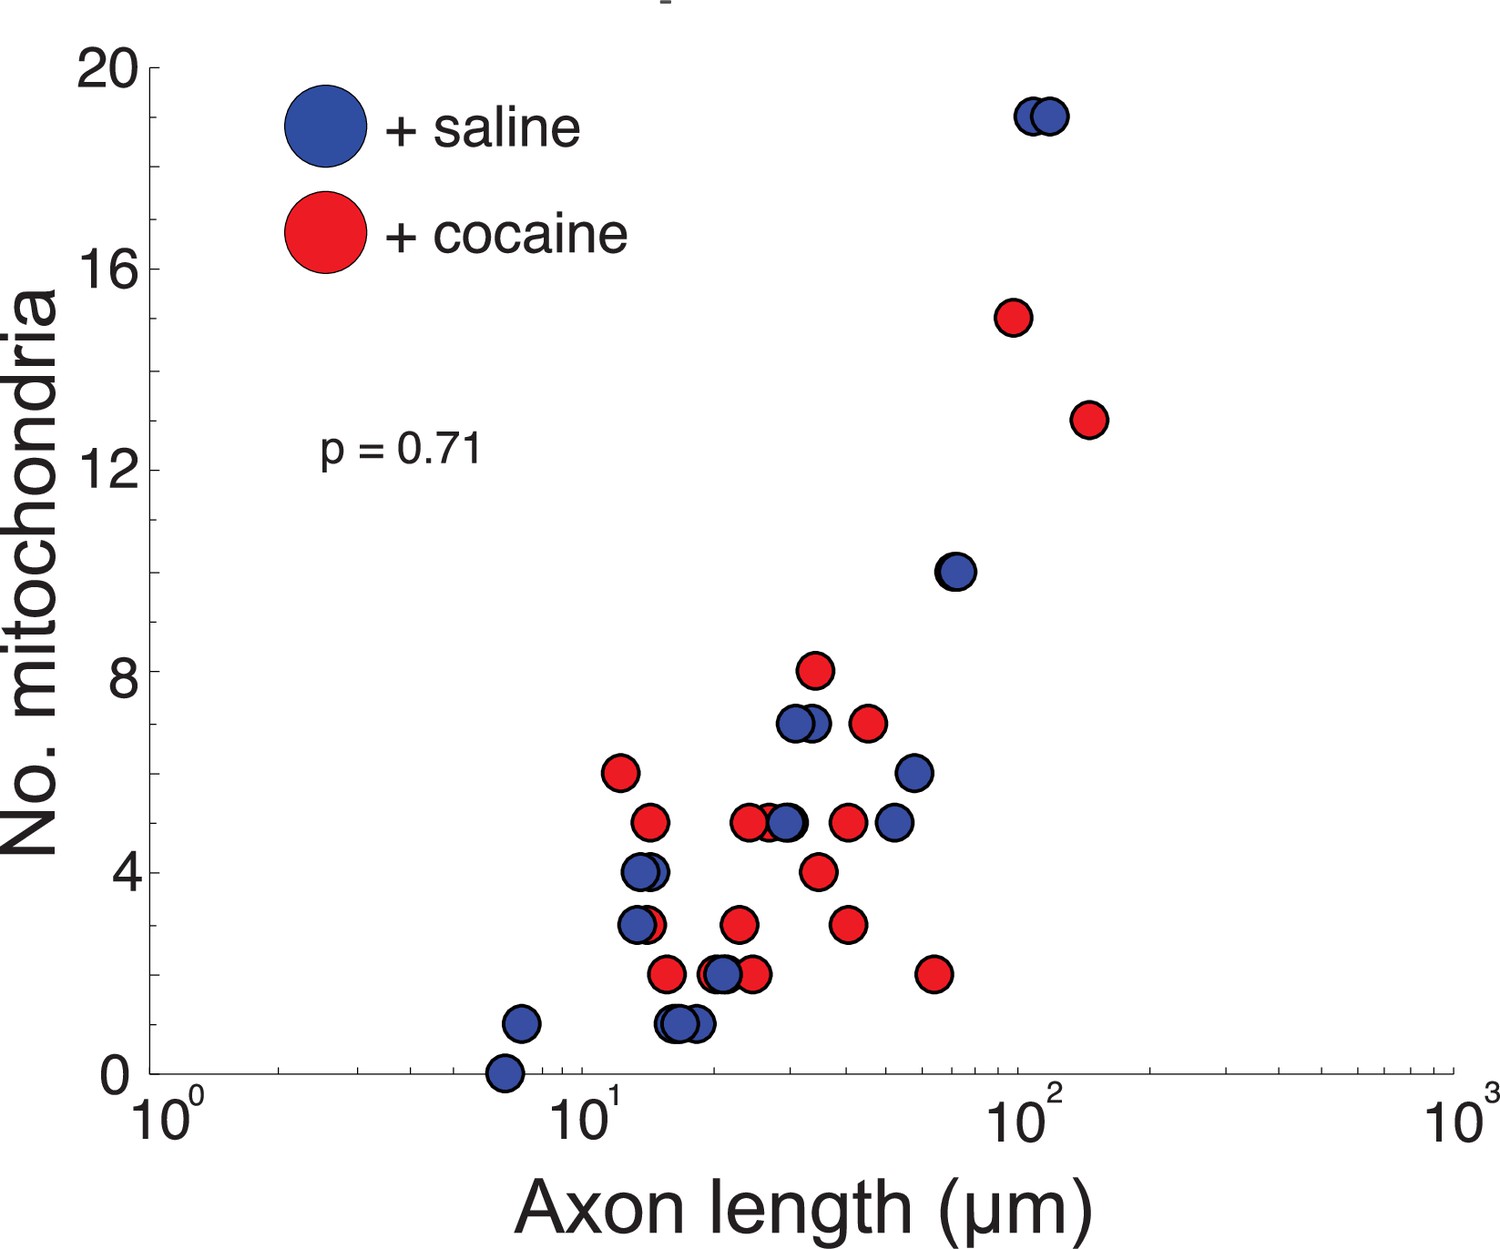
Cocaine does not change the number of mitochondria in dopaminergic (DA) axons.
Scatter plot of the number of mitochondria versus length of axon (μm). (+saline: 0.14 ± 0.02 mitochondria/µm length of axon, n = 96 mitochondria counted across 18 axons, two mice; +cocaine: 0.16 ± 0.02 mitochondria/µm length of axon, n = 107 mitochondria counted across 20 axons, two mice. p = 0.71). Data: mean ± SEM. p-values: two-tailed Mann-Whitney U test.
Author response image 1
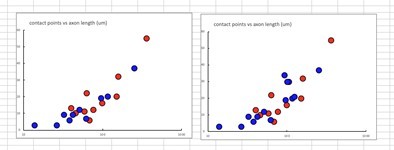
Original plot (left) and updated with more data collected (right).
Tables
Key resources table
| Reagent type (species) or resource | Designation | Source or reference | Identifiers | Additional information |
|---|---|---|---|---|
| Genetic reagent (Mus musculus) | Slc6a3tm1(cre)Xz/J | Provided by the Xiaoxi Zhuang lab (The University of Chicago), PMID:15763133 | RRID:IMSR_JAX:020080 | Also available at Jackson Laboratories: https://www.jax.org/strain/020080 |
| Chemical compound, drug | 3,3’-Diaminobenzidine | Sigma-Aldrich | D12384 | 50 mg/ml |
| Chemical compound, drug | Sodium cacodylate buffer, pH 7.4 | Electron Microscopy Sciences | 11653 | 0.2 M stock, use at 0.1 M |
| Chemical compound, drug | Sodium hydrosulfite | Sigma-Aldrich | 157953 | 0.8% (w/v) |
| Chemical compound, drug | Sodium bicarbonate | Sigma-Aldrich | S5761 | 0.1 M stock, used at 60% (v/v) |
| Chemical compound, drug | Sodium carbonate | Sigma-Aldrich | S7795 | 0.1 M stock, used at 40% (v/v) |
| Chemical compound, drug | Osimum tetroxide | Electron Microscopy Sciences | 19150 | 4% aqueous stock solution, use at 2% |
| Chemical compound, drug | Paraformaldehyde | Electron Microscopy Sciences | 15710 | 16% aqueous stock solution, use at 2% |
| Chemical compound, drug | Glutaraldehyde | Electron Microscopy Sciences | 16220 | 25% aqueous stock solution, use at 2.5% |
| Chemical compound, drug | Postassium ferrocyanide | Sigma-Aldrich | P3289 | 2.5% |
| Chemical compound, drug | Pyrogallol | Sigma-Aldrich | P0381 | 4% |
| Chemical compound, drug | Uranyl acetate | Electron Microscopy Sciences | 22400–4 | 4% aqueous stock solution, use at 1% |
| Chemical compound, drug | Lead (II) nitrate | Sigma-Aldrich | 228621 | 0.66% |
| Chemical compound, drug | Embed 812 kit | Electron Microscopy Sciences | 14120 | 49% Embed 812, 28% DDSA, 21% NMA, and 2.0% DMP 30 |
| Chemical compound, drug | Cocaine | Obtained through DEA license (Xiaoxi Zhuang, The University of Chicago) | 10 mg/kg |
Author response table 1
| Varicosity type | Average no | SEM |
|---|---|---|
| small | 30.89583333 | 3.2 |
| large | 9.222222222 | 0.8 |
| large/Small:Total | 35.07894737 | 5.5 |
| large/small:large | 6.921052632 | 0.9 |
| large/small:large | 28.15789474 | 4.8 |
Additional files
-
Transparent reporting form
- https://cdn.elifesciences.org/articles/71981/elife-71981-transrepform1-v1.pdf
-
Source code 1
MATLAB code to generate Figure 3B Monte Carlo simulations.
- https://cdn.elifesciences.org/articles/71981/elife-71981-supp1-v1.zip
Download links
A two-part list of links to download the article, or parts of the article, in various formats.
Downloads (link to download the article as PDF)
Open citations (links to open the citations from this article in various online reference manager services)
Cite this article (links to download the citations from this article in formats compatible with various reference manager tools)
Partial connectomes of labeled dopaminergic circuits reveal non-synaptic communication and axonal remodeling after exposure to cocaine
eLife 10:e71981.
https://doi.org/10.7554/eLife.71981


