Rat sensitivity to multipoint statistics is predicted by efficient coding of natural scenes
- Visual Neuroscience Lab, International School for Advanced Studies, Italy
- Computational Neuroscience Initiative, University of Pennsylvania, United States
Figures
Figure 1 with 1 supplement
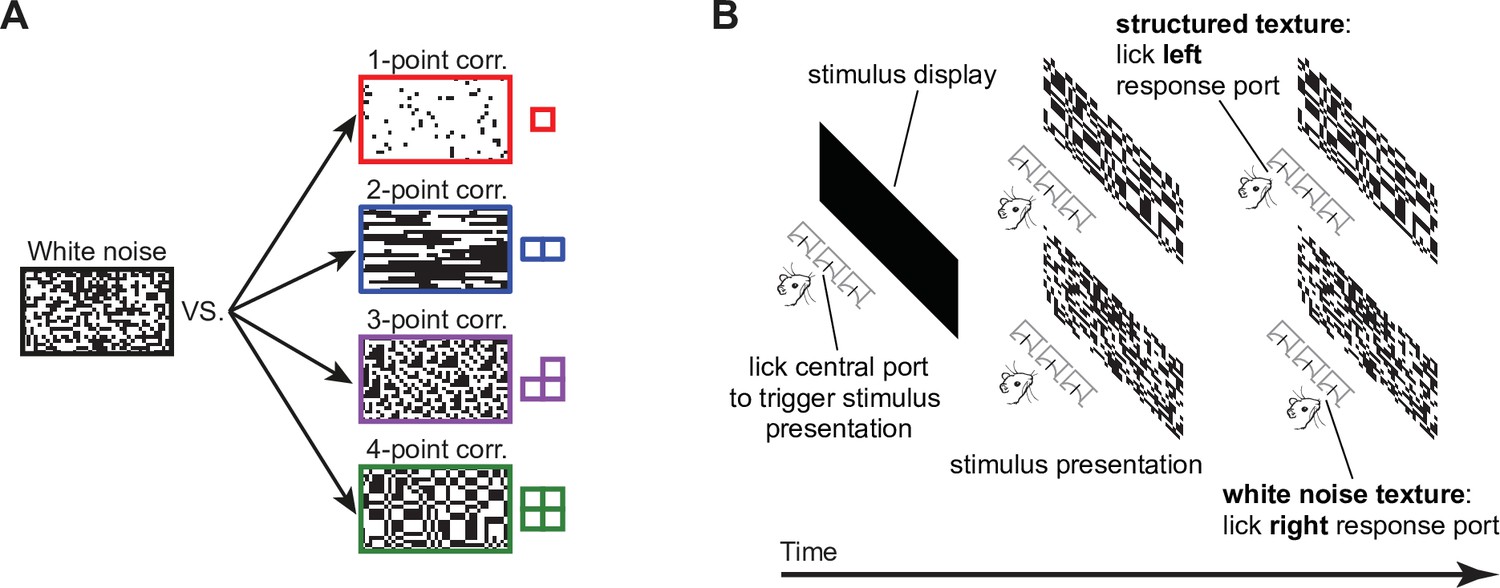
Visual stimuli and behavioral task.
(A) Schematic of the four kinds of texture discrimination tasks administered to the four groups of rats in our study. Each group had to discriminate unstructured binary textures containing white noise (example on the left) from structured binary textures containing specific types of local multipoint correlations among nearby pixels (i.e. 1-, 2-, 3-, or 4-point correlations; examples on the right). The textures were constructed to be as random as possible (maximum entropy), under the constraint that the strength of a given type of correlation matched a desired level. The strength of a correlation pattern was quantified by the value (intensity) of a corresponding statistic (see main text), which could range from 0 (white noise) to 1 (maximum possible amount of correlation). The examples shown here correspond to intensities of 0.85 (one- and two-point statistics) and 0.95 (three- and four-point statistics). (B) Schematic representation of a behavioral trial. Left and center: animals initiated the presentation of a stimulus by licking the central response port placed in front of them. This prompted the presentation of either a structured (top) or an unstructured (bottom) texture. Right: in order to receive the reward, animals had to lick either the left or right response port to report whether the stimulus contained the statistic (top) or the noise (bottom). Figure 1—figure supplement 1 shows the performances attained by four example rats (one per group) during the initial phase of the training (when the animals were required to discriminate the stimuli shown in A), as well as the progressively lower statistic intensity levels that these rats progressively learned to discriminate from white noise during the second phase of the experiment.
Figure 1—figure supplement 1
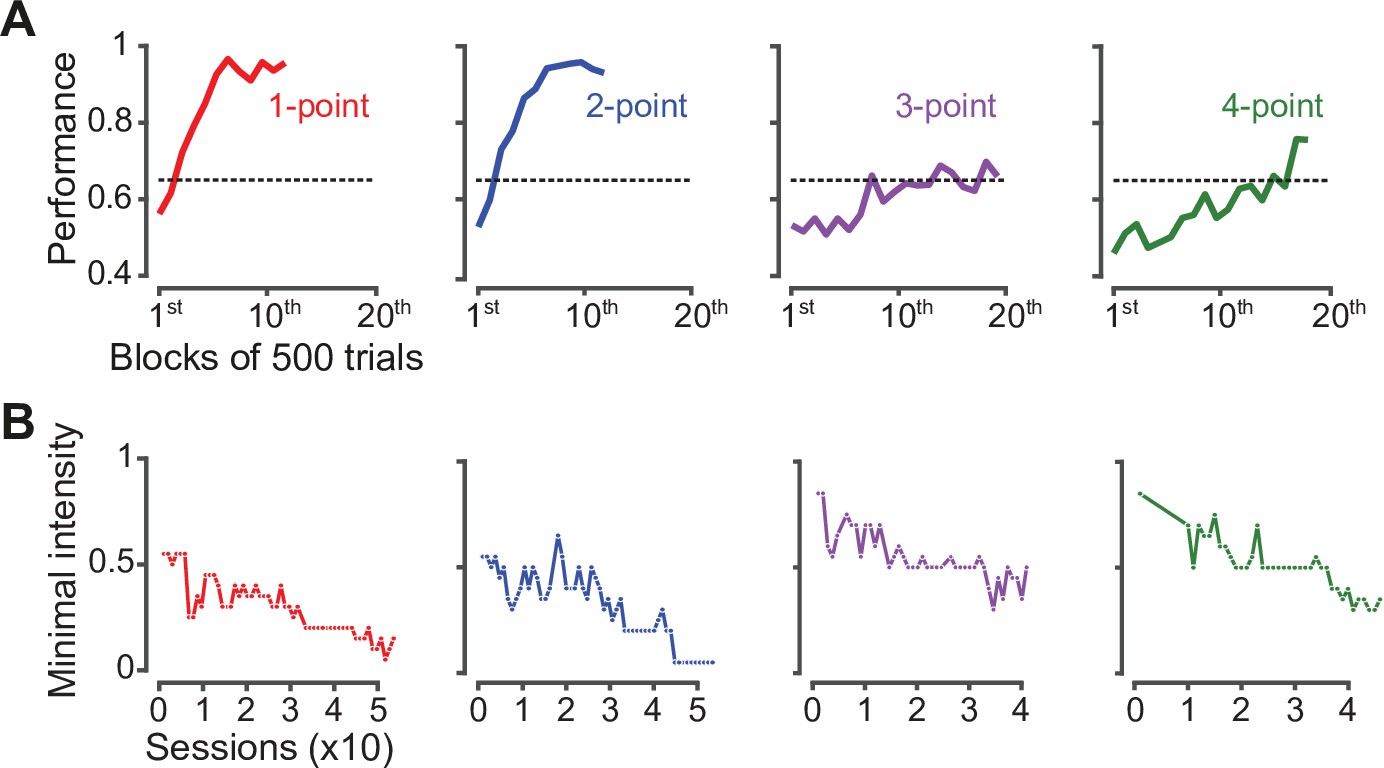
Learning curves of four example rats during the two initial training phases.
(A) Learning curves of four example animals belonging to the first batch of rats (see Materials and methods), each trained with one of the four texture statistics: one-point (red), two-point (blue), three-point (purple), and four-point (green). During this phase, animals had to discriminate textures containing a single high intensity level of the assigned statistic (see examples in Figure 1A, right) from white noise. Each curve shows the performance of a rat (i.e. the fraction of correct choices), as computed in consecutive blocks of 500 trials. The dashed line indicates the 65% criterion performance that rats of the first batch had to reach in order to be moved to the next experimental phase (see Materials and methods). As exemplified by these four animals, rats trained on different statistics required different lengths of time to learn the discrimination – animals trained on one- and two-point statistics reached and maintained a performance above criterion considerably earlier than those trained on three- and four-point. Specifically, considering only those rats that reached criterion performance, animals trained on one-point correlations required on average 3.5 ± 0.3 blocks of 500 trials (n = 9) to reach criterion; those trained on two-point correlations 5.3 ± 1.3 (n = 8); those trained on 3-point statistic 3.4 ± 1.6 (n = 5); and those trained on four-point correlations 11.8 ± 1.6 (n = 10). (B) Minimal intensity levels of the statistics that the same animals shown in A were able to discriminate from white noise across consecutive sessions (colored dots) of the second phase of the experiment, when the rats were exposed to progressively lower intensities through a staircase procedure (see Materials and methods). Sessions where the number of trials performed by the animals was below 50 are not shown in these graphs.
Figure 2 with 1 supplement

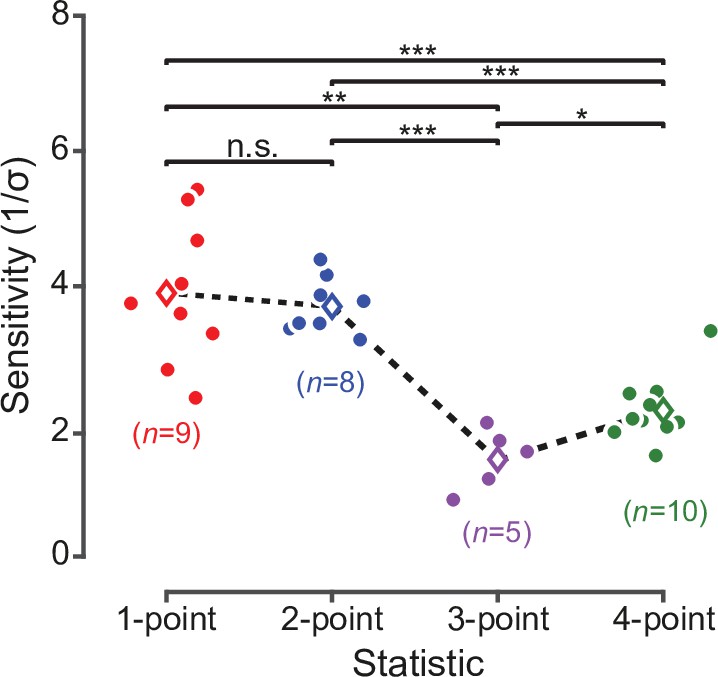
Rat sensitivity to multipoint correlations.
(A) Psychometric data for an example rat trained on two-point correlations. Black dots: fraction of trials in which a texture with the corresponding intensity of the statistic was correctly classified as ‘structured’. Empty black circle: fraction of trials the rat has judged a white noise texture as containing the statistic. Blue line: psychometric function corresponding to the fitted ideal observer model (see main text). (B) Psychometric functions obtained for all the rats tested on the four statistics (n indicates the number of animals in each group). (C) Values of the perceptual sensitivity to each of the four statistics. Filled dots: individual rat estimates. Empty diamonds: group averages. The dashed line emphasizes the sensitivity ranking observed for the four statistics. Significance markers ** and *** indicate, respectively, p < 0.01 and p < 0.001 for a two-sample t-test with Holm-Bonferroni correction. The same analysis was repeated in Figure 2—figure supplement 1 including only the rats that reached a certain performance criterion during the initial training.
Figure 2—figure supplement 1
Rat sensitivity to multipoint correlations after excluding animals that did not reach the 65% correct discrimination criterion in phase I of the training.
Figure 3
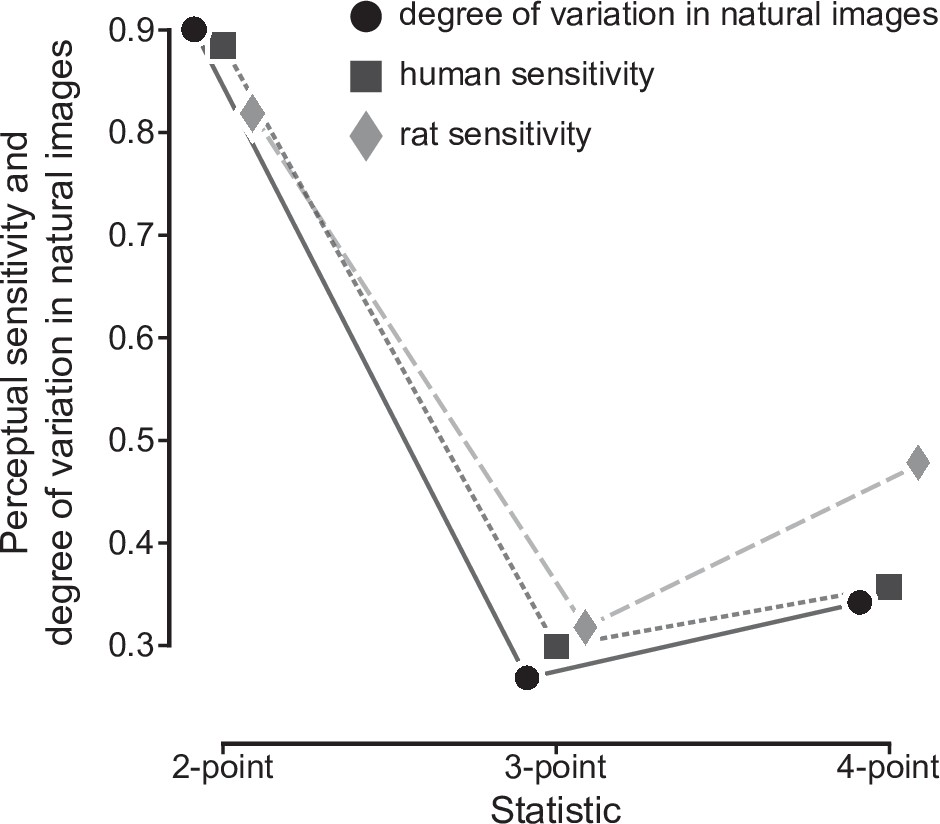
Quantitative match between rat sensitivities, human sensitivities and texture variability across natural images.
For the three texture statistics that were tested both in our current study with rats and in our earlier study with humans (Hermundstad et al., 2014), rat average sensitivities are compared to human average sensitivities and to the variability of these statistics across natural scenes data from Hermundstad et al., 2014. The three sets of data points have been scaled in such a way that each triplet of sensitivity values had Euclidean norm = 1, so as to allow an easier qualitative comparison (for a quantitative comparison see main text).
Figure 4
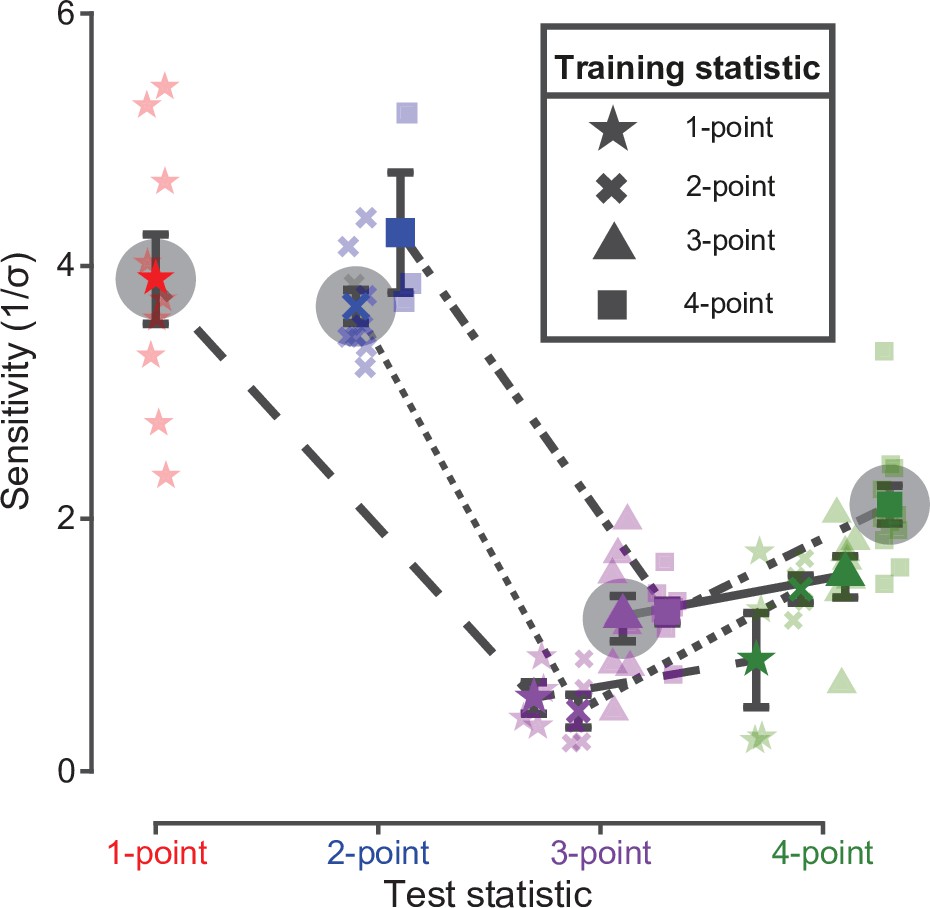
Rat sensitivity to multipoint correlations – dependence on training history and within-subject analysis.
Colored points with halo show the average sensitivities (with SEM) of the four groups of rats to the statistics (indicated by the symbols in the key) they were originally trained on (i.e. same data as the colored diamonds in Figure 2C). The other colored symbols connected by a line show the average sensitivities (with SEM) obtained when subgroups of rats originally trained on a given statistic (as indicated by the symbol in the key) were tested with different statistics (as indicated in abscissa). Specifically: (1) out of the nine rats originally trained/tested with one-point correlations (star), four were tested with three-point (purple star) and four with four-point (green star) correlations (one rat did not reach this test phase); (2) out of the nine rats originally trained/tested with two-point correlations (cross), five were tested with three-point (purple cross) and four with four-point (green cross) correlations; (3) out of the eight rats originally trained/tested with three-point correlations (triangle), seven were tested with four-point (green triangle) correlations (one rat did not reach this test phase); and (4) out of the eleven rats originally trained/tested with four-point correlations (square), eight were tested with three-point (purple square) and three with two-point correlations (blue square). Sensitivities achieved by individual animals are represented as shaded data points with the corresponding symbol/color combination.
Additional files
Download links
A two-part list of links to download the article, or parts of the article, in various formats.
Downloads (link to download the article as PDF)
Open citations (links to open the citations from this article in various online reference manager services)
Cite this article (links to download the citations from this article in formats compatible with various reference manager tools)
Rat sensitivity to multipoint statistics is predicted by efficient coding of natural scenes
eLife 10:e72081.
https://doi.org/10.7554/eLife.72081


