High-throughput Plasmodium falciparum hrp2 and hrp3 gene deletion typing by digital PCR to monitor malaria rapid diagnostic test efficacy
- University of Notre Dame, United States
- Swiss Tropical and Public Health Institute, Switzerland
- Kenya Medical Research Institute-Centre for Global Health Research, Kenya
- Department of Biochemistry and Molecular Biology, Egerton University, Kenya
- Kwame Nkrumah University of Science and Technology, Ghana
- Tulane University, United States
- University of Basel, Switzerland
- Ifakara Health Institute, United Republic of Tanzania
- Zanzibar Malaria Elimination Programme, Zanzibar, United Republic of Tanzania
- University of São Paulo, Brazil
- Laboratory of Parasitic Diseases, Fiocruz, Brazil
- Centro de Investigación para la Salud en América Latina, Facultad de Ciencias Exactas y Naturales, Pontificia Universidad Católica del Ecuador, Ecuador
- Department of Medical Microbiology, University of Ghana, Ghana
- Tropical and Infectious Diseases Research Center, Jimma University, Ethiopia
- Case Western Reserve University, United States
- Program in Public Health, University of California, Irvine, United States
Figures
Figure 1 with 2 supplements
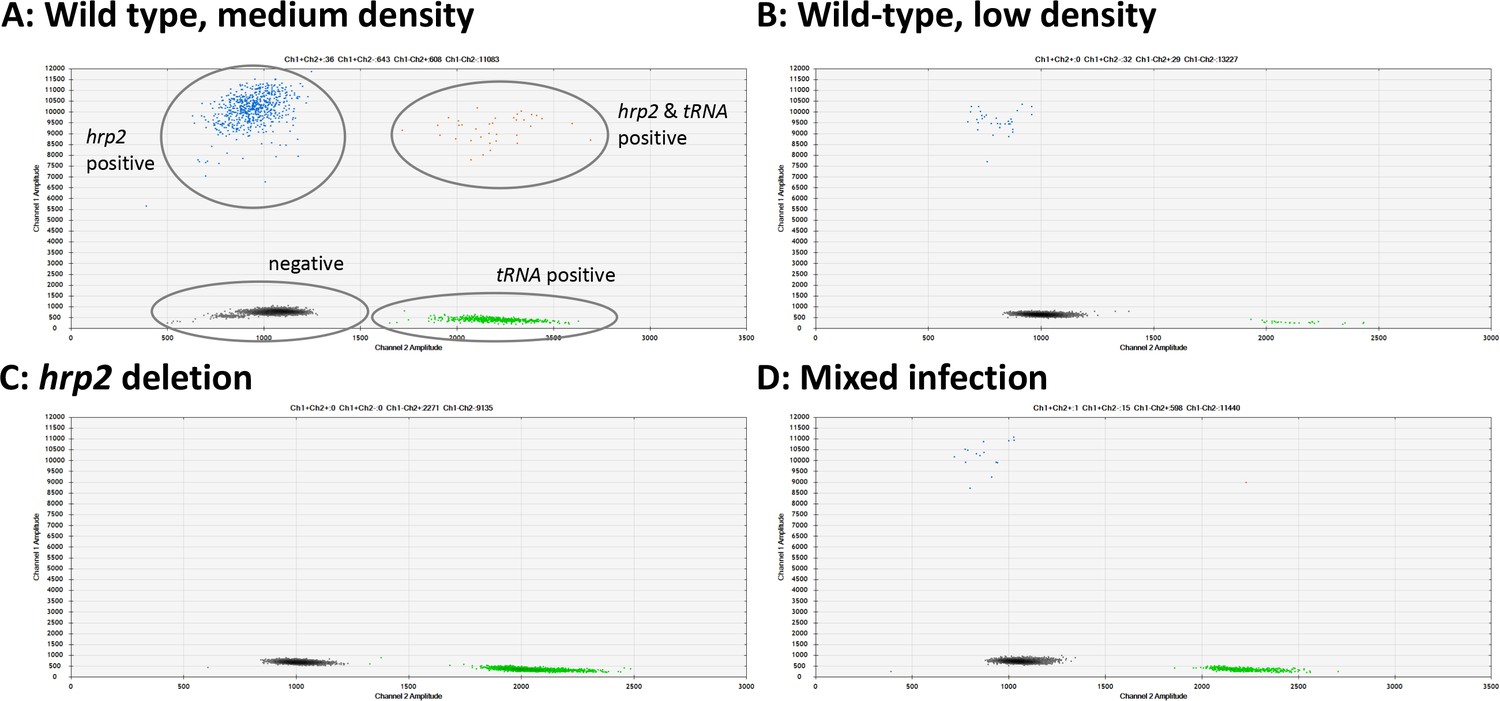
Examples of hrp2 exon 2 deletion typing by droplet digital PCR (ddPCR).
Droplets positive for hrp2 are shown in blue (top left of each panel). Droplets positive for tRNA are shown in green (bottom right). Droplets positive for hrp2 and tRNA are shown in orange (top right). Negative droplets (for both hrp2 and tRNA) are shown in gray (bottom left). (A) Wild-type infection of medium density (304 parasites/µl, 2 µl DNA used for experiment). Approximately 600 droplets are positive each for hrp2 and tRNA, and 36 for both targets. (B) Wild-type sample of low-density (15 parasites/µl): 32 and 29 droplets are positive for hrp2 and tRNA, respectively. (C) hrp2 deletion (1135 parasites/µl): Droplets are positive for tRNA, but no droplets are positive for hrp2. (D) Mixed infection with wild-type parasites and parasites carrying hrp2 deletion (overall 299 parasites/µl). Only 15 droplets are positive for hrp2, but 598 droplets are positive for tRNA.
Figure 1—figure supplement 1
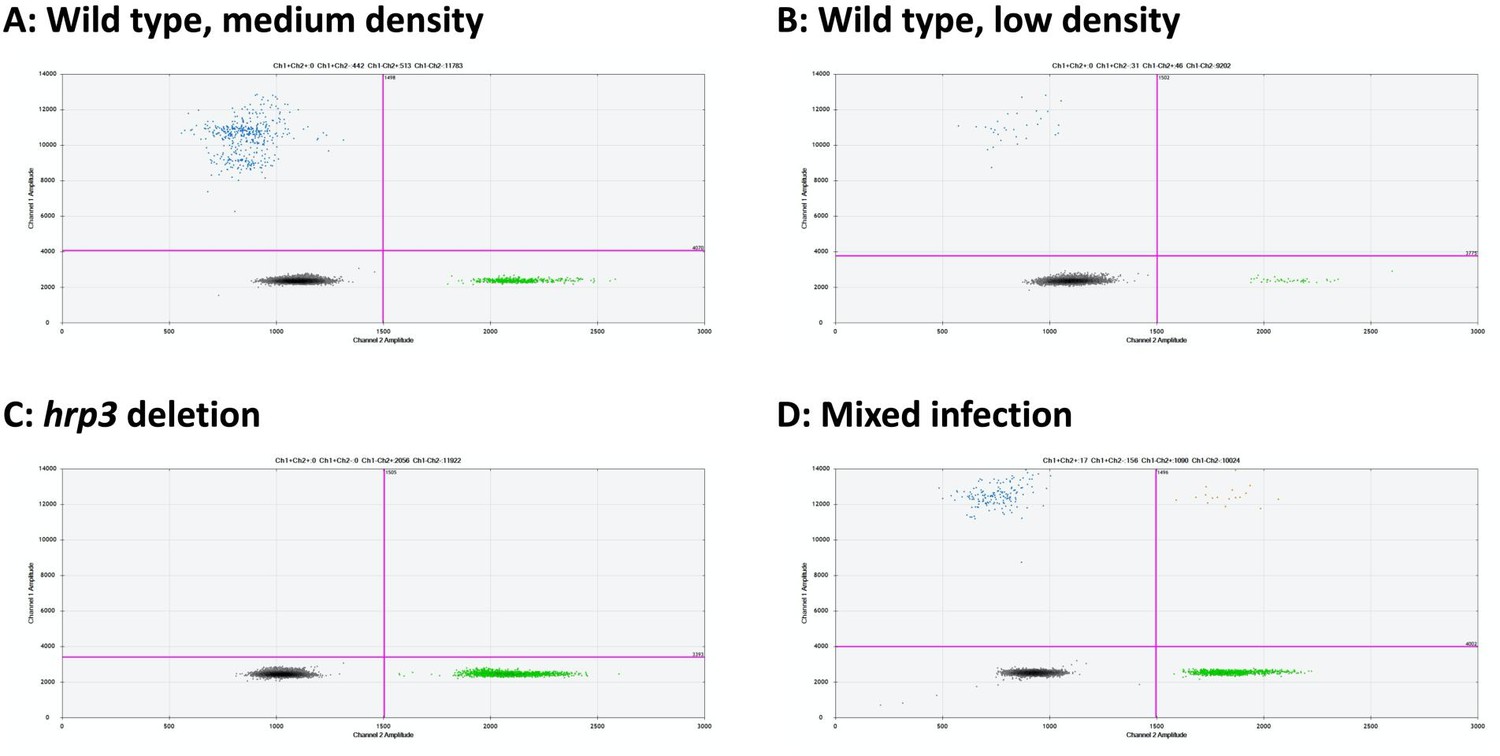
Examples of hrp3 droplet digital PCR (ddPCR) assays.
Droplets positive for hrp3 are shown in blue (top left of each panel). Droplets positive for tRNA are shown in green (bottom right). Droplets positive for hrp3 and tRNA are shown in orange (top right). Negative droplets are shown in gray (bottom left). (A) Wild-type infection of medium density (256 parasites/µl, 2 µl DNA used for experiment). Approximately 600 droplets are positive each for hrp3 and tRNA. (B) Wild-type sample of low-density (23 parasites/µl): 31 and 46 droplets are positive for hrp3 and tRNA, respectively. (C) hrp3 deletion (1028 parasites/µl): 2056 droplets are positive for tRNA, but no droplets are positive for hrp3. (D) Mixed infection with wild-type parasites and parasites carrying hrp3 deletion (overall 545 parasites/µl). Only 17 droplets are positive for hrp3, but 1090 droplets are positive for tRNA.
Figure 1—figure supplement 2
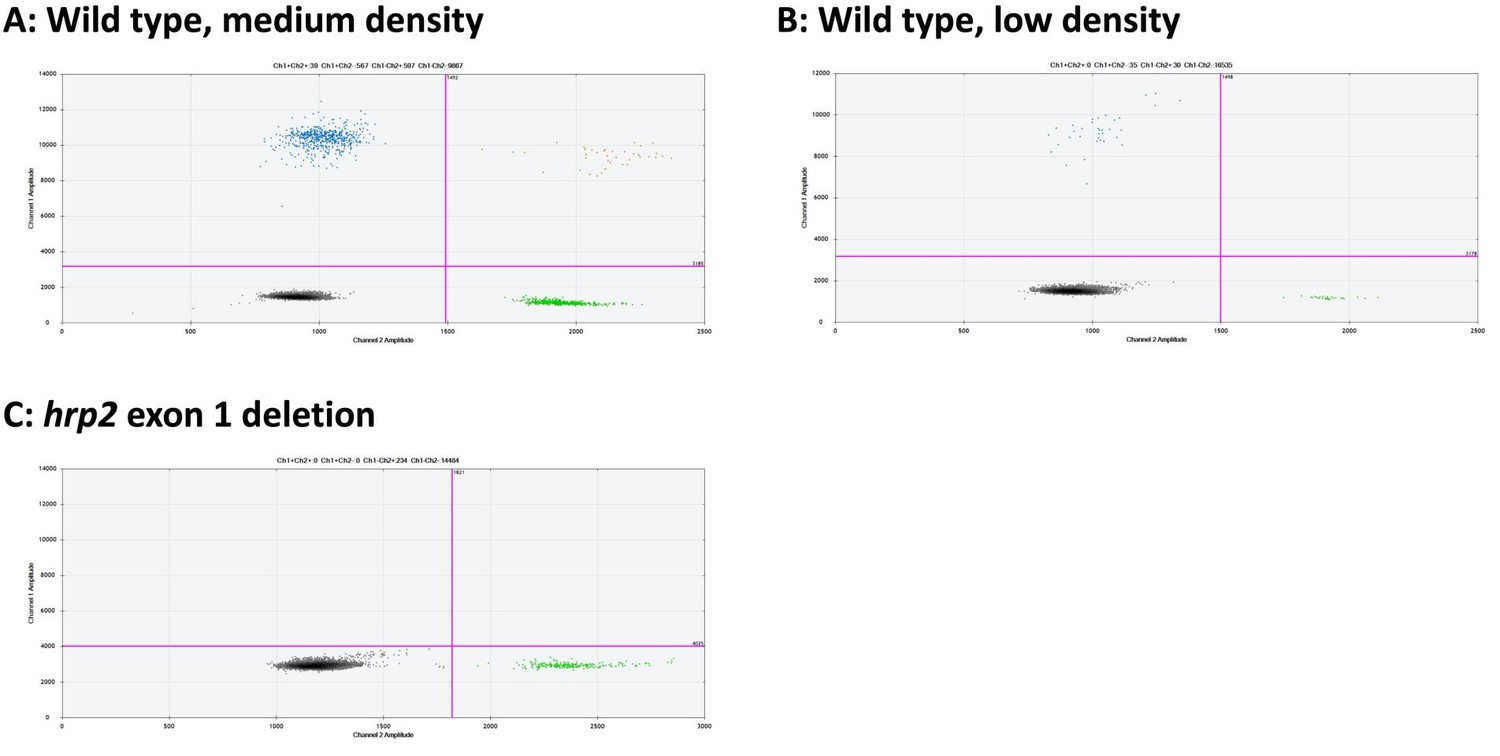
Examples of hrp2 exon 1 droplet digital PCR (ddPCR) assays.
Droplets positive for hrp2 exon 1 are shown in blue (top left of each panel). Droplets positive for tRNA are shown in green (bottom right). Droplets positive for hrp2 exon 1 and tRNA are shown in orange (top right). Negative droplets are shown in gray (bottom left). (A) Wild-type infection of medium density (298 parasites/µl, 2 µl DNA used for experiment). 597 droplets are positive each for hrp2 exon 1 and tRNA, and 39 for both targets. (B) Wild-type sample of low density (25 parasites/µl): 35 and 30 droplets are positive for hrp2 exon 1 and tRNA, respectively. (C) hrp2 exon 1 deletion (117 parasites/µl): 234 droplets are positive for tRNA, but no droplets are positive for hrp2 exon 1.
Figure 2 with 1 supplement
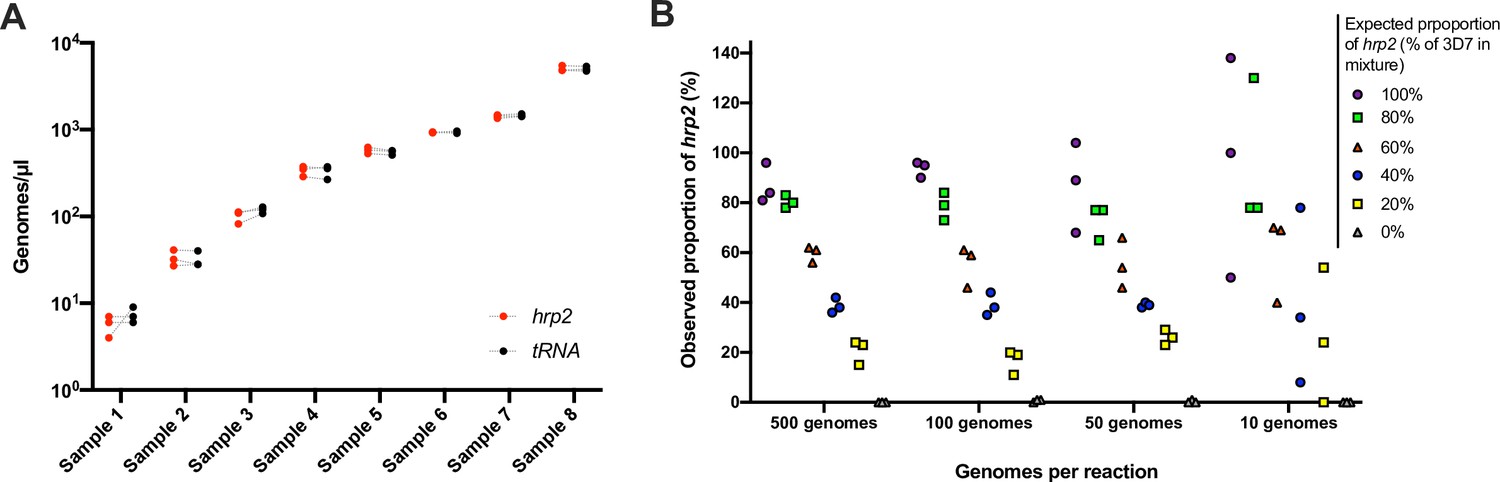
Validation of assay.
(A) Samples typed in triplicate for the hrp2 exon 2/tRNA assay. Representative examples of different parasite densities are shown. For each sample, the quantification of hrp2 exon 2, and of tRNA is shown. Results from the same run are connected by a dashed line. (B) Mixtures of 3D7 (wild type) and Dd2 (hrp2 deletion). Mixtures were run in triplicate at densities of 20–1000 parasites/reaction, and at ratios of 0–100% Dd2. The expected proportion of hrp2 to tRNA copies corresponds to the proportion of 3D7 in the mixture. The observed proportion reflects the expected proportion closely for all mixtures at 1000 and 100 parasites/reaction.
-
Figure 2—source data 1
Eight samples typed in triplicate.
- https://cdn.elifesciences.org/articles/72083/elife-72083-fig2-data1-v2.zip
-
Figure 2—source data 2
Mixtures of 3D7 (wild type) and Dd2 (hrp2 deletion) at different ratios and different concentrations.
- https://cdn.elifesciences.org/articles/72083/elife-72083-fig2-data2-v2.zip
Figure 2—figure supplement 1
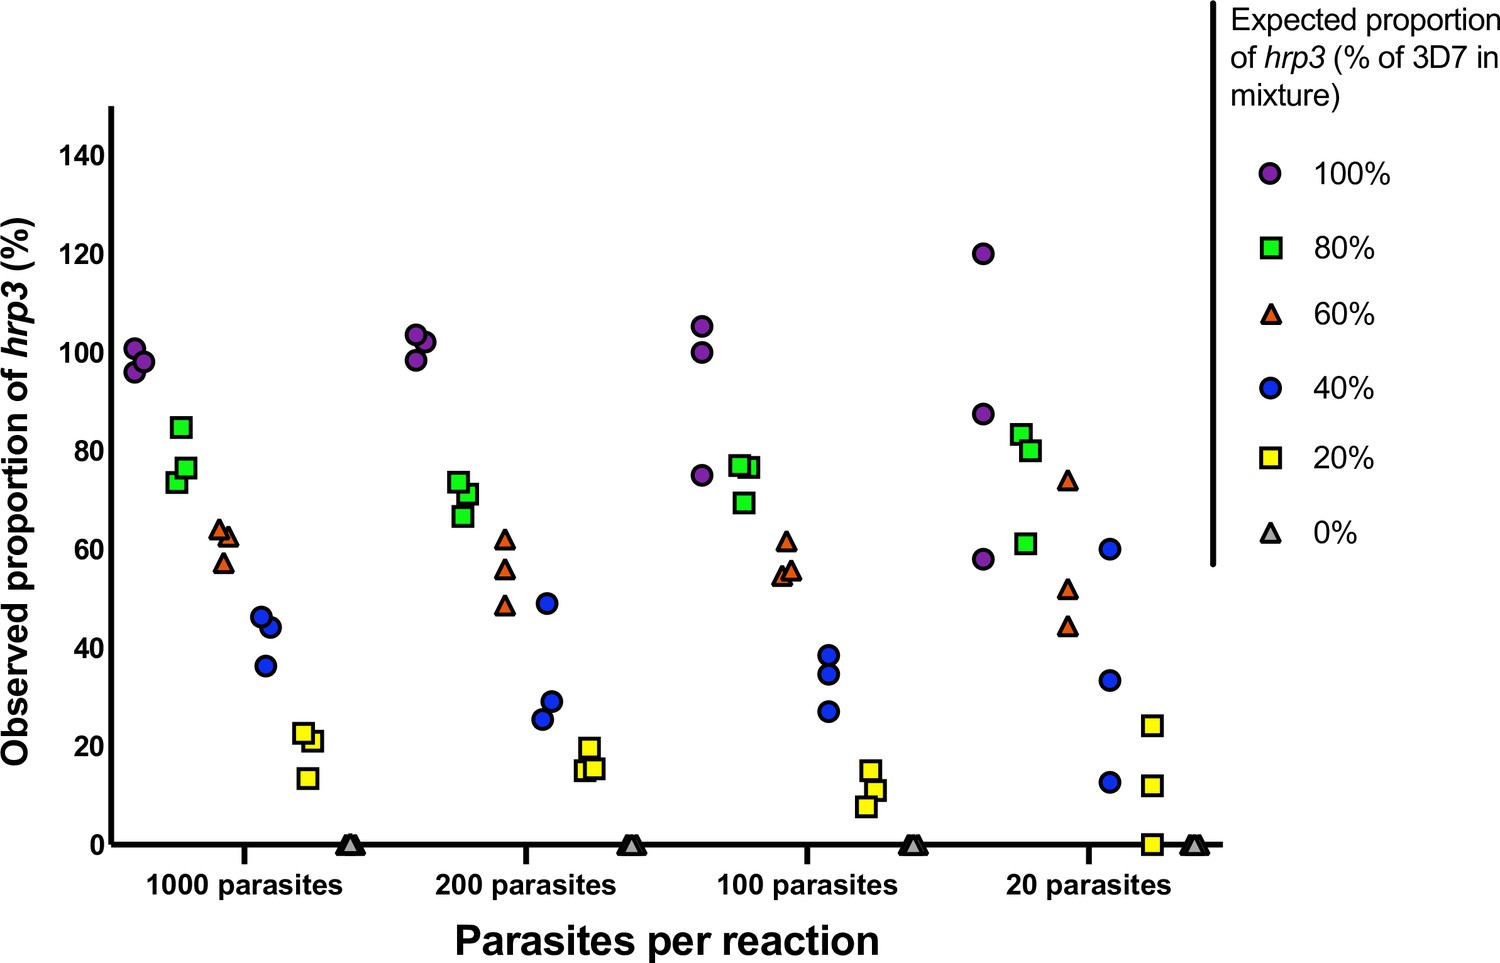
Mixtures of 3D7 (wild type) and 11,140 (hrp3 deletion).
Mixtures were run in triplicate at densities of 20–1000 parasites/reaction, and at ratios of 0–100% 11,140. The expected proportion of hrp3 to tRNA copies corresponds to the proportion of 3D7 in the mixture. The observed proportion reflects the expected proportion closely for all mixtures at 1000 and 100 parasites/reaction.
Figure 3 with 1 supplement
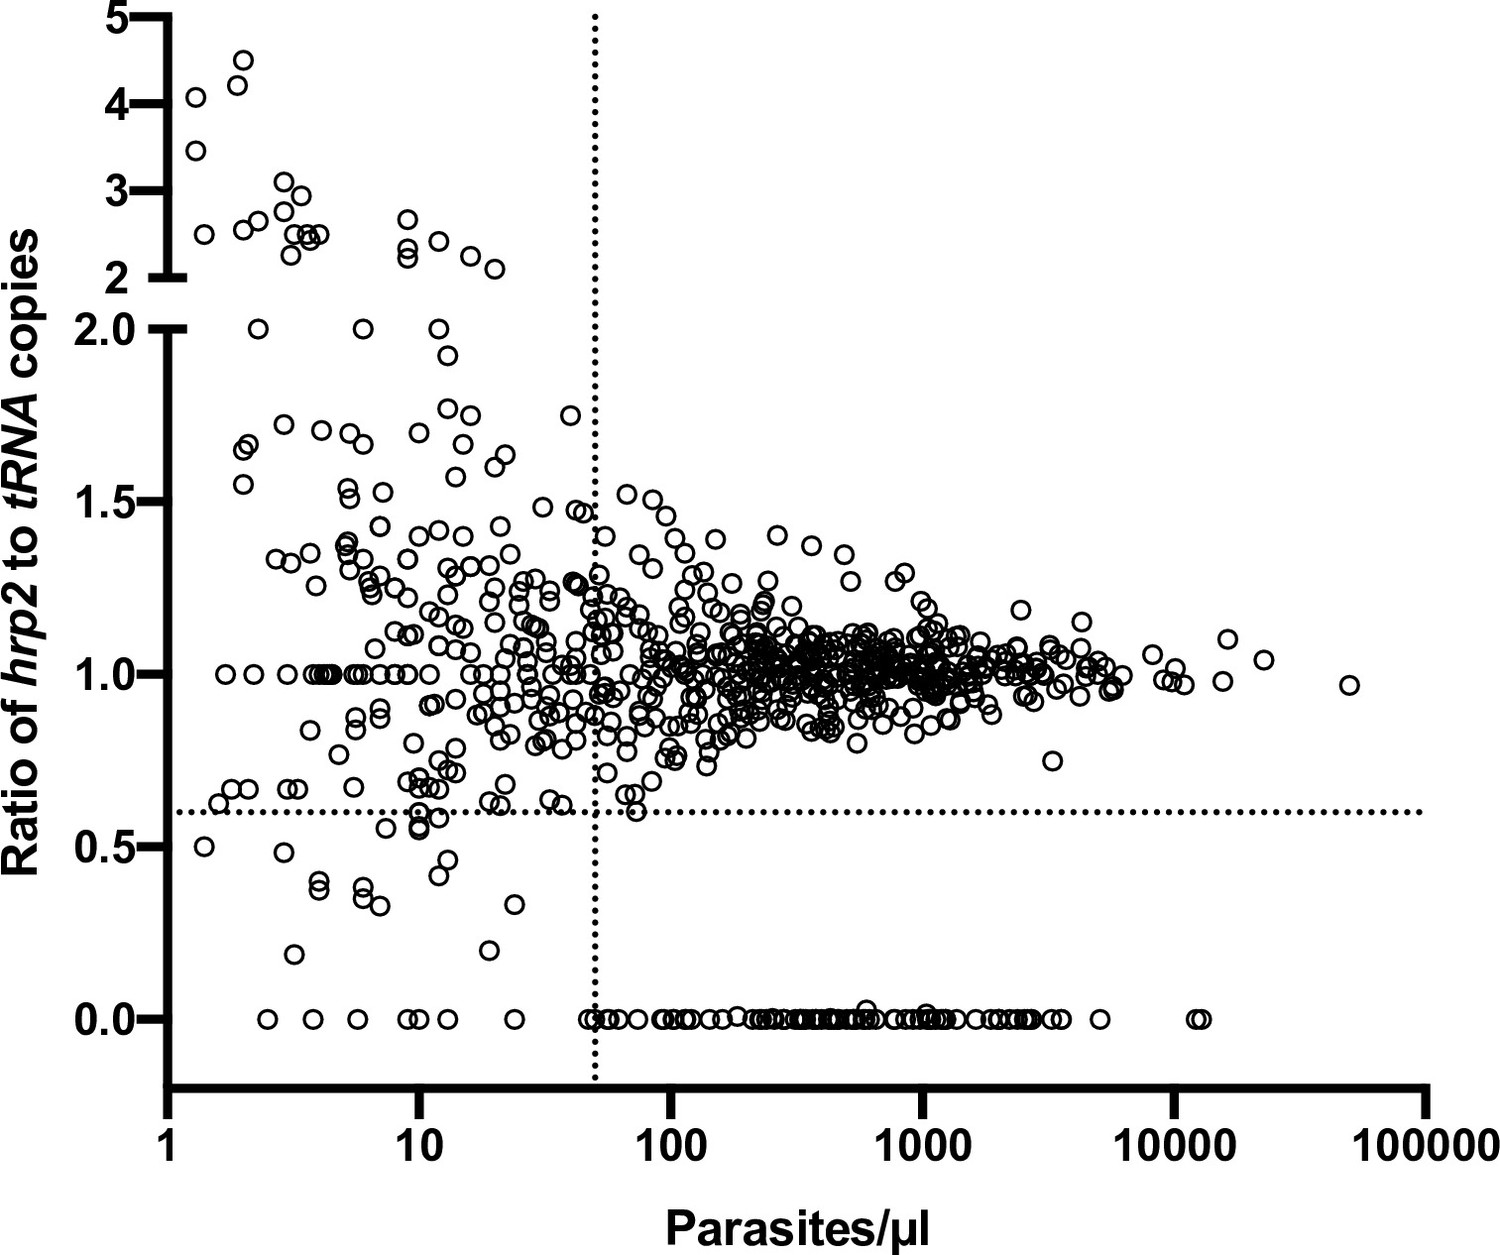
Ratios of hrp2 to tRNA copies in 684 field samples.
With increasing parasite density (x-axis), the ratio becomes close to 1. Deletions (with no wild-type parasites present) have a ratio of 0. Dashed lines show a ratio of hrp2 to tRNA copies of 0.6, and 50 parasites/µl. Mixed infection can be reliably detected at densities >50 parasites/µl, and if >40% of parasites carry the deletion.
-
Figure 3—source data 1
Ratios of hrp2 to tRNA copies in 684 field samples.
- https://cdn.elifesciences.org/articles/72083/elife-72083-fig3-data1-v2.zip
Figure 3—figure supplement 1
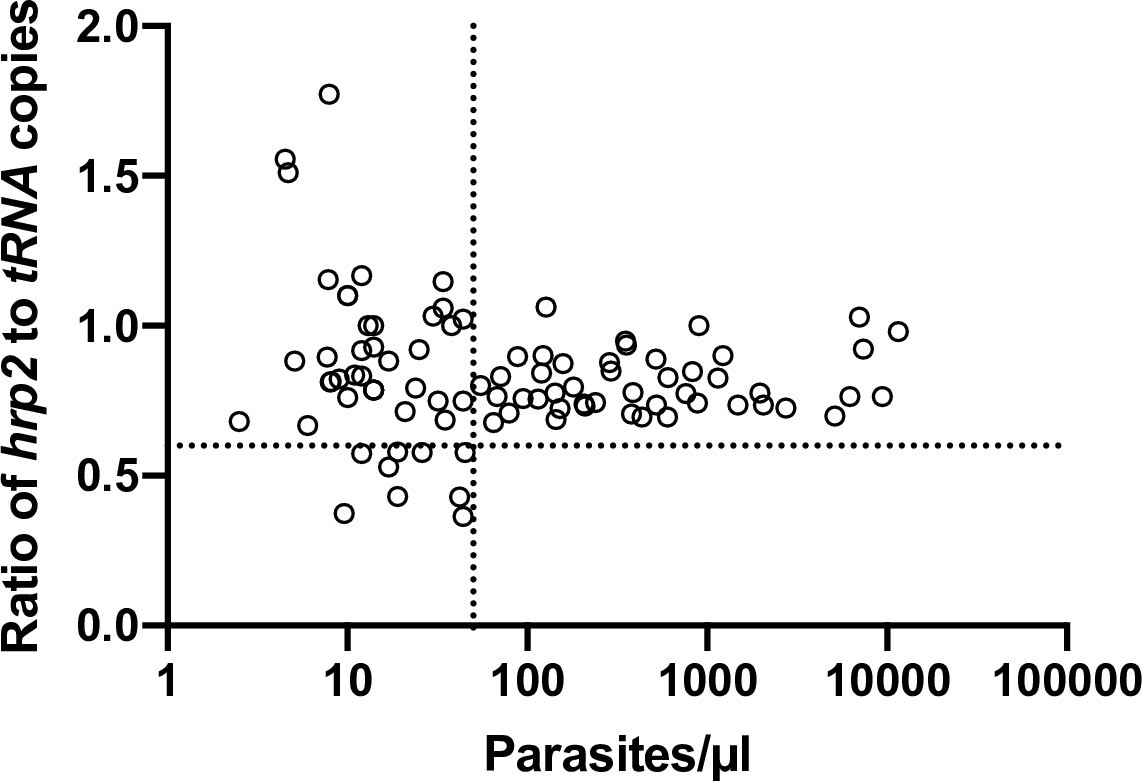
Ratios of hrp2 to tRNA copies in field samples from Zanzibar (n = 91).
With increasing parasite density (x-axis), the ratio converges around 0.8. No deletions were observed in this sample set. Dashed lines show a ratio of hrp2 to tRNA copies of 0.6, and 50 parasites/µl. Despite the ratio being lower than 1, mixed infection can be reliably detected at densities >50 parasites/µl, and if >40% of parasites carry the deletion.
-
Figure 3—figure supplement 1—source data 1
Ratios of hrp2 to tRNA copies in samples from Zanzibar.
- https://cdn.elifesciences.org/articles/72083/elife-72083-fig3-figsupp1-data1-v2.zip
Figure 4

Comparison of nested PCR (nPCR) and droplet digital PCR (ddPCR) for hrp2 deletion typing.
Representative examples of results obtained by hrp2 and msp2 nPCR, and by ddPCR. The expected size of the hrp2 band is 228 bp. A band is visible in samples 3, 4, and 5, but no band is visible in samples 1, 2, 6, and 7. msp2 was run as control for the nPCR assay. msp2 is a size polymorphic gene with amplicons ranging from approximately 200–500 bp. Bands are observed for all samples, and multiple bands are observed in case of polyclonal infections. L = 100 bp DNA ladder (New England BioLabs). Samples were run in triplicate, and the same results were obtained all three times. By ddPCR, no deletions were observed in any samples. For samples 1 and 7, the hrp2 exon 2/tRNA ddPCR plot is shown. Droplets are visible for both targets, thus no deletion is observed.
Tables
Table 1
Primer and probe sequences.
| Assay | Sequence 5′–3′ | |
|---|---|---|
| hrp2 exon 2 forward | CATTTTTAAATGCTTTTTTATTTTTATATAG | |
| hrp2 exon 2 | hrp2 exon 2 reverse | CTTGAGTTTCGTGTAATAATCTC |
| hrp2 exon 2 probe | FAM-CGCATTTAATAATAACTTGTGTAGCAAAAATGC-BHQ-1 | |
| hrp2 exon 1 forward | ATATTTATACATTTTTGTTATTATTTCTTTTTC | |
| hrp2 exon 1 | hrp2 exon 1 reverse | CGTTATCTAACAAAAGTACGGAG |
| hrp2 exon 1 probe | FAM-CAAAAACGGCAGCGGATAATACTT-BHQ-1 | |
| hrp3 forward | ATGCTAATCACGGATTTCATTTTA | |
| hrp3 | hrp3 reverse | ATCGTCATGGTGAGAATCATC |
| hrp3 probe | FAM-CCTTCACGATAACAATTCCCATACTTTAC-BHQ-1 | |
| tRNA forward | CATCAAATGAAGATTTAACAAGAG | |
| tRNA | tRNA reverse | CTTTTTGATTCTATAGTTTCATCTTTATG |
| tRNA probe | HEX-CTACCTCAGAACAACCATTATGTGCT-BHQ-1 |
Table 2
Comparison between nested PCR and droplet digital PCR (ddPCR)-based hrp2 deletion typing.
| Nested PCR | ddPCR | |
|---|---|---|
| Total samples | 248 | 248 |
| Met inclusion criteria | 212 (85.5%) | 235 (94.8%) |
| Deletion in 3/3 replicates | 17 | 0 |
| Deletion in 2/3 replicates | 17 | 0 |
| Deletion in 1/3 replicates | 34 | 2 |
| No deletion | 144 | 233 |
| Prevalence of deletion | 8.0% (17/212) | 0% (0/235) |
Table 3
hrp2 and hrp3 deletions in Africa and South America.
| Site | Deletions | |||||
|---|---|---|---|---|---|---|
| N | hrp2 exon 2 | hrp2 exon 1 | hrp3 | hrp2 + hrp3* | Mixed† | |
| Kenya | 241 | 0% (0/241) | 0% (0/241) | 0% (0/241) | 0% (0/241) | |
| Zanzibar | 91 | 0% (0/91) | 0% (0/91) | 0% (0/91) | 0% (0/91) | |
| Ethiopia | 47 | 2.1% (1/47) | 2.1% (1/47) | 74.5% (35/47) | 2.1% (1/47) | 1× hrp3 |
| Ghana | 223 | 0% (0/226) | 0% (0/223) | 0.4% (1/223) | 0% (0/170) | 1× hrp2, 3× hrp3 |
| Brazil | 187 | 46.5% (87/187) | NA | 62.0% (116/187) | 46.0% (86/187) | 2× hrp2, 2× hrp3 |
| Ecuador | 41 | 0% (0/41) | 0% (0/41) | 53.7% (22/41) | 0% (0/39) | |
-
*
Samples with deletions of hrp2 and hrp3. Note that these samples are also counted as deletions in the columns for hrp2, and for hrp3 (e.g., in Brazil 87 samples carried hrp2 deletion, of which 86 also carried hrp3 deletion).
-
†
Samples with only a proportion of all parasites carrying the deletion.
Table 4
Field samples included in this study.
| Site | N | Year of collection | Type of diagnosis* | Type of infection | Sample collection method |
|---|---|---|---|---|---|
| Kenya | 248 | 2019 | qPCR | Asymptomatic | Whole blood |
| Zanzibar/Tanzania | 91 | 2017–2018 | qPCR | Asymptomatic | Filter paper |
| Ethiopia | 47 | 2016 | qPCR | Clinical + asymptomatic | Filter paper |
| Ghana | 213 | 2020 | qPCR | Clinical | Whole blood |
| Brazil | 187 | 2010–2013 | Microscopy | Clinical | Whole blood |
| Ecuador | 41 | 2019–2020 | Microscopy | Clinical | Filter paper |
-
qPCR, quantitative PCR.
-
*
While samples might have been screened by other diagnostic methods, the screening listed was used as inclusion criteria for this study.
Additional files
-
Supplementary file 1
Assay conditions.
- https://cdn.elifesciences.org/articles/72083/elife-72083-supp1-v2.docx
-
Supplementary file 2
Database.
- https://cdn.elifesciences.org/articles/72083/elife-72083-supp2-v2.xlsx
-
Transparent reporting form
- https://cdn.elifesciences.org/articles/72083/elife-72083-transrepform1-v2.docx
Download links
A two-part list of links to download the article, or parts of the article, in various formats.
Downloads (link to download the article as PDF)
Open citations (links to open the citations from this article in various online reference manager services)
Cite this article (links to download the citations from this article in formats compatible with various reference manager tools)
High-throughput Plasmodium falciparum hrp2 and hrp3 gene deletion typing by digital PCR to monitor malaria rapid diagnostic test efficacy
eLife 11:e72083.
https://doi.org/10.7554/eLife.72083


