Protein kinase Cδ is essential for the IgG response against T-cell-independent type 2 antigens and commensal bacteria
- Division of Cancer Cell Biology, Research Institute for Biomedical Sciences (RIBS), Tokyo University of Science, Japan
Figures
Figure 1 with 1 supplement

T-cell-independent type-2 (TI-2) antigen (Ag) distinctively induces B-cell activation and class-switch recombination (CSR) to IgG in vitro.
(A and B) Naive B cells purified from the spleen of Igk−/− B1-8flox/+ mice were stimulated with NP-CGG or NP-Ficoll. (A) 3H-thymidine incorporation on day 3. (B) IgM and IgG concentrations in the culture supernatants on day 3. (C–E) Igk−/− B1-8flox/+ B cells were stimulated with none (–), NP-CGG, or NP-Ficoll and IL-1α, IL-1β, or IFNα, as indicated. (C) Enzyme-linked immunosorbent assay (ELISA) of IgG3 in the culture supernatant on day 3. AU, arbitrary units. (D) Representative flow cytometric plots on day 3 with the numbers indicating percentages of IgG3+ B cells (top). The frequencies of IgG3+ cells among the B cells (bottom). (E) quantitative reverse-transcription polymerase chain reaction (qRT-PCR) analysis of the circle Iγ3-Cµ and Aicda transcripts on day 2. Data are means ± standard deviations (SDs) of two (B and C), two to three (D), or three (A) biological replicates or three technical replicates (E). The data are representative of at least three (A and B) or two (C–E) independent experiments. *p < 0.05; ***p < 0.001; ****p < 0.0001; p values were calculated by one- (B) or two (C and D)-way analysis of variance (ANOVA) with Tukey’s test.
-
Figure 1—source data 1
Source data for Figure 1A–E.
- https://cdn.elifesciences.org/articles/72116/elife-72116-fig1-data1-v2.xlsx
Figure 1—figure supplement 1
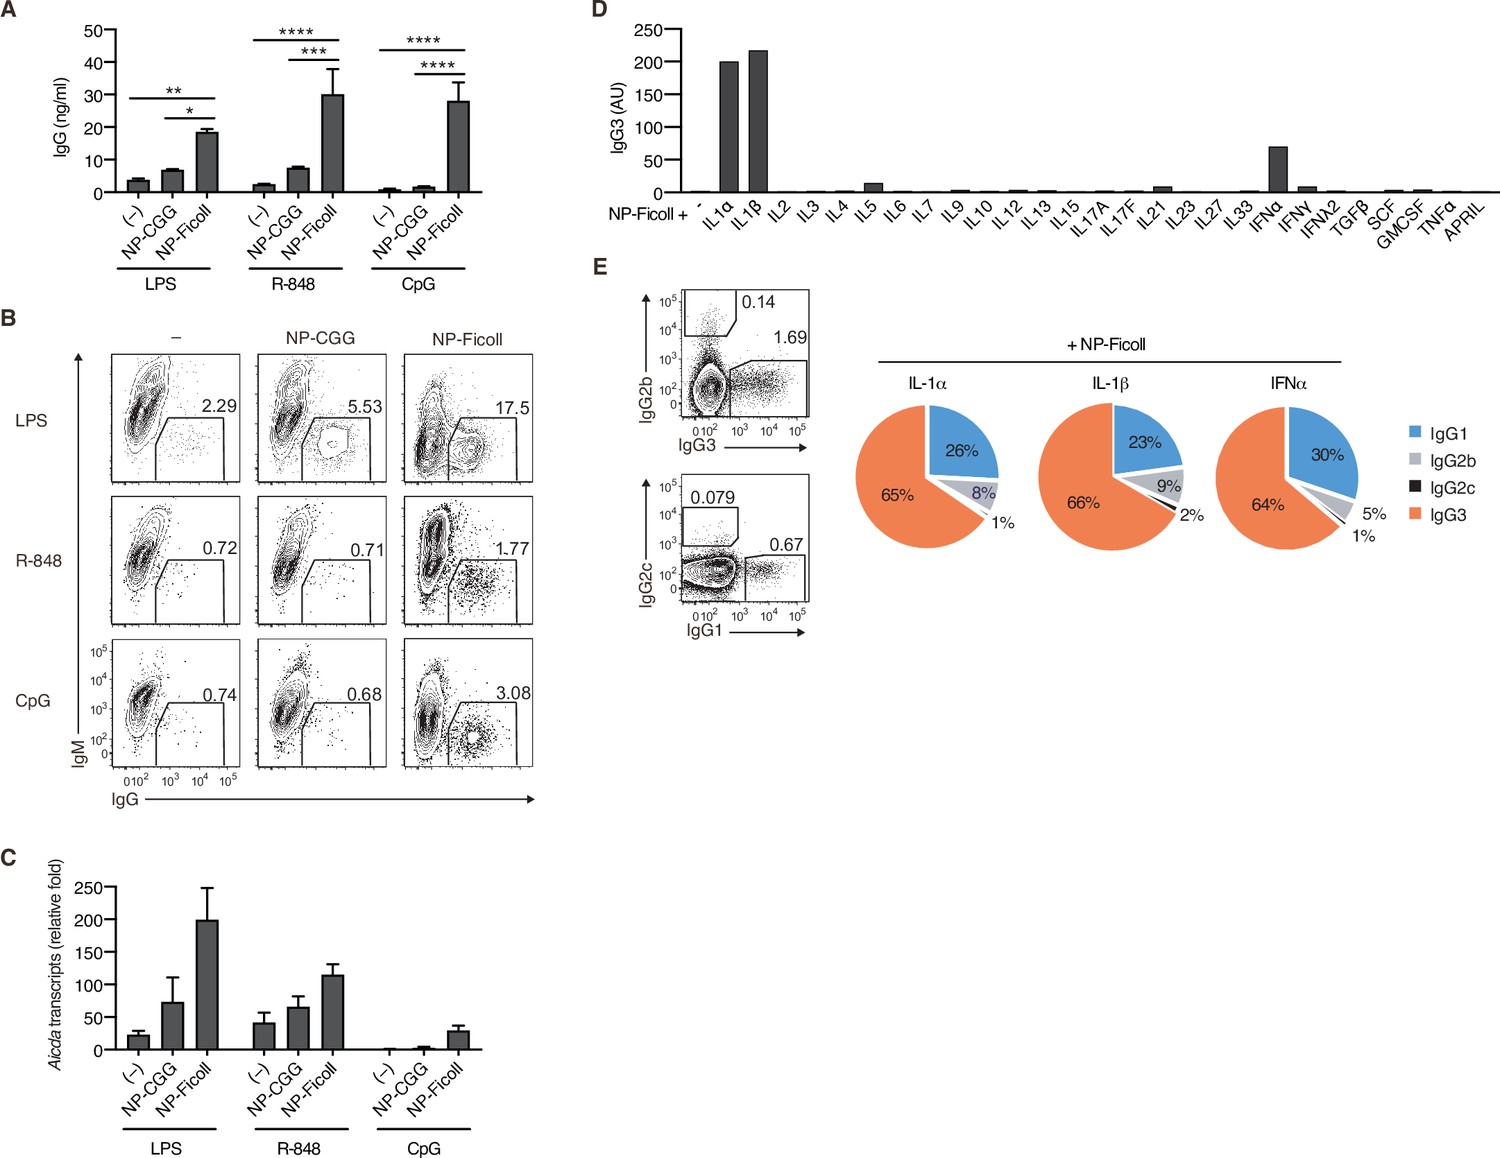
T-cell-independent type-2 (TI-2) antigen (Ag) induces the generation of IgG+ cells in the presence of secondary stimulation.
(A–C) Igk−/− B1-8flox/+ naive B cells were stimulated with nothing (–), NP-CGG, or NP-Ficoll in the presence of LPS, R-848, or CpG. (A) IgG concentration in the culture supernatants on day 3. (B) Representative flow cytometric plots on day 3 showing percentages of IgG+ B cells. (C) qRT-PCR analysis of Aicda transcripts on day 2. (D and E) Igk−/− B1-8flox/+ naive B cells were stimulated with NP-Ficoll and each indicated cytokine. (D) IgG3 in the culture supernatants on day 4 titrated by enzyme-linked immunosorbent assay (ELISA). AU, arbitrary units. (E) Representative flow cytometric profiles of IgG1, IgG2b, IgG2c, and IgG3 on day 3 (left) and the ratio of B cells expressing these IgG subclasses estimated from the flow cytometry data (right). Data are means of three biological replicates (E), means ± standard deviations (SDs) of two biological replicates (A), or three technical replicates (C). The data are representative of two independent experiments. *p < 0.05; **p < 0.01; ***p < 0.001; ****p < 0.0001; p values were calculated by two-way analysis of variance (ANOVA) with Tukey’s test (A).
-
Figure 1—figure supplement 1—source data 1
Source data for Figure 1—figure supplement 1A, C, D.
- https://cdn.elifesciences.org/articles/72116/elife-72116-fig1-figsupp1-data1-v2.xlsx
Figure 2 with 1 supplement
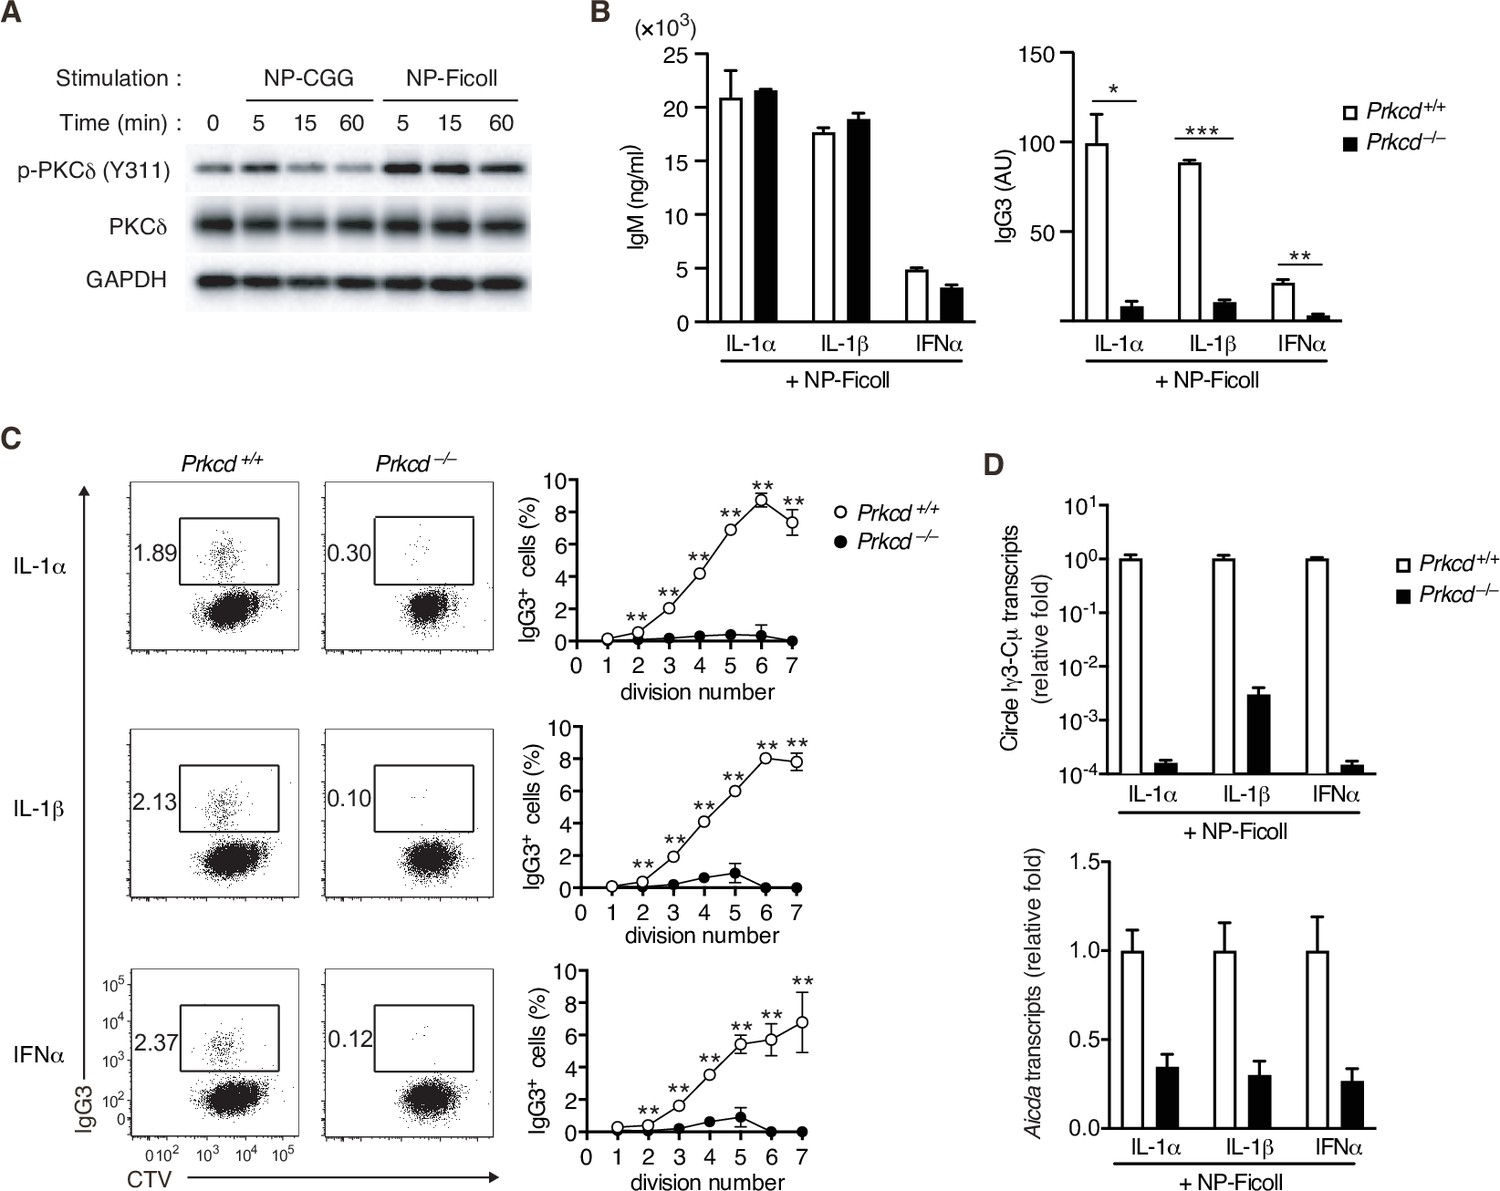
Impaired T-cell-independent type-2 (TI-2) antigen (Ag)-mediated class-switch recombination (CSR) in protein kinase C (PKC)δ-deficient B cells.
(A) Immunoblot analysis of the indicated molecules in Igk−/− B1-8flox/+ B cells stimulated with NP-CGG or NP-Ficoll for the indicated time periods. (B–D) Prkcd+/+ Igk−/− B1-8flox/+ or Prkcd−/− Igk−/− B1-8flox/+ B cells were stimulated with NP-Ficoll and IL-1α, IL-1β, or IFNα. The B cells were labeled with CellTrace Violet (CTV) before culture in C. (B) Enzyme-linked immunosorbent assay (ELISA) of IgM and IgG3 in the culture supernatants on day 5. AU, arbitrary units. (C) Representative flow cytometric plots of the B cells on day 3 showing percentages of IgG3+ B cells (left). The frequencies of IgG3+ cells at each cell division number (right). (D) qRT-PCR analysis of the circle Iγ3-Cµ and Aicda transcripts on day 2. Data are means ± standard deviations (SDs) of two (B) or three (C) biological replicates or three technical replicates (D). The data are representative of at least three (A and B) or two (C and D) independent experiments. *p < 0.05; **p < 0.01; ***p < 0.001; p values were calculated by unpaired multiple t-test (B and C).
-
Figure 2—source data 1
Source data for Figure 2B–D.
- https://cdn.elifesciences.org/articles/72116/elife-72116-fig2-data1-v2.xlsx
-
Figure 2—source data 2
Source data for Figure 2A.
- https://cdn.elifesciences.org/articles/72116/elife-72116-fig2-data2-v2.tif
-
Figure 2—source data 3
Source data for Figure 2A.
- https://cdn.elifesciences.org/articles/72116/elife-72116-fig2-data3-v2.tif
-
Figure 2—source data 4
Source data for Figure 2A.
- https://cdn.elifesciences.org/articles/72116/elife-72116-fig2-data4-v2.tif
-
Figure 2—source data 5
Source data for Figure 2A.
- https://cdn.elifesciences.org/articles/72116/elife-72116-fig2-data5-v2.pdf
Figure 2—figure supplement 1
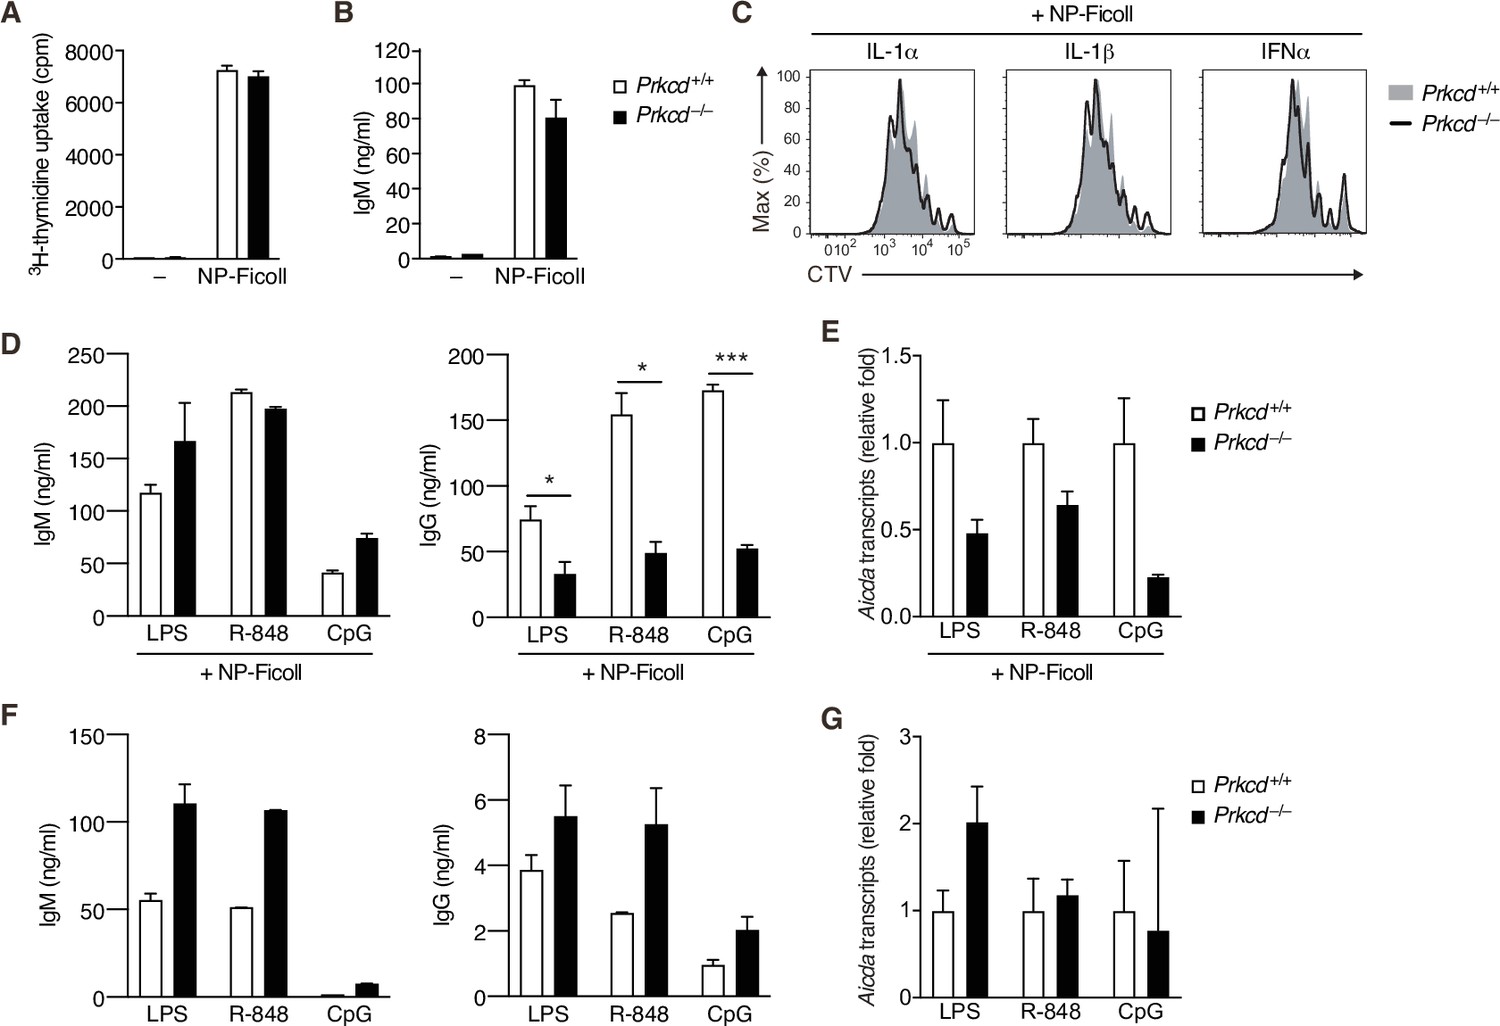
In vitro response of protein kinase C (PKC)δ-deficient B cells.
(A and B) Prkcd+/+ Igk−/− B1-8flox/+ or Prkcd−/− Igk−/− B1-8flox/+ naive B cells were cultured with medium alone (–) or NP-Ficoll. (A) 3H-thymidine incorporation on day 3. (B) IgM concentration in the culture supernatant on day 4. (C) The histogram of CellTrace Violet (CTV) in cells analyzed in Figure 2C. (D–G) Prkcd+/+ Igk−/− B1-8flox/+ or Prkcd−/− Igk−/− B1-8flox/+ naive B cells were cultured with NP-Ficoll and LPS, R-848, or CpG (D and E) or LPS, R-848, or CpG alone (F and G). (D and F) IgM and IgG concentrations in the culture supernatants on day 3. (E and G) qRT-PCR analysis of Aicda transcripts on day 2. Data are means ± standard deviation (SD) of three (A) or two to three (B), and two (D and F) biological replicates, or three technical replicates (E and G). The data are representative of two independent experiments. *p < 0.05; ***p < 0.001; p values were calculated by unpaired multiple t-test (A, B, and D).
-
Figure 2—figure supplement 1—source data 1
Source data for Figure 2—figure supplement 1A, B, D-G.
- https://cdn.elifesciences.org/articles/72116/elife-72116-fig2-figsupp1-data1-v2.xlsx
Figure 3 with 1 supplement
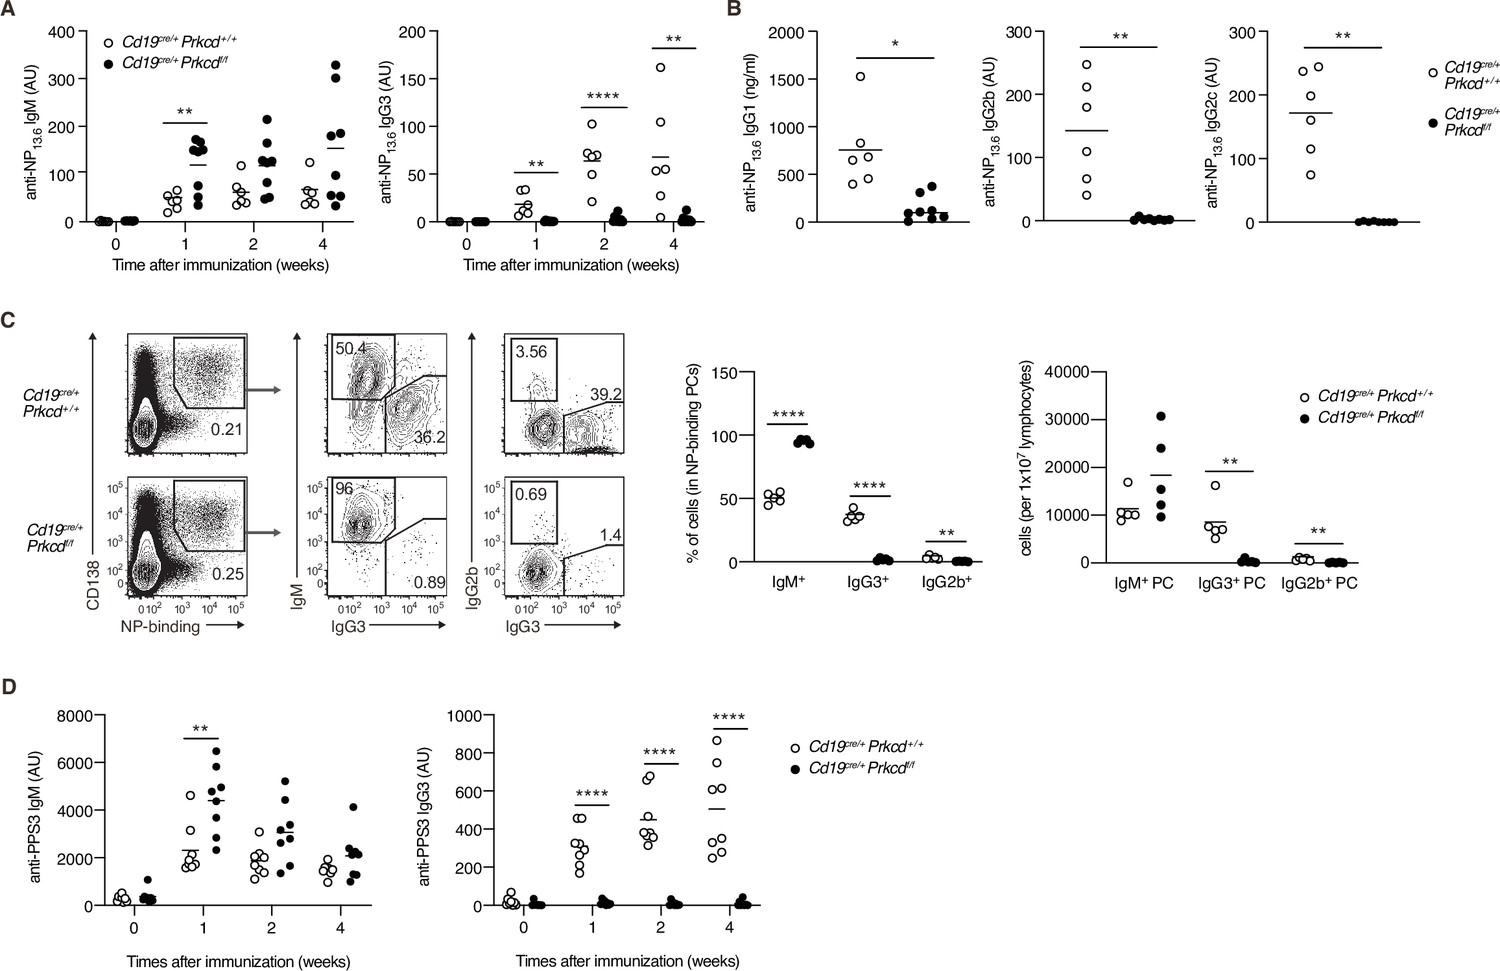
Protein kinase C (PKC)δ is required for IgG production in T-cell-independent type-2 (TI-2) response in vivo.
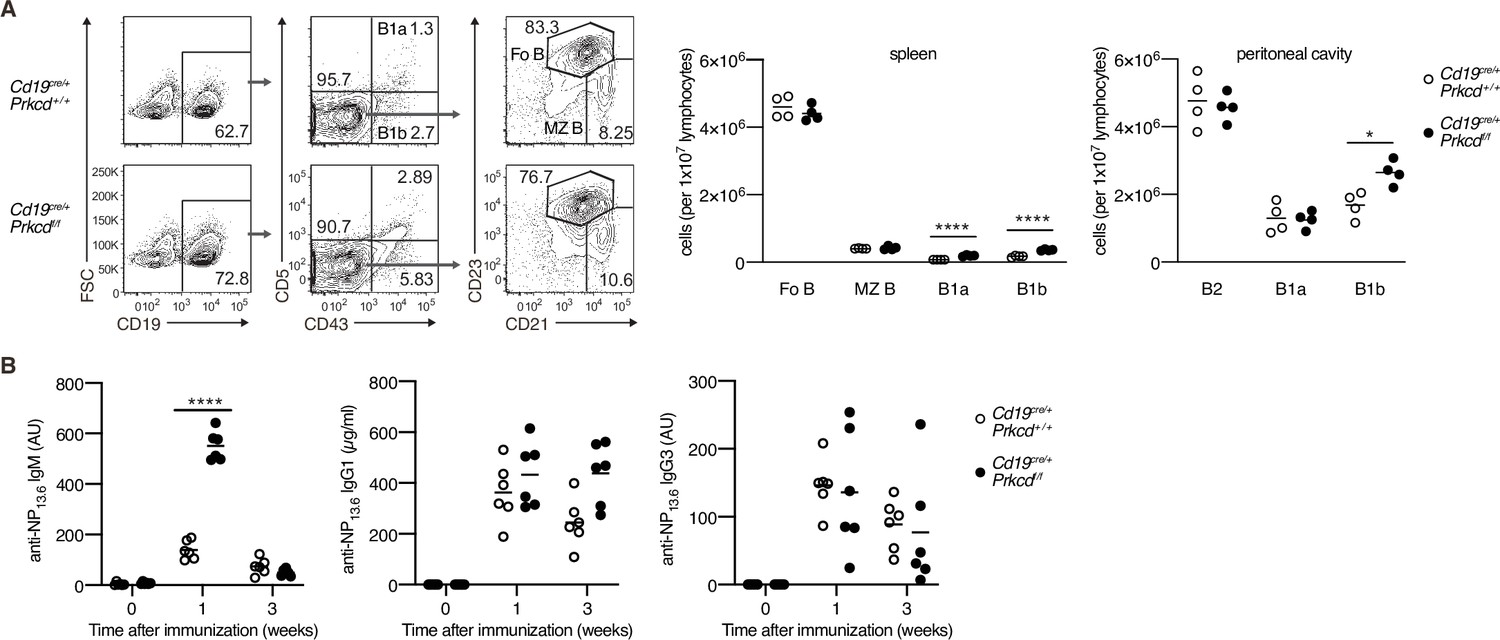
(A–C) Cd19cre/+ Prkcd+/+ and Cd19cre/+ Prkcdf/f mice were immunized with NP-Ficoll. (A) Enzyme-linked immunosorbent assay (ELISA) of serum anti-NP IgM and IgG3 at the indicated weeks. (B) ELISA of serum anti-NP IgG1, IgG2b, and IgG2c at 2 weeks after immunization. (C) Representative flow cytometric plots of the spleen cells on day 7 after immunization. The numbers indicate the percentage of cells in each gate (left). The frequencies of IgM+, IgG2b+, and IgG3+ cells among NP-binding plasma cells (PCs; NP+ CD138+; middle) and the numbers of such cells per 1 × 10⁷ total lymphocytes (right) are plotted. (D) ELISA of anti-PPS3 IgM and IgG3 in the serum of Cd19cre/+ Prkcd+/+ and Cd19cre/+ Prkcdf/f mice at the indicated weeks after immunization with PPS3. Results are presented in AU, arbitrary units (A, B, and D). Small horizontal bars are the means of six to eight (A and B), five (C), and eight (D) biological replicates. Each symbol represents an individual mouse. The data are representative of three (A and C) or two (B and D) independent experiments. *p < 0.05; **p < 0.01; ****p < 0.0001; p values were calculated by unpaired multiple (A, C, and D) or two-tailed unpaired Welch’s t-test (B).
-
Figure 3—source data 1
Source data for Figure 3A–D.
- https://cdn.elifesciences.org/articles/72116/elife-72116-fig3-data1-v2.xlsx
Figure 3—figure supplement 1
B-cell development and T-cell-dependent (TD) response of protein kinase C (PKC)δ-deficient mice.
(A) Flow cytometric analysis of spleen cells and peritoneal cavity cells of Cd19cre/+ Prkcd+/+ and Cd19cre/+ Prkcd fl/fl mice. Gating strategy of follicular B cells (Fo B; CD19+CD43−CD21+CD23+), marginal zone B cells (MZ B; CD19+CD43−CD21highCD23low), B1a cells (CD19+CD43+CD5+), and B1b cells (CD19+CD43+CD5−) in the spleen is shown (left). The numbers of Fo B, MZ B, B1a, and B1b cells in spleen (middle) and peritoneal cavity (right) are plotted. (B) Enzyme-linked immunosorbent assay (ELISA) of anti-NP IgM, IgG1, and IgG3 in the sera of Cd19cre/+ Prkcd+/+ and Cd19cre/+ Prkcd fl/fl mice at indicated weeks after immunization with NP-CGG in alum. AU, arbitrary units. Small horizontal bars are the means of four (A) or six (B) biological replicates. Each symbol represents an individual mouse. The data are representative of three (A) or two (B) independent experiments. *p < 0.05; ****p < 0.0001; p values were calculated by unpaired multiple t-test.
-
Figure 3—figure supplement 1—source data 1
Source data for Figure 3—figure supplement 1A, B.
- https://cdn.elifesciences.org/articles/72116/elife-72116-fig3-figsupp1-data1-v2.xlsx
Figure 4 with 1 supplement
Protein kinase C (PKC)δ signaling promotes IgG class switching by inducing activation-induced cytidine deaminase (AID).
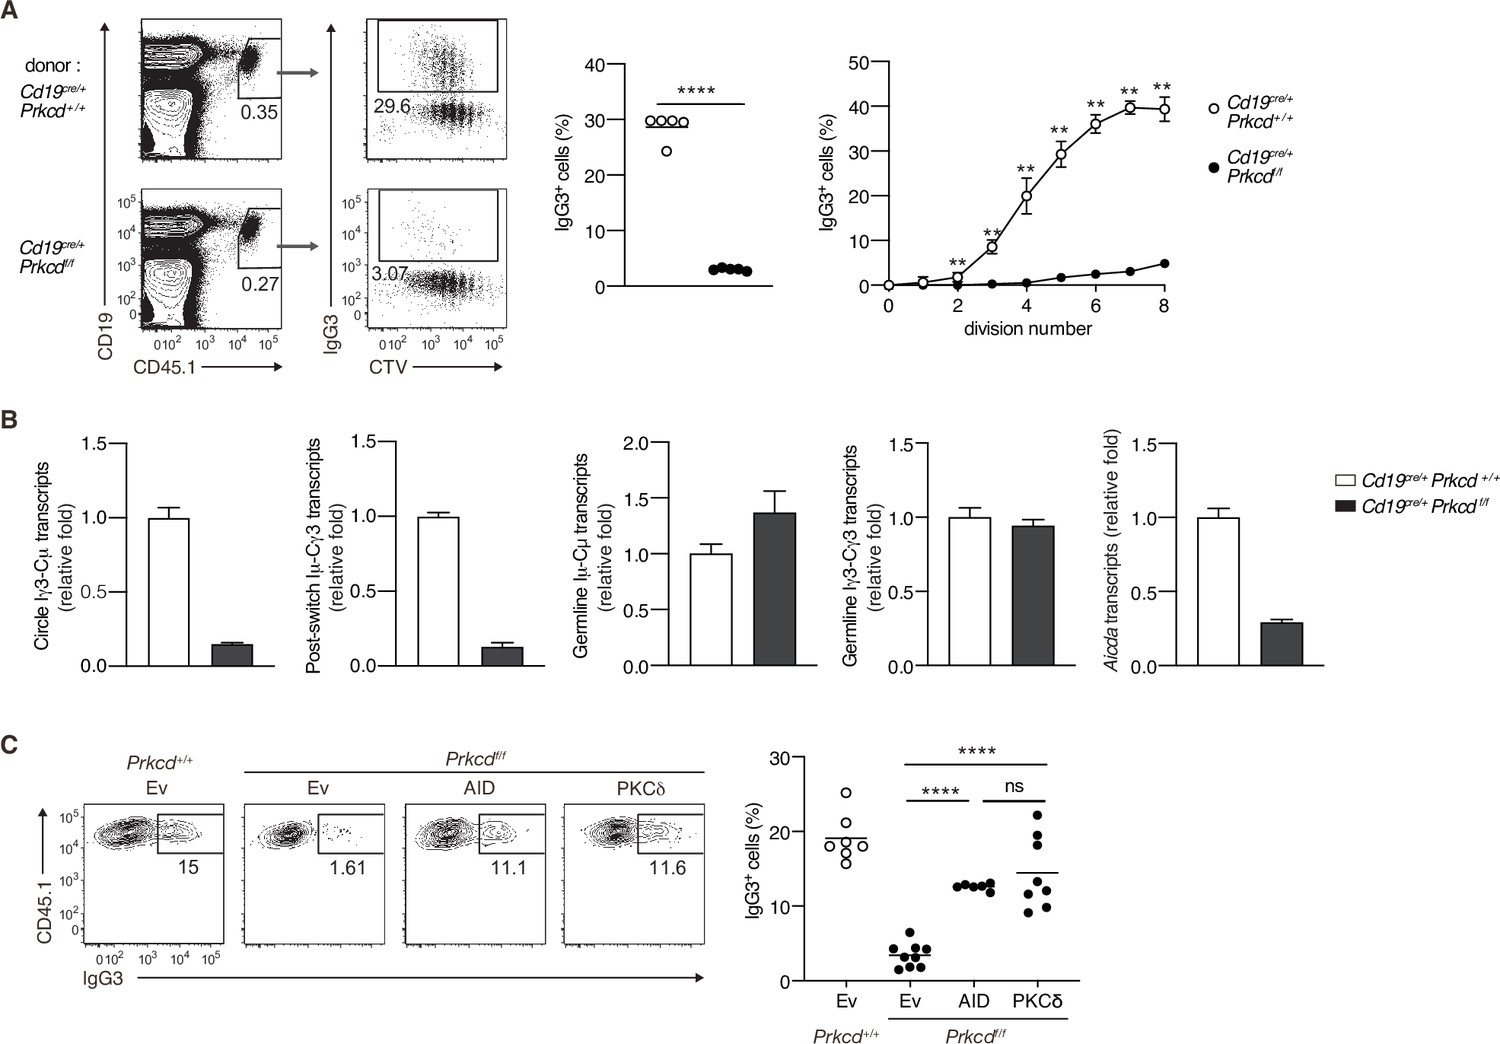
(A and B) B cells purified from Prkcd+/+ Cd19cre/+ B1-8 hi or Prkcdf/f Cd19cre/+ B1-8 hi mice were labeled with CellTrace Violet (CTV) and transferred into B6 mice, which were immunized with NP-Ficoll on the next day. Spleen cells were analyzed 3 days later. (A) Representative flow cytometric plots of the spleen cells with the numbers indicating percentages of the cells within the neighboring gates (left). The frequency of IgG3+ cells among whole donor B cells (CD45.1+ CD19+ CD138–) (middle) and at each cell division number (right) are shown. (B) qRT-PCR analysis of the indicated transcripts in the donor B cells collected as in Figure 4—figure supplement 1A. (C) Prkcd+/+ Cd19cre/+ B1-8 hi or Prkcdf/f Cd19cre/+ B1-8 hi B cells transduced with an empty vector (Ev) or vectors expressing AID or PKCδ were transferred into B6 mice that had been immunized with NP-Ficoll on the previous day as in Figure 4—figure supplement 1B. Representative flow cytometry plots of the donor cells transduced with the vectors (CD45.1+GFP+, gated as in Figure 4—figure supplement 1C) (left) and the frequency of IgG3+ cells among the CD45.1+GFP+ cells (right) on day 3 after transfer. Small horizontal bars are the means of five (A) or six to nine (C) biological replicates. Each symbol represents an individual mouse (A, middle; C). The symbols are the means of five biological replicates (A, right). Data are means ± standard deviations (SDs) of three technical replicates pooled from five mice (B). The data are representative of three (A) or two (B) independent experiments or is pooled from two independent experiments (C). ns, not significant (p > 0.05); **p < 0.01; ****p < 0.0001; p values were calculated by unpaired multiple t-test (A) or one-way analysis of variance (ANOVA) with Tukey’s test (C).
-
Figure 4—source data 1
Source data for Figure 4A–C.
- https://cdn.elifesciences.org/articles/72116/elife-72116-fig4-data1-v2.xlsx
Figure 4—figure supplement 1
Gating strategies.
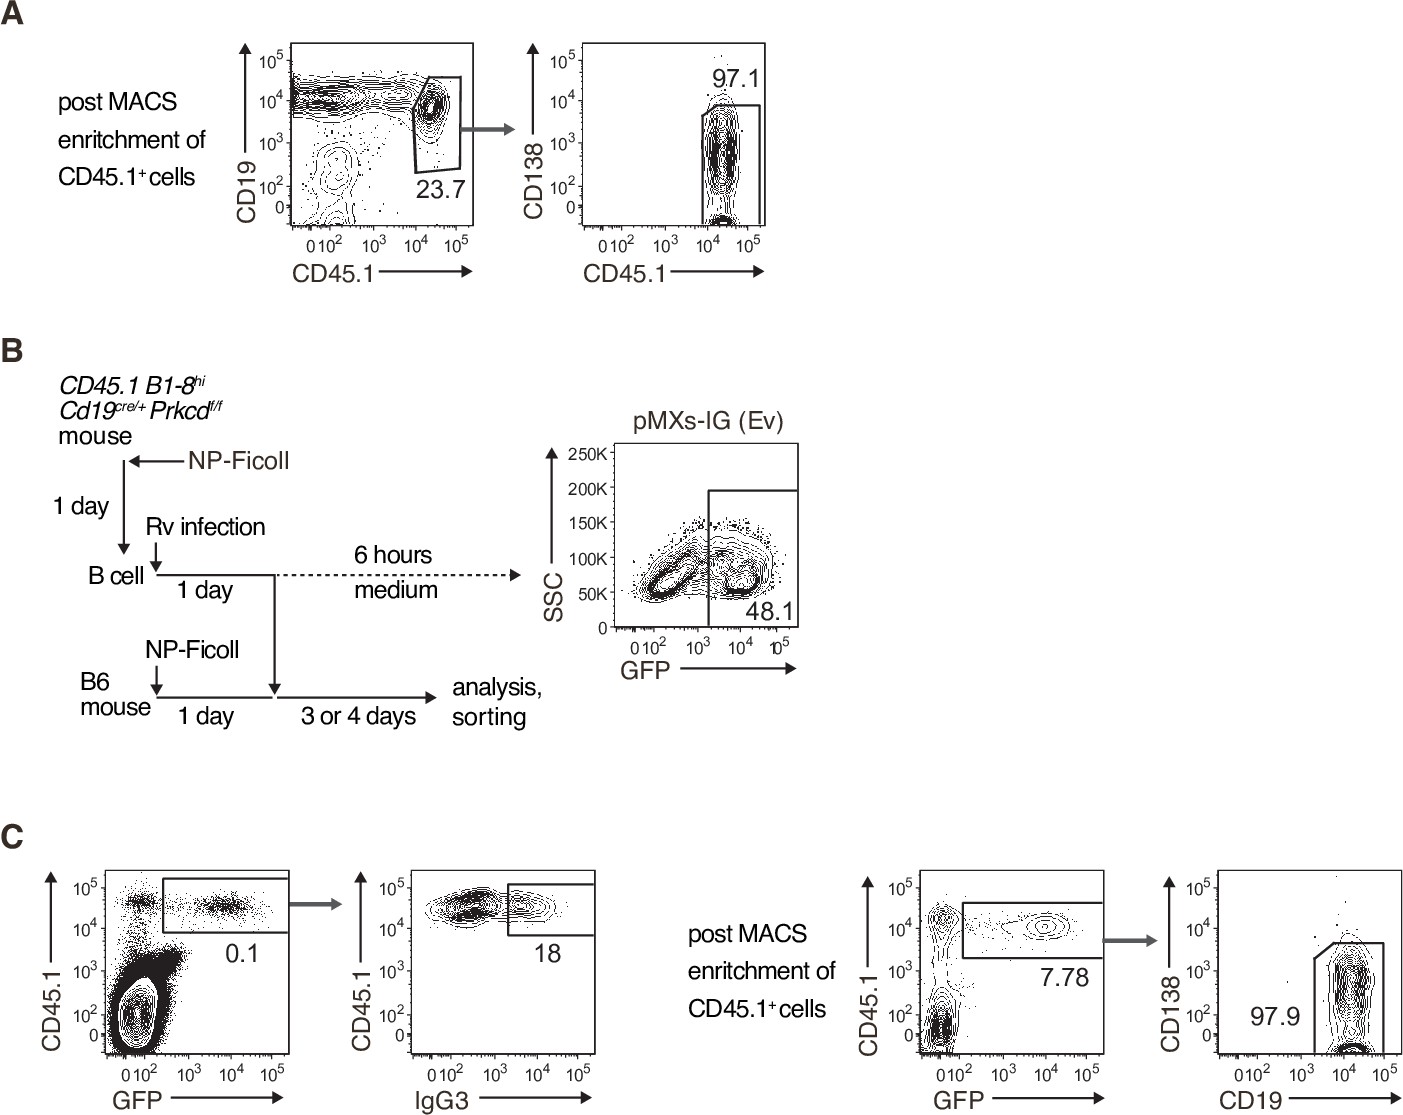
(A) Sorting strategy for donor B cells used in Figure 4B. The starting population was spleen cells of B6 mice transferred with Prkcd+/+ Cd19cre/+ B1-8 hi or Prkcdf/f Cd19cre/+ B1-8 hi, CD45.1+ B cells and immunized with NP-Ficoll 3 days previously. CD45.1+ cells were enriched by a MACS system (left) and then donor B cells (CD45.1+CD19+CD138−) were further sorted by flow cytometry (right). (B and C) Strategy for retrovirus (Rv) transduction and the analysis of the TI-2 response (B, left). B cells collected from Prkcd+/+ Cd19cre/+ B1-8 hi or Prkcdf/f Cd19cre/+ B1-8 hi mice immunized with NP-Ficoll 1 day previously were infected with Rv and cultured for 1 day. Some Rv-transduced cells were further cultured in medium for 6 hr and analyzed by flow cytometry. Representative data of the cells transduced with pMXs-IRES-GFP empty vector (Ev) is shown (B, right). Other Rv-transduced cells were transferred into B6 mice that had been immunized with NP-Ficoll on the previous day. Spleen cells of recipient mice were analyzed or used for cell sorting 3 or 4 days later. Gating strategy of donor cells transduced with vectors (CD45.1+ GFP+) and the expression profile of IgG3 are shown (C, left). After the enrichment of CD45.1+ cells by a MACS system, the vector-transduced donor B cells (CD45.1+ GFP+ CD19+ CD138–) were sorted as shown (C, right). The data are representative of at least three independent experiments.
Figure 5 with 1 supplement
Protein kinase C (PKC)δ regulates IgG class switching by upregulating BATF expression.
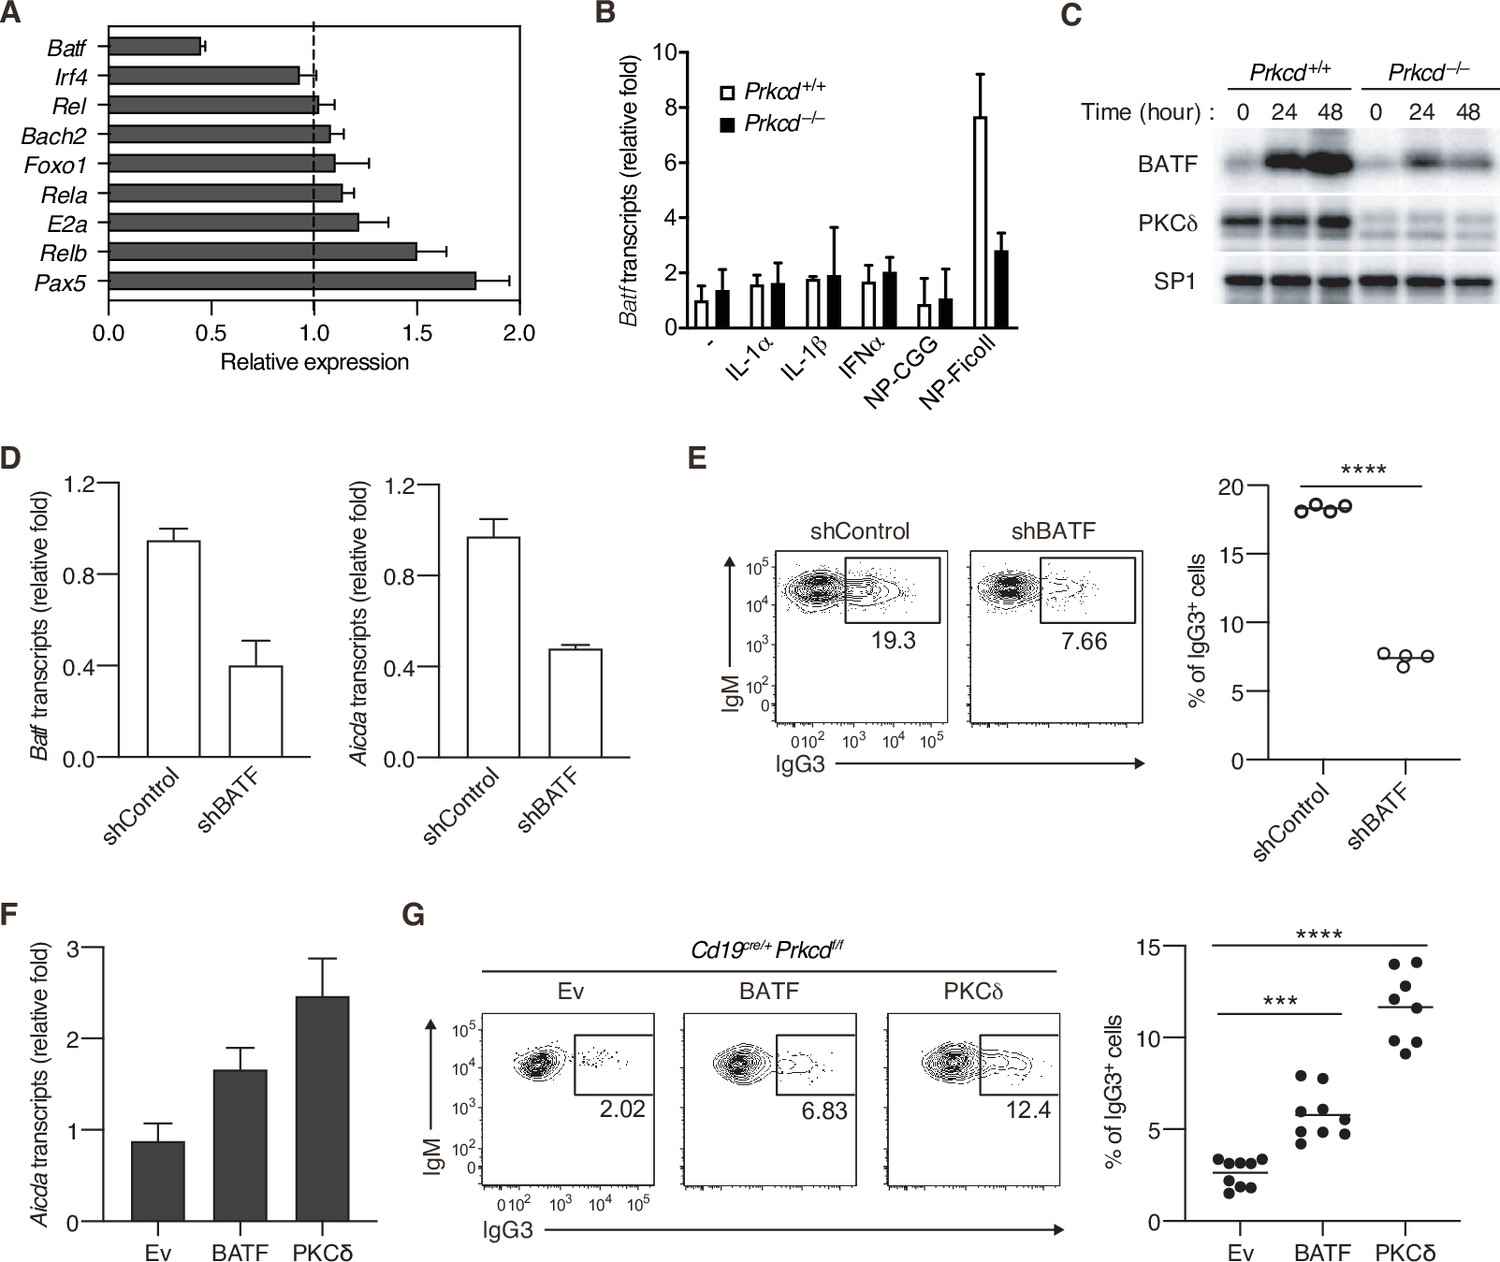
(A) qRT-PCR analysis of the transcripts of the indicated genes in Prkcd+/+ Cd19cre/+ B1-8 hi or Prkcdf/f Cd19cre/+ B1-8 hi donor B cells (CD45.1+CD19+CD138−) purified as in Figure 4—figure supplement 1A from the recipient mice immunized with NP-Ficoll 3 days previously. Shown is the relative expression of each gene in Prkcdf/f Cd19cre/+ cells to that in Prkcd+/+ Cd19cre/+ cells. (B) qRT-PCR analysis of Batf transcripts in Prkcd+/+ Igk−/− B1-8flox/+ or Prkcd−/− Igk−/− B1-8flox/+ B cells cultured with medium alone (–) or with the indicated stimuli for 2 days. (C) Immunoblot analysis in Prkcd+/+ Igk−/− B1-8flox/+ or Prkcd−/− Igk−/− B1-8flox/+ B cells stimulated with NP-Ficoll for the indicated times. (D and E) B1-8hi B cells transduced with knockdown vectors for luciferase (shControl) or BATF (shBATF) were transferred into B6 mice that had been immunized with NP-Ficoll on the previous day as in Figure 4—figure supplement 1B, and their spleen cells were analyzed on day 4 after transfer. (D) qRT-PCR analysis of Aicda and Batf transcripts in the vector-transduced donor B cells (CD45.1+ GFP+ CD19+ CD138−) collected as in Figure 4—figure supplement 1C. (E) Representative flow cytometric plots of the transduced donor cells with the numbers indicating the percentage of IgG3+ cells (left) and the frequency of the IgG3+ cells among such cells (right) gated as in Figure 4—figure supplement 1C. (F and G) Prkcdf/f Cd19cre/+ B1-8 hi B cells transduced with Ev or vectors expressing BATF or PKCδ were transferred into B6 mice that had been immunized with NP-Ficoll on the previous day, and their spleen cells were analyzed 3 days after transfer. (F) qRT-PCR analysis of Aicda transcripts in the vector-transduced donor B cells. (G) Representative flow cytometric plots of the transduced donor cells with the numbers indicating the percentage of IgG3+ cells (left) and the frequency of the IgG3+ cells among such cells (right). Data are means ± standard deviations (SDs) of three technical replicates (A, B, D, and F). Samples were pooled from five to eight mice (D and F). Small horizontal bars are the means of four (E) or eight to nine (G) biological replicates. Each symbol represents an individual mouse (E and G). The data are representative of two independent experiments (A–F) or are pooled from two independent experiments (G). ***p < 0.001; ****p < 0.0001; p values were calculated by two-tailed unpaired Student’s t-test (E) or one-way analysis of variance (ANOVA) with Tukey’s test (G).
-
Figure 5—source data 1
Source data for Figure 5A, B and D–G.
- https://cdn.elifesciences.org/articles/72116/elife-72116-fig5-data1-v2.xlsx
-
Figure 5—source data 2
Source data for Figure 5C.
- https://cdn.elifesciences.org/articles/72116/elife-72116-fig5-data2-v2.tif
-
Figure 5—source data 3
Source data for Figure 5C.
- https://cdn.elifesciences.org/articles/72116/elife-72116-fig5-data3-v2.tif
-
Figure 5—source data 4
Source data for Figure 5C.
- https://cdn.elifesciences.org/articles/72116/elife-72116-fig5-data4-v2.tif
-
Figure 5—source data 5
Source data for Figure 5C.
- https://cdn.elifesciences.org/articles/72116/elife-72116-fig5-data5-v2.pdf
Figure 5—figure supplement 1
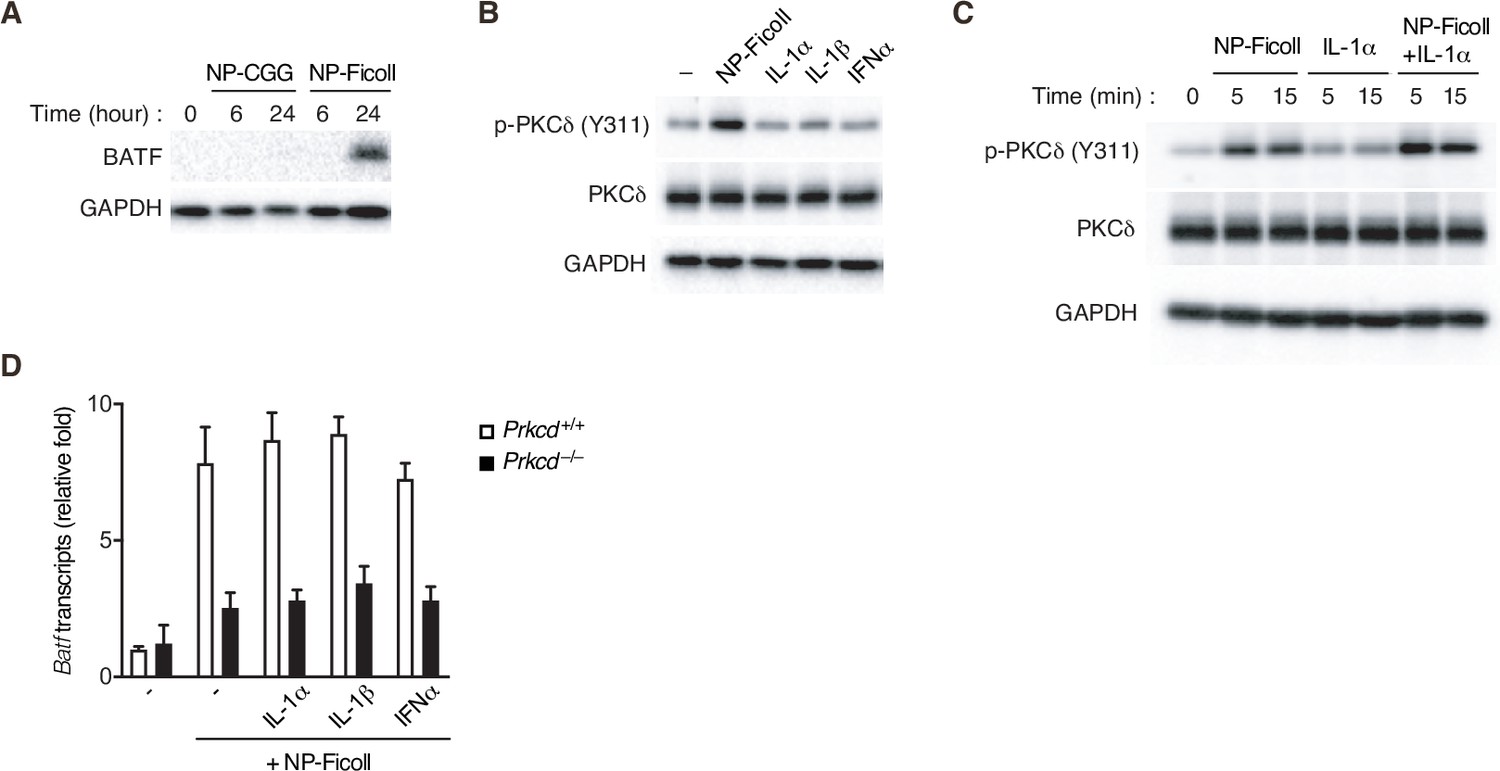
The expression of BATF and the phosphorylation of protein kinase C (PKC)δ.
(A–C) Immunoblot analysis of Igk−/− B1-8flox/+ B cells stimulated with the indicated reagents for the indicated times (A and C) or 5 min (B). (D) qRT-PCR analysis of Batf transcripts in Prkcd+/+ Igk−/− B1-8flox/+ or Prkcd−/− Igk−/− B1-8flox/+ B cells cultured with the indicated reagents for 2 days. The data are representative of two independent experiments.
-
Figure 5—figure supplement 1—source data 1
Source data for Figure 5—figure supplement 1A.
- https://cdn.elifesciences.org/articles/72116/elife-72116-fig5-figsupp1-data1-v2.tif
-
Figure 5—figure supplement 1—source data 2
Source data for Figure 5—figure supplement 1A.
- https://cdn.elifesciences.org/articles/72116/elife-72116-fig5-figsupp1-data2-v2.tif
-
Figure 5—figure supplement 1—source data 3
Source data for Figure 5—figure supplement 1A.
- https://cdn.elifesciences.org/articles/72116/elife-72116-fig5-figsupp1-data3-v2.pdf
-
Figure 5—figure supplement 1—source data 4
Source data for Figure 5—figure supplement 1B.
- https://cdn.elifesciences.org/articles/72116/elife-72116-fig5-figsupp1-data4-v2.tif
-
Figure 5—figure supplement 1—source data 5
Source data for Figure 5—figure supplement 1B.
- https://cdn.elifesciences.org/articles/72116/elife-72116-fig5-figsupp1-data5-v2.tif
-
Figure 5—figure supplement 1—source data 6
Source data for Figure 5—figure supplement 1B.
- https://cdn.elifesciences.org/articles/72116/elife-72116-fig5-figsupp1-data6-v2.tif
-
Figure 5—figure supplement 1—source data 7
Source data for Figure 5—figure supplement 1B.
- https://cdn.elifesciences.org/articles/72116/elife-72116-fig5-figsupp1-data7-v2.pdf
-
Figure 5—figure supplement 1—source data 8
Source data for Figure 5—figure supplement 1C.
- https://cdn.elifesciences.org/articles/72116/elife-72116-fig5-figsupp1-data8-v2.tif
-
Figure 5—figure supplement 1—source data 9
Source data for Figure 5—figure supplement 1C.
- https://cdn.elifesciences.org/articles/72116/elife-72116-fig5-figsupp1-data9-v2.tif
-
Figure 5—figure supplement 1—source data 10
Source data for Figure 5—figure supplement 1C.
- https://cdn.elifesciences.org/articles/72116/elife-72116-fig5-figsupp1-data10-v2.tif
-
Figure 5—figure supplement 1—source data 11
Source data for Figure 5—figure supplement 1C.
- https://cdn.elifesciences.org/articles/72116/elife-72116-fig5-figsupp1-data11-v2.pdf
-
Figure 5—figure supplement 1—source data 12
Source data for Figure 5—figure supplement 1D.
- https://cdn.elifesciences.org/articles/72116/elife-72116-fig5-figsupp1-data12-v2.xlsx
Figure 6

Protein kinase C (PKC)δ is required for protective antibacterial IgG3 production.
Cd19cre/+ Prkcd+/+ and Cd19cre/+ Prkcdf/f mice were cohoused for at least 4 weeks and treated with 3 % dextran sodium sulfate (DSS) for 7 days. (A) Serum IgM, IgG1, IgG2b, and IgG3 against fecal bacteria after cohousing were quantified by enzyme-linked immunosorbent assay (ELISA). AU, arbitrary units. (B) Colony-forming unit (CFU) of aerobes and anaerobes in the blood 7 days after DSS treatment. (C) Kaplan–Meier survival plot of 16 (Cd19cre/+ Prkcd+/+) and 12 (Cd19cre/+ Prkcdff/f) mice at indicated days. Small horizontal bars are the means of 7 (A), or 15 (Cd19cre/+ Prkcd+/+) or 11 (Cd19cre/+ Prkcdff/f) in (B), biological replicates. Data were obtained from 16 (Cd19cre/+ Prkcd+/+) or 12 (Cd19cre/+ Prkcdff/f) mice in (C). Each symbol represents an individual mouse (A and B). The data are representative of two independent experiments (A) or pooled from two independent experiments (B and C). **p < 0.01; ***p < 0.001; p values were calculated by two-tailed unpaired Welch’s t-test (A), unpaired multiple t-test (B), or log-rank test (C).
-
Figure 6—source data 1
Source data for Figure 6A and B.
- https://cdn.elifesciences.org/articles/72116/elife-72116-fig6-data1-v2.xlsx
Figure 7
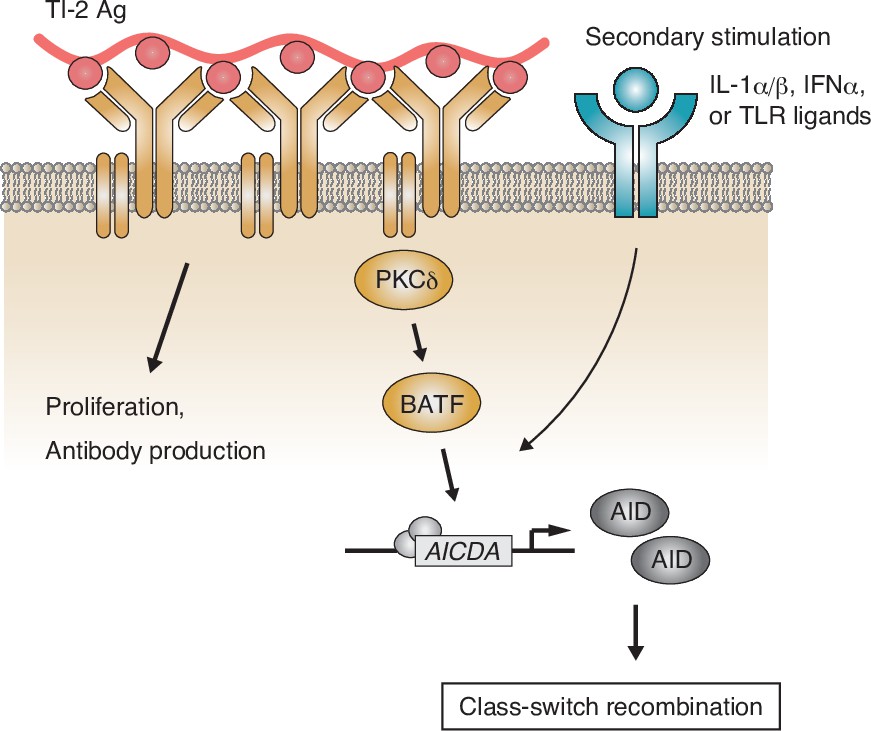
Working model of the protein kinase C (PKC)δ-mediated induction of class-switch recombination (CSR) in the T-cell-independent type-2 (TI-2) response.
B-cell receptor (BCR) stimulation with a TI-2 antigen (Ag) activates PKCδ signaling and induces the expression of BATF, which works cooperatively with secondary signals induced by IL-1α/β, IFNα, or TLR ligands and drives the transcription of activation-induced cytidine deaminase (AID) to induce IgG CSR.
Tables
Key resources table
| Reagent type (species) or resource | Designation | Source or reference | Identifiers | Additional information |
|---|---|---|---|---|
| Strain, strain background (M. musculus) | C57BL/ 6NCrSlc (B6) | Japan SLC Inc | ||
| Genetic reagent (M. musculus) | C57BL/6 CD45.1 | RIKEN BRC | RBRC00144 | |
| Genetic reagent (M. musculus) | B1-8flox/+ | doi:10.1016/S0092-8674(00)80373–6. | ||
| Genetic reagent (M. musculus) | B1-8hi | doi:10.1038/ni776. | JAX stock #007775 | |
| Genetic reagent (M. musculus) | Cd19cre/+ | doi:10.1038/376352a0. | JAX stock #006785 | |
| Genetic reagent (M. musculus) | Prkcd−/− | RIKEN BRC | RBRC00457 | |
| Genetic reagent (M. musculus) | Prkcdf/f | RIKEN BRC | RBRC06462 | |
| Genetic reagent (M. musculus) | Igk−/− | doi:10.1002/j.1460–2075.1993.tb05722.x. | ||
| Antibody | APC-Cy7 anti-mouse CD19 (Rat monoclonal) | BioLegend | Cat# 115,530 | Flow cytometry (1/200) |
| Antibody | Biotin Rat Anti-Mouse CD43 (Rat monoclonal) | BD Biosciences | Cat# 20,737 | Flow cytometry (1/300) |
| Antibody | BV421 anti-mouse CD138 (Rat monoclonal) | BioLegend | Cat# 142,508 | Flow cytometry (1/500) |
| Antibody | BV421 Rat Anti-Mouse IgG3 (Rat monoclonal) | BD Biosciences | Cat# 565,808 | Flow cytometry (1/300) |
| Antibody | CD45.1 Monoclonal Antibody (A20), APC (Mouse monoclonal) | Invitrogen | Cat# 17-0453-82 | Flow cytometry (1/200) |
| Antibody | FITC anti-mouse CD21/CD35 (CR2/CR1) Antibody (Rat monoclonal) | BioLegend | Cat# 123,407 | Flow cytometry (1/300) |
| Antibody | FITC anti-mouse CD5 Antibody (Rat monoclonal) | BioLegend | Cat# 100,605 | Flow cytometry (1/300) |
| Antibody | Goat Anti-Mouse IgG2c, Human ads-FITC (Goat Polyclonal) | Southern Biotech | Cat# 1079-02 | Flow cytometry (1/300) |
| Antibody | Goat F(ab')2 Anti-Mouse IgG2b, Human ads-FITC (Goat Polyclonal) | Southern Biotech | Cat# 1092-02 | Flow cytometry (1/300) |
| Antibody | Goat F(ab')2 Anti-Mouse IgG3, Human ads-FITC (Goat Polyclonal) | Southern Biotech | Cat# 1102-02 | Flow cytometry (1/300) |
| Antibody | PE anti-mouse CD23 Antibody (Rat monoclonal) | BioLegend | Cat# 101,607 | Flow cytometry (1/300) |
| Antibody | PE anti-mouse IgG2b (Rat monoclonal) | BioLegend | Cat# 406,707 | Flow cytometry (1/500) |
| Antibody | PE-Cy7 anti-mouse CD19 (Rat monoclonal) | BioLegend | Cat# 115,520 | Flow cytometry (1/200) |
| Antibody | Goat Anti-Mouse IgG Fc-HRP (Goat Polyclonal) | SouthernBiotech | Cat# 1033-05 | ELISA (1/2000) |
| Antibody | Goat Anti-Mouse IgG, Human ads-UNLB (Goat Polyclonal) | SouthernBiotech | Cat# 1030-01 | ELISA (1/1000) |
| Antibody | Goat Anti-Mouse IgG1, Human ads-HRP (Goat Polyclonal) | SouthernBiotech | Cat# 1070-05 | ELISA (1/2000) |
| Antibody | Goat Anti-Mouse IgG1, Human ads-UNLB (Goat Polyclonal) | SouthernBiotech | Cat# 1070-01 | ELISA (1/1000) |
| Antibody | Goat Anti-Mouse IgG2b, Human ads-HRP (Goat Polyclonal) | SouthernBiotech | Cat# 1090-05 | ELISA (1/2000) |
| Antibody | Goat Anti-Mouse IgG2b, Human ads-UNLB (Goat Polyclonal) | SouthernBiotech | Cat# 1090-01 | ELISA (1/1000) |
| Antibody | Goat Anti-Mouse IgG2c, Human ads-HRP (Goat Polyclonal) | SouthernBiotech | Cat# 1079-05 | ELISA (1/2000) |
| Antibody | Goat Anti-Mouse IgG3, Human ads-UNLB (Goat Polyclonal) | SouthernBiotech | Cat# 1100-01 | ELISA (1/1000) |
| Antibody | Goat Anti-Mouse IgG3, Human/Bovine/Horse SP ads-HRP (Goat Polyclonal) | SouthernBiotech | Cat# 1103-05 | ELISA (1/2000) |
| Antibody | Goat Anti-Mouse IgM, Human ads-HRP (Goat Polyclonal) | SouthernBiotech | Cat# 1020-05 | ELISA (1/2000) |
| Antibody | Goat Anti-Mouse IgM, Human ads-UNLB (Goat Polyclonal) | SouthernBiotech | Cat# 1020-01 | ELISA (1/1000) |
| Antibody | Anti-GAPDH mAb (Mouse monoclonal) | MBL | Cat# M171-3 | WB (1/3000) |
| Antibody | Anti-SP1 antibody (Rabbit polyclonal) | Abcam | Cat# ab227383 | WB (1/5000) |
| Antibody | BATF (D7C5) Rabbit mAb (Rabbit monoclonal) | Cell Signaling Technology | Cat# 8638 | WB (1/2000) |
| Antibody | Phospho-PKCdelta (Tyr311) Antibody (Rabbit polyclonal) | Cell Signaling Technology | Cat# 2055 | WB (1/2000) |
| Antibody | PKC δ Antibody (C-17) (Rabbit polyclonal) | Santa Cruz Biotechnology | Cat# sc-213 | WB (1/2000) |
| Recombinant DNA reagent | pMXs-IRES-GFP | other | Dr. Kitamura (University of Tokyo) | |
| Recombinant DNA reagent | pMXs-BATF-IRES-GFP | This paper | BATF (M. musculus) | |
| Recombinant DNA reagent | pMXs-AID-IRES-GFP | This paper | AID (M. musculus) | |
| Recombinant DNA reagent | pMXs-PKCδ-IRES-GFP | This paper | PKCδ (M. musculus) | |
| Recombinant DNA reagent | pSIREN-GFP shLuciferase (shControl) | doi:10.1016/j.celrep.2020.108333. | ||
| Recombinant DNA reagent | pSIREN-GFP shBATF | This paper | Taget sequence (5′–3′): ACCCTGGAC TGTCATGAATGA | |
| Recombinant DNA reagent | pVSV-G | Clontech | Cat# 631,530 | |
| Sequence-based reagent | Primers | This paper | See Supplementary file 1 | |
| Sequence-based reagent | Oligo(dT) 20 Primer | Thermo Fisher Scientific | Cat# 18418020 | |
| Peptide, recombinant protein | NP46-Ficoll | Biosearch Technologies | Cat# F-1420 | |
| Peptide, recombinant protein | NP40-CGG | doi:10.1038/ni.3508. | ||
| Peptide, recombinant protein | NP14-BSA- Alexa Fluor 647 | doi:10.1038/ni.3508. | ||
| Peptide, recombinant protein | Cytokines | See Supplementary file 1 | ||
| Commercial assay or kit | Fixation/ Permeabilization Solution Kit | BD Biosciences | Cat# 554,714 | |
| Commercial assay or kit | QIAquick PCR Purification Kit | QIAGEN | Cat# 28,106 | |
| Commercial assay or kit | RNeasy Micro | QIAGEN | Cat# 74,004 | |
| Commercial assay or kit | Thunderbird SYBR qPCR Mix | TOYOBO | Cat# QPS-201 | |
| Commercial assay or kit | SuperPrep II Cell lysis & RT Kit for qPCR | TOYOBO | Cat# SCQ-401 | |
| Commercial assay or kit | CellTraceTM Violet (CTV) Cell proliferation Kit | Thermo Fisher Scientific | Cat# C34557 | |
| Chemical compound, drug | PPS3 | ATCC | Cat# 169X | |
| Chemical compound, drug | LPS | Sigma | Cat# L2880 | |
| Chemical compound, drug | R-848 | InvivoGen | Cat# tlrl-r848 | |
| Chemical compound, drug | CpG ODN 1826 | InvivoGen | Cat# tlrl-1826 | |
| Chemical compound, drug | Fixable Viability Dye eFluor 506 | Thermo Fisher Scientific | Cat# 65-0866-18 | |
| Chemical compound, drug | DOTAP Liposomal Transfection Reagent | Sigma | Cat# 11202375001 | |
| Chemical compound, drug | TRI Reagent | Sigma | Cat# T9424 | |
| Chemical compound, drug | PEI Max (Mw 40,000) | Polysciences | Cat# 24765-1 | |
| Chemical compound, drug | ReverTra Ace | TOYOBO | Cat# TRT-101 | |
| Chemical compound, drug | KOD Fx Neo DNA polymerase | TOYOBO | Cat# KFX-201 | |
| Chemical compound, drug | [3 H] thymidine | PerkinElmer | Cat# NET027001MC | |
| Chemical compound, drug | anti-APC MicroBeads | MicroBeads | Cat# 130-090-855 | |
| Chemical compound, drug | GoTaq Green Master Mix | Promega | Cat# M712B | |
| Chemical compound, drug | DSS | MP Biomedicals | Cat# 9011-18-1 | |
| Chemical compound, drug | Brain Heart Infusion Agar | BD Bioscience | Cat# 221,570 | |
| Software, algorithm | FlowJo | https://www.flowjo.com/solutions/flowjo | RRID:SCR_008520 | |
| Software, algorithm | GraphPad Prism | https://graphpad.com | RRID:SCR_002798 | |
Additional files
-
Supplementary file 1
The list of cytokines and primers used in this study.
- https://cdn.elifesciences.org/articles/72116/elife-72116-supp1-v2.xlsx
-
Transparent reporting form
- https://cdn.elifesciences.org/articles/72116/elife-72116-transrepform1-v2.docx
Download links
A two-part list of links to download the article, or parts of the article, in various formats.
Downloads (link to download the article as PDF)
Open citations (links to open the citations from this article in various online reference manager services)
Cite this article (links to download the citations from this article in formats compatible with various reference manager tools)
Protein kinase Cδ is essential for the IgG response against T-cell-independent type 2 antigens and commensal bacteria
eLife 10:e72116.
https://doi.org/10.7554/eLife.72116


