Telocytes regulate macrophages in periodontal disease
- Centre for Craniofacial and Regenerative Biology, Faculty of Dentistry, Oral and Craniofacial Sciences, King's College London, United Kingdom
- Department of Oral and Maxillofacial Implantology, Shanghai Ninth People’s Hospital, Shanghai Jiao Tong University School of Medicine, China
Figures
Figure 1 with 2 supplements
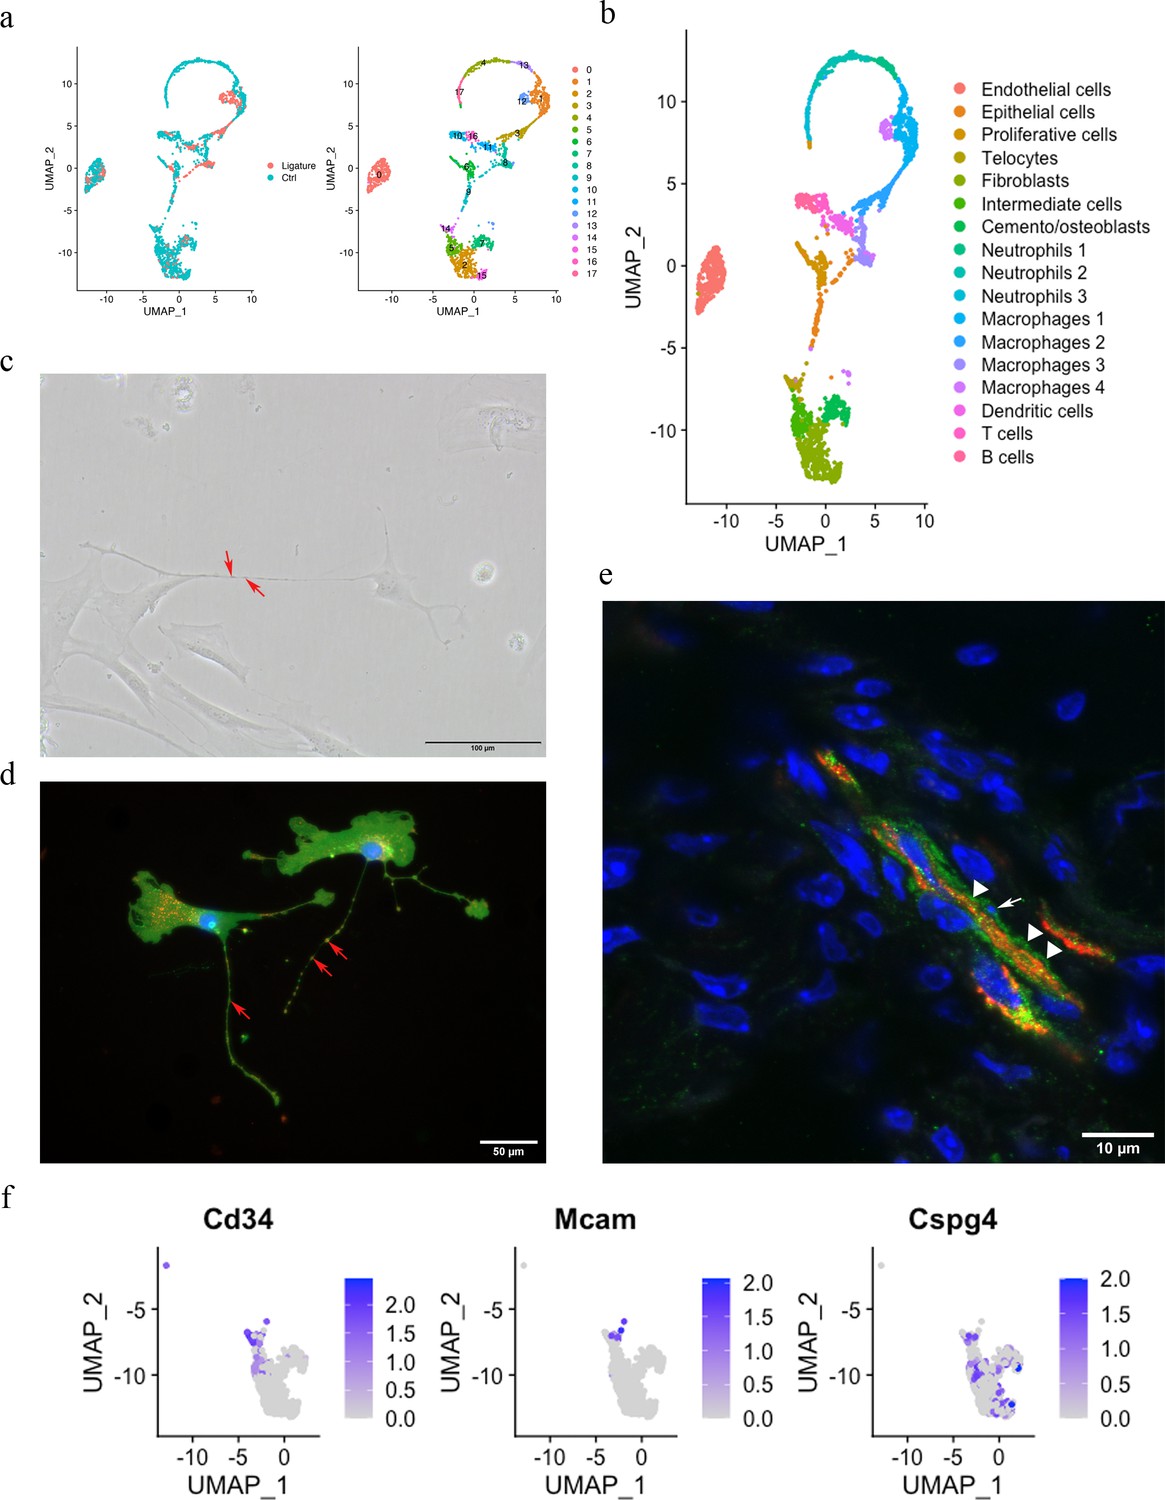
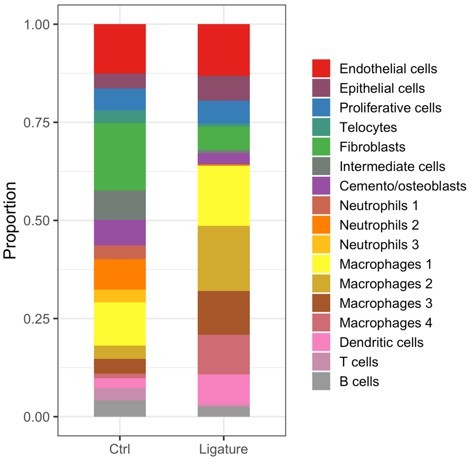
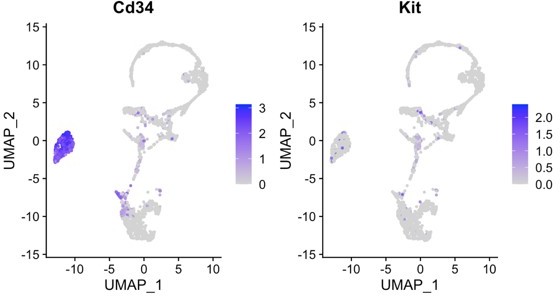
Telocytes in the periodontal ligament (PDL).
(a) PDL single cells from control mice and ligature-treated mice were combined and clustered into 18 clusters. (b) Identification of each cluster. Telocyte clusters were identified by CD34+ and CD31-. Macrophages are in four clusters. (c) In vitro cell culture with CD1 PDL cells at passage 1 shows characteristic telocyte structure, including podoms (red arrows, the dilated portion) and podomers (between two arrows, the thin segments between podoms). (d) Wnt1 lineage-traced cells (GFP in green) were cultured and stained with CD34 in red, which show piriform cell body and moniliform podoms (red arrows) and podomers. (e) Telocytes (CD34+CD31-) was detected near blood vessel (CD34+CD31+) in vivo, CD34 in green, CD31 in red. White arrow indicates the small nuclei, and white triangle shows the elongation of telocyte respectively. (f) CD34 expression was compared with pericyte markers, CD146 (Mcam) and NG2 (Cspg4) expression.
Figure 1—figure supplement 1
Heatmap of cell clusters show telocytes distinct from other mesenchymal cells.
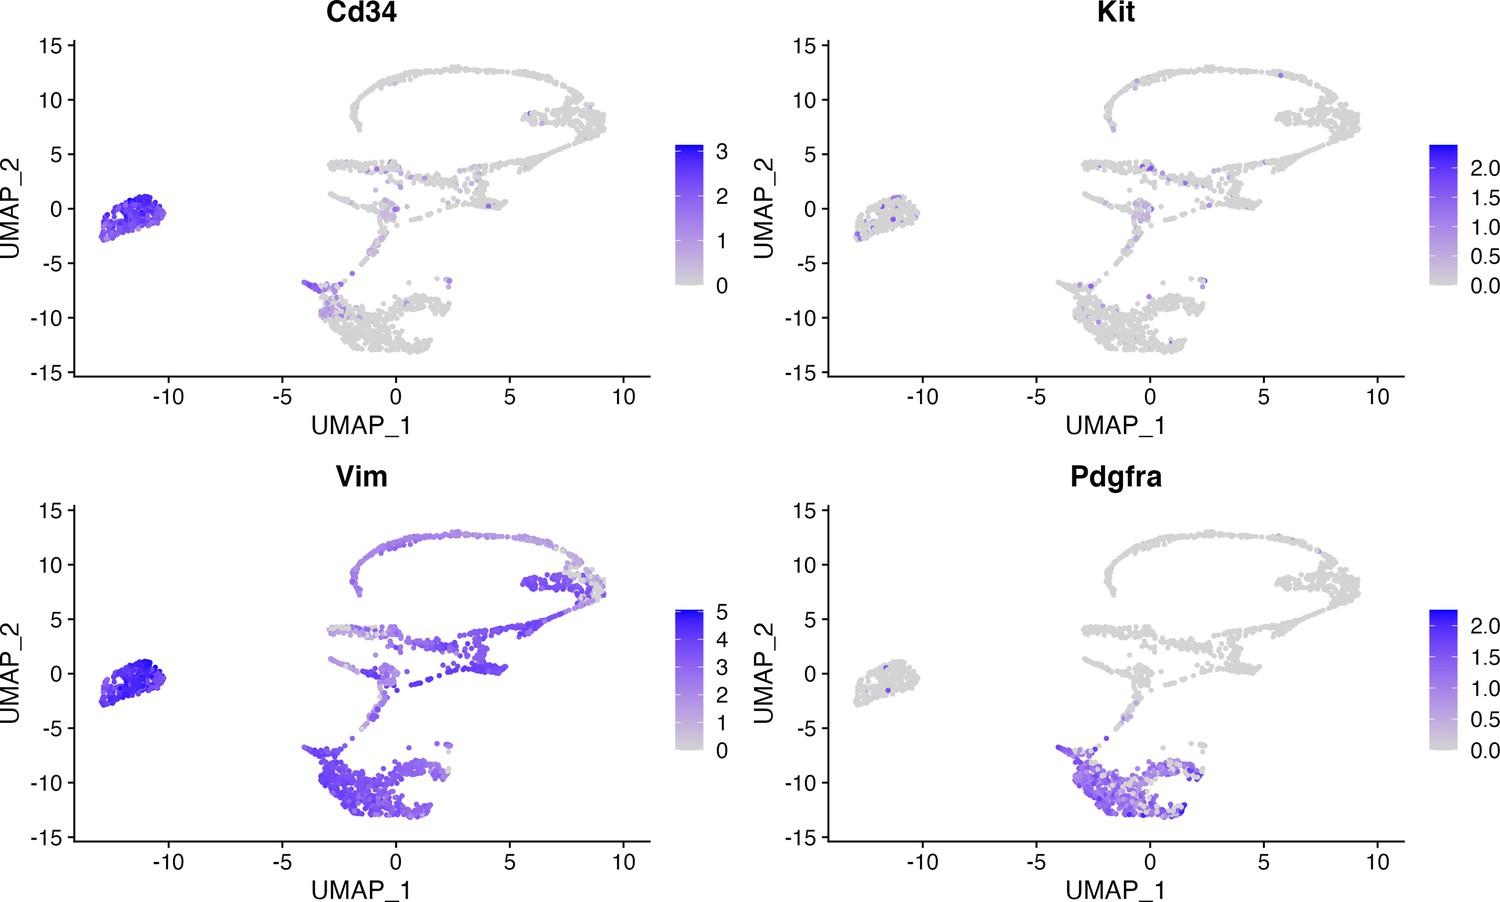
Figure 1—figure supplement 2
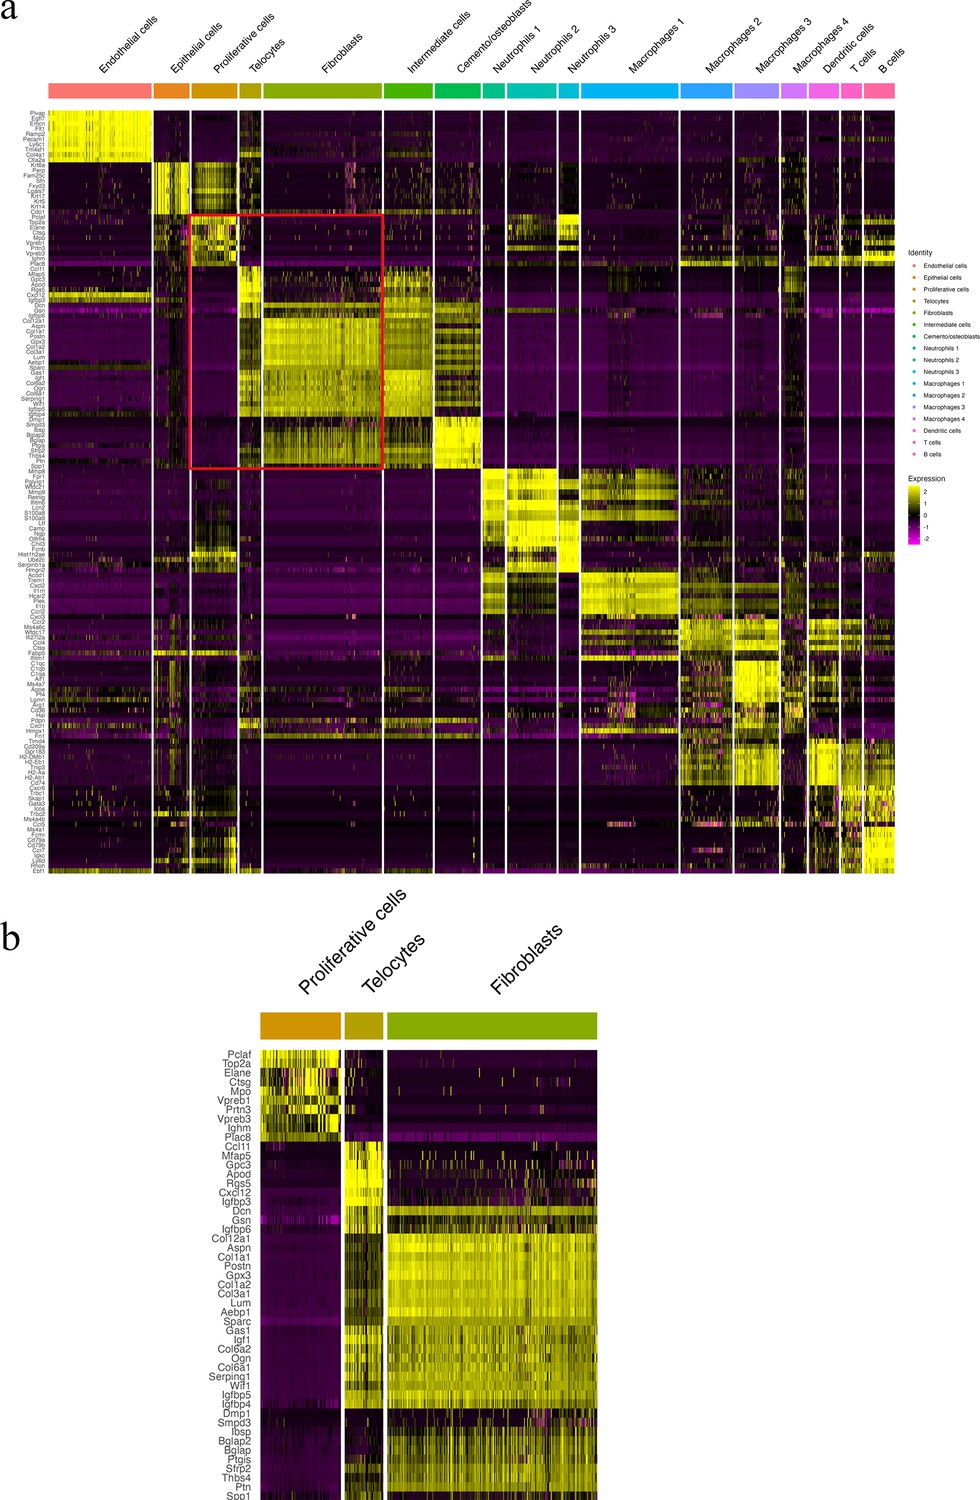
Telocyte identification makers. Panel (b) shows a zoomed region of boxed region in (a).
Figure 2
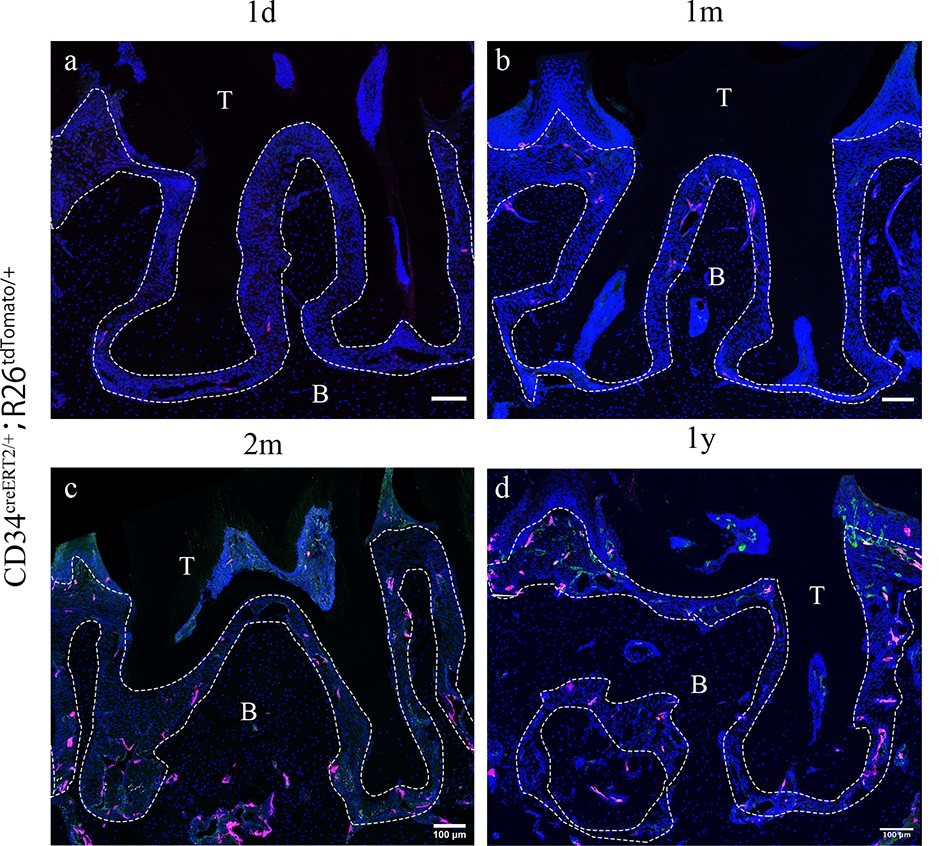
Cd34creERT2 lineage tracing showing limited contribution of telocytes to periodontal ligament (PDL) homeostasis in adulthood.
In the adult stage, Cd34creERT2/+; Rosa26tdTomato/+ mice were used to trace from 7 weeks for 1 day (a), 1 month (b), 2 months (c), and 1 year (d). CD34 lineage-traced cells in red, CD31 were co-stained in green. CD34+CD31- cells are telocytes which were rarely found in periodontal tissue and randomly dispersed during homeostasis. Increase of CD34+CD31- cell number was not detected as the extending of tracing time. Scale bars = 100 μm. B, bone; T, tooth. Periodontal tissue in dotted line.
Figure 3 with 2 supplements
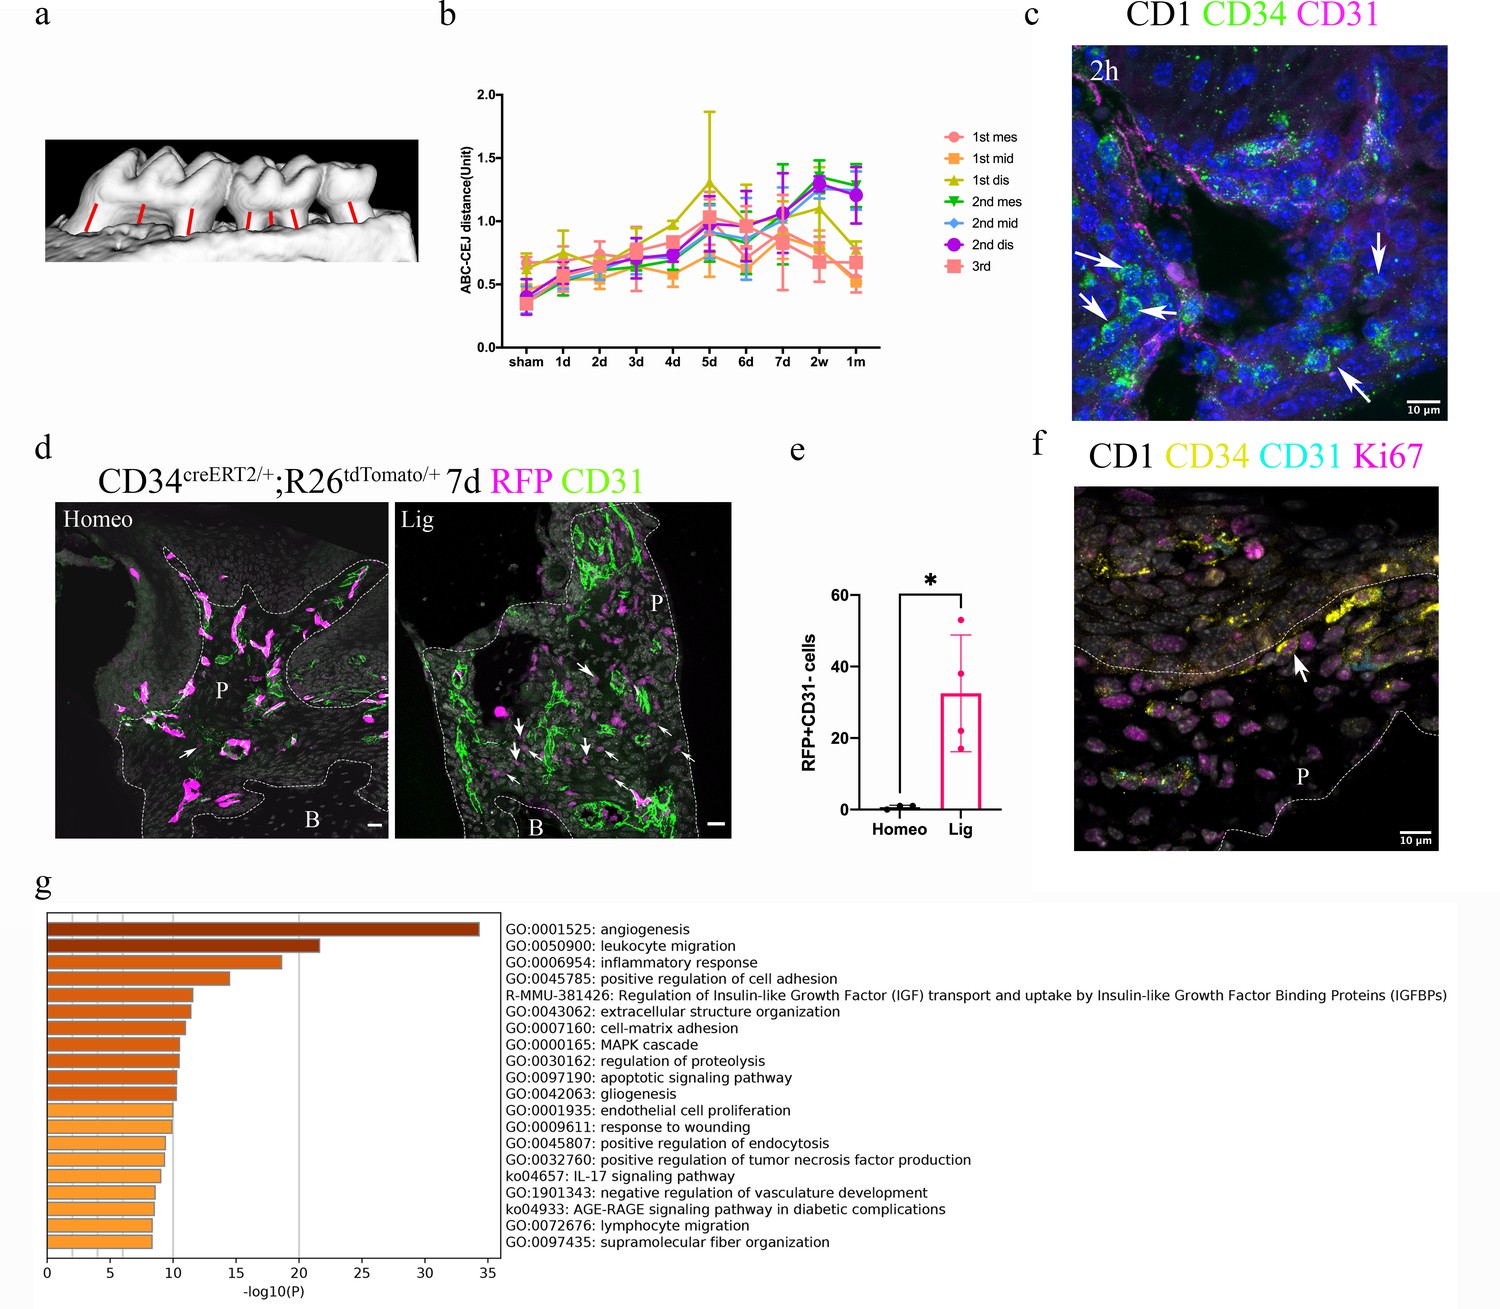
Telocytes are activated in response to periodontitis by increasing their number.
(a) Illustration of bone loss measurement. For the first and second molars, the ABC-CEJ distance of mesial and distal roots in parallel to the root long axis and the ABC-CEJ distance in the trifurcation area were measured; for the third molar, the ABC-CEJ distance in the middle of the tooth was measured. (b) Quantification from micro CT results indicates the change of bone loss in periodontitis plotted by time course (n = 3). Hard tissue around the second molar is severely affected, the time for all molars reaching the bone loss plateau is between day 5 and day 7. 1 unit = 0.4 mm (n = 3). (c) An accumulation of telocytes was found in periodontitis as early as 2 hr after the ligation procedure. These telocytes (CD34, green) were mostly found around blood vessels (CD31, red), especially tissue toward the crown. Scale bars = 10 μm. (d) Cd34creERT2/+; Rosa26tdTomato/+ mice were given three tamoxifen injections started from the procedure day and harvested on day 7. Significantly increased CD34+ cells (red) were observed in the periodontitis group. There were more endothelial cells (green) observed on day 7 of periodontitis. The telocyte (red)-derived cells were not overlapping with endothelial cells (green). Scale bars = 20 μm. (e) Statistical analysis of numbers of telocytes comparing homeostasis (n = 3) and periodontitis (n = 4). (f) Telocytes (CD34+, CD31-) express a proliferation marker, Ki67 in periodontitis. CD34: yellow; CD31: cyan; Ki67: magenta; nuclei: grey. (g) 863 input genes highly expressed in telocytes cluster with avg_logFC > 0 were selected for gene enrichment analysis. The 20 best p-value terms are plotted. The bar plot is coloured by p-values. B, bone; P, periodontal tissue.
Figure 3—figure supplement 1
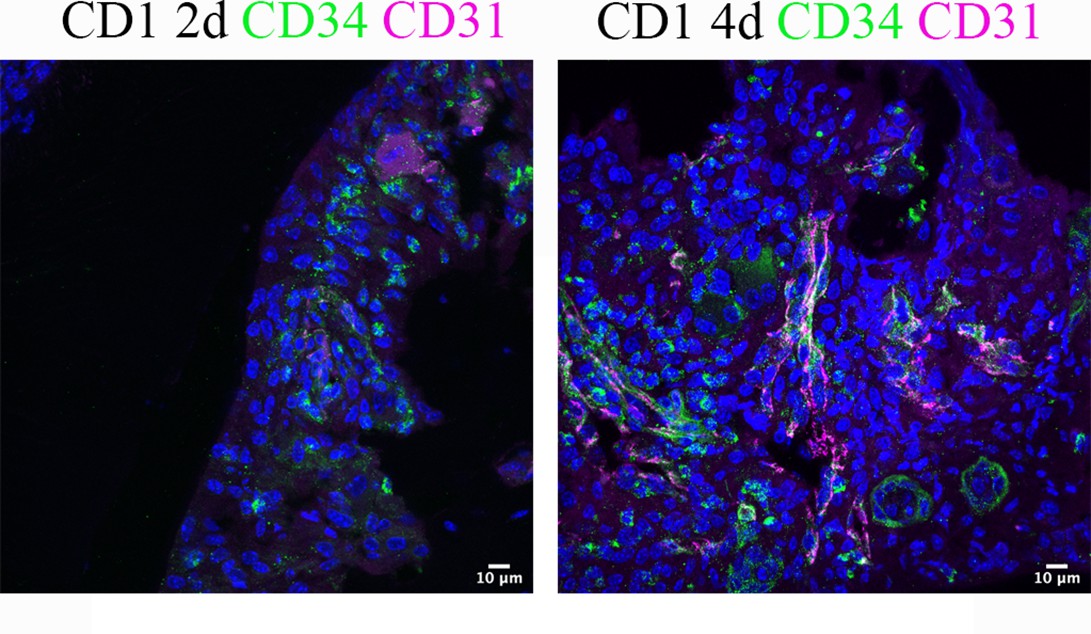
An increased number of telocytes was observed on days 2 and 4 post procedure.
Figure 3—figure supplement 2
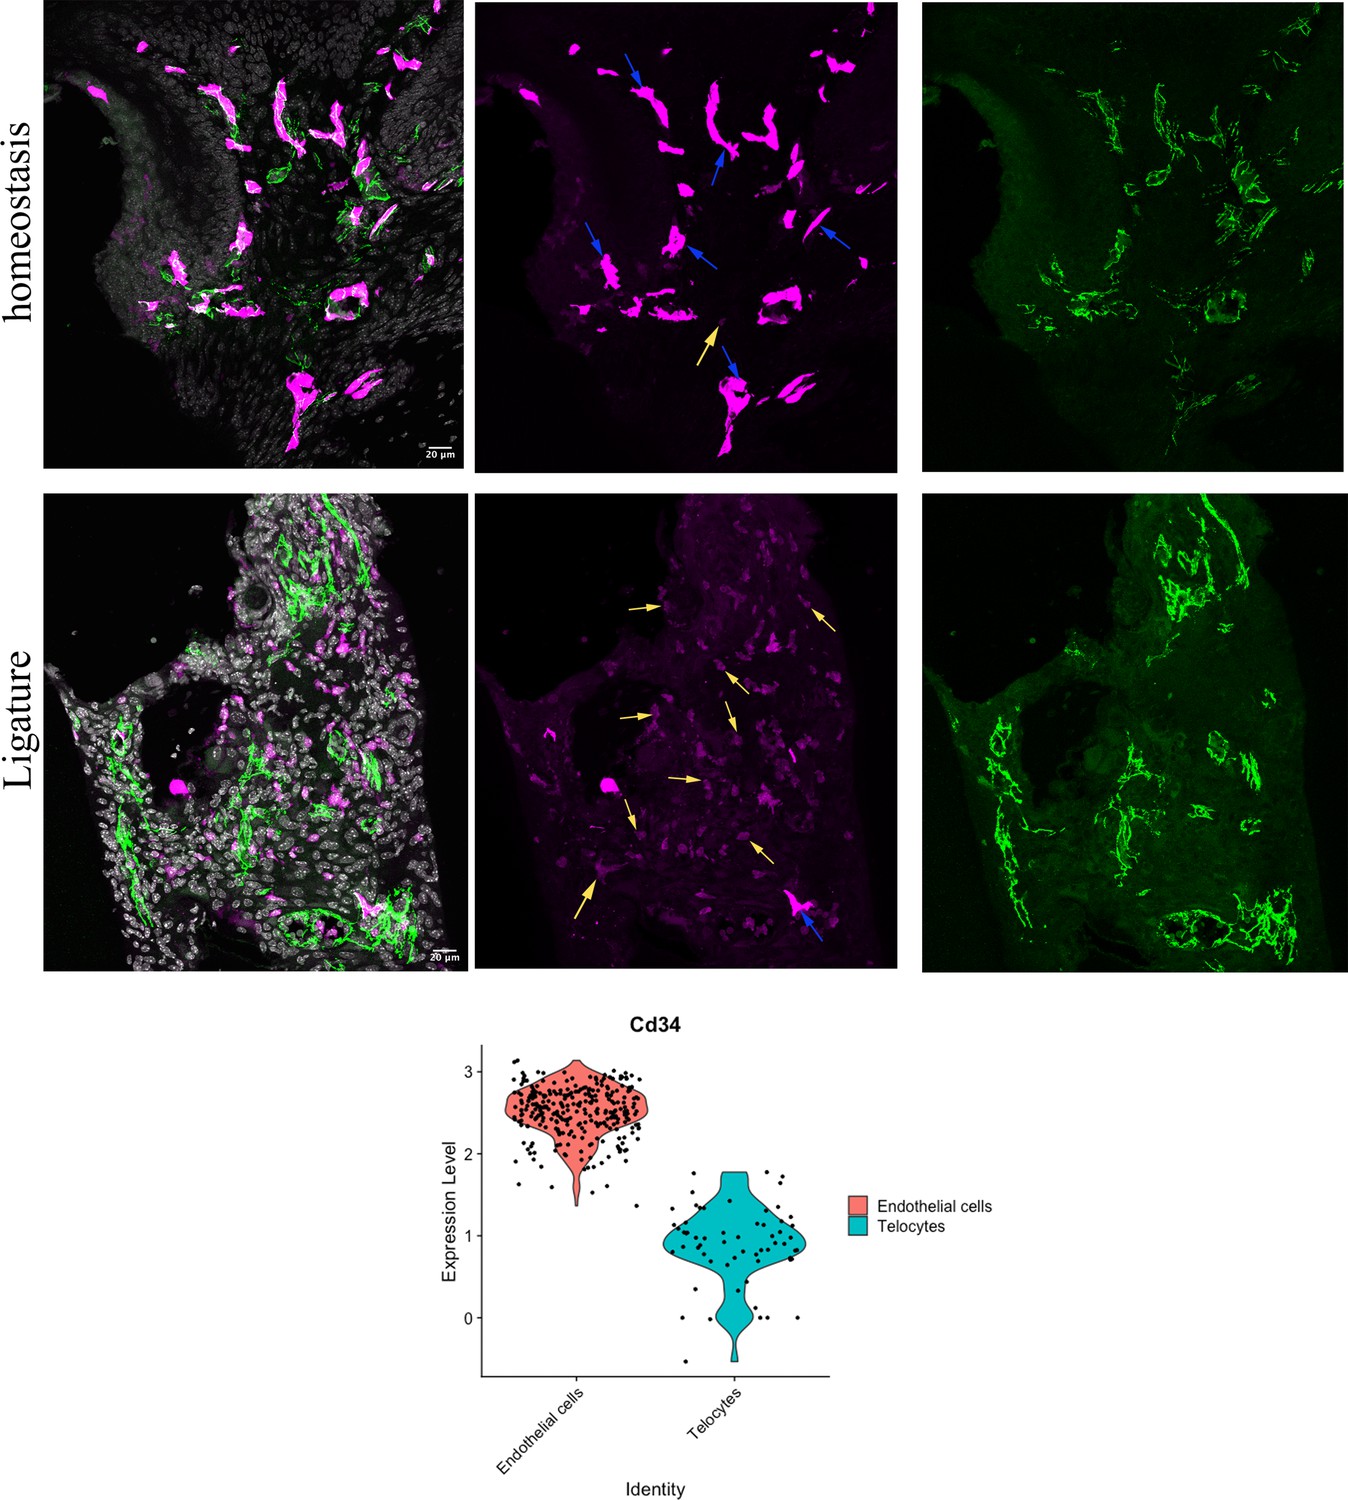
Telocytes show lower Cd34 expression compared to endothelial cells.
Figure 3d with separate channels is shown. Endothelial cells (CD34+CD31+) are indicated with blue arrows and telocytes (CD34+CD31-) are indicated with yellow arrows. Magenta: RFP; green: CD31. The expression of Cd34 was significantly lower in telocytes than in endothelial cells. Gene expression level from scRNA-seq indicates Cd34 expression level in telocytes as distinct from endothelial cells.
Figure 4
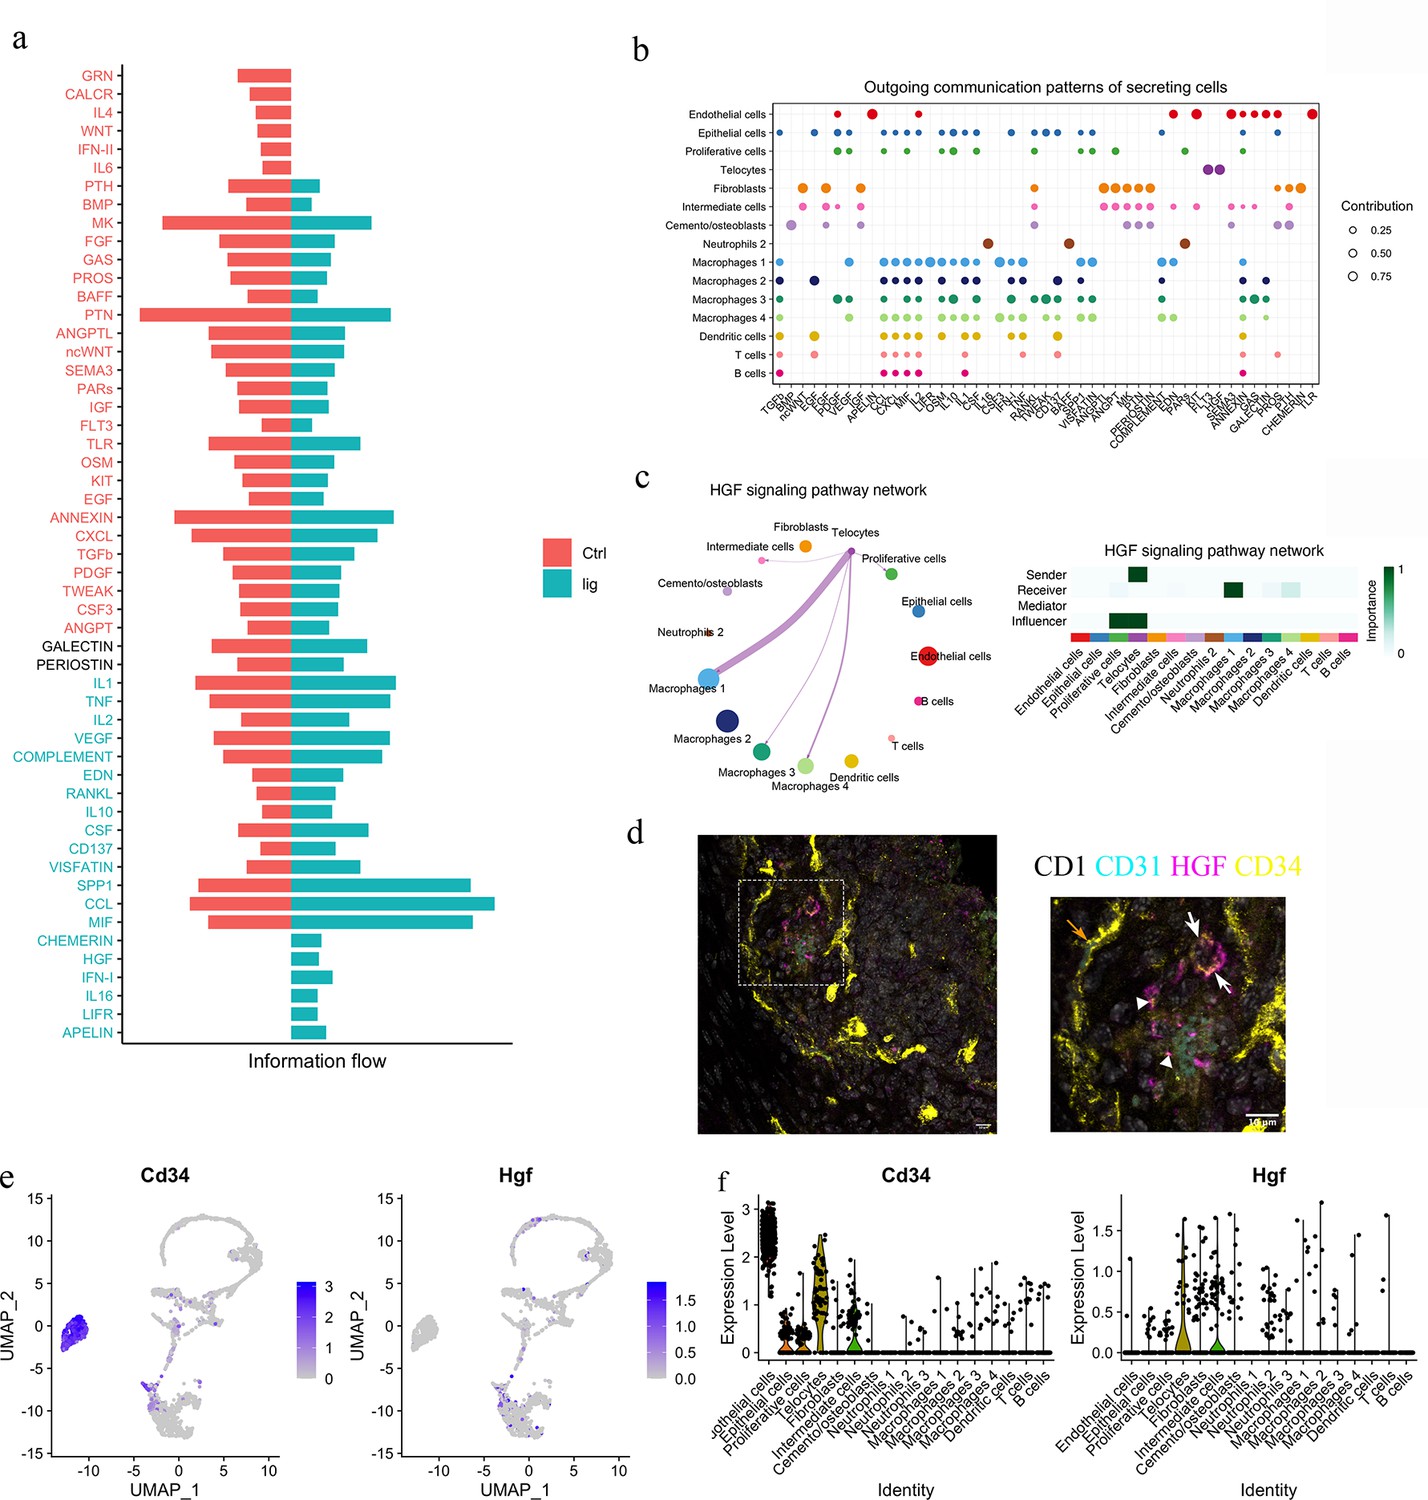
Telocytes regulate macrophages via HGF/Met signalling pathway.
(a) Comparison analysis shows HGF pathway is upregulated in periodontitis (b) Cell–cell communication analysis was performed on disease dataset based on secreted signals database. The outcoming patterns were plotted. Bubble plot suggests that telocytes send signal molecules in FLT3 and HGF signalling pathways exclusively in periodontitis (dark purple dots). (c) Circle plot and heatmap suggest telocytes send HGF signals to macrophage clusters 1, 3, and 4 in periodontitis. (d) Immunostaining on CD1 mice periodontitis tissue for CD34+/CD31- cells indicates telocytes (white arrows) and CD34+/CD31+ cells for endothelial cells (orange arrow) from CD1 mice. The typical morphology of telocytes, podoms are denoted with arrowheads. The telocytes were expressing HGF (magenta). Scale bars = 10 μm. (e) Expression of CD34 (marker of telocyte) and Hgf were both found in the telocyte cluster and some cells in the intermediate cell cluster. (f) CD34 is expressed in endothelial cells and telocytes, and Hgf is expressed in telocytes but not endothelial cells and some intermediate cells that are close to telocytes.
Figure 5 with 1 supplement
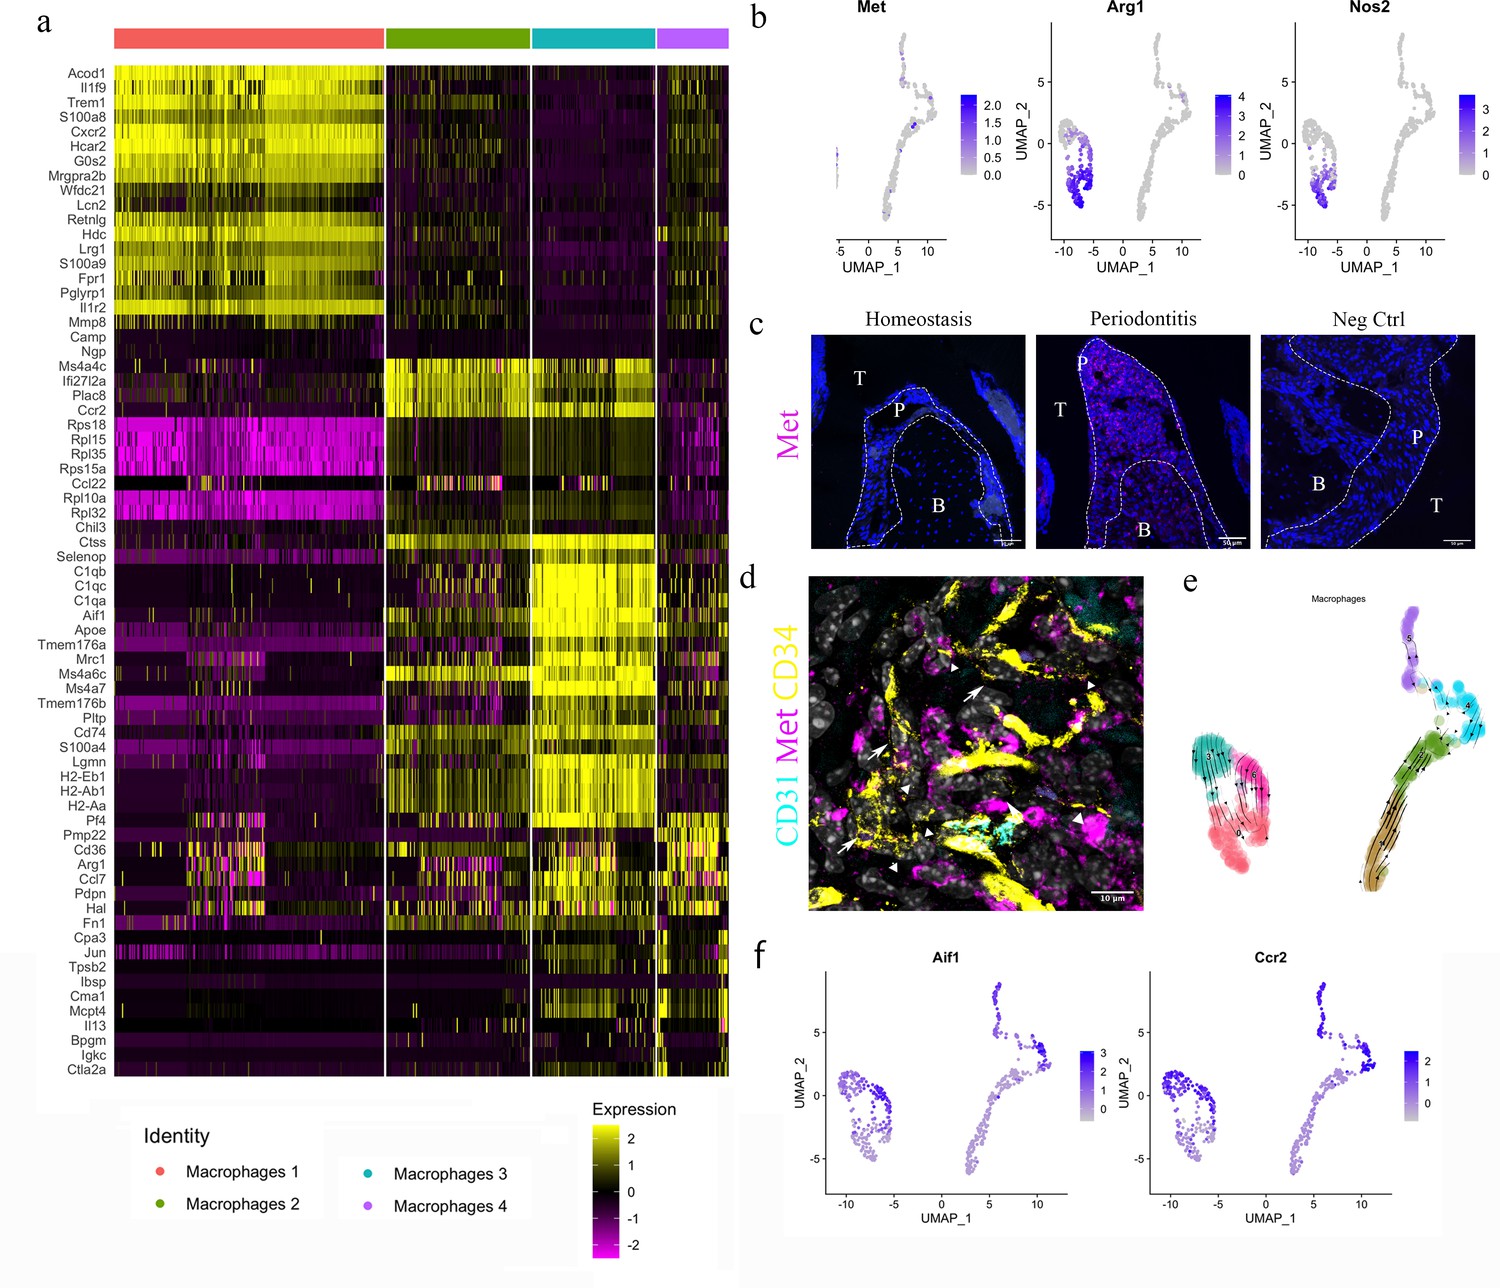
HGF/Met signalling drives M1 to M2 transition.
(a) Heatmap presenting the differentially expressed gene (DEG) of four macrophage subpopulations (top 20 DEG genes). (b) Macrophages were extracted from the complete dataset and re-clustered. In a feature plot, all the macrophages in disease dataset are in the left cell cluster, separated from macrophages in homeostasis (cells on the right). Feature plots show Met-expressing macrophages express M1 marker Nos2 and M2 marker Arg1. (c) Met protein was not detected in periodontal ligament (PDL) homeostasis but in periodontitis. Met: magenta; nuclei: blue. Scale bars = 50 μm. (d) Telocytes (yellow, indicated by arrows) are making contact with Met-expressing cells (magenta) by using their protrusions (telopodes indicated by arrowheads). CD34: yellow; CD31: cyan; Met: magenta; nuclei: grey. Scale bar = 10 μm. (e) RNA velocity shows Met+ macrophages (cluster 0) are related to those in clusters 3 and 6. (f) Macrophages expressing Met (cluster 0) are related to those in cluster 6 (Ccr2+Aif1hi) and cluster 3 (Ccr2+ Aif1lo) macrophages.
Figure 5—figure supplement 1
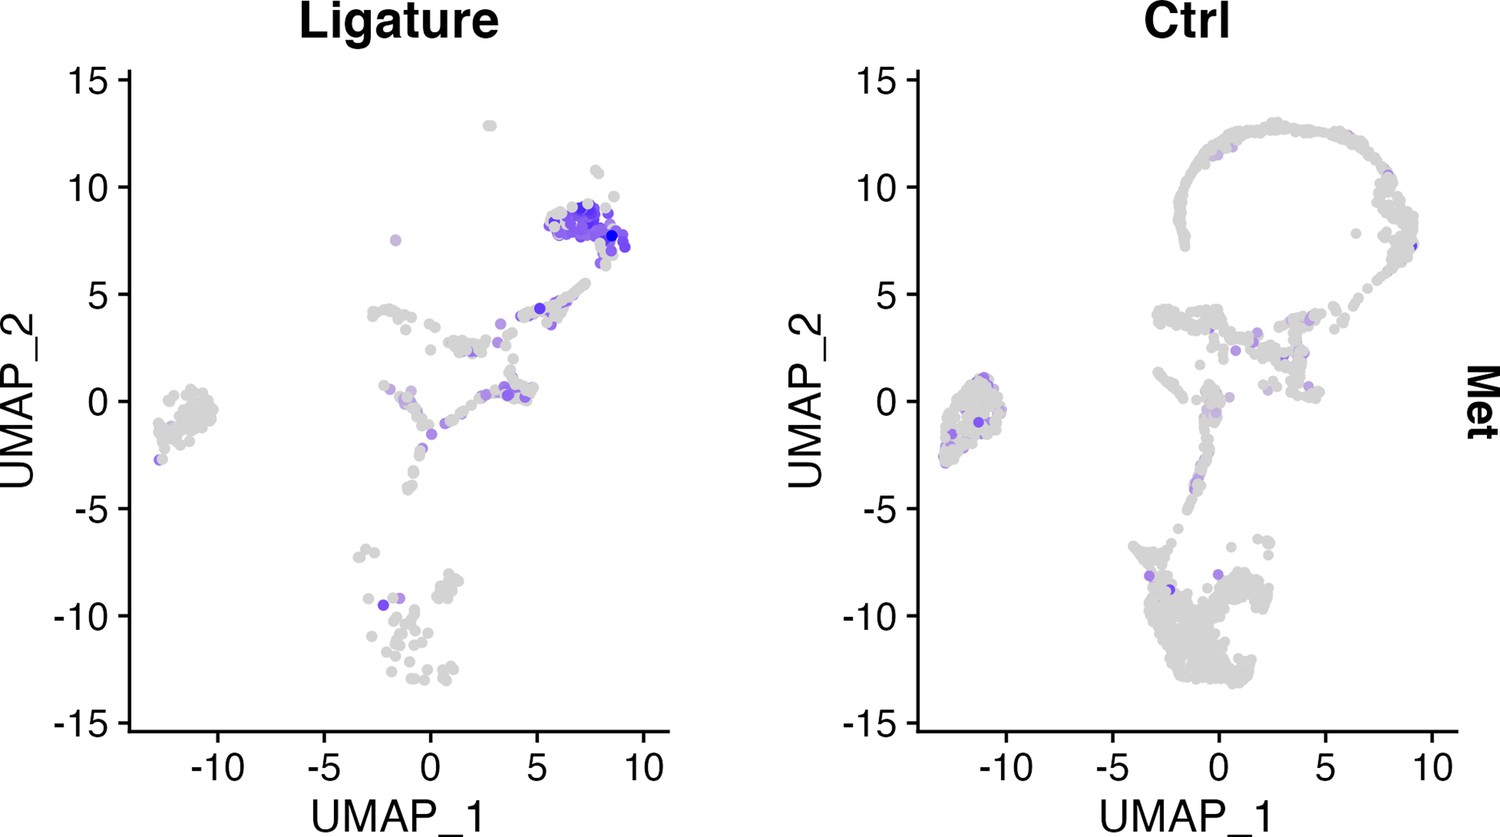
Met expression in homeostasis and periodontitis.
Figure 6 with 1 supplement
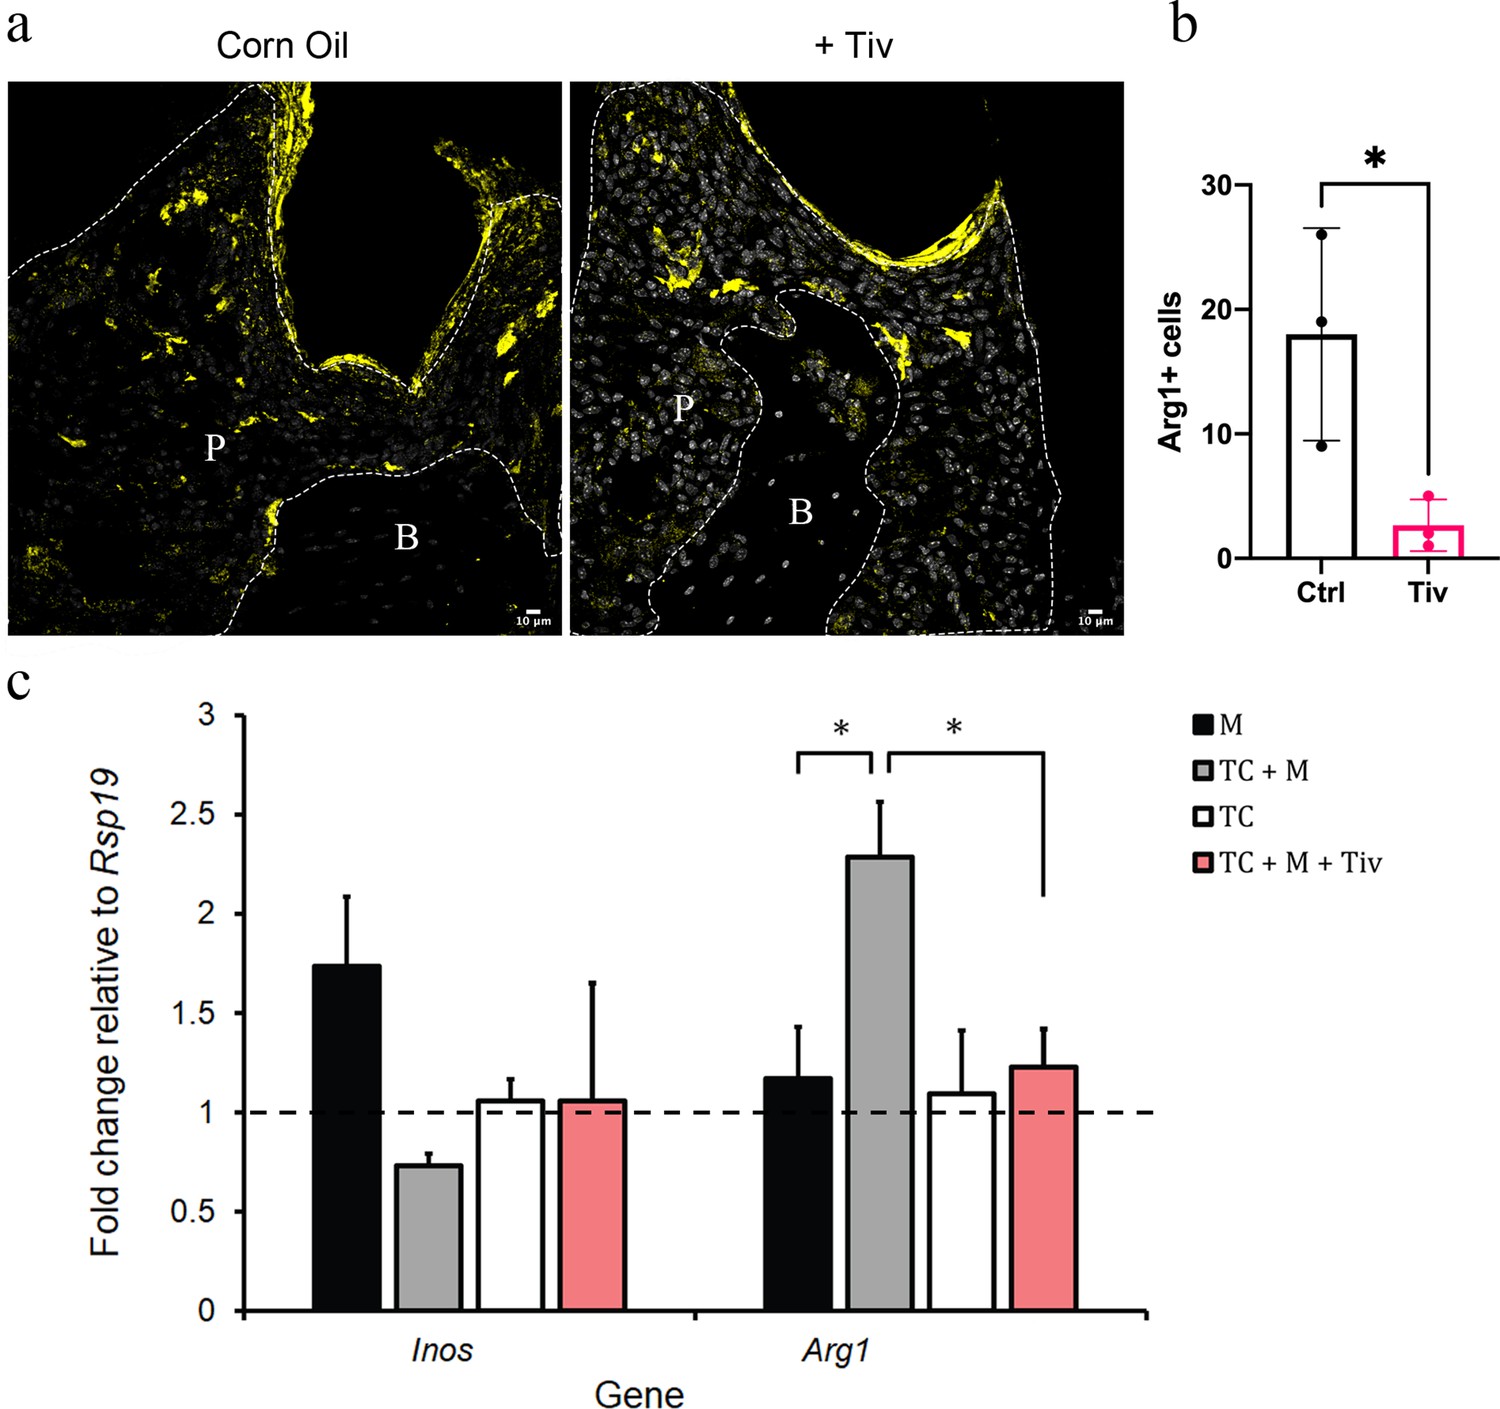
Telocytes promote M1 to M2 transition via HGF/Met signalling.
(a) CD1 mice were used to induce periodontitis. Corn oil or tivantinib (Tiv) were given once on day 5 post procedure. Samples were collected 12 hr after drug delivery. Mice given corn oil (left) show more cells expressing Arg1+ cells (yellow) in periodontium than the mice given tivantinib (right). Scale bars = 10 μm. (b) Statistical analysis shows significant difference in Arg1 expression between control group (corn oil) and tivantinib-treated group (p<0.05). (c) qPCR data showing FAC-sorted telocytes (TC) cultured with M0/1 macrophages (M) in the presence of LPS leads to an increase in the M2 marker Arg1, with simultaneous reduction in the M1 marker Inos. Transition of M1 to M2 is significantly reduced upon addition of the HGF/Met inhibitor tivantinib. Error bars represent the standard error of mean (p<0.05). B, bone; T, tooth; P, periodontal tissue.
Figure 6—figure supplement 1
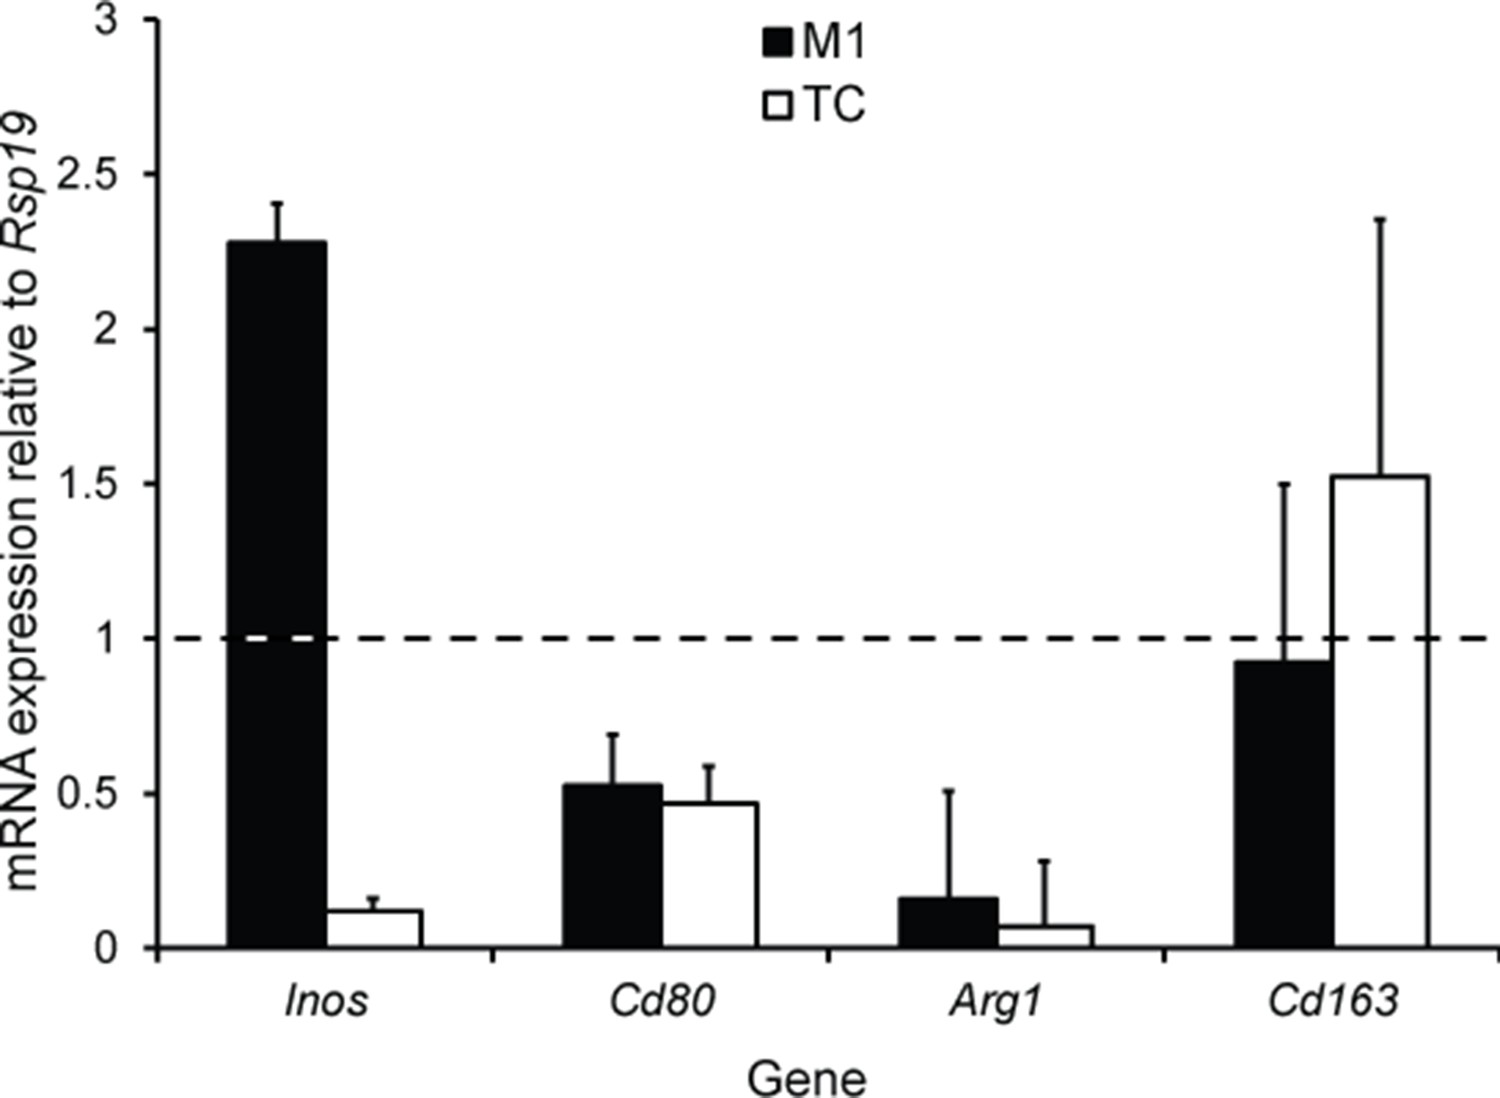
Macrophage polarisation marker gene expression in cultured M1 macrophages and FAC-sorted telocytes.
Author response image 1
Author response image 2
Additional files
Download links
A two-part list of links to download the article, or parts of the article, in various formats.
Downloads (link to download the article as PDF)
Open citations (links to open the citations from this article in various online reference manager services)
Cite this article (links to download the citations from this article in formats compatible with various reference manager tools)
Telocytes regulate macrophages in periodontal disease
eLife 11:e72128.
https://doi.org/10.7554/eLife.72128


