Age-associated changes to neuronal dynamics involve a disruption of excitatory/inhibitory balance in C. elegans
- Graduate Program for Neuroscience, Department of Physiology and Biophysics, Boston University, United States
- Department of Neurobiology, University of Massachusetts Medical School, United States
- University of Massachusetts Medical School, United States
- Department of Anesthesiology, Perioperative and Pain Medicine, Brigham and Women's Hospital, United States
- Research Associate Professor of Physiology and Biophysics, Boston University School of Medicine, United States
- Department of Physiology and Biophysics, Neurophotonics Center, Boston University School of Medicine, United States
Figures
Figure 1 with 1 supplement
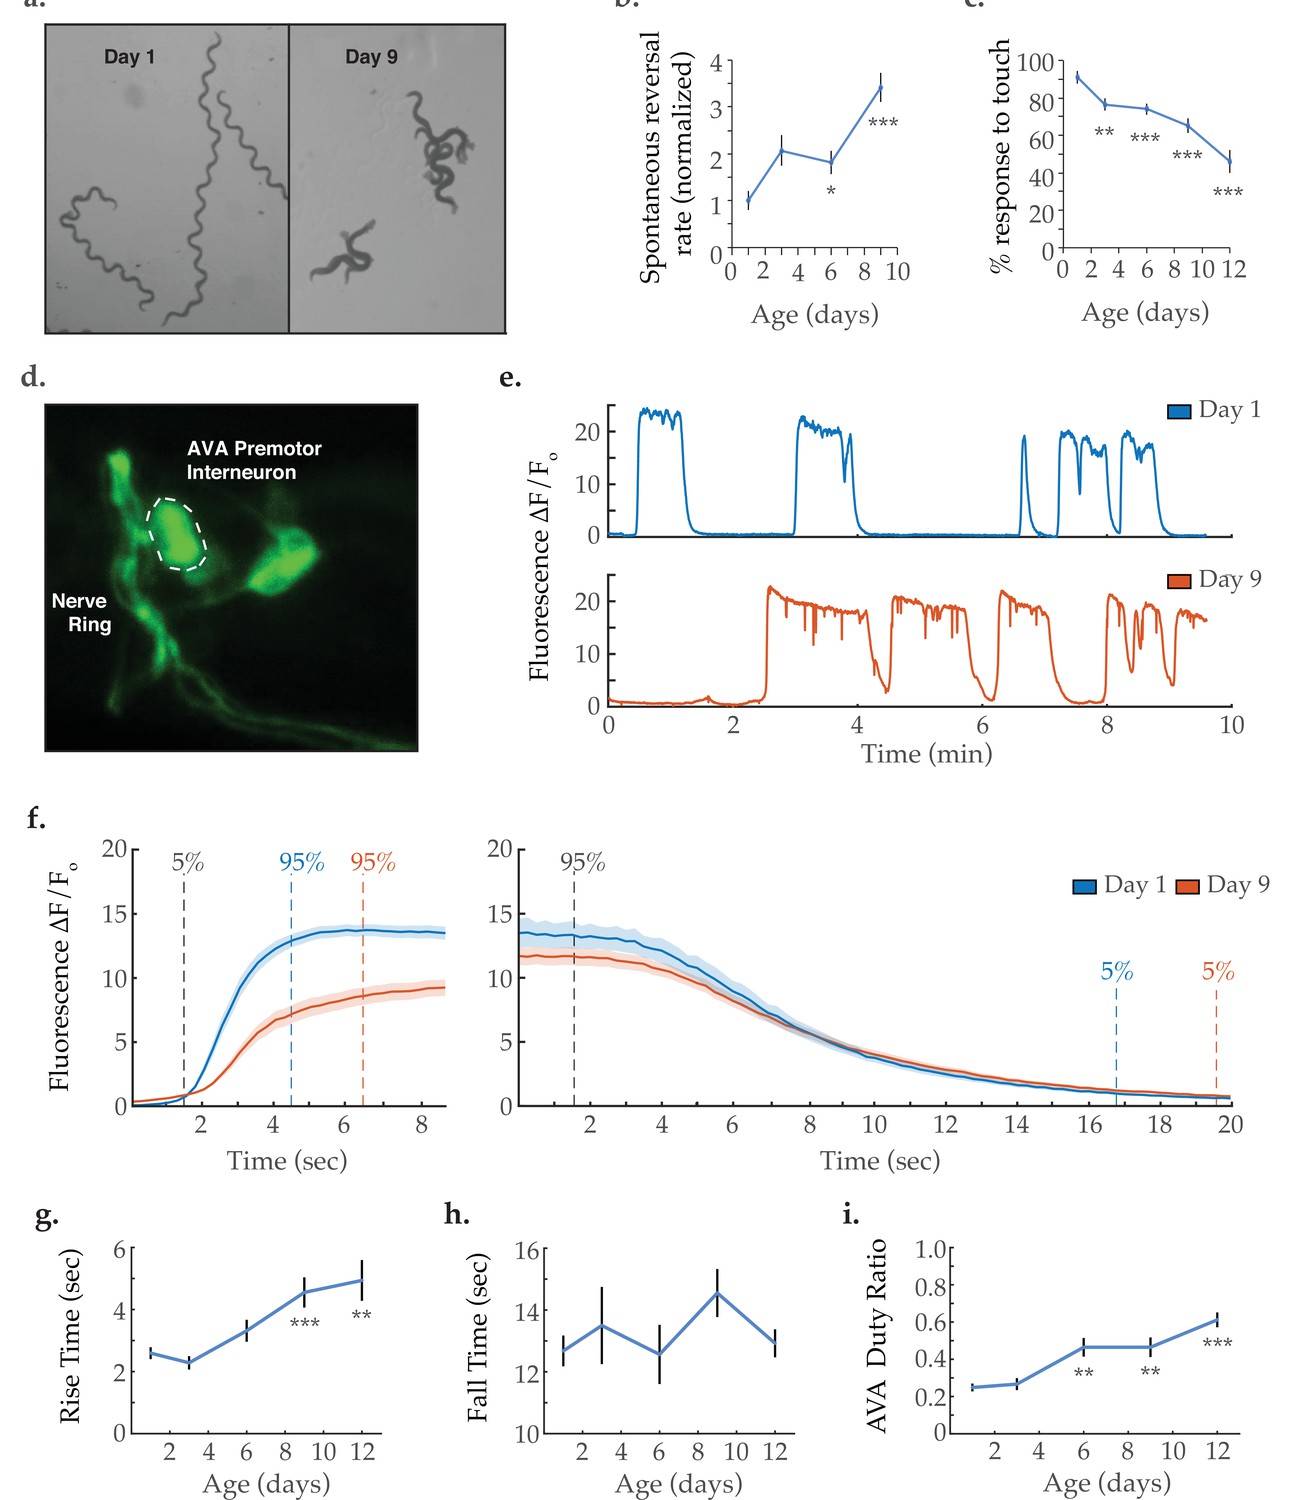
Activity dynamics of the AVA command interneuron with age.
(a) Travel paths of two and three Caenorhabditis elegans, respectively, on day 1 and day 9 of adulthood (over 30 s). (b) Spontaneous reversal rates of adult QW1574 strain worms of various ages, normalized to day 1 frequency. (For days 1, 3, 6, and 9, n=9, 18, 22, and 14 animals, respectively). (c) Anterior touch responsiveness in adult QW1574 strain worms of various ages. Responsiveness denotes how often an eyelash drawn across the anterior portion of an animal’s body elicited a reversal (see Materials and methods). (For days 1, 3, 6, 9, and 12, n=20, 44, 53, 53, and 33 animals, respectively). (d) Transgenic expression of the calcium-sensitive green fluorescent protein GCaMP6s in the command interneuron AVA. (e) GCaMP calcium transients measured from the AVA interneuron in immobilized animals at days 1 and 9 of adulthood. (f) Average AVA GCaMP fluorescence transient onsets and offsets in day 1 and day 9 worms (shaded areas delineate the standard error of the mean). For day 1 and day 9 onsets, n=37 and 38 traces from 20 and 16 animals, respectively. For day 1 and day 9 offsets, n=33 and 32 from 19 and 14 animals, respectively. (g, h) The average rise time (i.e. transient time from an ‘ON’ transition from 5 to 95% of maximum fluorescence) and average fall time (95–5%) of AVA GCaMP fluorescence transients at various ages. For days 1, 3, 6, 9, and 12 onsets, n=37, 34, 36, 38, and 43 traces from 20, 13, 13, 16, and 14 animals, respectively. For days 1, 3, 6, 9, and 12 offsets, n=33, 24, 28, 32, and 29 traces from 20, 11,11, 14, and 13 animals, respectively. (i) Duty ratio of AVA fluorescence, defined as the proportion of time that AVA is active versus inactive (see Materials and methods). For days 1, 3, 6, 9, and 12, n=21, 13, 13, 12, and 16 animals, respectively. Error bars denote standard error of the mean. *p<0.05; ** p<0.01; *** p<0.001, Sidak post hoc test.
-
Figure 1—source data 1
C. elegans reversal behavior and anterior mechanosensation with age.
- https://cdn.elifesciences.org/articles/72135/elife-72135-fig1-data1-v2.xlsx
-
Figure 1—source data 2
AVA interneuron activity state transition dynamics with age.
- https://cdn.elifesciences.org/articles/72135/elife-72135-fig1-data2-v2.xlsx
-
Figure 1—source data 3
AVA interneuron calcium transient frequency, duration, and duty ratio with age.
- https://cdn.elifesciences.org/articles/72135/elife-72135-fig1-data3-v2.xlsx
Figure 1—figure supplement 1
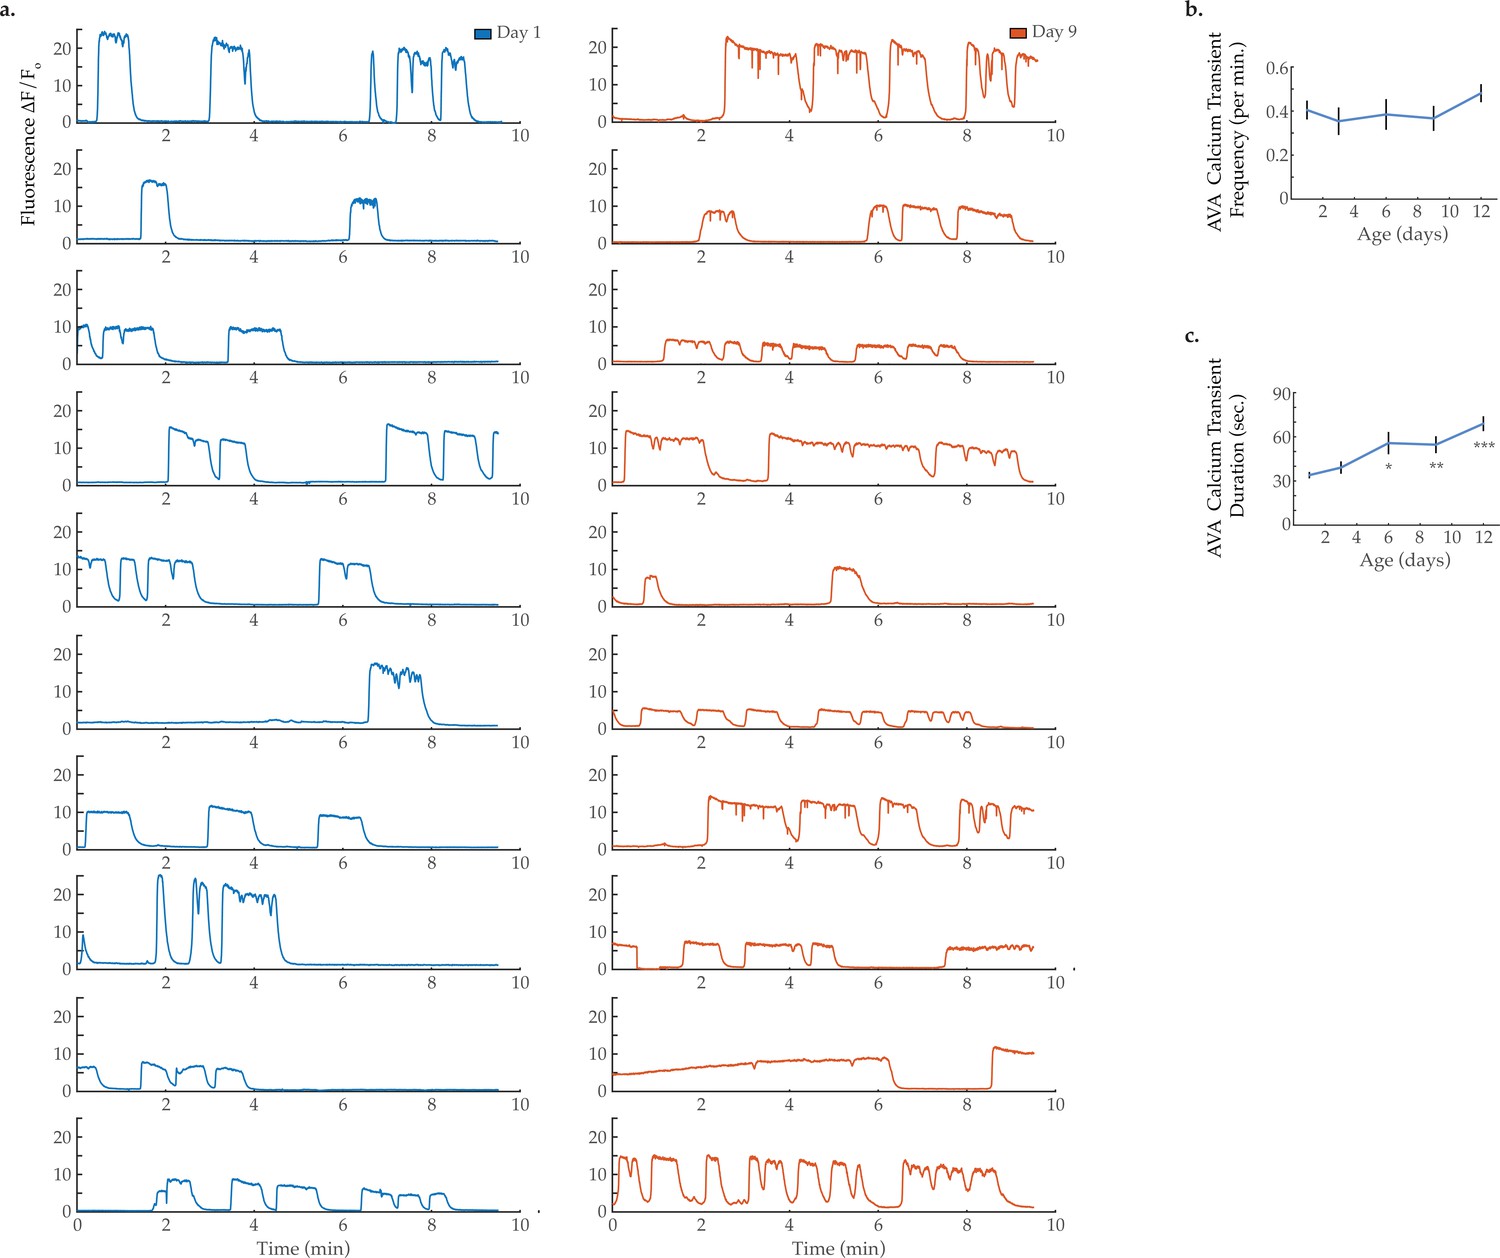
AVA calcium transient frequency and duration.
(a) GCaMP calcium transients measured from the AVA interneuron in immobilized animals at day 1 and day 9 of adulthood. GCaMP calcium transient (b) frequency and (c) duration in the AVA interneuron. For days 1, 3, 6, 9, and 12 onsets, n=21, 13, 13, 12, and 16 animals, respectively. Error bars denote standard error of the mean. *p<0.05; ** p<0.01; *** p<0.001, Sidak post hoc test.
Figure 2 with 2 supplements

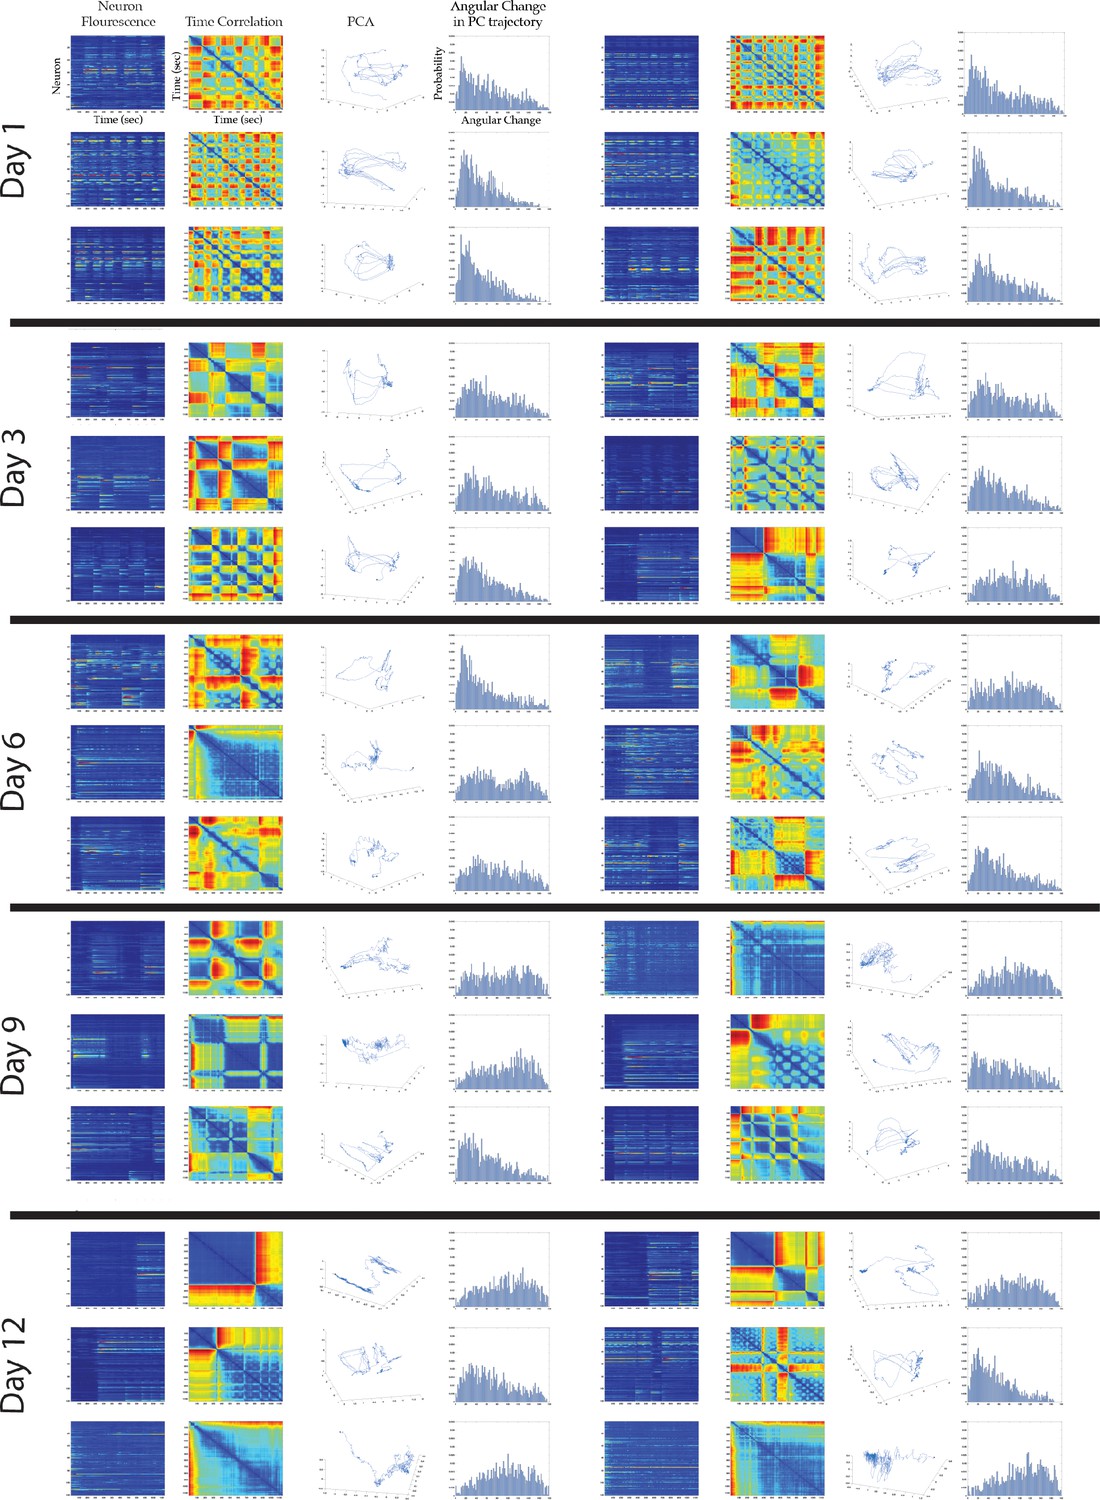
Breakdown of system dynamics and state organization with age.
(a) Example traces of 120-neuron GCaMP fluorescence measurements, captured in the head region of a day 1 young adult and a day 9 senescent worm (blue and red represent scaled low and high fluorescence, respectively, following ΔF/F0 normalization). Green and black arrows in the top panel highlight examples of highly correlated and anti-correlated neuron pairs, respectively. (b) Time correlation heatmaps derived of the fluorescence measurements in A. The relative distance in activity space is calculated between every pair of time points in the trial (see Materials and methods) indicated by color (blue indicates zero, red indicates maximal distance). (c) Three-dimensional plots displaying the trajectories of the first three principal components derived from fluorescence measurements in A. Top insets are probability histograms of the angular directional changes for those principal component trajectories (see Materials and methods). Bottom insets display the values of each of the first three principal components over time (d) Aggregate probability histograms of the angular directional changes in principal component trajectories for all animals measured at various ages. (e) Pareto plot with bars displaying the average variance explained by the first five principal components for each age group and lines displaying the cumulative total. (For D–E, n=20, 10, 10, 20, 10 animals for days 1, 3, 6, 9, and 12, respectively). Error bars denote standard error of the mean. *p<0.05; ** p<0.01; *** p<0.001, Sidak post hoc test.
-
Figure 2—source data 1
Multi-neuron activity variance explained by principal components 1–5.
- https://cdn.elifesciences.org/articles/72135/elife-72135-fig2-data1-v2.xlsx
-
Figure 2—source data 2
GCaMP signal-to-noise ratio with age.
- https://cdn.elifesciences.org/articles/72135/elife-72135-fig2-data2-v2.xlsx
-
Figure 2—source data 3
Tissue autofluorescence among head region neurons.
- https://cdn.elifesciences.org/articles/72135/elife-72135-fig2-data3-v2.xlsx
Figure 2—figure supplement 1

Signal-to-noise ratios of multi-neuronal GCaMP fluorescence measurements, tissue autofluorescence, and GCaMP intensities with age.
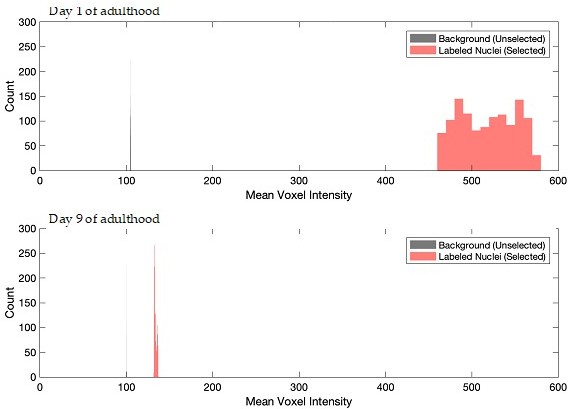
(a) Results show no significant decrease in the mean measured signal-to-noise ratio averages of neuronal GCaMP fluorescence, comparing day 1 to all other ages (days 3, 6, 9, 12 of adulthood). N=120 neurons from 10 animals, for each age group, Sidak post hoc test. (b) Results show no significant change in green channel tissue autofluorescence among head region neurons, comparing day 1 to day 9. N=120 neurons from 10 animals, for each age group, Student’s t-test. (c) Histogram shows a decrease in measured GCaMP fluorescence intensities among head region neurons, comparing day 1 to day 9. N=120 neurons from 20 animals, for each age group. Error bars denote standard error of the mean. *p<0.05; ** p<0.01; *** p<0.001.
Figure 2—figure supplement 2
Multi-neuron activity from individual worms with age.
From left to right column: Example traces of 120-neuron GCaMP fluorescence measurements, captured in the head region of individual adult worms at various ages (blue and red represent low and high fluorescence, respectively, following ΔF/F0 normalization). Time correlation heatmaps derived of the fluorescence measurements in the 120-neuron GCaMP arrays, where the relative distance in activity space is calculated between every time point (see Statistical Methods; blue represents two time points with very similar neuronal activity patterns while red indicates significantly different neuronal activity patterns). Three-dimensional plots displaying the trajectories of the first three principal components derived from fluorescence measurements in the 120-neuron GCaMP arrays. Probability histograms of the angular directional changes for those principal component trajectories (see Statistical Methods; histograms highly skewed toward low angular changes reflect plots with smooth trajectories over time, whereas histograms with a broader distribution of angular changes reflect plots with erratic trajectories).
Figure 3 with 4 supplements
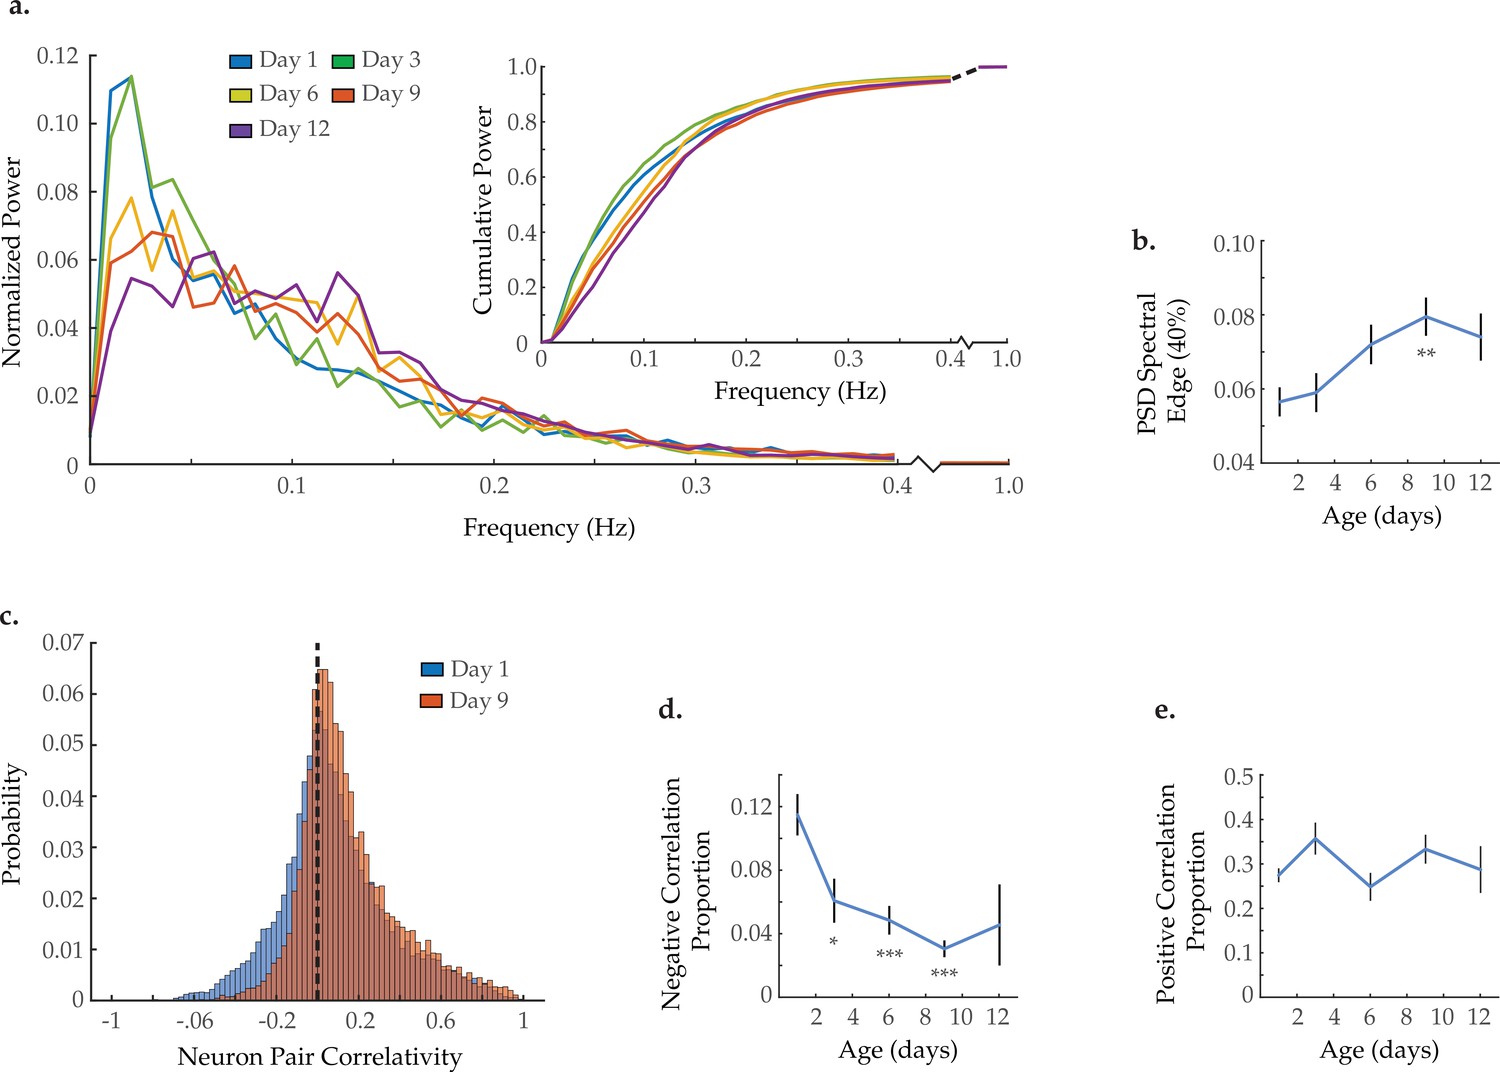
Neuron activity dynamics and correlation with age.
(a) Mean power spectral densities (PSDs) derived from the fluorescence traces of individual neurons measured at various ages. Inset: cumulative PSD plots, display the proportion of power residing below a given frequency. Standard error of the mean for both PSD and cumulative power plots is displayed in Figure 3—figure supplement 1. (b) Mean 40% spectral edges across neuron PSDs at various ages, denoting the average frequency below which resides 40% of the total spectral power. For A and B, n=120 neurons per animal with 20, 10, 10, 20, and 10 animals for days 1, 3, 6, 9, and 12, respectively. (c) Aggregate probability histograms of neuron pair correlativity among the 40 most dynamically active neurons, in worms at days 1 and 9 of adulthood (see Materials and methods). (d) The negative correlation proportion, denoting the measured proportion of strongly negative neuron pair correlativity values (<−0.2). (e) The positive correlation proportion, denoting the measured proportion of strongly positive neuron pair correlativity values (>0.2). For C–E, n=40 neurons per animal with 20, 10, 10, 20, and 10 animals for days 1, 3, 6, 9, and 12, respectively. Error bars denote standard error of the mean. *p<0.05; ** p<0.01; *** p<0.001, Sidak post hoc test.
-
Figure 3—source data 1
Multi-neuron frequency power distribution and activity correlativities with age.
- https://cdn.elifesciences.org/articles/72135/elife-72135-fig3-data1-v2.xlsx
-
Figure 3—source data 2
Proportion of negatively correlated neuron pairs with 120 neurons analyzed per animal.
- https://cdn.elifesciences.org/articles/72135/elife-72135-fig3-data2-v2.xlsx
-
Figure 3—source data 3
Multi-neuron frequency power distributions and proportion of negatively correlated neuron pairs in 10 and 20 min imaging trials.
- https://cdn.elifesciences.org/articles/72135/elife-72135-fig3-data3-v2.xlsx
Figure 3—figure supplement 1

Power spectral density (PSD) and cumulative PSD plot error.
Mean PSDs and cumulative PSD plots derived from the fluorescence traces of individual neurons measured at days 1 and 9 of adulthood, across various genotypes. Shaded areas delineate standard error of the mean. Pairwise comparisons between ages and genotypes are displayed. n=120 neurons per animal with 17–20 animals per condition.
Figure 3—figure supplement 2
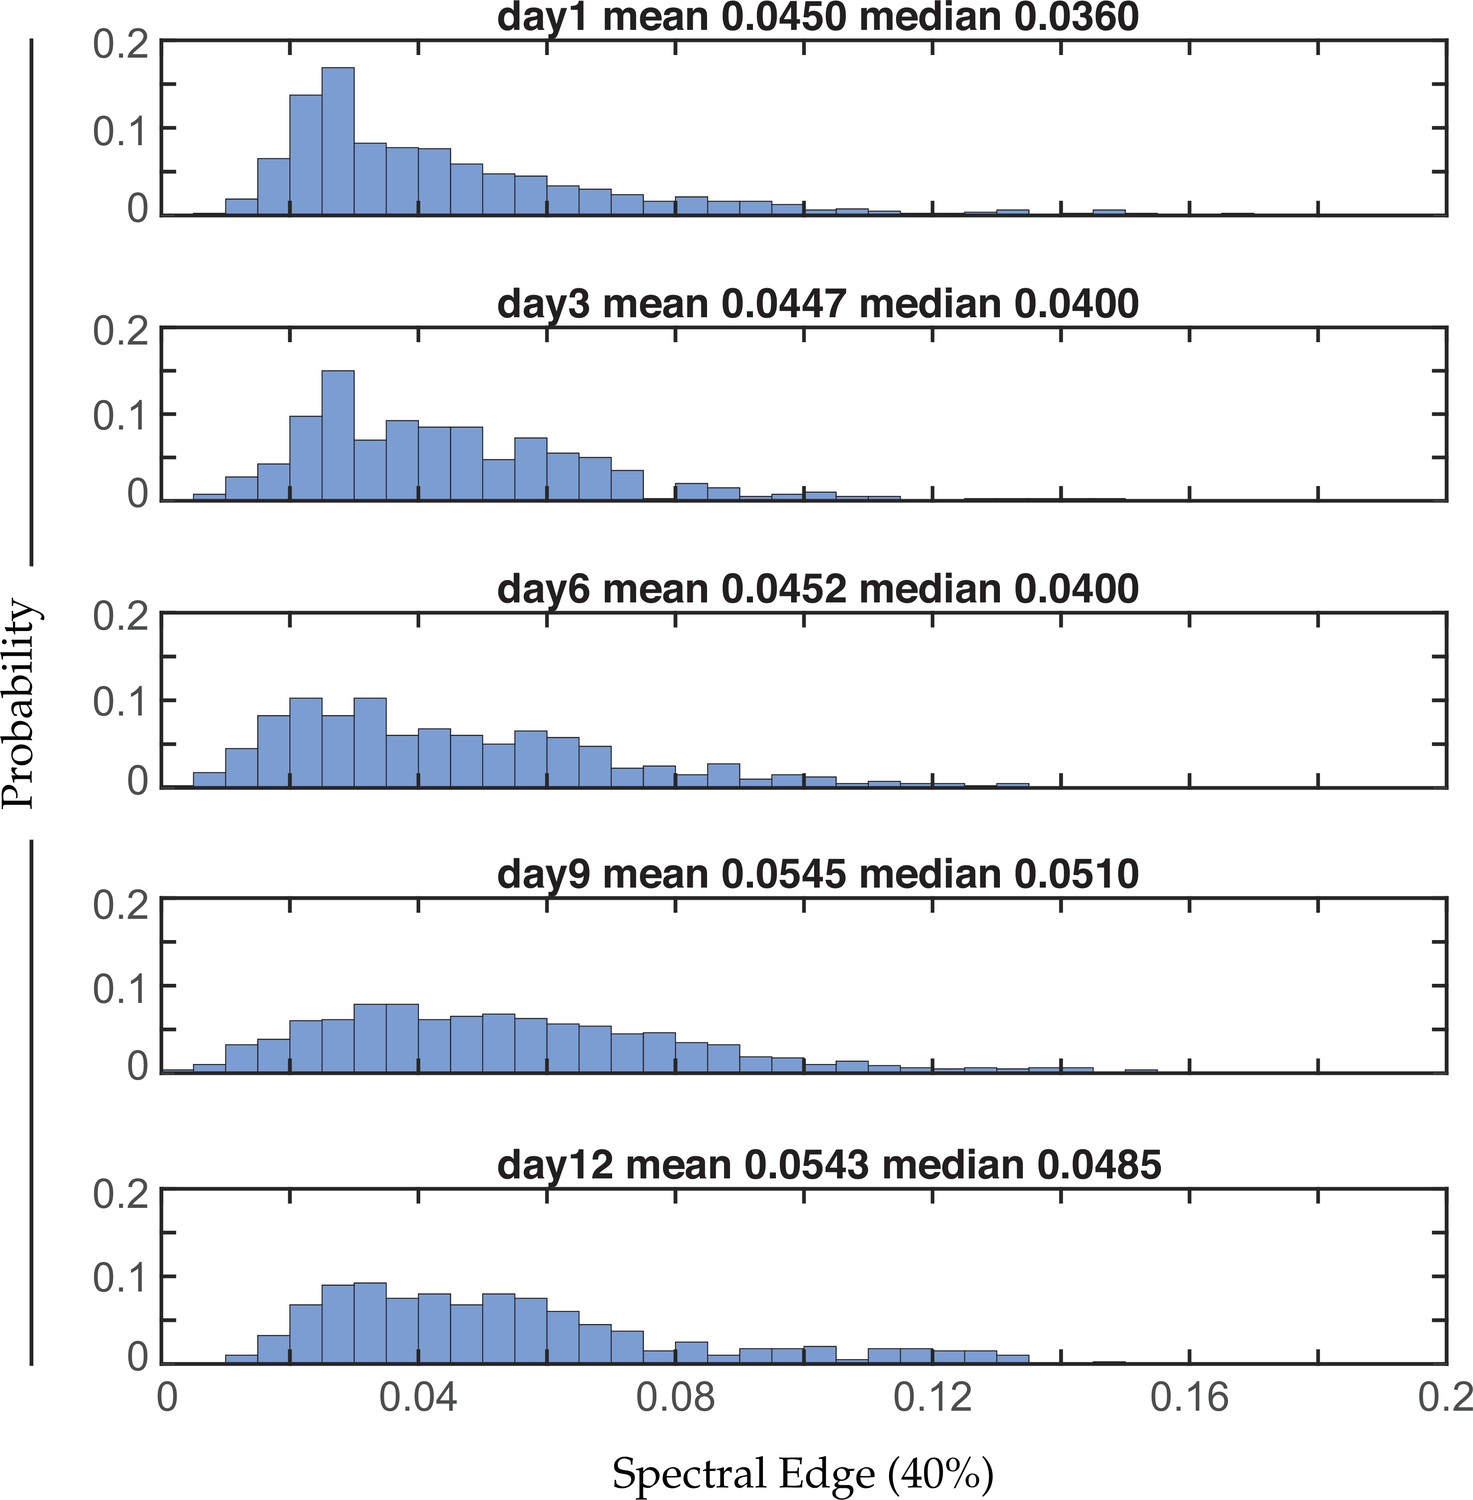
Distribution of 40% spectral edges with age.
Aggregate probability histogram of 40% spectral edges across all neurons within each age group (see Materials and methods). n=120 neurons per animal with 20, 10, 10, 20, and 10 animals for days 1, 3, 6, 9, and 12, respectively. The mean and median values of each distribution are provided.
Figure 3—figure supplement 3

Proportion of negatively correlated neuron pairs with age, when examining all 120 neurons captured per animal.
(a) Aggregate probability histogram, and (b) the negative correlation proportion, of neuron pair correlativity, in worms at days 1 and 9 of adulthood (see Materials and methods). For A and B, n=120 neurons per animal with 20 animals per condition. Error bars denote standard error of the mean. *** p<0.001, unequal variance Student’s t-test.
Figure 3—figure supplement 4

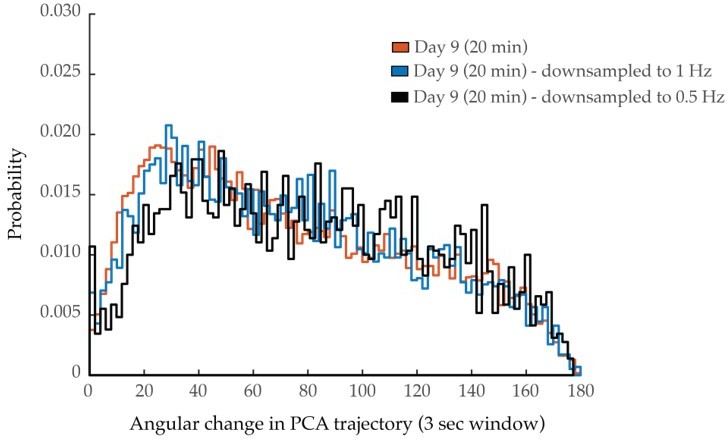
Neuron pair correlativity and system dynamics in longer imaging trials.
(a) Aggregate probability histogram, and (b) the negative correlation proportion, of neuron pair correlativity in worms at day 9 of adulthood, imaged for 10 or 20 min (see Materials and methods). For A and B, n=40 neurons per animal with 20 animals imaged for 10 min and 5 animals imaged for 20 min. (c) Mean power spectral densities (PSDs) of the neuron GCaMP fluorescence in worms at day 9 of adulthood, imaged for 10 or 20 min. Insert: cumulative PSD plots. For both PSD and cumulative power plots, shaded area denotes standard error of the mean. (d) Mean 40% spectral edges of the individual PSDs used to generate graphs in C. (e) Aggregate probability histograms of the angular directional changes in principal component trajectories in worms at day 9 of adulthood, imaged for 10 or 20 min (see Materials and methods). For C–E, n=120 neurons per animal with 20 animals imaged for 10 min and 5 animals imaged for 20 min. Error bars denote standard error of the mean. Unequal variance Student’s t-test.
Figure 4 with 1 supplement

Global neural quiescence with age.
(a) Example traces of 120-neuron GCaMP fluorescence (ΔF/F0) measurements, captured in the head region of three day 1 young adults and three day 9 senescent worms. The thick blue line represents the average normalized GCaMP fluorescence at each time point. The red bars beneath the day 9 traces demarcate time spans identified as exhibiting global neural quiescence (see Materials and methods). (b) Histograms displaying the probability distribution of the proportion of neurons quiescent during a given time point, in worms at days 1 and 9 of adulthood (see Materials and methods). (c) The proportion of time the head region neurons exhibit global quiescence, in worms at days 1, 3, 6, 9, and 12 of adulthood (see Materials and methods). For B–C, n=120 neurons per animal with 20, 10, 10, 20, and 10 animals for days 1, 3, 6, 9, and 12, respectively. Error bars denote standard error of the mean. *p<0.05; ** p<0.01; *** p<0.001, Sidak post hoc test.
-
Figure 4—source data 1
Extent of global neural quiescence with age.
- https://cdn.elifesciences.org/articles/72135/elife-72135-fig4-data1-v2.xlsx
-
Figure 4—source data 2
Impact of global neural quiescence on multi-neuron frequency power distributions and activity correlativities.
- https://cdn.elifesciences.org/articles/72135/elife-72135-fig4-data2-v2.xlsx
Figure 4—figure supplement 1
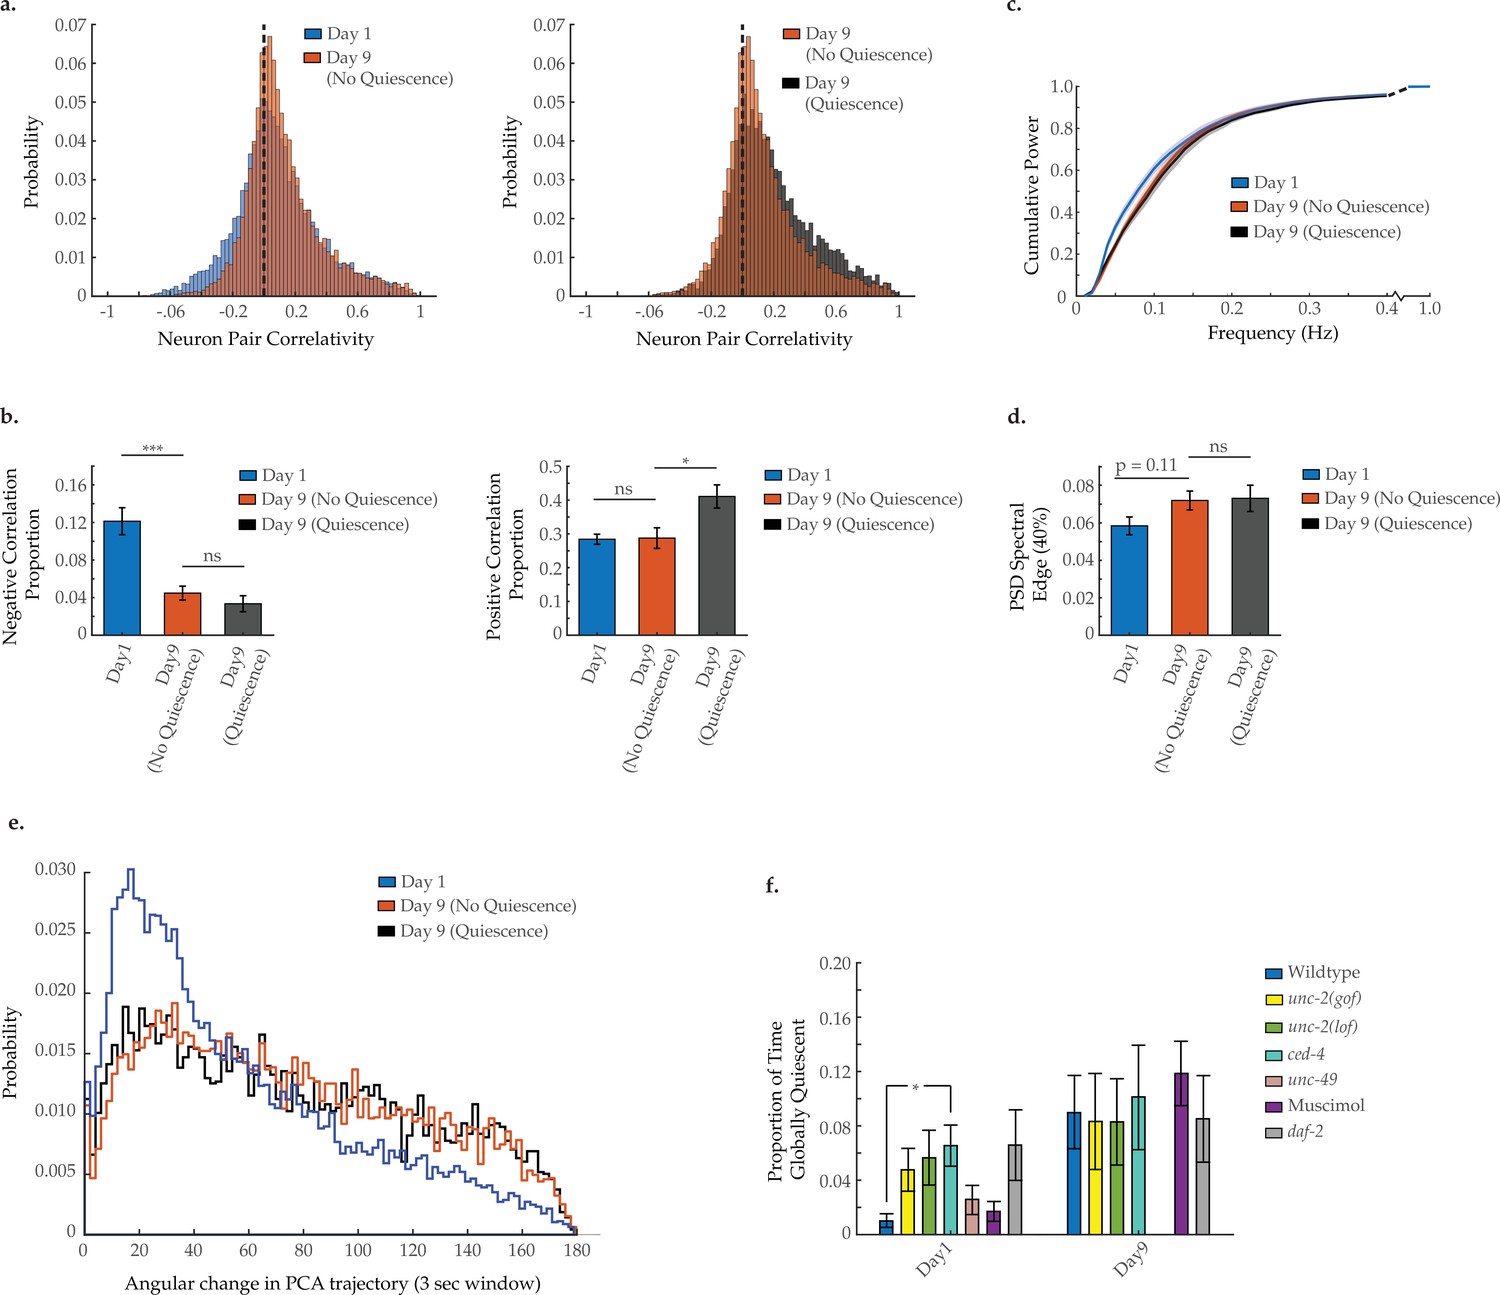
Impact of global neural quiescence on neural activity spectral power, correlation, and system dynamics in aged Caenorhabditis elegans.
(a) Aggregate probability histograms of neuron pair correlativity and (b) the negative and positive correlation proportions among the 40 most dynamically active neurons, in worms at day 1 of adulthood and at day 9 with and without neural quiescence (see Materials and methods). For A and B, n=40 neurons per animal with 18, 16, and 10 animals, respectively, for the following conditions: day 1, day 9 (no quiescence), and day 9 (quiescence). (c) Mean cumulative power spectral density (PSD) plots of the neuron GCaMP fluorescence traces in worms at day 1 of adulthood and at day 9 with and without neural quiescence (see Materials and methods). (d) Mean 40% spectral edges of the individual PSDs used to generate graph in C. (e) Aggregate probability histograms of the angular directional changes in principal component trajectories for all animals measured at various ages (see Materials and methods). For C–E, n=120 neurons per animal with 18, 16, and 10 animals, respectively, for the following conditions: day 1, day 9 (no quiescence), and day 9 (quiescence). (f) The proportion of time head region neurons exhibits global quiescence (see Materials and methods), in worms of various genetic and pharmacological conditions, at day 1 and 9 of adulthood. For F, n=120 neurons per animal with 17–20 animals per condition. Error bars denote standard error of the mean. *p<0.05; ** p<0.01; *** p<0.001, Sidak post hoc test.
Figure 5 with 2 supplements
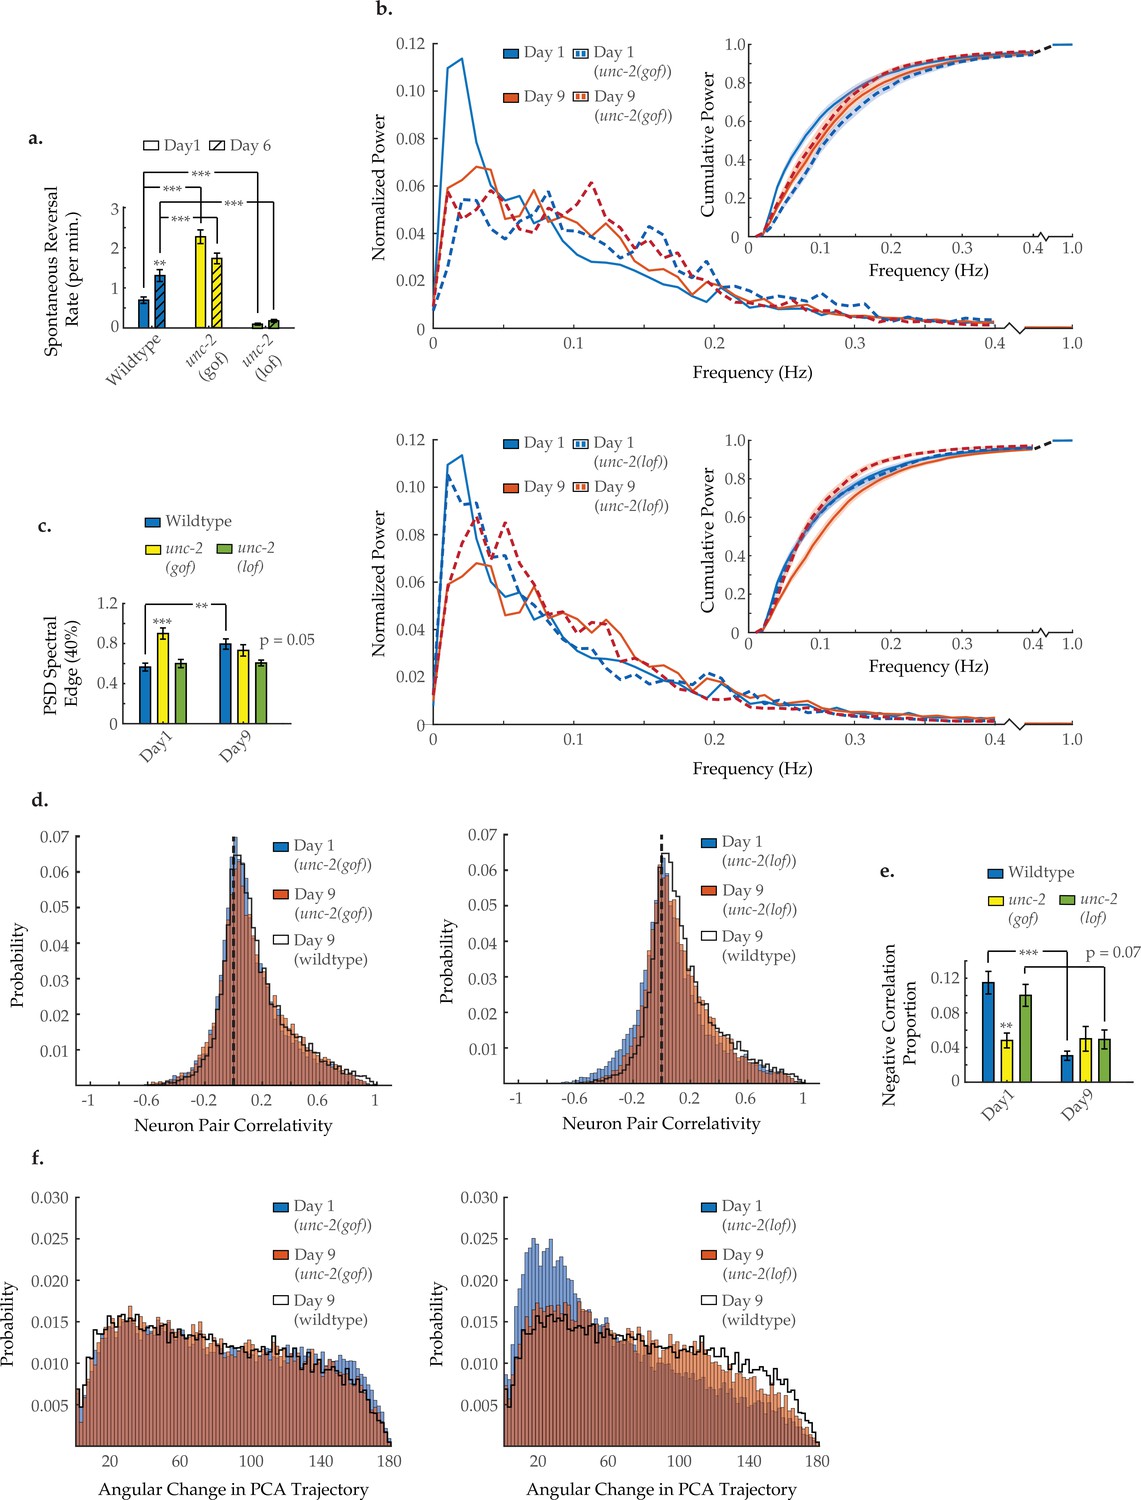
Neuron activity dynamics of unc-2 mutant animals with age.
(a) Spontaneous reversal rates of QW1217 strain worms on a wild-type, unc-2(e55) loss-of-function (lf), and unc-2(zf35) gain-of-function (gf) background, on days 1 and 6 of adulthood. On days 1 and 6, n=28 and 26 for wild-type worms, 26 and 26 for unc-2(lf) worms, and 25 and 22 for unc-2(gf) worms, respectively. (b) Mean power spectral densities (PSDs) of the neuron GCaMP fluorescence in wild-type, unc-2(lf), and unc-2(gf) worms on days 1 and 9 of adulthood. Insert: cumulative PSD plots. Standard error of the mean for both PSD and cumulative power plots is displayed in Figure 3—figure supplement 1. (c) Mean 40% spectral edges of the individual PSDs used to generate graphs in B. For B and C, n=120 neurons per animal with 17–20 animals per condition. (d) Aggregate probability histograms, and (e) the negative correlation proportion, of neuron pair correlativity among the 40 most dynamically active neurons, in wild-type, unc-2(lf), and unc-2(gf) worms on days 1 and 9 of adulthood. For D and E, n=40 neurons per animal with 17–20 animals per condition. (f) Aggregate probability histograms of the angular directional changes in principal component analysis (PCA) trajectories for wild-type, unc-2(lf), and unc-2(gf) worms on days 1 and 9 of adulthood. Each PCA trajectory was generated with 120 neurons per animal with 17–20 animals per condition. Wild-type data displayed here are the same as displayed in Figures 2 and 3. Error bars denote standard error of the mean. *p<0.05; ** p<0.01; *** p<0.001, Sidak post hoc test.
-
Figure 5—source data 1
Reversal behavior in unc-2 mutant worms.
- https://cdn.elifesciences.org/articles/72135/elife-72135-fig5-data1-v2.xlsx
-
Figure 5—source data 2
Multi-neuron frequency power distributions and proportion of negatively correlated neuron pairs in unc-2 mutants.
- https://cdn.elifesciences.org/articles/72135/elife-72135-fig5-data2-v2.xlsx
-
Figure 5—source data 3
Proportions of positively correlated neuron pairs across genotypes and drug treatments.
- https://cdn.elifesciences.org/articles/72135/elife-72135-fig5-data3-v2.xlsx
Figure 5—figure supplement 1
Multi-neuron activity from individual worms with age and genotype.
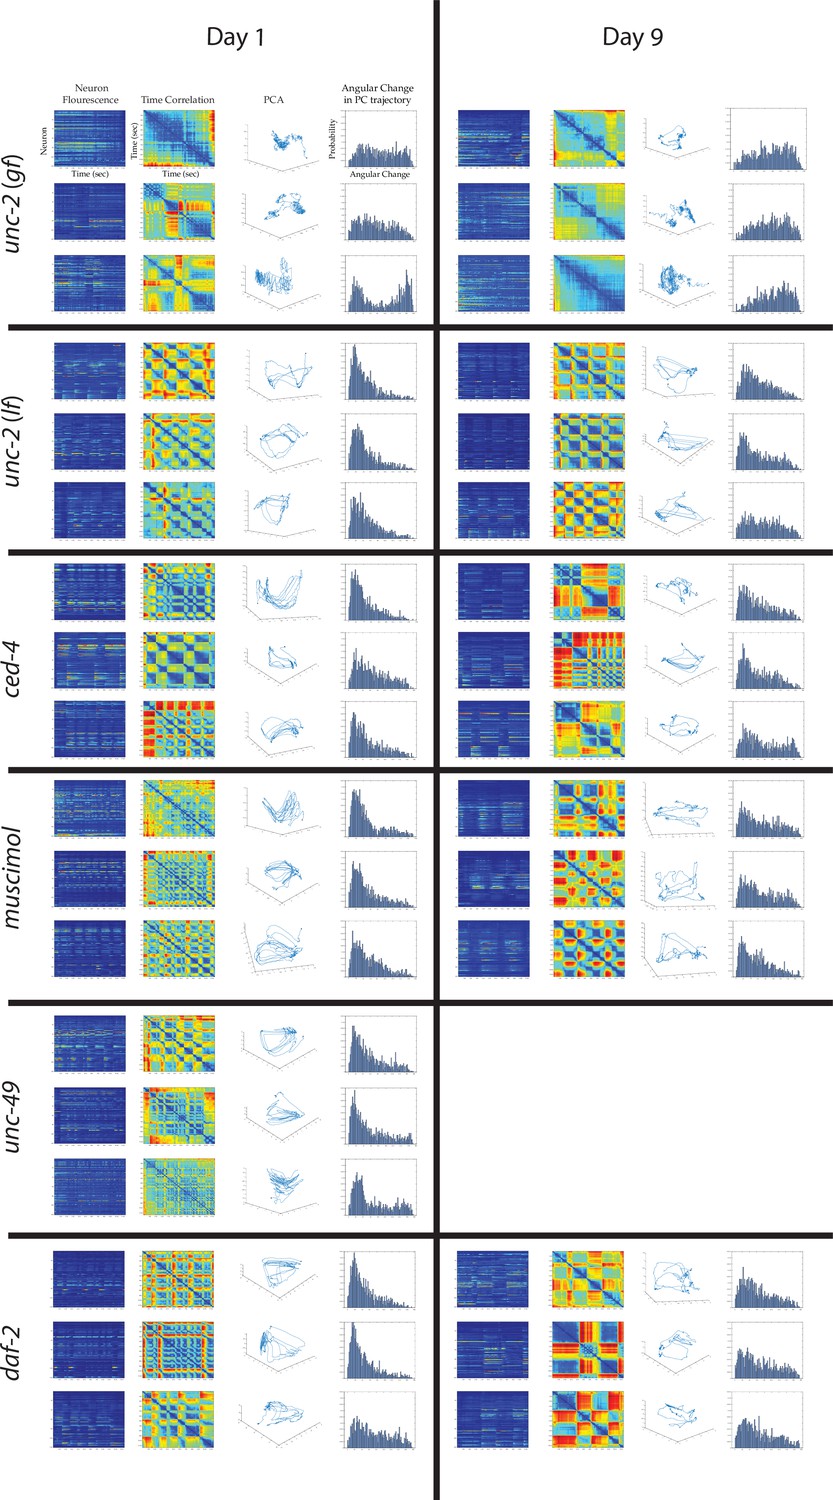
From left to right column: Example traces of 120-neuron GCaMP fluorescence measurements, captured in the head region of individual adult worms at various ages (blue and red represent low and high fluorescence, respectively, following ΔF/F0 normalization). Time correlation heatmaps derived of the fluorescence measurements in the 120-neuron GCaMP arrays, where the relative distance in activity space is calculated between every time point (see Statistical methods; blue represents two time points with very similar neuronal activity patterns while red indicates significantly different neuronal activity patterns). Three-dimensional plots displaying the trajectories of the first three principal components derived from fluorescence measurements in the 120-neuron GCaMP arrays. Probability histograms of the angular directional changes for those principal component trajectories (see Statistical methods; histograms highly skewed toward low angular changes reflect plots with smooth trajectories over time, whereas histograms with a broader distribution of angular changes reflect plots with erratic trajectories). For the following conditions, the above data is provided for three worms each at days 1 and 9 of adulthood: unc-2(zf35), unc-2(e55), ced-4(n1162), muscimol treated, unc-49(e407), daf-2(e1370).
Figure 5—figure supplement 2
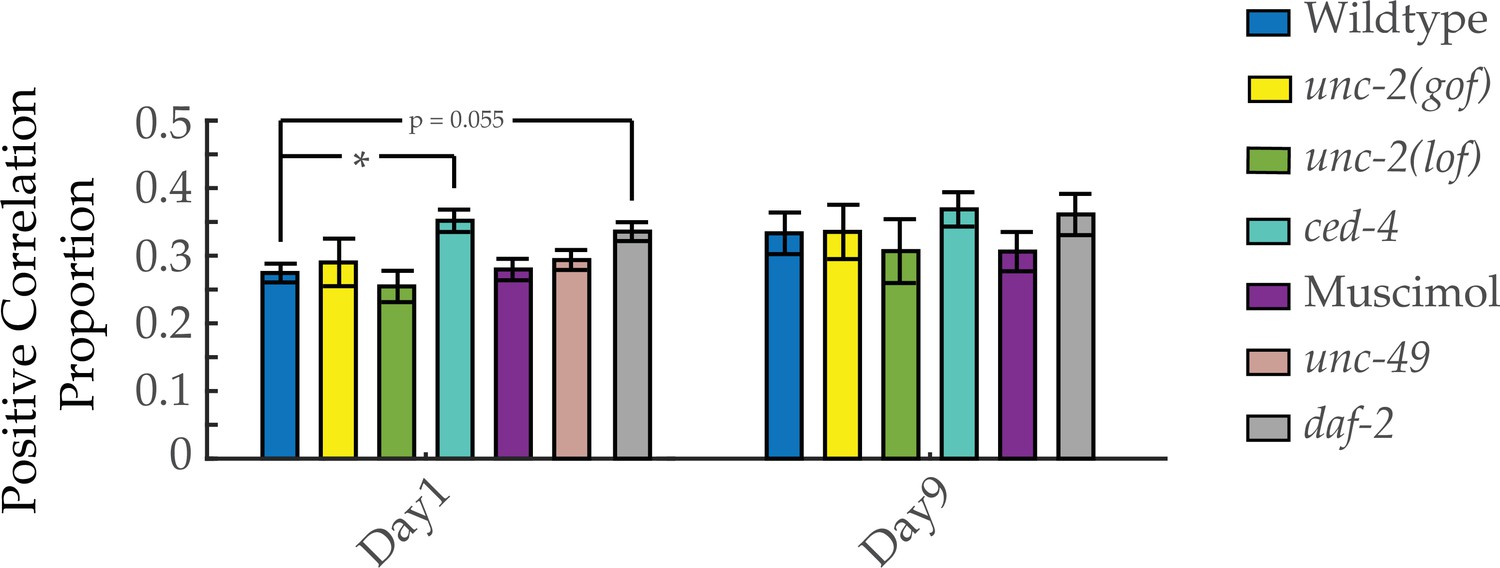
Proportion of positively correlated neuron pairs with age.
Positive correlation proportion, of neuron pair correlativity in worms at days 1 and 9 of adulthood, across genotypes and drug treatments (see Materials and methods). n=40 neurons per animal with 18–20 animals per condition. Error bars denote standard error of the mean. *p<0.05; ** p<0.01; *** p<0.001, Sidak post hoc test.
Figure 6
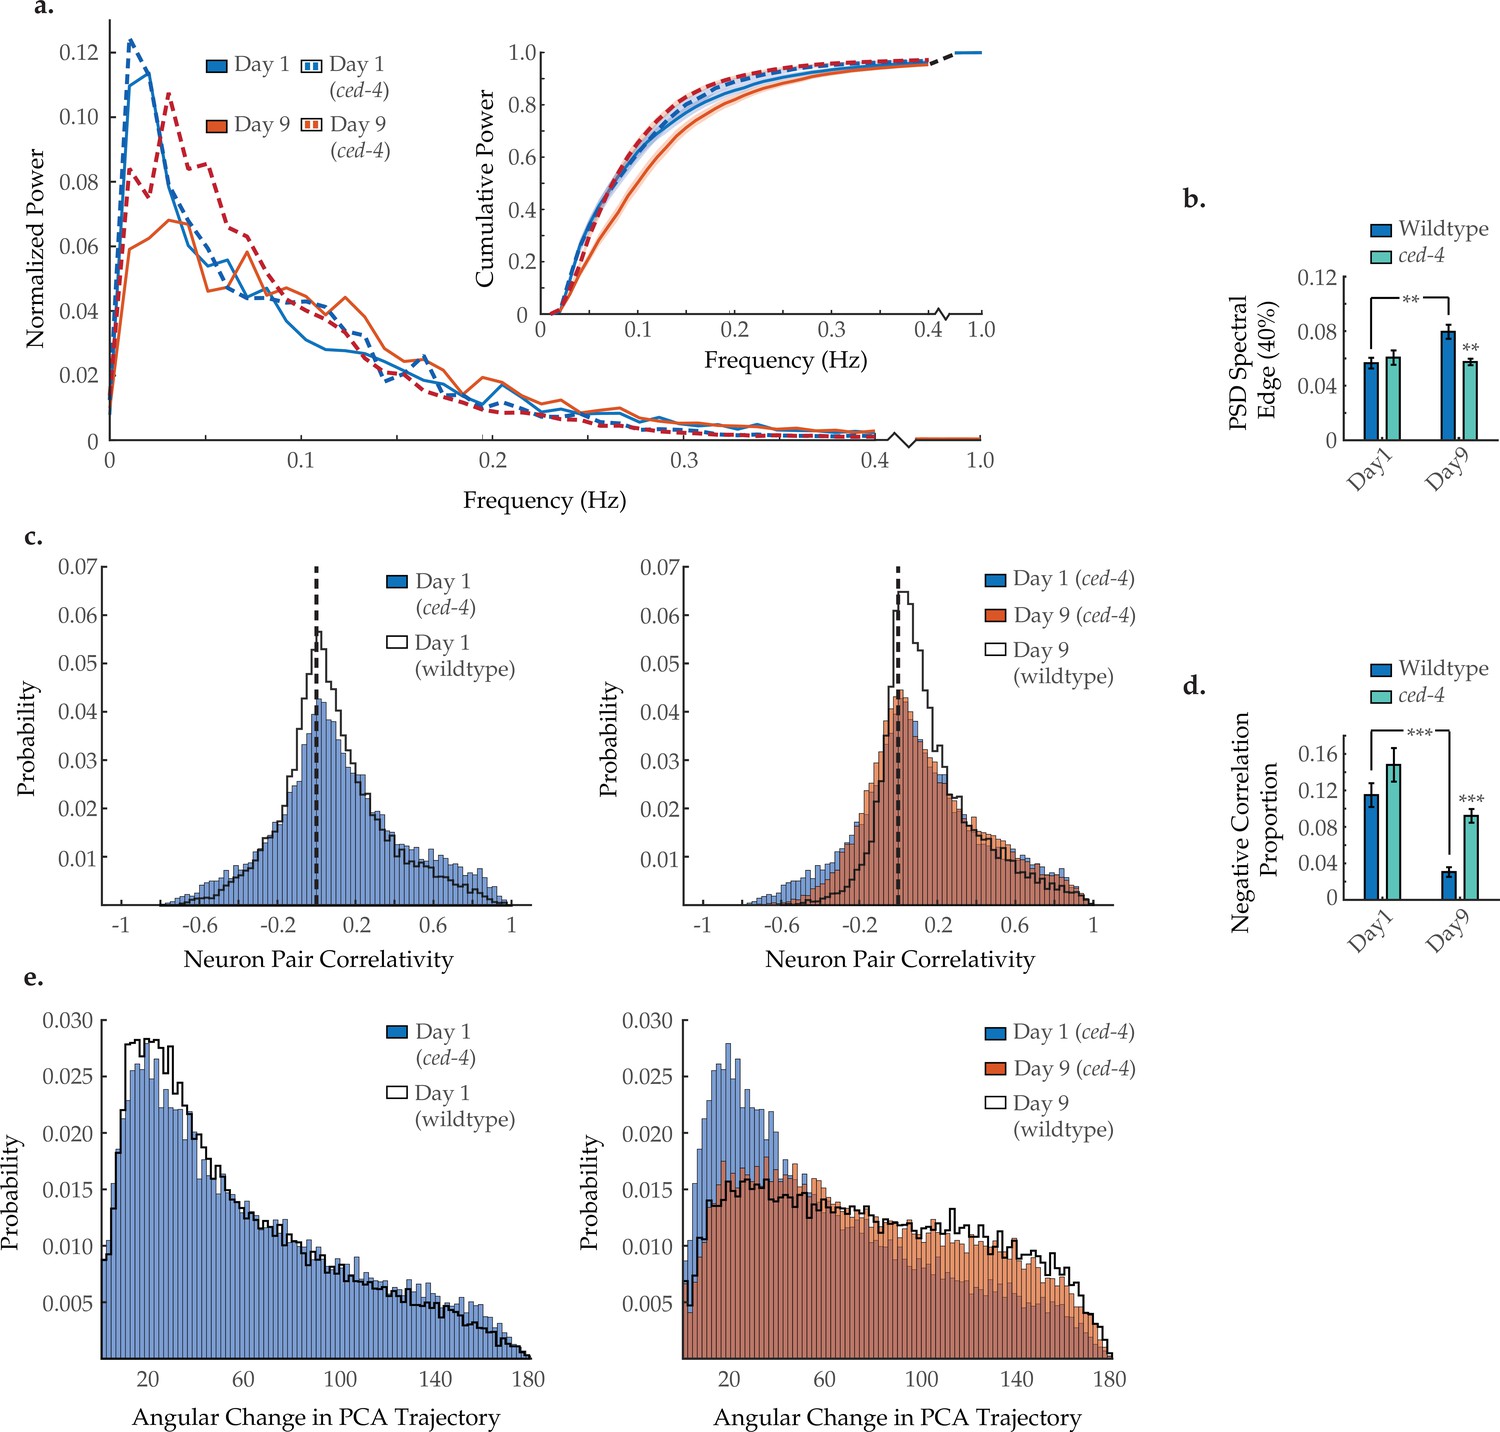
Ced-4 mutation diminishes age-associated changes in neuronal dynamics.
(a) Mean power spectral densities (PSDs) of the neuron GCaMP fluorescence traces in wild-type and ced-4(n1162) loss-of-function worms on days 1 and 9 of adulthood. Insert: cumulative PSD plots. Standard error of the mean for both PSD and cumulative power plots is displayed in Figure 3—figure supplement 1. (b) Mean 40% spectral edges of the individual PSDs used to generate graphs in A. For A and B, n=120 neurons per animal with 18–20 animals per condition. (c) Aggregate probability histograms, and (d) the negative correlation proportion, of neuron pair correlativity among the 40 most dynamically active neurons, in wild-type and ced-4 worms on days 1 and 9 of adulthood. For C and D, n=40 neurons per animal with 18–20 animals per condition. (e) Aggregate probability histograms of the angular directional changes of principal component analysis (PCA) trajectories for wild-type and ced-4 worms on days 1 and 9 of adulthood. Each PCA trajectory was generated with 120 neurons per animal with 18–20 animals per condition. Wild-type data displayed here are the same as displayed in Figures 2 and 3. Error bars denote standard error of the mean. *p<0.05; ** p<0.01; *** p<0.001, Sidak post hoc test.
-
Figure 6—source data 1
Multi-neuron frequency power distributions and proportion of negatively correlated neuron pairs in a ced-4 mutant worm.
- https://cdn.elifesciences.org/articles/72135/elife-72135-fig6-data1-v2.xlsx
Figure 7
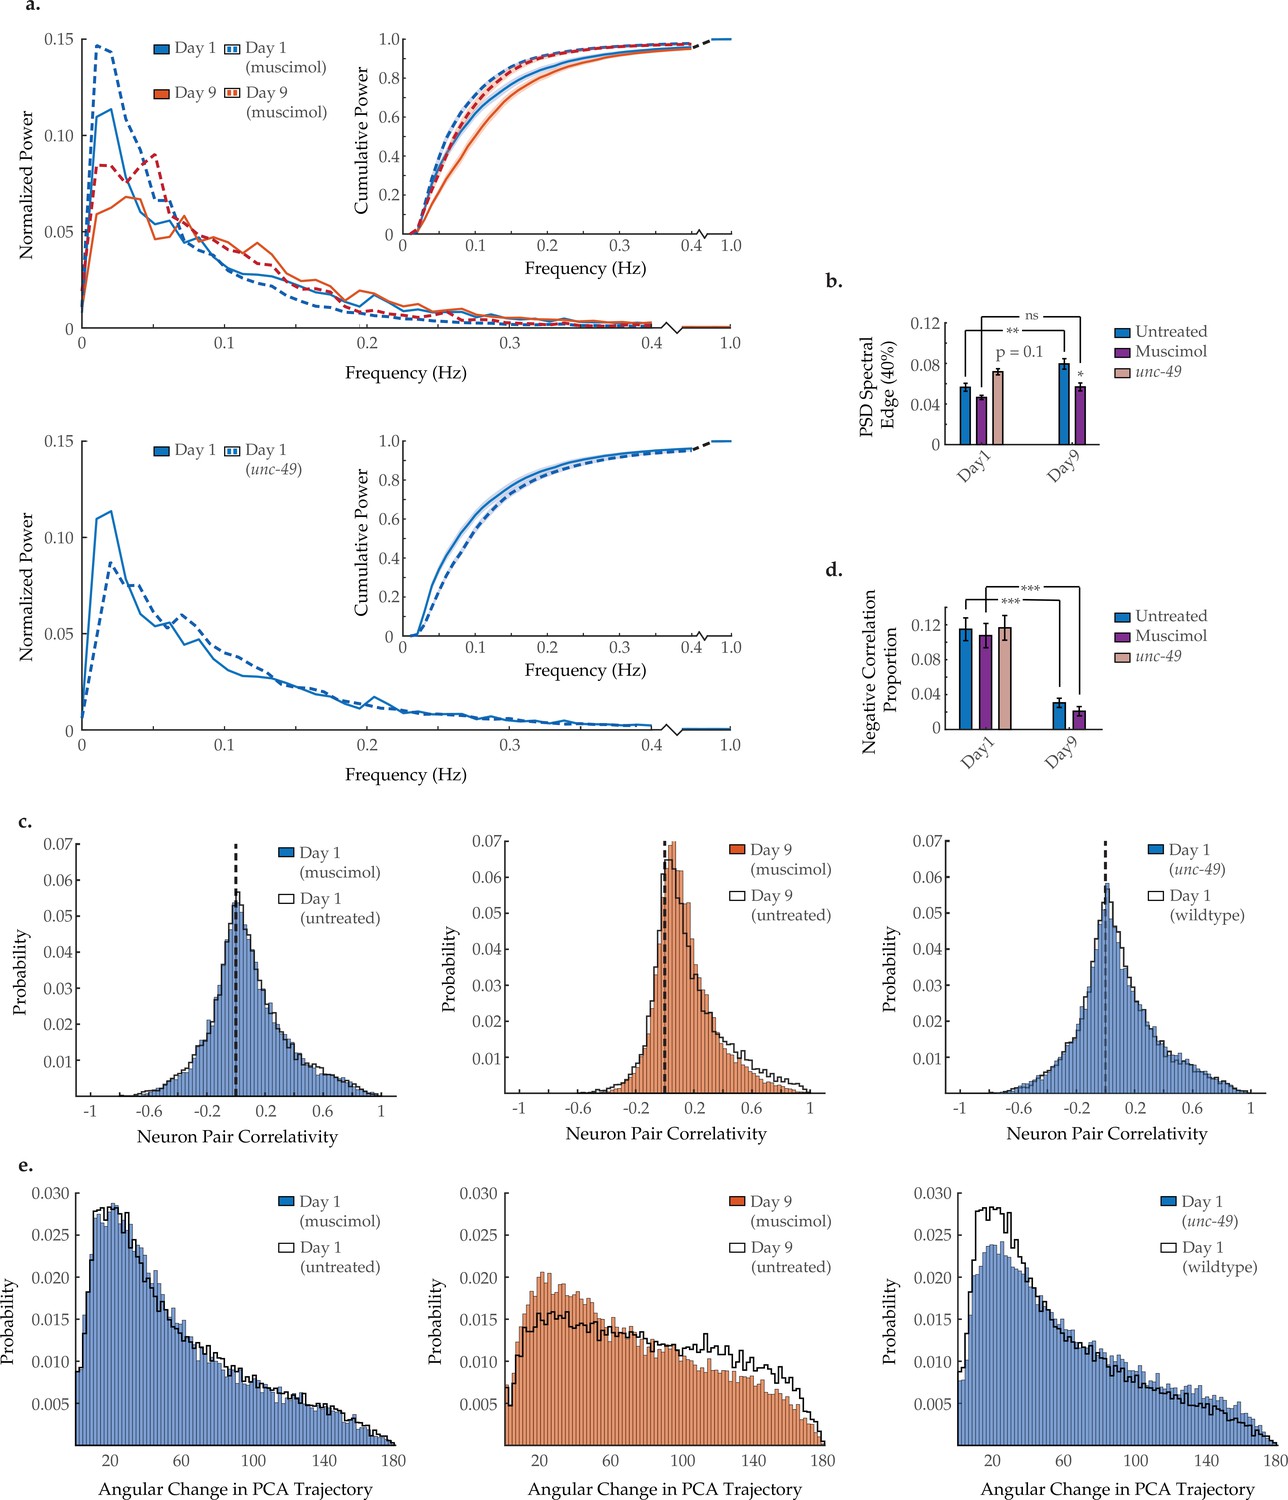
Modulating GABAA signaling alters several age-associated changes in neuron dynamics.
(a) Mean power spectral densities (PSDs) of the neuron GCaMP fluorescence traces in wild-type untreated and muscimol-treated animals on days 1 and 9 of adulthood, and also unc-49(e407) animals on day 1 of adulthood. Insert: cumulative PSD plots. Standard error of the mean for both PSD and cumulative power plots is displayed in Figure 3—figure supplement 1. (b) Mean 40% spectral edges of the individual PSDs used to generate graphs in A. For A and B, n=120 neurons per animal with 17–20 animals per condition. (c) Aggregate probability histograms, and (d) the negative correlation proportion, of neuron pair correlativity among the 40 most dynamically active neurons, in wild-type untreated and muscimol-treated worms on days 1 and 9 of adulthood, and also unc-49(e407) animals on day 1 of adulthood. For C and D, n=40 neurons per animal with 17–20 animals per condition. (e) Aggregate probability histograms of the angular directional changes of principal component analysis (PCA) trajectories in wild-type untreated and muscimol-treated worms on days 1 and 9 of adulthood, and also unc-49(e407) animals on day 1 of adulthood. Each PCA trajectory was generated with 120 neurons per animal with 17–20 animals per condition. Untreated data displayed here are the same as displayed in Figures 2 and 3. Error bars denote standard error of the mean. ns, not significant; p>0.05; *p<0.05; ** p<0.01; *** p<0.001, Sidak post hoc test.
-
Figure 7—source data 1
Multi-neuron frequency power distributions and proportion of negatively correlated neuron pairs in muscimol-treated animals and an unc-49 mutant worm.
- https://cdn.elifesciences.org/articles/72135/elife-72135-fig7-data1-v2.xlsx
Figure 8 with 1 supplement
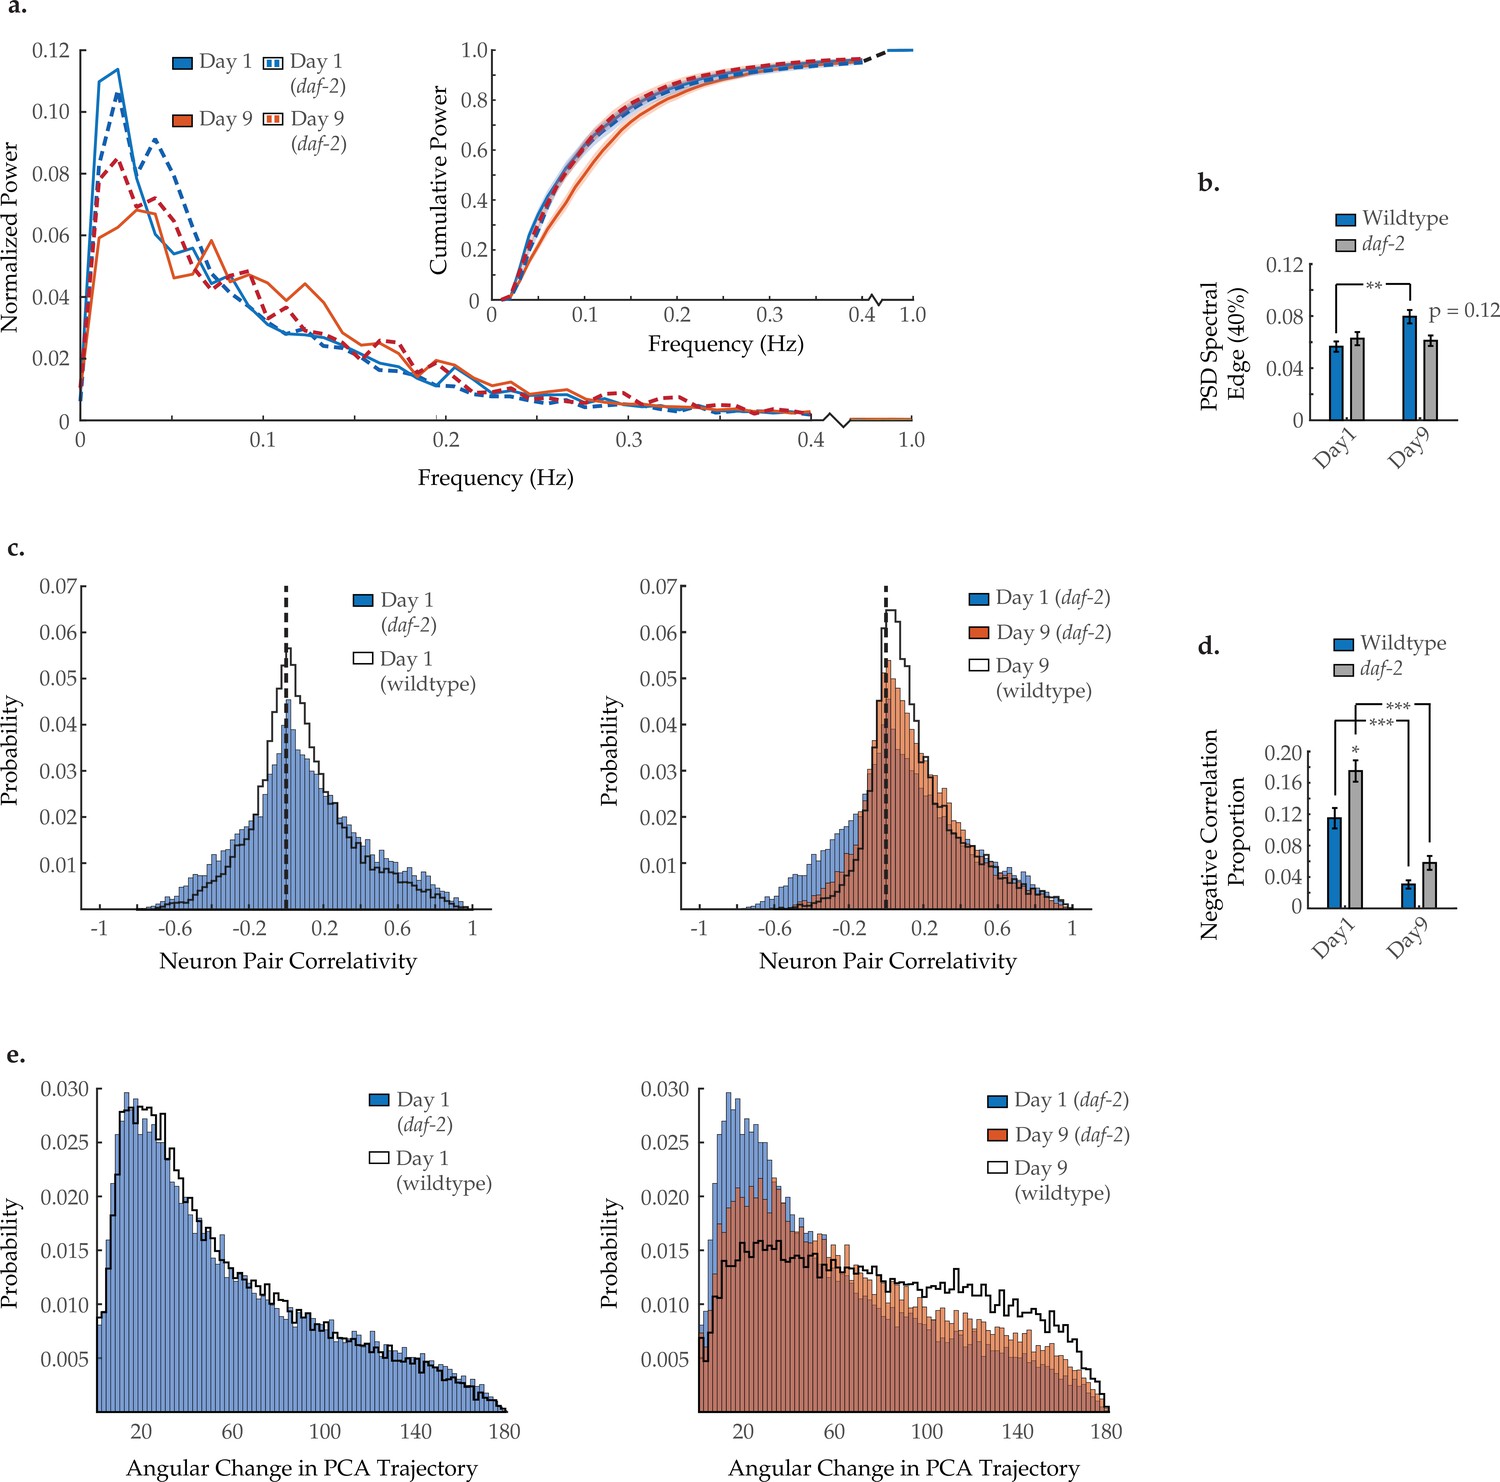
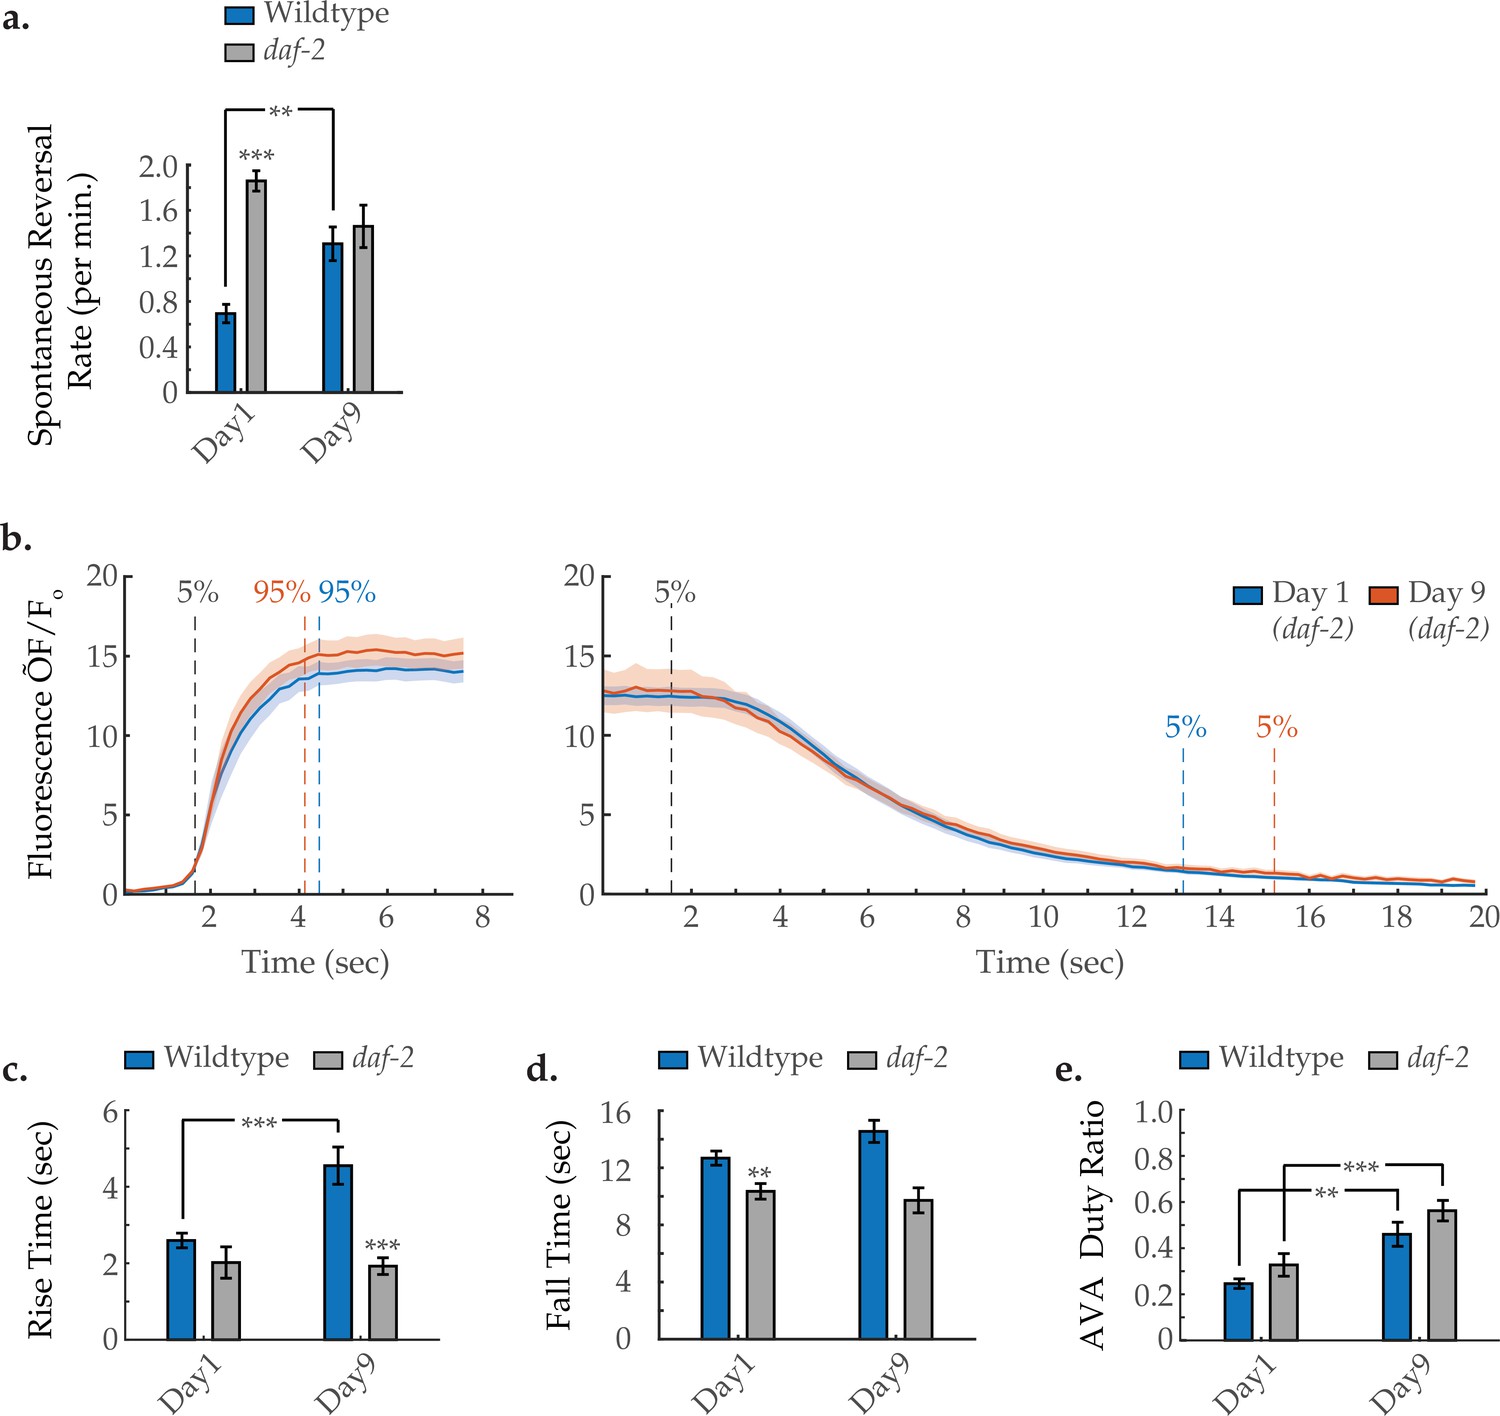
Effects of long-lived daf-2 mutation on age-associated changes in neuronal dynamics.
(a) Mean power spectral densities (PSDs) of the neuron GCaMP fluorescence traces, in wild-type and daf-2(e1370) loss-of-function worms on days 1 and 9 of adulthood. Insert: cumulative PSD plots. Standard error of the mean for both PSD and cumulative power plots is displayed in Figure 3—figure supplement 1. (b) Mean 40% spectral edges of the individual PSDs used to generate graphs in A. For A and B, n=120 neurons per animal with 18–20 animals per condition. (c) Aggregate probability histograms, and (d) the negative correlation proportion of neuron pair correlativity among the 40 most dynamically active head region neurons, in wild-type and daf-2 worms on days 1 and 9 of adulthood. For C and D, n=40 neurons per animal with 18–20 animals per condition. (e) Aggregate probability histograms of the angular directional changes of principal component analysis (PCA) trajectories for wild-type and daf-2 worms on days 1 and 9 of adulthood. Each PCA trajectory was generated with 120 neurons per animal with 18–20 animals per condition. Wild-type data displayed here are the same as displayed in Figures 2 and 3. Error bars denote standard error of the mean. *p<0.05; ** p<0.01; *** p<0.001, Sidak post hoc test.
-
Figure 8—source data 1
Multi-neuron frequency power distributions and proportion of negatively correlated neuron pairs in a daf-2 mutant worm.
- https://cdn.elifesciences.org/articles/72135/elife-72135-fig8-data1-v2.xlsx
-
Figure 8—source data 2
Reversal behavior in daf-2 mutant worms.
- https://cdn.elifesciences.org/articles/72135/elife-72135-fig8-data2-v2.xlsx
-
Figure 8—source data 3
AVA interneuron activity state transition dynamics in a daf-2 mutant worm.
- https://cdn.elifesciences.org/articles/72135/elife-72135-fig8-data3-v2.xlsx
-
Figure 8—source data 4
AVA interneuron calcium transient duty ratio in a daf-2 mutant worm.
- https://cdn.elifesciences.org/articles/72135/elife-72135-fig8-data4-v2.xlsx
Figure 8—figure supplement 1
AVA activity dynamics in daf-2 mutant animals with age.
(a) Spontaneous reversal rates of wild-type and daf-2 worms at days 1 and 6 of adulthood. For wild-type days 1 and 6, n=28 and 26 animals, respectively. For daf-2 days 1 and 6, n=38 and 20 animals, respectively. (b) Average AVA GCaMP fluorescence transient onsets and offsets in days 1 and 9 daf-2(e1370) worms (shaded areas delineate the standard error of the mean). For day 1 and day 9 onsets, n=12 and 30 traces from 7 and 15 animals, respectively. For day 1 and day 9 offsets, n=15 and 29 from 8 and 12 animals, respectively. (c, d) The average rise time (i.e. transient time from a ‘ON’ transition from 5 to 95% of maximum fluorescence) and average fall time (95–5%) of AVA GCaMP fluorescence transients at various ages. For wild-type day 1 and day 9 onsets, n=37 and 38 traces from 20 and 16 animals, respectively. For daf-2 day 1 and day 9 onsets, n=12 and 29 traces from 7 and 14 animals, respectively. For wild-type day 1 and day 9 offsets, n=33 and 32 traces from 20 and 14 animals, respectively. For daf-2 day 1 and day 9 offsets, n=15 and 29 traces from 8 and 12 animals, respectively. (e) Duty ratio of AVA fluorescence, defined as the proportion of time that AVA is active versus inactive (see Statistical methods). For wild-type day 1 and day 9, n=21 and 12 animals, respectively. For daf-2 day 1 and day 9, n=15 and 15 animals, respectively. Wild-type data displayed in C–E are the same as displayed in Figure 1. Error bars denote standard error of the mean. *p<0.05; ** p<0.01; *** p<0.001, Sidak post hoc test.
Author response image 1
Author response image 2
Videos
Video 1
Head region neural activity in day 1 adult Caenorhabditis elegans.
Example videos of head region neural activity in five worms at day 1 of adulthood, displayed as two-dimensional projections. The entire 10 min of imaging per animal is sped up and played back over 30 s. Nuclear-localized RFP and cytoplasmic GCaMP fluorescences are displayed as red and green, respectively.
Video 2
Head region neural activity in day 9 adult Caenorhabditis elegans.
Example videos of head region neural activity in five worms at day 9 of adulthood, displayed as two-dimensional projections. The entire 10 min of imaging per animal is sped up and played back over 30 s Nuclear-localized RFP and cytoplasmic GCaMP fluorescences are displayed as red and green, respectively.
Video 3
Tracked head region neurons in day 1 adult Caenorhabditis elegans.
Example videos of head region neural activity in five worms at day 1 of adulthood, displayed as two-dimensional projections. The entire 10 min of imaging per animal is sped up and played back over 30 s. Nuclear-localized RFP and cytoplasmic GCaMP fluorescences are displayed as red and green, respectively. White circles delineate the identified nuclear volumes of the tracked neurons.
Video 4
Tracked head region neurons in day 9 adult Caenorhabditis elegans.
Example videos of head region neural activity in five worms at day 9 of adulthood, displayed as two-dimensional projections. The entire 10 min of imaging per animal is sped up and played back over 30 s. Nuclear-localized RFP and cytoplasmic GCaMP fluorescences are displayed as red and green, respectively. White circles delineate the identified nuclear volumes of the tracked neurons.
Additional files
-
Transparent reporting form
- https://cdn.elifesciences.org/articles/72135/elife-72135-transrepform1-v2.docx
-
Source code 1
Automated Neuron Tracking Code.
- https://cdn.elifesciences.org/articles/72135/elife-72135-code1-v2.zip
Download links
A two-part list of links to download the article, or parts of the article, in various formats.
Downloads (link to download the article as PDF)
Open citations (links to open the citations from this article in various online reference manager services)
Cite this article (links to download the citations from this article in formats compatible with various reference manager tools)
Age-associated changes to neuronal dynamics involve a disruption of excitatory/inhibitory balance in C. elegans
eLife 11:e72135.
https://doi.org/10.7554/eLife.72135


