A phosphoswitch at acinus-serine437 controls autophagic responses to cadmium exposure and neurodegenerative stress
- Department of Neuroscience, UT Southwestern Medical Center, United States
- Department of Cell Biology, UT Southwestern Medical Center, United States
Figures
Figure 1 with 1 supplement

A genetic screen identifies Nil as the Acinus-Serine437 phosphatase.
(A–N) Micrographs of eyes in which GMR-Gal4 drives expression of AcnWT (A), AcnWT+ microtubule star (mts)–RNAi (B), AcnWT+ Pp1-13 C RNAi (C), AcnWT+ PpD6 RNAi (D), AcnWT+ flapwing (flw) RNAi (E), AcnWT+ CG15035 RNAi (F), AcnWT+ nil RNAi (G), mts–RNAi (I), Pp1-13C–RNAi (J), PpD6–RNAi (K), flw–RNAi (L), CG15035–RNAi (M), nil–RNAi (N), and H represents GMR-Gal4 control. (O–T) Projection of confocal micrographs of larval eye discs stained for pS437-Acn (green) and DNA from Da-Gal4 (O, O’), Da-Gal4, Pp1-13C RNAi (P, P’), Da-Gal4, PpD6 RNAi (Q, Q’), Da-Gal4, CG15035 RNAi (R, R’), Da-Gal4, flw RNAi (S, S’), Da-Gal4, nil RNAi (T, T’). Scale bar in A is 100 µm for A-N, scale bar in O is 40 µm for O-T. Genotypes are listed in Supplementary file 3.
-
Figure 1—source data 1
Phosphatase RNAi lines were crossed to Da-Gal4 in order to measure knockdown of Phosphatases which are hits in the screen.
- https://cdn.elifesciences.org/articles/72169/elife-72169-fig1-data1-v3.xlsx
Figure 1—figure supplement 1
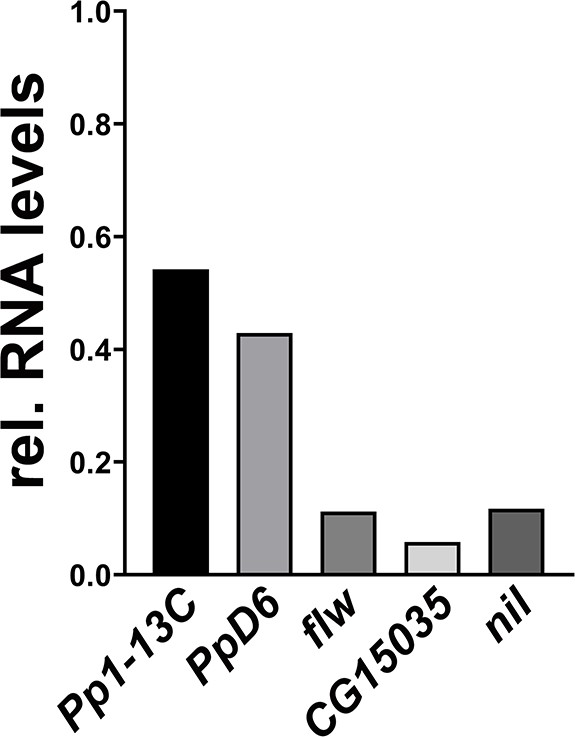
qPCR analysis of phosphatase genes interacting with Acinus.
The indicated phosphatases were knocked down in wandering third instar larvae using the Da-Gal4 driver. For each phosphatase, bar graphs show transcript levels relative to wild-type larvae as analyzed by quantitative RT-PCR. The data were normalized to levels of ribosomal protein 49 transcription. Genotypes are listed in Supplementary file 3.
Figure 2 with 2 supplements
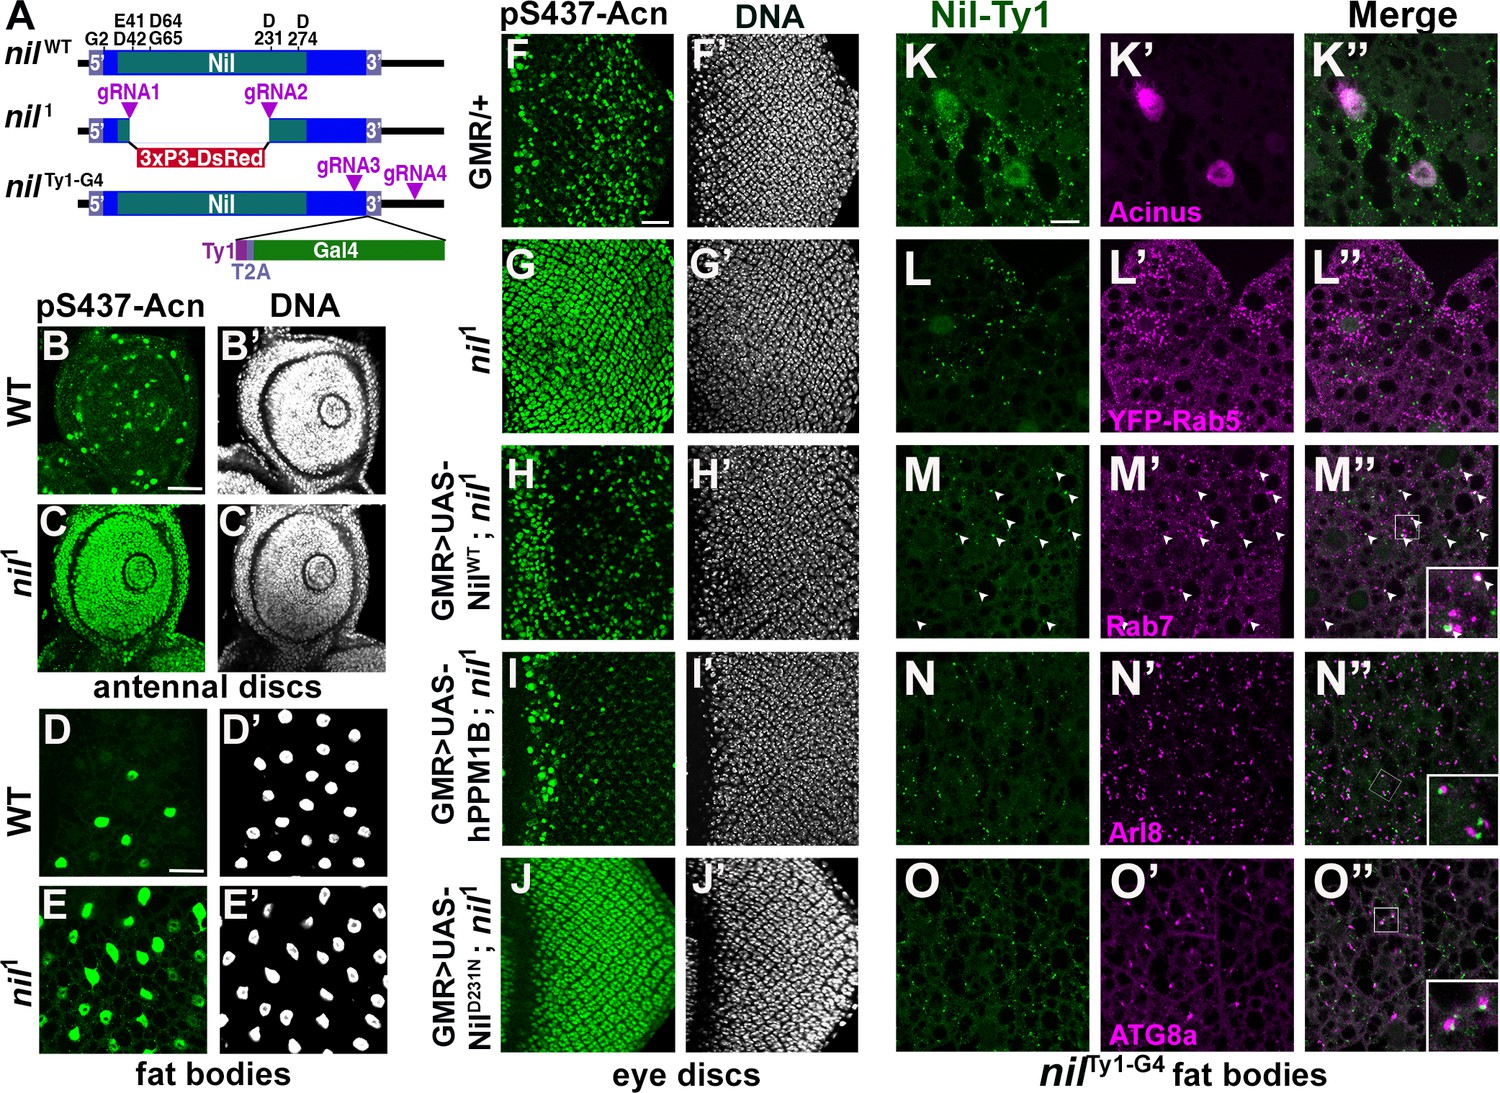
Nil loss and gain of function regulates Acinus-Serine437 phosphorylation.
(A) Diagram depicting the NilWT protein with amino acids highly conserved in the PPM family of phosphatases, the nil1 allele with its 3xP3-DsRed insertion, and the multicistronic nilTy1-G4 allele with Ty1 tag and T2A-coexpressed Gal4. (B–E) Projection of confocal micrographs of larval antennal discs (B, C) and fat bodies (D, E) stained for pS437-Acn (green) and DNA from w1118 and nil1. (F–J) Projection of confocal micrographs of larval eye discs stained for pS437-Acn (green) and DNA from GMR-Gal4/+ (F, F’), nil1 (G, G’), GMR-Gal4, UAS-NilWT; nil1 (H, H’), GMR-Gal4, UAS-hPPM1B; nil1 (I, I’), GMR-Gal4, UAS-NilD231N; nil1 (J, J’). (K–O) Projection of confocal micrographs of larval fat bodies from nilTy1-G4 all stained for Ty1(green) and Acn (magenta) (K- K’’), YFP-Rab5 (magenta) (L-L’’), Rab7 (magenta) (M-M’’), Arl8 (magenta) (N- N’’), or Atg8a (magenta) (O-O’’). Arrowheads in M-M’’ indicate colocalization of Nil-Ty1 with Rab7 in cytosolic punctae. Notice that projections in L–O represent apical regions largely excluding nuclei. Scale bar in B and D is 40 µm for B-E and in F and K is 20 µm for F-O. Genotypes are listed in Supplementary file 3.
Figure 2—figure supplement 1
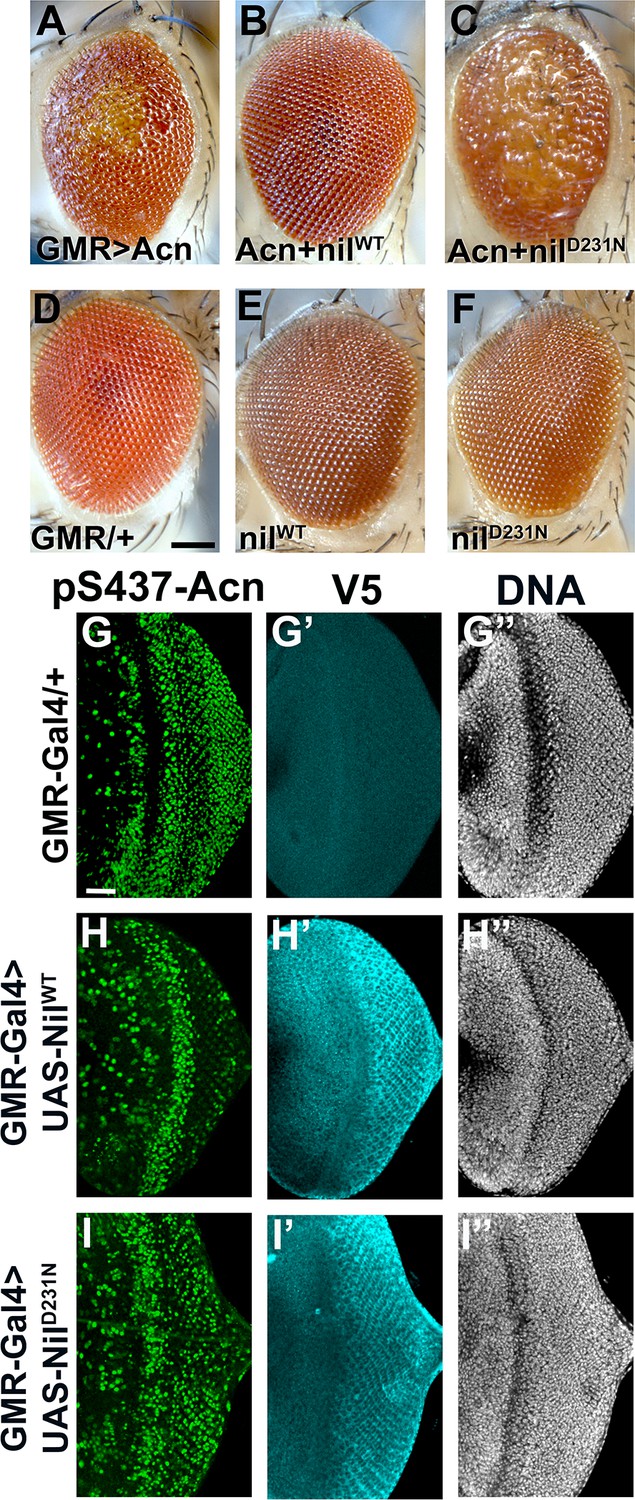
Effects of Nil overexpression depend on its phosphatase activity.
(A–F) Micrographs of eyes in which GMR-Gal4 drives expression of AcnWT (A), AcnWT+ NilWT (B), AcnWT + NilD231N (C), NilWT (E), NilD231N (F); GMR-Gal4 control is in (D). Scale bar in D is 100 µm for A–F. (G–I) Projection of confocal micrographs of larval eye discs stained for pS437-Acn (green), V5 (cyan), and DNA from GMR-Gal4 (G-G’’), GMR-Gal4, UAS- NilWT (H-H’’), GMR-Gal4, UAS- NilD231N (I-I’’). Nil transgenes are V5 tagged. Scale bar in G is 20 µm for G–I. Genotypes are listed in Supplementary file 3.
Figure 2—figure supplement 2
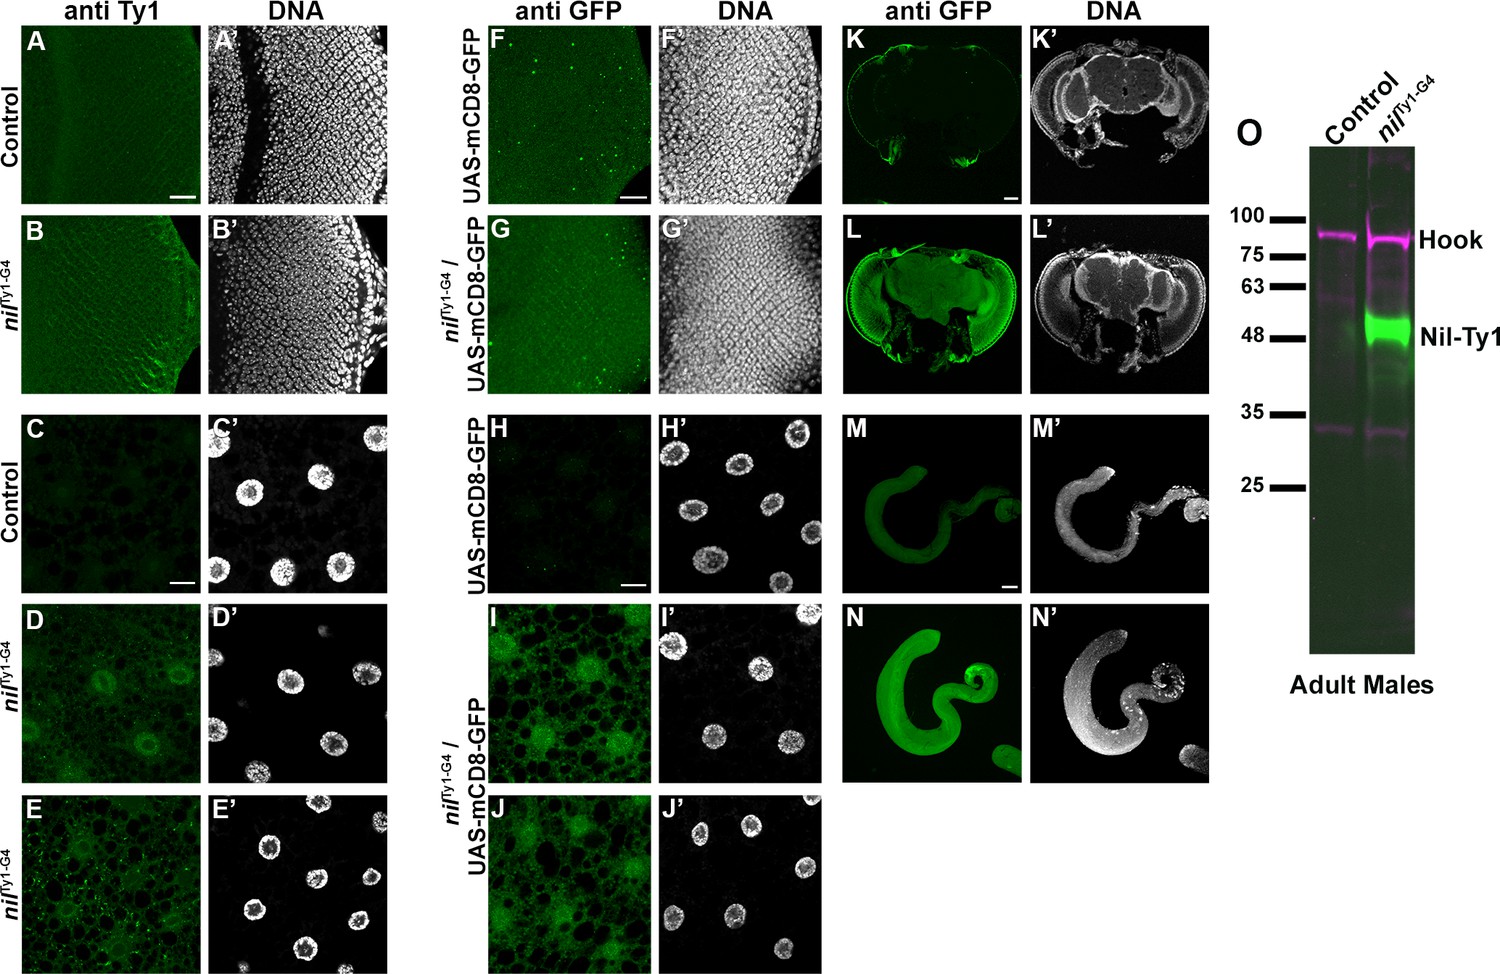
Nil expression in larval and adult tissues.
(A–E) Projection of confocal micrographs of larval eye discs (B) and fat bodies (D, E) from nilTy1-T2A-Gal4 (nilTy1-G4) stained for Ty1 (green). No Ty1 (green) staining is observed in 20XUAS-6XmCherry-HA controls (A,C). (F–N) Projection of confocal micrographs of larval eye discs (G) and fat bodies (I, J), adult brain (L), and testes (N) from animals expressing UAS-mCD8-GFP under control of the nilTy1-T2A-Gal4 driver (nilTy1-G4) stained for GFP (green) and DNA. Only background levels of GFP (green) staining are observed in UAS-mCD8-GFP controls (F,H, K,M). (O) Western blot of lysates from adult male nilTy1-G4 flies or 20XUAS-6XmCherry-HA controls probed for Ty1 and Hook as control. Scale bars: in A, C, F, H are 20 µm for A–J; in K is 50 µm for K–L; in M is 100 µm for M–N. Genotypes are listed in Supplementary file 3.
-
Figure 2—figure supplement 2—source data 1
Raw Western blot data with molecular weight markers for Figure 2—figure supplement 2O from lysates of adult male flies of nilTy1-G4 and appropriate control probed for Ty1 and Hook.
Western blot analysis using anti-Ty1 and anti-Hook antibodies in lysates from adult males of nilTy1G4 and appropriate control. The parts of the raw image used in Figure 2—figure supplement 2O were marked with box.
- https://cdn.elifesciences.org/articles/72169/elife-72169-fig2-figsupp2-data1-v3.zip
Figure 3 with 1 supplement
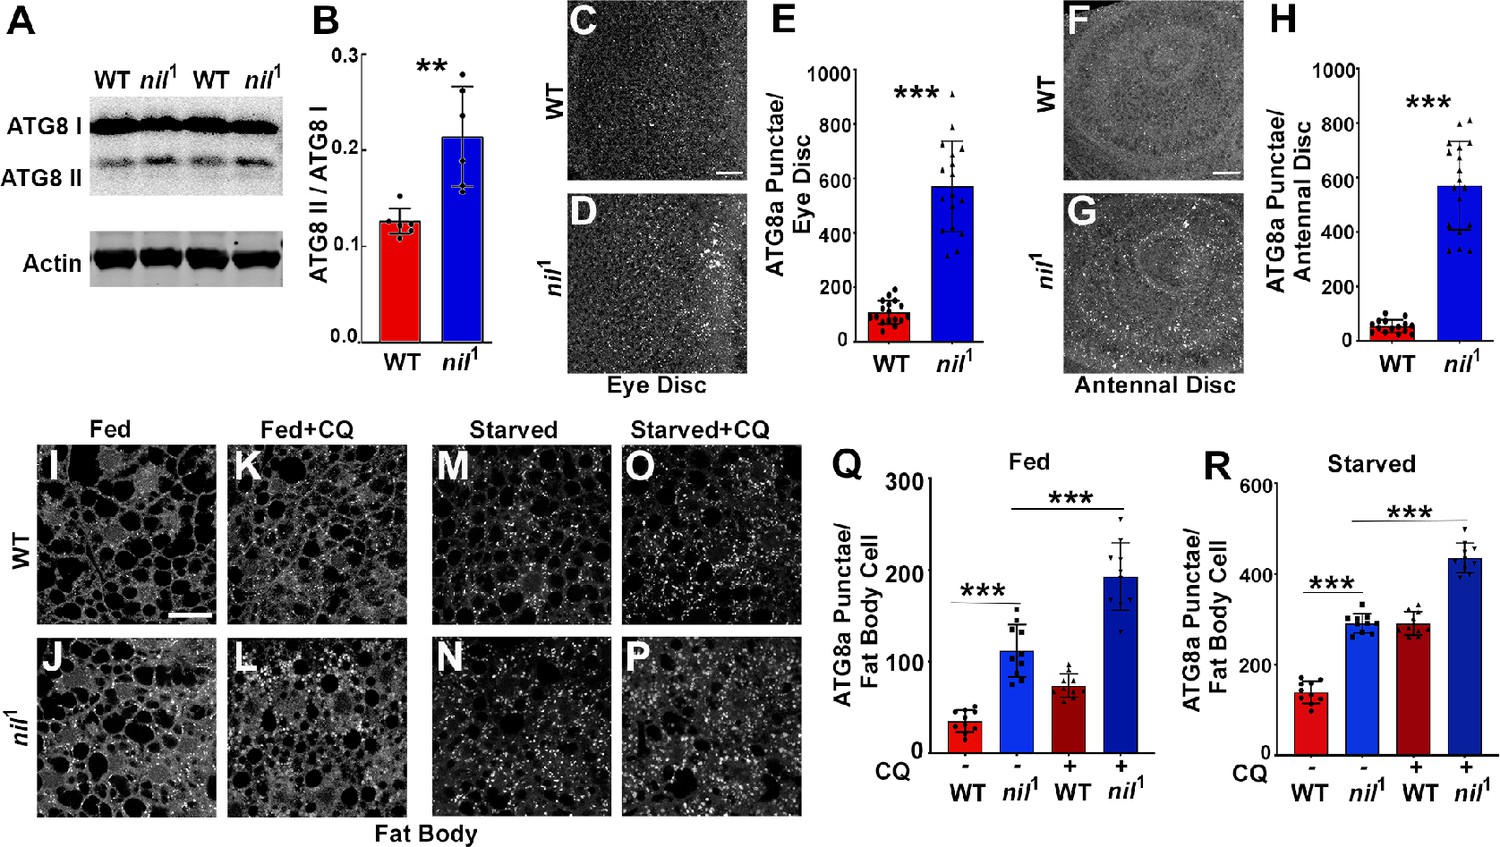
Loss of Nil enhances autophagic flux.
(A–B) Western blot of lysates from adult heads of w1118 and nil1 probed for ATG8a (A). Quantification of ATG8a-II to ATG8a-I ratio from Western blots as in (A). Data are from six different lysates from three experimental repeats (B). Normality of data distributions was assessed using the Kolmogorov-Smirnov test and statistical significance using two-tailed paired t test (p=0.006). Bar graphs show mean ± SD. (C–E) Projection of confocal micrographs of fed w1118 and nil1 larval eye discs (C, D) stained for Atg8a. (E) Quantification of Atg8a punctae in eye discs (C, D) of fed w1118 and nil1. Data are from 15 larvae taken from three experimental repeats. Normality of data distributions was assessed using the Kolmogorov-Smirnov test and statistical significance using two-tailed unpaired t test (p<0.001). Bar graphs show mean ± SD. (F–H) Projection of confocal micrographs of fed w1118 and nil1 antennal discs (F, G) stained for Atg8a. (H) Quantification of Atg8a punctae in antennal discs (F, G) of fed w1118 and nil1. Data are from 15 larvae from three experimental repeats. Normality of data distributions was assessed using the Kolmogorov-Smirnov test and statistical significance using two-tailed unpaired t test (p<0.001). Bar graphs show mean ± SD. (I–P) Projection of confocal micrographs encompassing 6–8 cells of w1118 and nil1 larval fat bodies aged 96 hr after egg laying, either fed (I–L) or amino acid starved for 4 hr in 20% sucrose solution (M–P) stained for Atg8a. Larvae were matched for size. To assess autophagic flux, for panels K, L and O, P lysosomal degradation was inhibited with chloroquine (CQ). (Q–R) Quantification of Atg8a punctae in fed (Q) or amino acid starved (R) w1118 and nil1 larval fat bodies untreated or treated with CQ averaged from six to eight cells each per fat body. Data are from 10 larvae from three experimental repeats. Normality of data distributions was assessed using the Kolmogorov-Smirnov test and statistical significance using one-way analysis of variance with Tukey’s correction for multiple comparisons. Bar graphs show mean ± SD. ***p<0.001. Scale bar in C, F, I is 20 µm for C–D, F–G, I–P. Genotypes are listed in Supplementary file 3.
-
Figure 3—source data 1
Raw Western blot data with molecular weight markers for Figure 3A from lysates of adult heads of w1118 and nil1 probed for ATG8a and Actin.
Western blot analysis using anti-ATG8a and anti-actin antibodies in lysates from adult heads of w1118 and nil1. Boxes mark the parts of the raw image used in Figure 3A.
- https://cdn.elifesciences.org/articles/72169/elife-72169-fig3-data1-v3.zip
Figure 3—figure supplement 1

p62/ Ref(2)P is not accumulated in adult heads of nil1 animal.
(A–B) Western blot of lysates from adult heads of w1118 and nil1 probed for p62/Ref(2)P and actin as loading control (A). Quantification of blots for Ref(2)P levels relative to actin. Data are from six different lysates from three experimental repeats. (B) Normality of data distributions was assessed using the Kolmogorov-Smirnov test and statistical significance using two-tailed t test (p=0.122). Bar graphs show mean ± SD. Genotypes are listed in Supplementary file 3.
-
Figure 3—figure supplement 1—source data 1
Raw Western blot data with molecular weight markers for Figure 3—figure supplement 1A from lysates of adult heads of w1118 and nil1 probed for Ref(2)P and Actin.
Boxes mark the parts of the raw image used in Figure 3—figure supplement 1A.
- https://cdn.elifesciences.org/articles/72169/elife-72169-fig3-figsupp1-data1-v3.zip
Figure 4
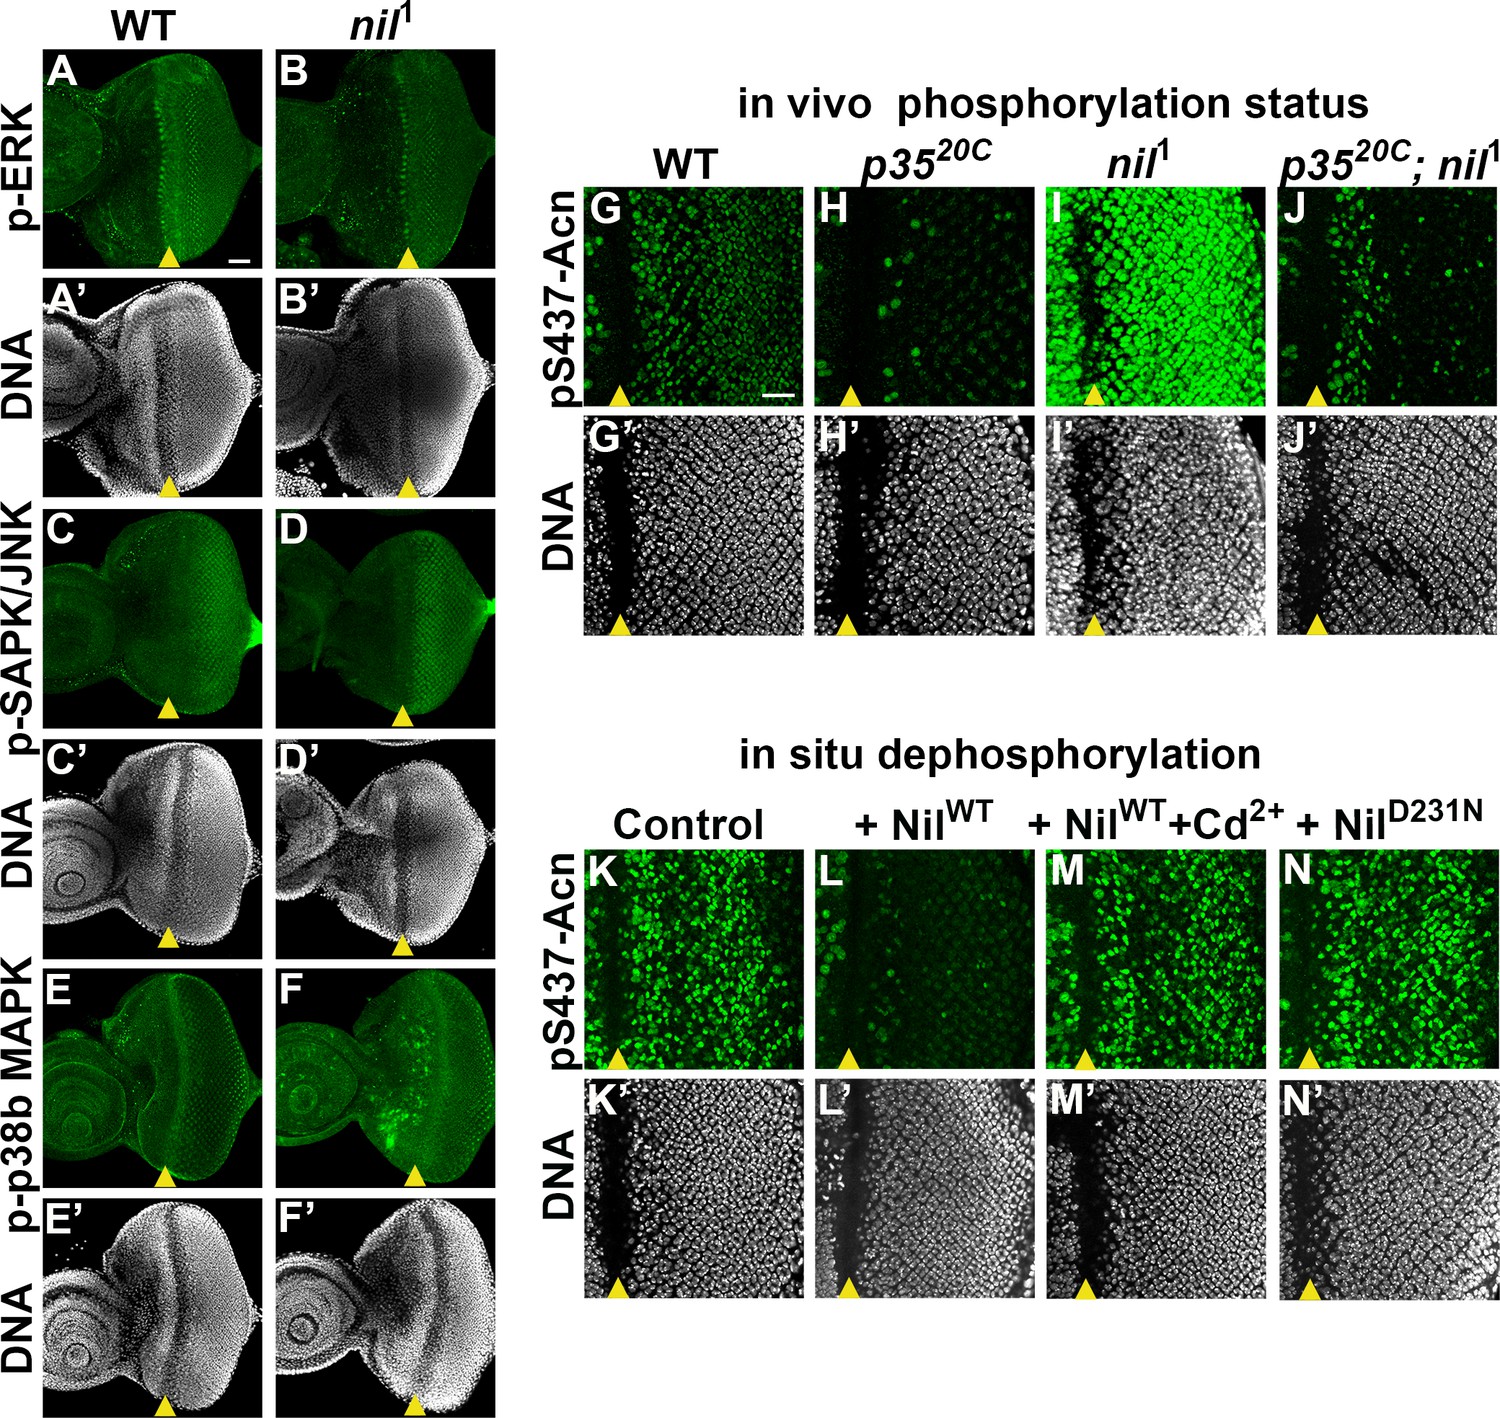
Nil dephosphorylates acinus (acn) counteracting Cdk5-p35-mediated phosphorylation.
(A–F) Projection of confocal micrographs of w1118 and nil1 larval eye discs stained for p-ERK (green) and DNA (A- B’), p-SAPK/JNK (green) and DNA (C-D’), p-p38b MAPK (green) and DNA (E-F’). (G–J) Projection of confocal micrographs of larval eye discs stained for pS437-Acn (green) and DNA from w1118 (G, G’), p3520C (H, H’), nil1 (I, I’), p3520C; nil1 (J, J’). (K–N) Projection of confocal micrographs of eye discs from AcnWT larvae stained for pS437-Acn (green) and DNA after in situ dephosphorylation without addition (K, K’) or with addition of wild-type Nil (L,L'), wild-type Nil +100 µM CdCl2 (M,M'), or inactive NilD231N (N,N'). Scale bar in A is 40 µm for A–F. Scale bar in G is 20 µm for G–N. Genotypes are listed in Supplementary file 3.
Figure 5 with 1 supplement

Acinus-Serine437 phosphorylation is required for Cd2+-induced autophagy.
(A–B) Projection of confocal micrographs of w1118 larval eye discs stained for pS437-Acn (green) and DNA from either 100 µM CdCl2 treated (B) or untreated (A) larvae. (C–D) Projection of confocal micrographs of fed w1118 larval eye discs either 100 µM CdCl2 treated (D) or untreated (C) stained for Atg8a. (E–H) Projection of confocal micrographs of fed AcnWT and AcnS437A larval eye discs either 100 µM CdCl2 treated (G, H) or untreated (E, F) stained for Atg8a. (I,J) Quantification of Atg8a punctae in either 100 µM CdCl2 treated or untreated w1118 larval eye discs (I) or AcnWT and AcnS437A larval eye discs (J). Data are from 10 larvae from three experimental repeats. Normality of data distributions was assessed using the Kolmogorov-Smirnov test and statistical significance using one-way analysis of variance with Tukey’s correction for multiple comparisons. Bar graphs show mean ± SD. ns, not significant; **p<0.01; ***p<0.001. Scale bar in A, C, E is 20 µm for A–H. Genotypes are listed in Supplementary file 3.
Figure 5—figure supplement 1

Nil transcription or protein level does not change under conditions influencing starvation-independent or dependent autophagy.
(A–B) Western blot of lysates from adult males of w1118, nilTy1-G4 fed without or with 250 µM Cd2+, probed for Ty1 (A). Total protein for the same blot is imaged for normalization (A). Quantification of blots for Ty1-tagged Nil relative to total protein loaded. Data are from five different lysates from three experimental repeats. Normality of data distributions was assessed using the Kolmogorov-Smirnov test and statistical significance using two-tailed t test (p=0.89). Bar graphs show mean ± SD. (C–D) Analysis of nil transcript level by quantitative RT-PCR from heads of w1118 adults fed without or with 125 µM Cd2+ or 250 µM Cd2+ (C) and w1118 third instar larvae (D) fed without or with 100 µM Cd2+, or amino acid starved (Stv). Data shown are three technical repeats from two sperate experiments each normalized to levels of Act5C transcription. Genotypes are listed in Supplementary file 3.
-
Figure 5—figure supplement 1—source data 1
Raw Western blot data with molecular weight markers for Figure 5—figure supplement 1A from adult males of w1118, fed nilTy1-G4, and Cd2+(250 µM) fed nilTy1-G4 probed for Ty1.
Raw data of total Protein with molecular weight marker from the same blot was also provided. Boxes mark the parts of the raw image used in Figure 5—figure supplement 1A.
- https://cdn.elifesciences.org/articles/72169/elife-72169-fig5-figsupp1-data1-v3.zip
Figure 6 with 1 supplement
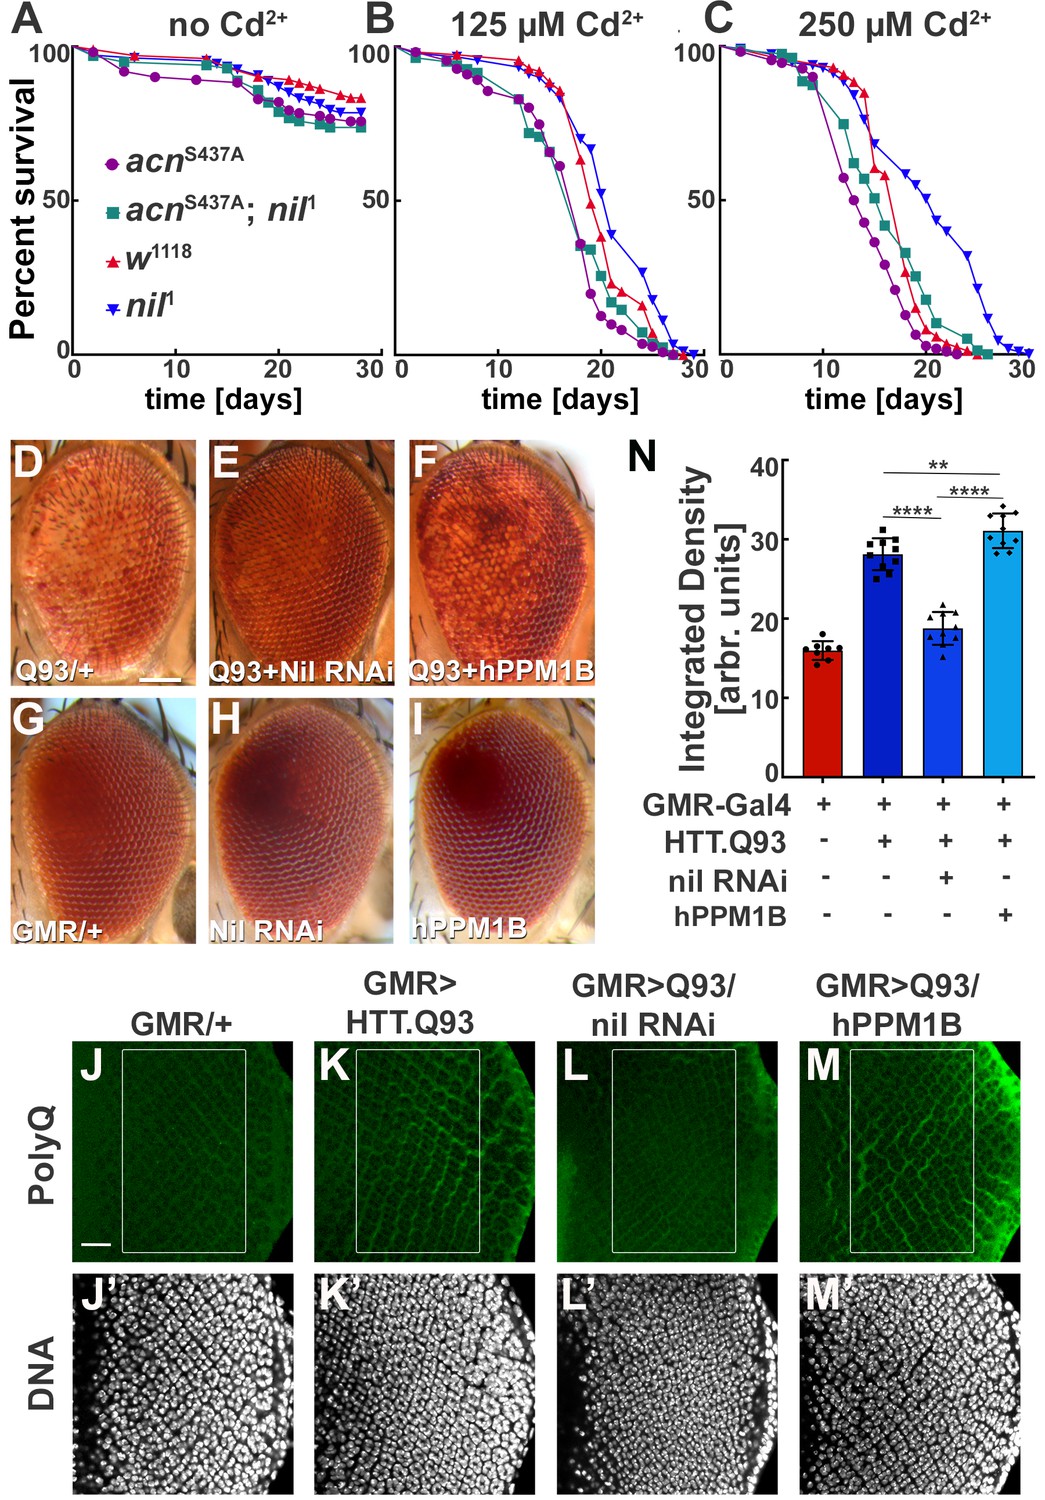
Loss of Nil function provides partial protection against Cd2+ poisoning and proteostasis stress.
(A–C) Survival curves for w1118, nil1, acnS437A, and acnS437A; nil1 adult male flies either untreated (A) or treated with 125 µM CdCl2 (B), 250 µM CdCl2 (C). N was at least 99 (A), 82 (B), and 79 (C). Significance was assessed using log-rank Mantel-Cox test.:
ns, not significant. (D–I) Micrographs of adult eyes in which GMR-Gal4 drives expression of UAS-HTTex1.Q93 (D), UAS-HTTex1.Q93+ UAS Nil RNAi (E), UAS-HTTex1.Q93+ UAS-hPPM1B (F), UAS-Nil RNAi (H), UAS-hPPM1B (I), and (G) represents GMR-Gal4 control. Scale bar in D is 100 µm for D–I. (J–M) Projection of confocal micrographs of larval eye discs stained for PolyQ (green) and DNA from GMR-Gal4 (J,J’), GMR-Gal4, UAS-HTTex1.Q93 (K,K’), GMR-Gal4, UAS-HTTex1.Q93+ UAS Nil RNAi (L,L’), GMR-Gal4, UAS-HTTex1.Q93+ UAS-hPPM1B (M,M’). Scale bar in J is 20 µm for J–M. (N) Quantification of PolyQ accumulation in eye discs of the indicated genotypes from a constant area starting two to three rows posterior to the furrow containing around 100 ommatidial clusters. The Region of interest(ROI) is represented using a box in the figure panels (J–M). Normality of data distribution was assessed using the Kolmogorov-Smirnov test and statistical significance using one-way analysis of variance with Tukey’s correction for multiple comparisons. Bar graphs show mean ± SD of integrated densities from 10 larvae taken out of three experimental repeats. **p<0.01; ****p<0.0001. Genotypes are listed in Supplementary file 3.
Figure 6—figure supplement 1
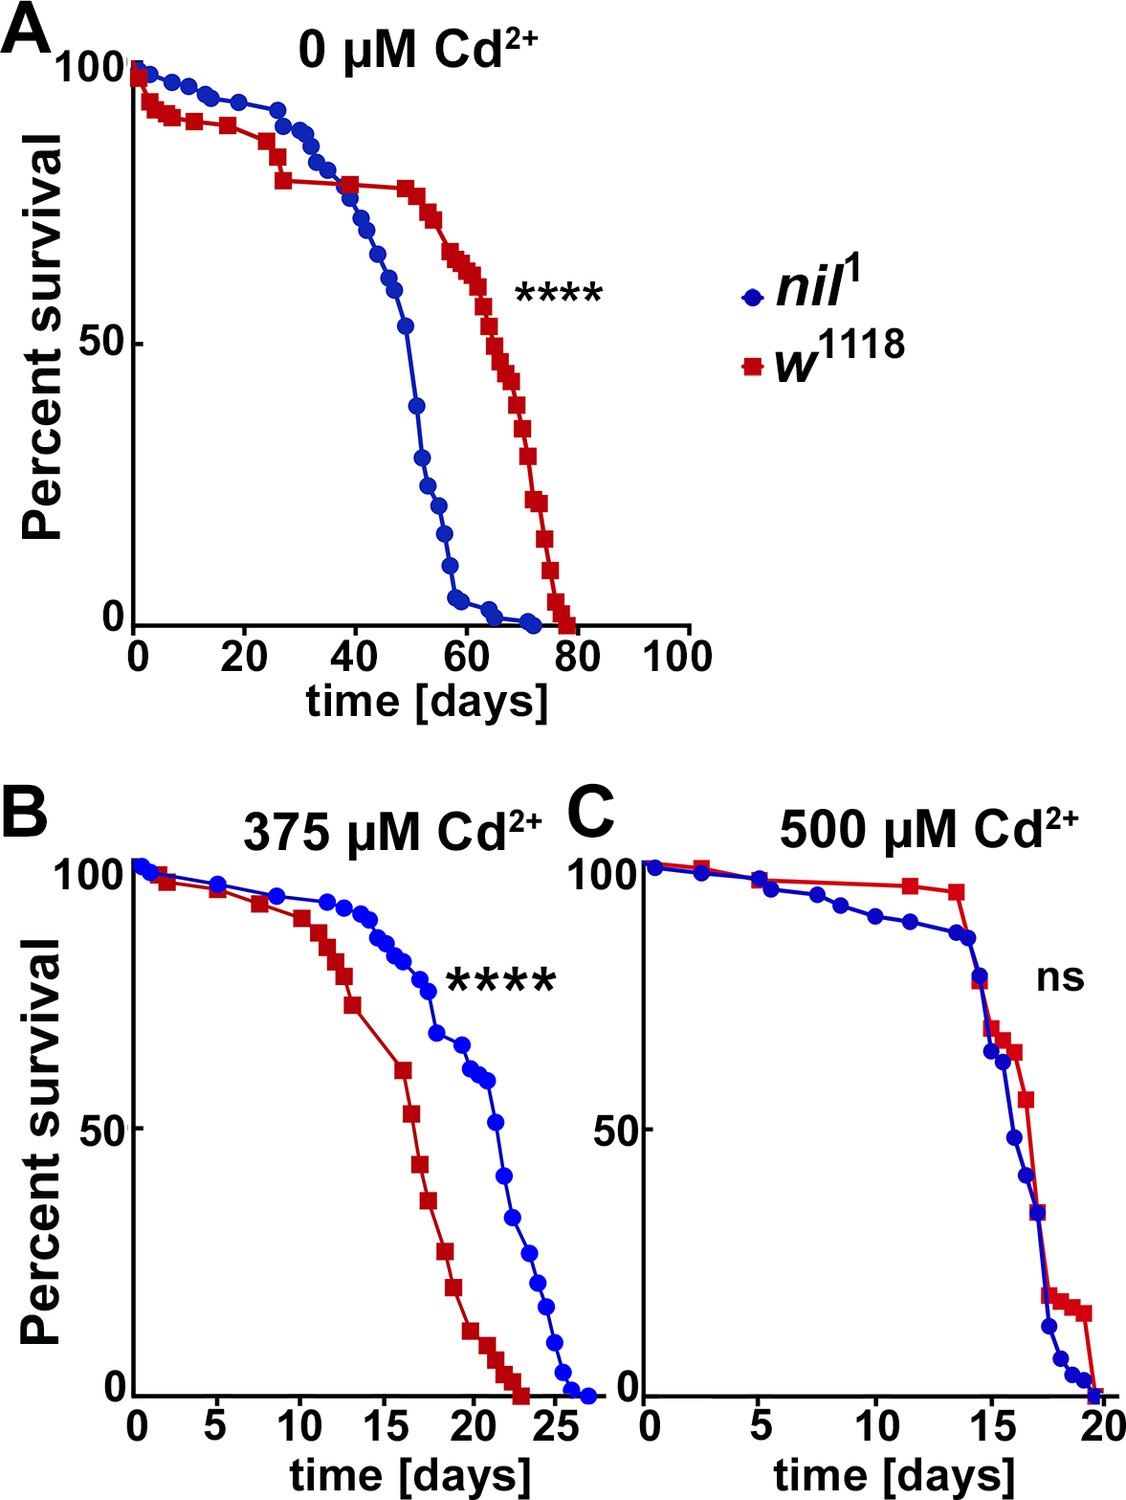
Survival curves for adult male w1118 and nil1 flies at different Cd2+ concentrations.
(A–C) Survival curves for w1118, and nil1 adult male flies either untreated (A) or treated with 375 µM CdCl2 (B), 500 µM CdCl2 (C). N was at least 130 (A), 74 (B), and 90 (C). Significance was assessed using log-rank Mantel-Cox test.: ns, not significant; ****p<0.0001. Genotypes are listed in Supplementary file 3.
Tables
Key resources table
| Reagent type (species) or resource | Designation | Source or reference | Identifiers | Additional information |
|---|---|---|---|---|
| Gene (Drosophila melanogaster) | Acinus (Acn) | GenBank | FLYB:FBgn0263198 | |
| Gene (Drosophila melanogaster) | Cyclin-dependent kinase 5 (Cdk5) | GenBank | FLYB:FBgn0013762 | |
| Gene (Drosophila melanogaster) | Cdk5 activator-like protein (p35) | GenBank | FLYB:FBgn0027491 | |
| Gene (Drosophila melanogaster) | CG6036 | GenBank | FLYB:FBgn0039421 | |
| Genetic reagent (Drosophila melanogaster) | w1118 | Bloomington Drosophila Stock Center | BDSC:3605; FLYB:FBst0003605; RRID:BDSC_3605 | |
| Genetic reagent (Drosophila melanogaster) | UAS-hPPM1B | Bloomington Drosophila Stock Center | BDSC:76916; FLYB: FBst0076916; RRID:BDSC_76916 | |
| Genetic reagent (Drosophila melanogaster) | p35-/- | PMID:17368005 | Gift from Edward Giniger, NINDS, Bethesda, Maryland, USA | |
| Genetic reagent (Drosophila melanogaster) | GMR-GAL4 | Bloomington Drosophila Stock Center | BDSC:1104; FLYB:FBst0001104; RRID:BDSC_1104 | |
| Genetic reagent (Drosophila melanogaster) | vas-Cas9(X) | BestGene | BDSC:1104; FLYB:FBst0055821; RRID:BDSC_55821 | |
| Genetic reagent (Drosophila melanogaster) | Da-GAL4 | Bloomington Drosophila Stock Center | BDSC: 55851; FLYB:FBst0055851; RRID:BDSC_55851 | |
| Genetic reagent (Drosophila melanogaster) | UAS-HTT-exon1-Q93 (human) | PMID:11607033 | Gift from Robin Hiesinger, Free University Berlin, Berlin, Germany | |
| Genetic reagent (Drosophila melanogaster) | For phosphatase RNAi lines screened the information is contained in Supplementary file 1 | |||
| Genetic reagent (Drosophila melanogaster) | YFP-MYC-Rab5 | PMID:25942626 | Gift from Marcos Gonzalez-Gaitan Marcos Gonzalez-Gaitan, MPI Dresden, Germany | |
| Genetic reagent (Drosophila melanogaster) | UAS-mCD8-GFP | FLYB:FBti0012686 | ||
| Genetic reagent (Drosophila melanogaster) | 20xUAS-6xmCherry-HA | BDSC:52267; FLYB:FBst0052267; RRID:BDSC_52267 | ||
| Genetic reagent (Drosophila melanogaster) | Nil1 | This paper | CRISPR/ Cas9 derived, details in “Methods” and Supplementary file 4 | |
| Genetic reagent (Drosophila melanogaster) | AcnS437A | This paper | CRISPR/ Cas9 derived, details in “Methods” and Supplementary file 4 | |
| Genetic reagent (Drosophila melanogaster) | NilTy1-T2A-Gal4 | This paper | CRISPR/ Cas9 derived, details in “Methods” and Supplementary file 4 | |
| Cell line (Drosophila melanogaster) | S2 | FBtc0000006 DGRC Cat# 6, RRID:CVCL_TZ72 | ||
| Transfected construct (Drosophila melanogaster) | pMT-Nil [WT]–3xFLAG-TST | This paper | ||
| Transfected construct (Drosophila melanogaster) | pMT-Nil [D231N]–3xFLAG-TST | This paper | ||
| Antibody | Anti-pS437-Acn (rabbit polyclonal) | Genemed Synthesis, PMID:29227247 | 1:1,000 (IF); Ab made against the Acn peptide H I V R D P- S(p)-P A R N R A S | |
| Antibody | Guinea pig anti-Acn (aa 423–599) (guinea pig polyclonal) | PMID:20504956 | 1:1,000 (IF) | |
| Antibody | Anti-Ty1 clone BB2 (mouse monoclonal) | Invitrogen | Invitrogen: MA5-23513, RRID:AB_2610644 | 1:2000 (WB), 1:500 (IF) |
| Antibody | Anti-hook (rabbit polyclonal) | PMID:8682859 | 1:5,000 (WB) | |
| Antibody | Anti-Actin JLA20 (mouse monoclonal) | Developmental Studies Hybridoma Bank | DSHB:JLA20; RRID:AB_528068 | 1:2000 (WB) |
| Antibody | Anti-p62 (rabbit polyclonal) | PMID:22952930 | Gift from G. Juhàsz, Eötvös Loránd University, Budapest, Hungary | 1:5,000 (WB) |
| Antibody | Anti-GABARAP [EPR4805] (rabbit monoclonal) | Abcam | Abcam:ab109364; RRID:AB_10861928 | 1:200 (IF), 1:1,000 (WB) |
| Antibody | Anti-Polyglutamine-Expansion Diseases Marker Antibody, clone 5TF1-1C2 (mouse monoclonal) | EMD Millipore | EMD Millipore:MAB1574; RRID:AB_94263 | 1:1,000(IF) |
| Antibody | Anti-V5 clone E10/V4RR (mouse monoclonal) | Invitrogen | Invitrogen:MA5-1525, RRID:AB_10977225 | 1:500 (IF) |
| Antibody | Anti-GFP clone B2 (mouse monoclonal) | Santa Cruz Biotechnology | SCB:sc-9996, RRID:AB_627695 | 1:100 (IF) |
| Antibody | Antiphospho-p44/42 MAPK (Erk1/2) (D13.14.4E) (Thr202/Tyr20) (rabbit monoclonal) | Cell Signaling Technology | CST:4,370 S, RRID:AB_2315112 | 1:200 (IF) |
| Antibody | Antiphospho-SAPK/JNK (G9) (Thr183/Tyr18) (mouse monoclonal) | Cell Signaling Technology | CST:9,255 S, RRID:AB_2307321 | 1:200 (IF) |
| Antibody | Antiphospho-p38 MAPK (D3F9) (Thr180/Tyr18) (rabbit monoclonal) | Cell Signaling Technology | CST:4,511 S, RRID:AB_2139682 | 1:500 (IF) |
| Antibody | Anti-Rab7 (rabbit polyclonal) | PMID:18272590 | Gift from Akira Nakamura, RIKEN Center for Devel. Biol., Kobe, Japan | 1:3,000 (IF); |
| Antibody | Anti-Arl8 (rabbit polyclonal) | PMID:30590083 | Gift from…… | 1:300 (IF) |
| Antibody | Alexa 488- or 568- or 647 secondaries | Molecular Probes | 1:500 (IF) | |
| Antibody | IRDye 800CW and 680RD Secondary Antibodies | LI-COR Biosciences | 1:15,000 (WB) | |
| Sequence-based reagent | DNA oligonucleotides used are listed in Supplementary file 4 | Integrated DNA Technologies | ||
| Commercial assay or kit | Revert 700 Total Protein Stain Kits | LI-COR Biosciences | LI-COR Biosciences:926–11010 | |
| Commercial assay or kit | High-Capacity cDNA Reverse Transcription kit | Applied Biosystems (now: Thermo Fischer Scientific) | Thermo Fischer Scientific:4368813 | |
| Chemical compound, drug | Tissue-Tek O.C.T. Compound | Sakura | Sakura:4,583 | |
| Chemical compound, drug | Cadmium Chloride Anhydrous | Fisher Scientific | Fischer Scientific: C10-500 | |
| Chemical compound, drug | H-XStable Prestained Protein Ladder | UBP-Bio | UBP-Bio:L2021 | |
| Chemical compound, drug | Fast SYBR Green Master Mix | Applied Biosystems | AB:4385610 | |
| Chemical compound, drug | VECTASHIELD Antifade Mounting Medium with DAPI | Vector Laboratories | Vector Laboratories:H-1200 | |
| Chemical compound, drug | cOmplete ULTRA Tablets, Mini, EASYpack Protease Inhibitor Cocktail | Roche | Roche:5892970001 | |
| Chemical compound, drug | Chloroquine | Sigma-Aldrich | Sigma-Aldrich:C6628-25G | |
| Software, algorithm | Imaris software | Bitplane | RRID:SCR_007370 | |
| Software, algorithm | Adobe Photoshop | Adobe | RRID:SCR_014199 | |
| Software, algorithm | ImageJ | NIH | RRID:SCR_003070 | |
| Software, algorithm | Image Studio ver 5.2 | LI-COR | RRID:SCR_015795 | |
| Software, algorithm | Prism | Graphpad | RRID:SCR_002798 | |
| Software, algorithm | SteREO Discovery.V12 | Carl Zeiss | ||
| Software, algorithm | CZFocus | Carl Zeiss | ||
| Software, algorithm | Helicon Focus | Helicon Soft |
Additional files
-
Supplementary file 1
Effect of knockdown of different phosphatases on eye roughness in a Acn gain-of-function model.
All flies were raised at 28°C.
Scores to calculate average roughness: normal = 1; mild = 2; rough = 3; strongly rough = 4.
Positive or negative numbers indicate suppression and enhancement, respectively.
Green or red colors highlight UAS-transgenes with more than 45% suppression or enhancement.
Numbers in parenthesis indicated stock numbers of the Bloomington Drosophila stock center.
- https://cdn.elifesciences.org/articles/72169/elife-72169-supp1-v3.docx
-
Supplementary file 2
Effect of loss and gain of phosphatase activity on eye pigmentation in a Drosophila Huntington’s model.
All flies were raised at 28°C. Scores to calculate depigmentation and roughness:
Score 1: No depigmentation and no roughness.
Score 2: Mild depigmentation and no roughness.
Score 3: Moderate depigmentation and roughness.
Score 4: Extreme depigmentation and roughness.
- https://cdn.elifesciences.org/articles/72169/elife-72169-supp2-v3.docx
-
Supplementary file 3
Genotypes of flies used for each figure.
The table list relevant genotype for flies used in each figure.
- https://cdn.elifesciences.org/articles/72169/elife-72169-supp3-v3.docx
-
Supplementary file 4
DNA oligonucleotides used.
The table contains sequences of DNA oligonucleotides used for this study.
- https://cdn.elifesciences.org/articles/72169/elife-72169-supp4-v3.docx
-
Transparent reporting form
- https://cdn.elifesciences.org/articles/72169/elife-72169-transrepform1-v3.pdf
Download links
A two-part list of links to download the article, or parts of the article, in various formats.
Downloads (link to download the article as PDF)
Open citations (links to open the citations from this article in various online reference manager services)
Cite this article (links to download the citations from this article in formats compatible with various reference manager tools)
A phosphoswitch at acinus-serine437 controls autophagic responses to cadmium exposure and neurodegenerative stress
eLife 11:e72169.
https://doi.org/10.7554/eLife.72169


