Emergence and function of cortical offset responses in sound termination detection
- Department of Biomedicine, Basel University, Switzerland
Figures
Figure 1 with 4 supplements
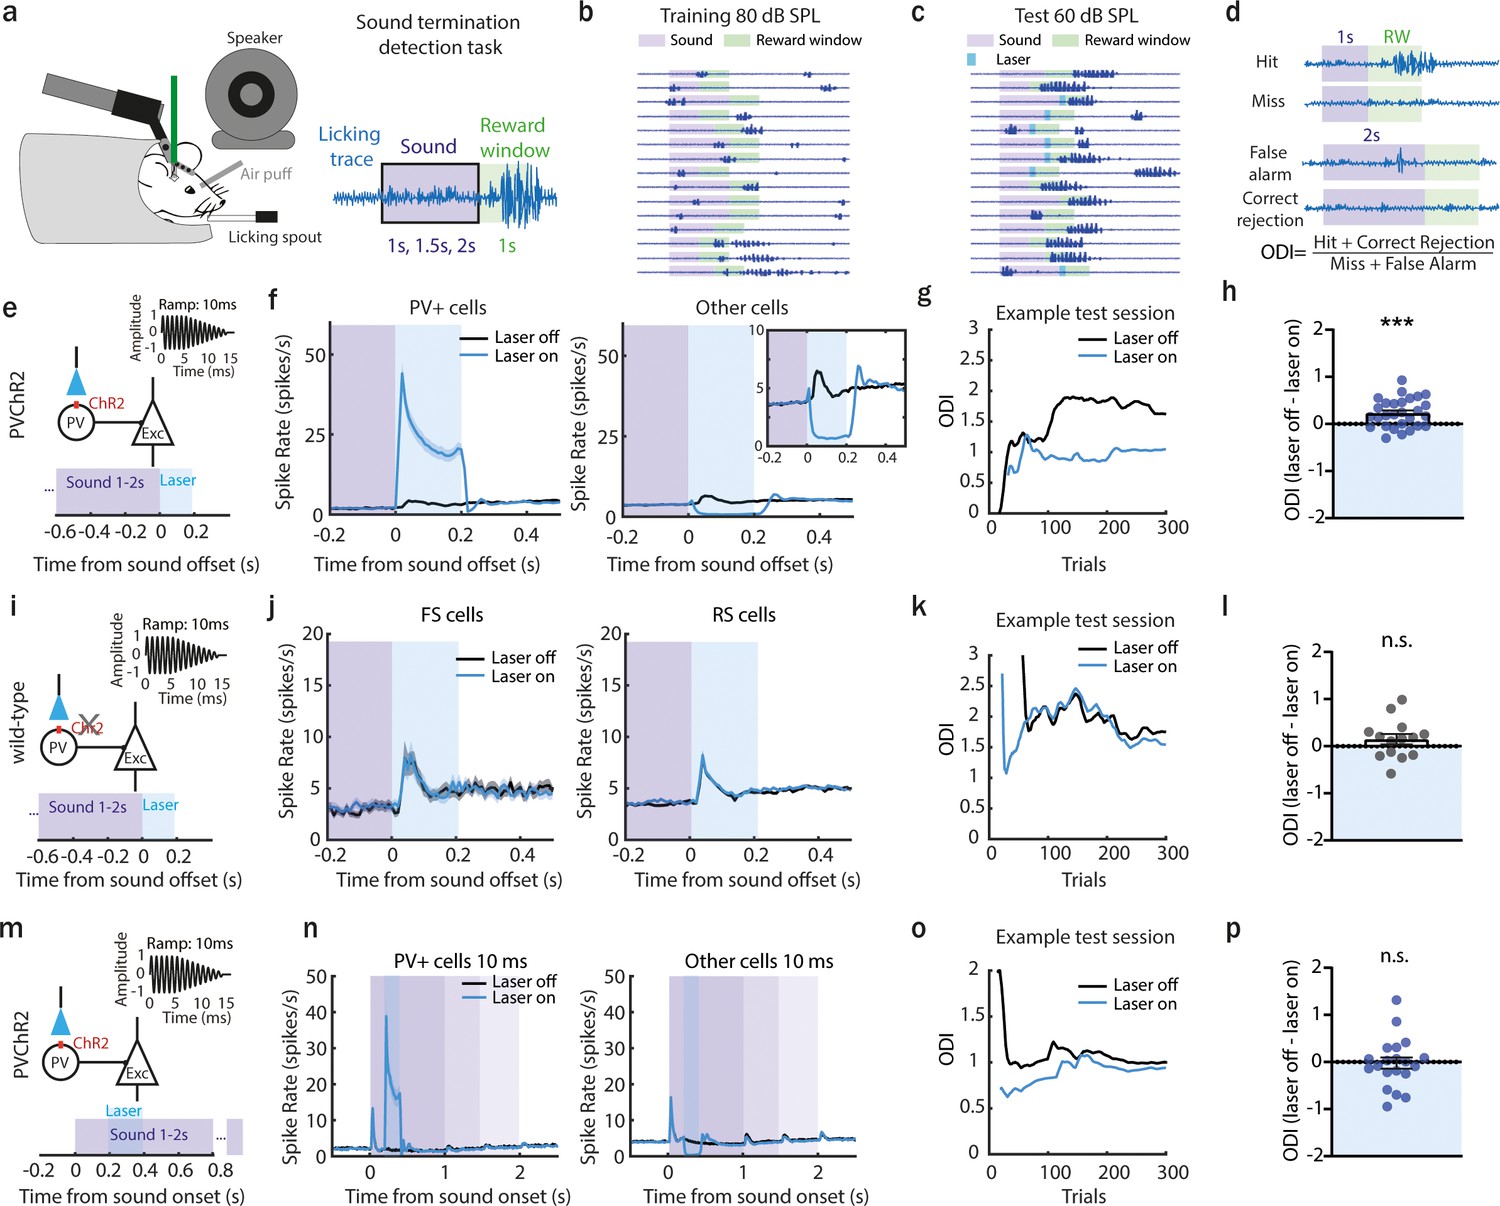
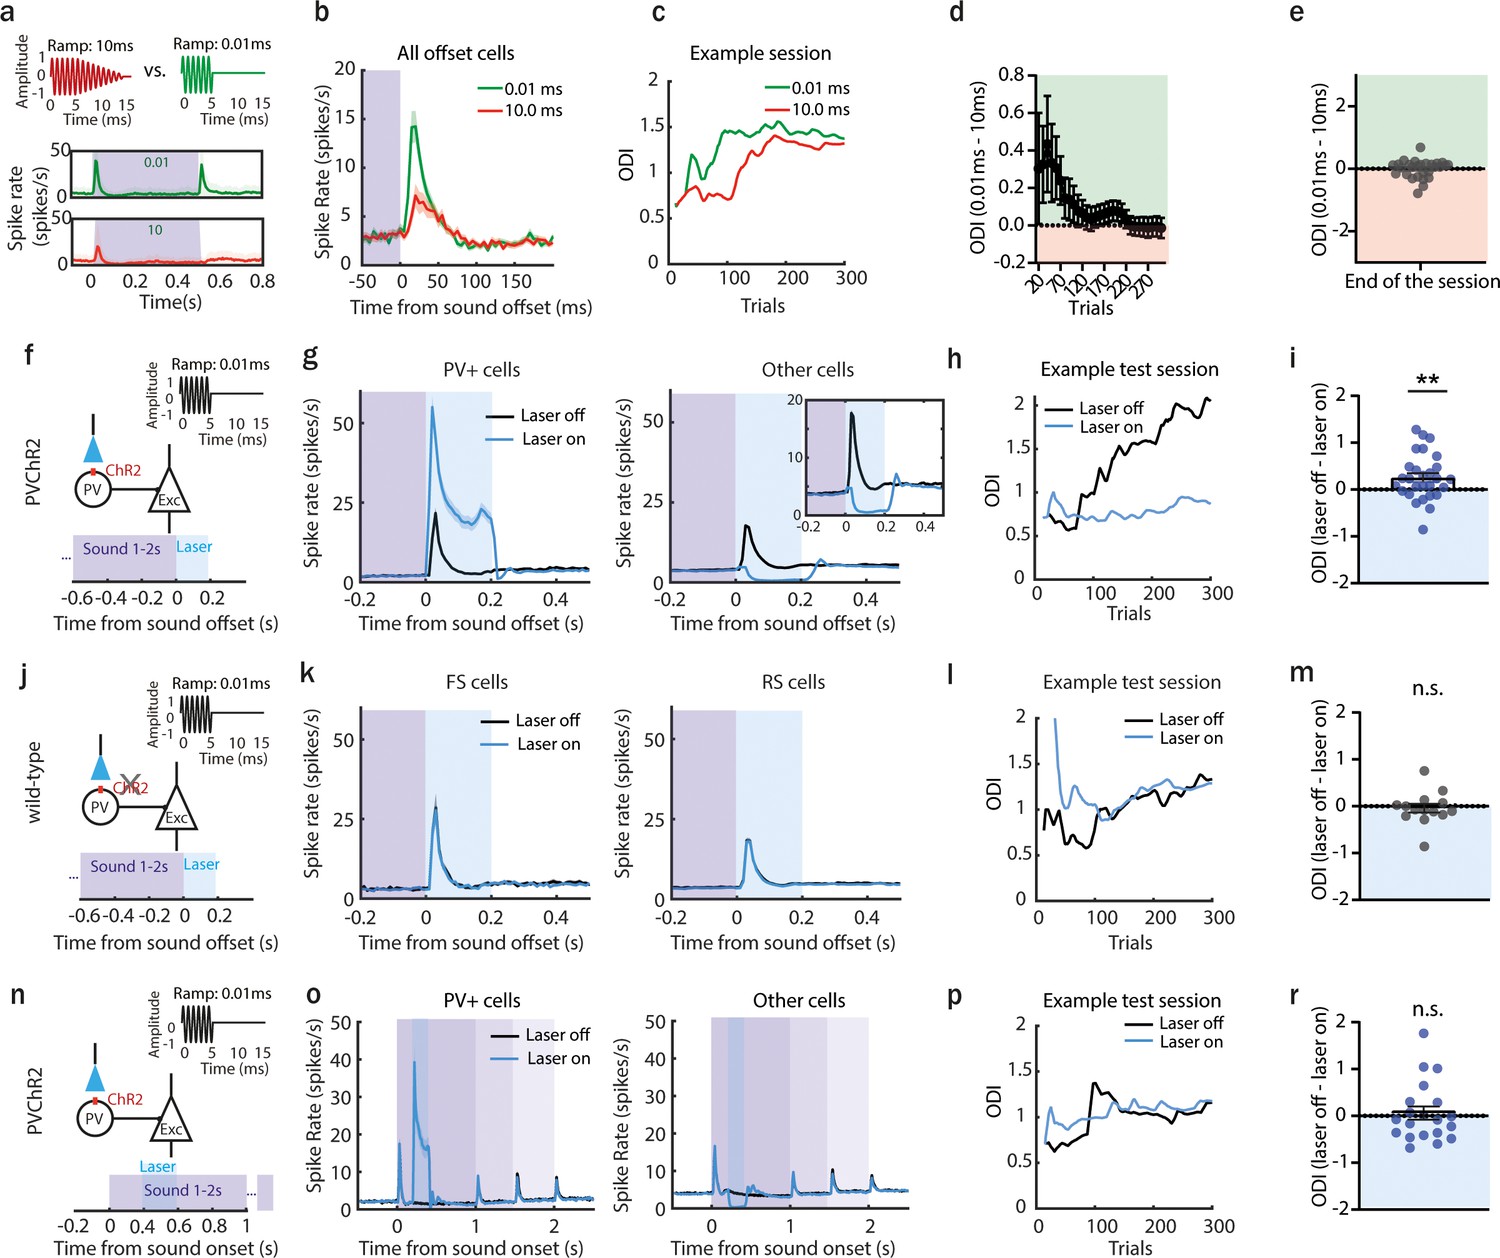
Preventing anterior auditory field (AAF) offset responses decreases the ability of a mouse to detect sound termination.
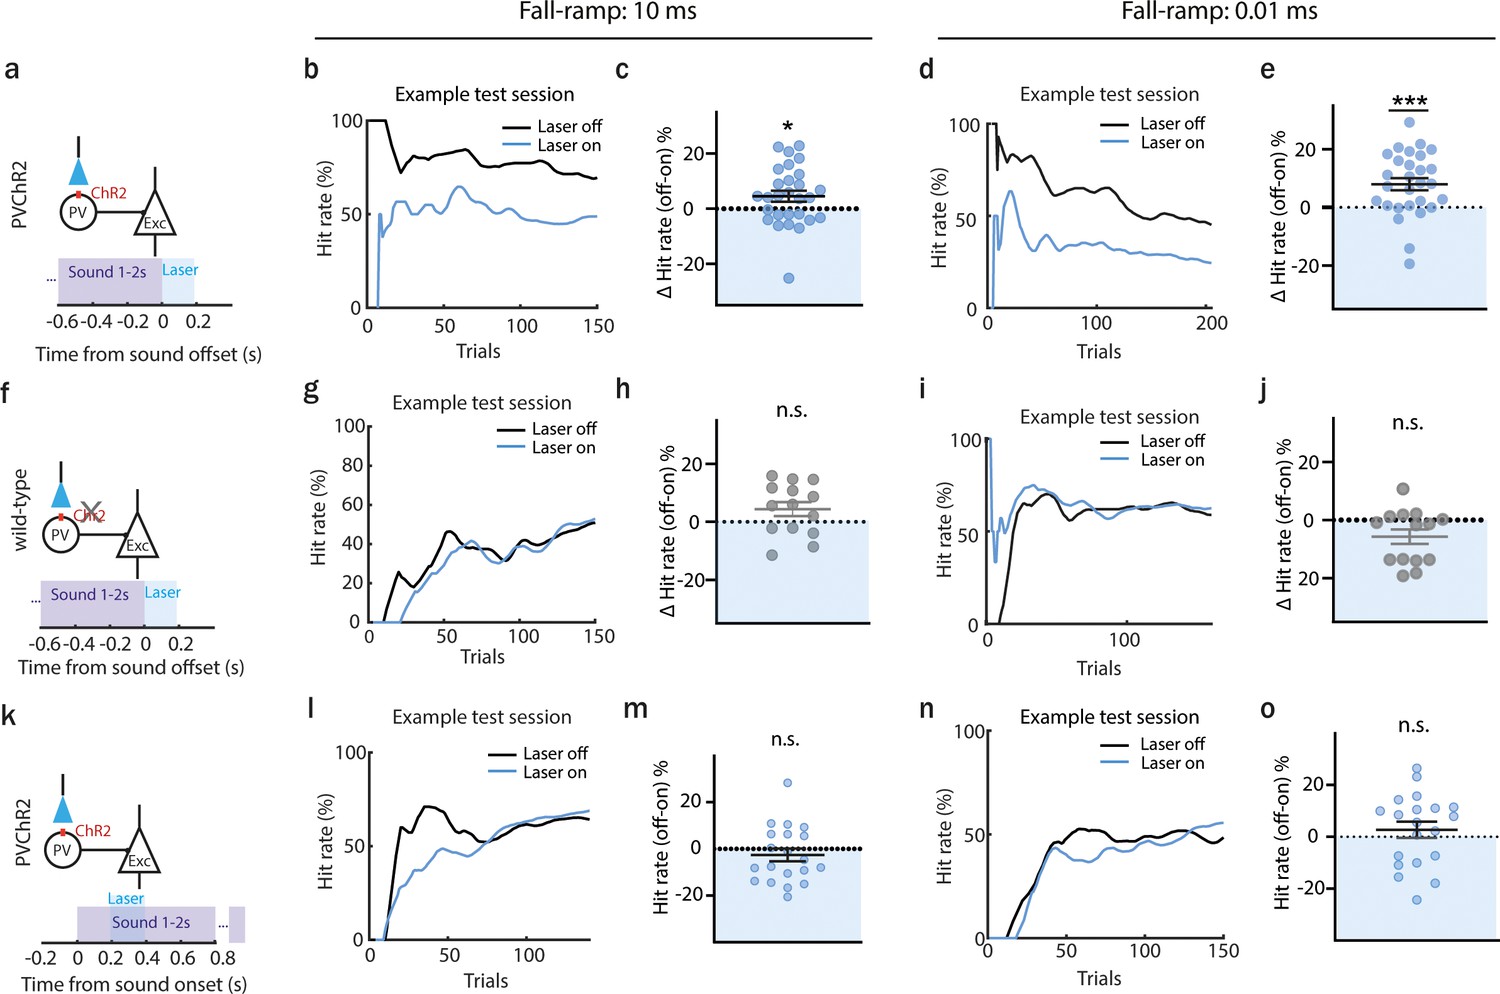
(a) Illustration of the head-fixed behavioral setup. A piezo sensor attached to the licking spout measured behavioral response to the detection of sound termination (left). Schematic of the behavioral paradigm of offset detection task. The animal had to detect the termination of 9 kHz pure tone (PT) played with three different durations: 1, 1.5, and 2 s within a reward window of 1 s. (b) Licking traces of 15 consecutive trials for 1 example training session. Violet bar indicates sound, green – reward window. During training sessions, sounds were presented at 80 dB SPL. (c) Licking traces of 15 consecutive trials for 1 example test session. Violet bar indicates sound, green – reward window, blue – laser window. During test sessions, sounds were presented at 60 dB SPL. Additionally, in half of the trials, a laser light was applied for 200 ms following sound termination. (d) Definition of calculated offset detection index (ODI). (e) Schematic of laser manipulation. The laser light was used for 200 ms following sound termination in animals expressing channelrhodopsin-2 (ChR2) in parvalbumin-positive (PV+) cells. (f) Population activity (mean ± standard error of mean [SEM]) of PV+ (n = 336 cells) or all other cells (n = 2249cells) following sound termination in laser-on (blue) and laser-off (black) trials, 28 sessions, 6 animals. Inset: zoom in. (g) ODI for an example session during the offset detection task. Blue and black lines represent the ODI for laser-on and laser-off trials, respectively. (h) The overall difference in ODI for laser-off and laser-on trials at the end of the training (mean ± SEM), ***p = 0.0005, n = 28 sessions, 6 animals, 1 sample Wilcoxon test. (i) Schematic of control experiment: a PT of 9 kHz was used, and the laser was applied for 200 ms following sound termination in wild-type animals. (j) Population activity (mean ± SEM) following sound termination in laser-on (blue) and laser-off (black) trials in putative fast (left, n = 103 cells, 14 sessions, 3 animals) and regular spiking neurons (right, n = 930 cells, 14 sessions, 3 animals). (k) ODI for an example session during offset detection task. Blue and black lines represent the ODI for laser-on and laser-off trials, respectively. (l) Difference in ODI for control animals in laser-off and laser-on trials at the end of the training (mean ± SEM), p = 0.24, n = 14 sessions, 3 animals, 1 sample Wilcoxon test. (m) Schematic of the experiment with laser suppression during the sound presentation: a 9 kHz PT was played, and the laser was applied for 200 ms following sound onset in animals expressing ChR2 in PV+ cells. (n) Population activity (mean ± SEM) in laser-on (blue) and laser-off (black) trials of PV+ cells (left, n = 269 cells, 20 sessions, 4 animals) and other cells (right, n = 1414 cells, 20 sessions, 4 animals). (o) ODI for an example session during offset detection task. Blue and black lines represent the ODI for laser-on and laser-off trials, respectively. (p) Difference in ODI for laser-off and laser-on trials at the end of the training (mean ± SEM), p = 0.67, n = 20 sessions, 4 animals, 1 sample Wilcoxon test.
Figure 1—figure supplement 1
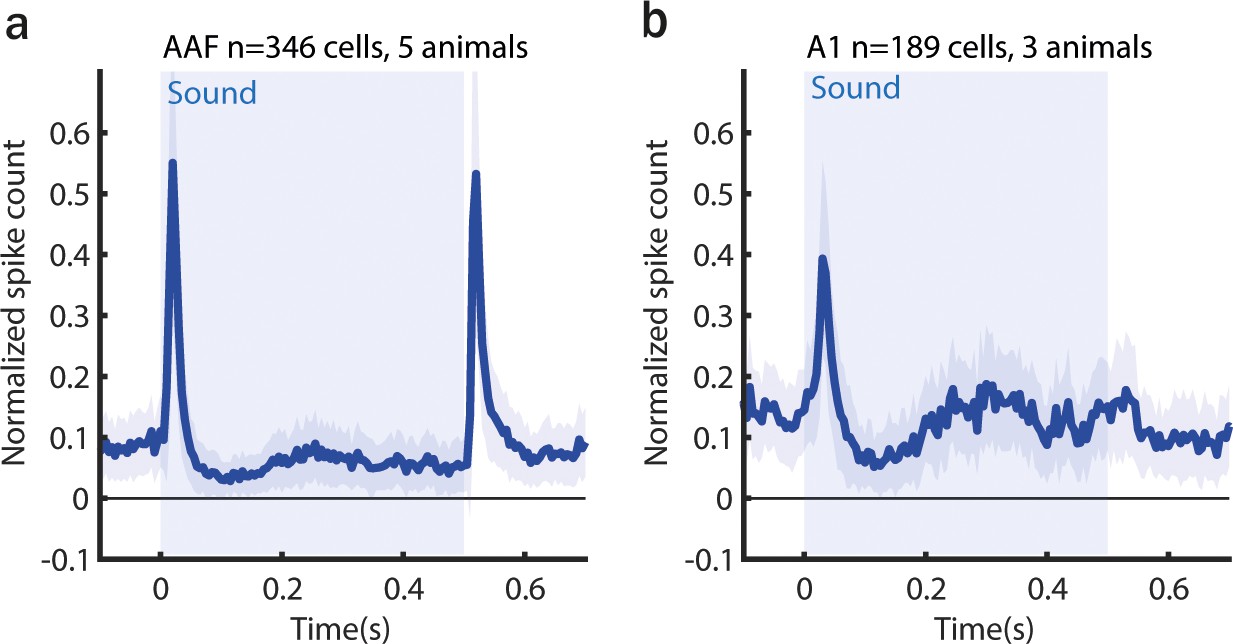
Averaged poststimulus time histogram (PSTH; mean ± standard error of mean [SEM]) of anterior auditory field (AAF) (a) and A1 (b) neuron responses to 0.5 s long pure tone (PT; 9 kHz) played at 60 dB SPL.
Figure 1—figure supplement 2
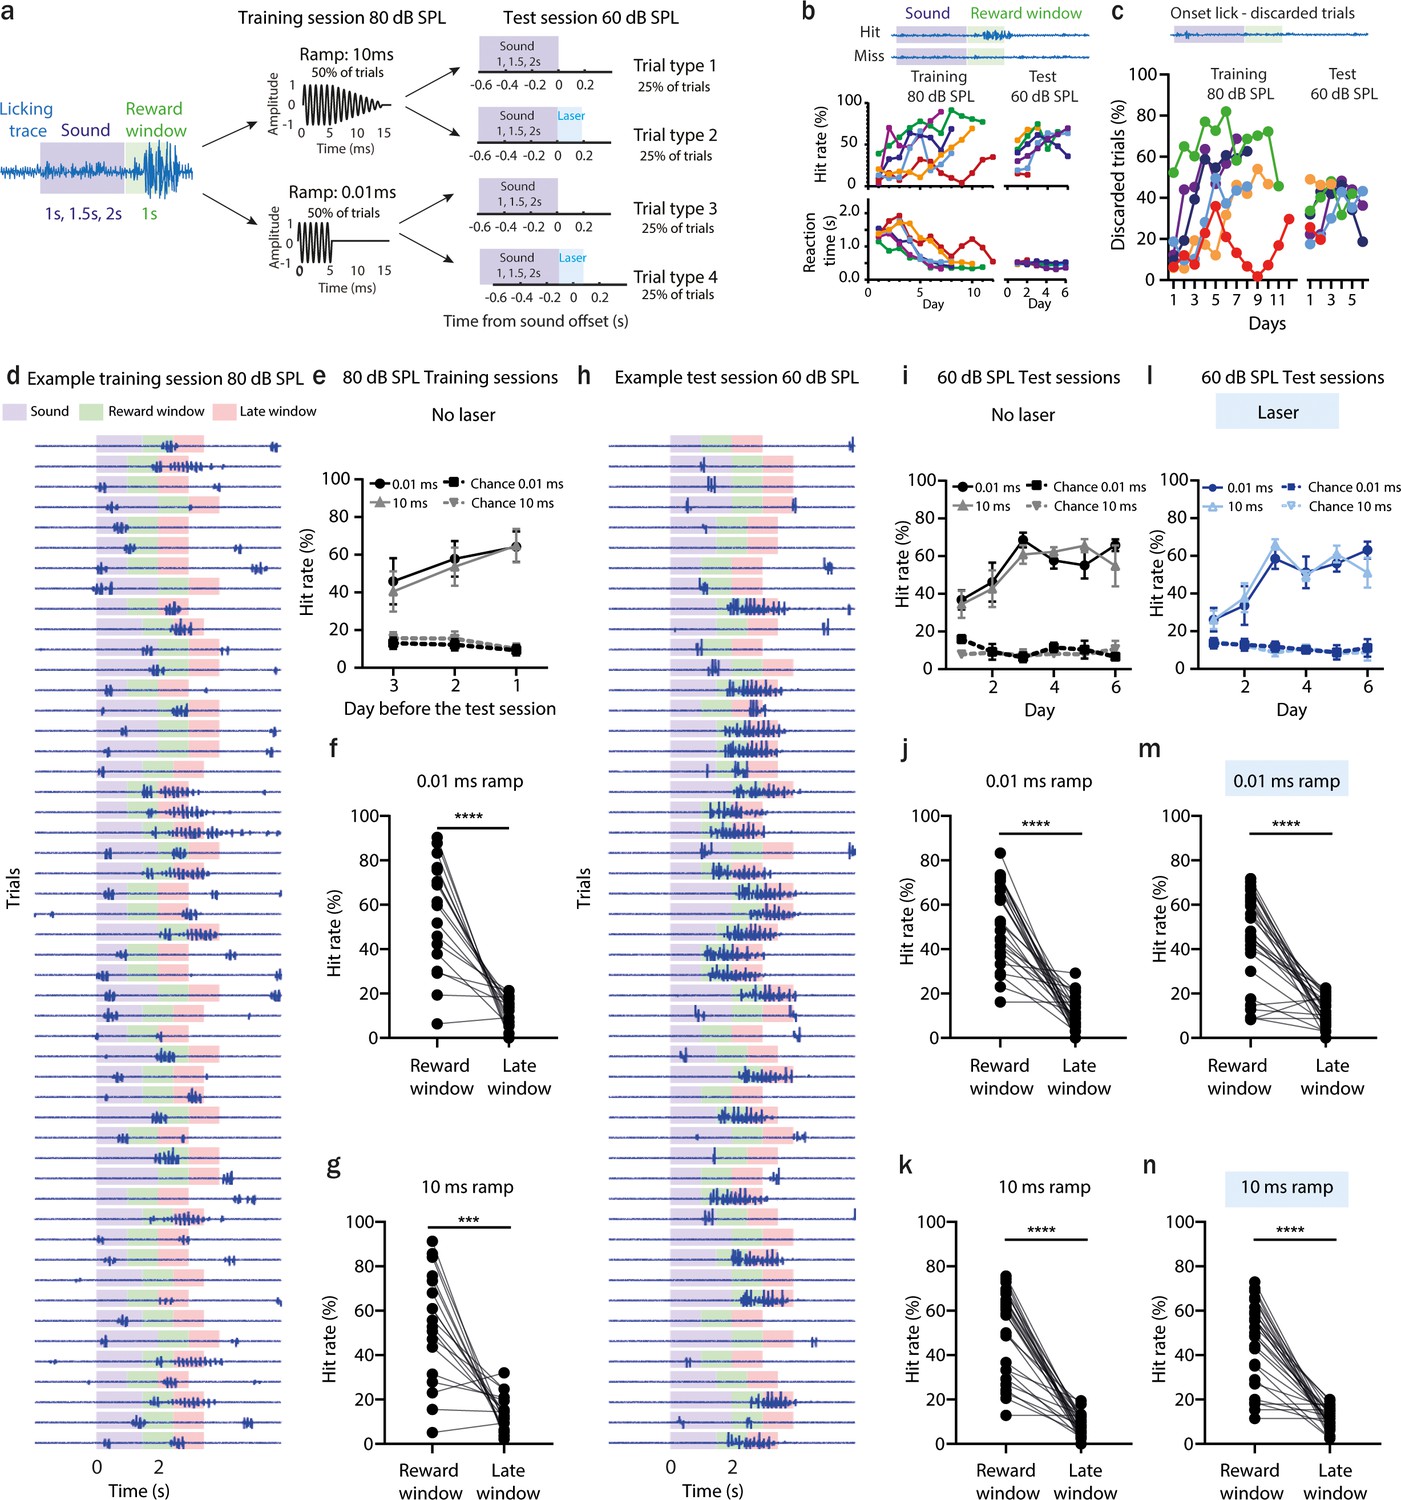
A detailed description of the sound termination detection task in parvalbumin (PV)-channelrhodopsin-2 (ChR2) mice.
(a) Schematic of the behavioral paradigm of the offset detection task. Mice had to detect sound termination of 9 kHz pure tone played with three different durations: 1, 1.5, and 2 s within a reward window of 1 s. During training sessions, sounds were terminated with fast or slow ramps and presented at 80 dB SPL. During test sessions, sounds were terminated with fast or slow ramps and delivered at 60 dB SPL. Additionally, in half of the trials, a laser light was applied for 200 ms following sound termination. (b) Indications of successful learning. Increasing hit rate of offset detection over training days (top, n (sample size) = 6 animals). Decreasing reaction time for offset detection over training days (bottom, n = 6 animals). (c) Percent of discarded trials during training and test sessions where animals licked before sound termination. (d) Licking traces of 50 consecutive trials for 1 example training session. Violet bar indicates sound, green – reward window, red – late window. (e) Comparison of hit rate and licks at chance level for the three last training days. The chance level was calculated as a hit rate during the late window. (f) Comparison of hit rate for sounds terminated with fast ramp (0.01 ms) and licks at chance level for three last training days, ****p < 0.0001, Wilcoxon test. (g) Comparison of hit rate for sounds terminated with slow ramp (10 ms) and licks at chance level for three last training day, ***p = 0.0001, Wilcoxon test. (h) Same as in d but for a test session. (i) Same as in (e) but for a test session. (j) Comparison of hit rate for sounds terminated with fast ramp (0.01 ms) and licks at chance level for all test days, ****p < 0.0001, Wilcoxon test. (k) Comparison of hit rate for sounds terminated with slow ramp (10 ms) and licks at chance level for all test days, ****p < 0.0001, Wilcoxon test. (l, m) Same as in (i) – (k) but for laser-on trials. ****p < 0.0001, Wilcoxon test.
Figure 1—figure supplement 3
Evaluation of animal’s behavior in sound termination detection task based on hit rate.
(a) Schematic of laser manipulation. (b) Hit rates within an example session during offset detection task. Blue and black lines represent the hit rate for laser-on and laser-off trials, respectively. (c) The overall difference in correct hit rate for laser-off and laser-on trials at the end of the training (mean ± standard error of mean [SEM]), *p = 0.0264, n (sample size) = 28 sessions, 6 animals, 1 sample Wilcoxon test. (d) Hit rates within an example session during offset detection task. Blue and black lines represent the hit rate for laser-on and laser-off trials, respectively. (e) Difference in correct hit rate for laser-off and laser-on trials at the end of the training (mean ± SEM), ***p = 0.0006, n = 28 sessions, n = 6 animals, 1 sample Wilcoxon test. (f) Schematic of laser manipulation. (g) Hit rates within an example session during offset detection task. Blue and black lines represent the hit rate for laser-on and laser-off trials, respectively. (h) Difference in correct hit rate for control animals in laser-off and laser-on trials at the end of the training (mean ± SEM), p = 0.058, n = 14 sessions, 3 animals, 1 sample Wilcoxon test. (i) Hit rates within an example session during offset detection task. Blue and black lines represent the hit rate for laser-on and laser-off trials, respectively. (j) Difference in correct hit rate for control animals in laser-off and laser-on trials at the end of the training (mean ± SEM), p = 0.0906, n = 14 sessions, 3 animals, 1 sample Wilcoxon test. (k) Schematic of laser manipulation. (l) Hit rates within an example session during offset detection task. Blue and black lines represent the hit rate for laser-on and laser-off trials, respectively. (m) Difference in correct hit rate for laser-off and laser-on trials at the end of the training (mean ± SEM), p = 0.2611, n = 20 sessions, 4 animals, 1 sample Wilcoxon test. (n) Hit rates within an example session during offset detection task. Blue and black lines represent the hit rate for laser-on and laser-off trials, respectively. (o) Difference in correct hit rate for laser-off and laser-on trials at the end of the training (mean ± SEM), p = 0.3683, n = 20 sessions, 4 animals, 1 sample Wilcoxon test.
Figure 1—figure supplement 4
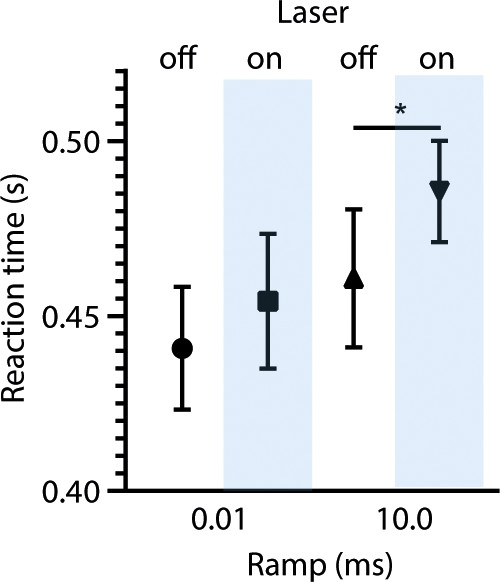
Comparison of reaction times in sound termination detection task for trials with fast (0.01 ms) and slow (10.0 ms) fall-ramp and trials without and with laser stimulation.
*p = 0.0218, Wilcoxon test.
Figure 2 with 2 supplements
Larger offset responses correlate with better detection of sound termination.
(a) Sounds used in the behavioral task (0.01 or 10 ms fall-ramp) and poststimulus time histogram (PSTH; mean ± standard deviation [STD]) of responses they evoked in acute anterior auditory field (AAF) recordings. (b) PSTH (mean ± standard error of mean [SEM]) averaged over AAF neurons (n = 169, 2 animals) during sound termination detection task (green line: 0.01 ms fall-ramp; red line: 10.0 ms fall-ramp). (c) Offset detection index (ODI) of example session during offset detection task. Green and red lines represent the ODI for short (0.01 ms) and long (10 ms) offset ramps. (d) The difference in ODI for sounds with short and long fall-ramps through the behavior session, n = 28 sessions, 10 animals. Green and red shaded areas indicate that offset detection was better for short or long ramps, respectively. (e) Comparison of ODI for 0.01 and 10.0 ms ramp at the end of the session (p > 0.99, n = 28 sessions, 10 animals, 1 sample Wilcoxon test). (f) Schematic of experimental design: a 9 kHz pure tone (PT) with 0.01 ms fall-ramp was used, and the laser was applied for 200 ms following sound termination in animals expressing channelrhodopsin-2 (ChR2) in parvalbumin-positive (PV+) cells. (g) The activity of PV+ cells (mean ± SEM) following sound termination in laser-on (blue) and laser-off (black) trials (left), n = 336 cells, 28 sessions, 6 animals. The activity of other cells (mean ± SEM) following sound termination in laser-on (blue) and laser-off (black) trials (right), n = 2249 cells, 28 sessions, 6 animals. (h) ODI within an example session during offset detection task. Blue and black lines represent ODI for laser-on and laser-off trials, respectively. (i) Difference in ODI for laser-off and laser-on trials at the end of the training (mean ± SEM), **p = 0.0095, n = 28 sessions, n = 6 animals, 1 sample Wilcoxon test. (j) Schematic of control experiment: a sound of 9 kHz with 0.01 ms fall-ramp was used, and the laser was applied for 200 ms following sound termination in wild-type animals. (k) Population activity (mean ± SEM) following sound termination in laser-on (blue) and laser-off (black) trials in fast (left), n = 103 cells, 14 sessions, 3 animals, and regular spiking neurons (right), n = 930 cells, 14 sessions, 3 animals. (l) ODI for an example session during offset detection task. Blue and black lines represent ODI for laser-on and laser-off trials, respectively. (m) Difference in ODI for control animals in laser-off and laser-on trials at the end of the training (mean ± SEM), p = 0.41, n = 14 sessions, 3 animals, 1 sample Wilcoxon test. (n) Schematic of the experiment with laser suppression during the sound presentation: a 9 kHz PT with 0.01 ms fall-ramp was played, and the laser was applied for 200 ms following sound onset in animals expressing ChR2 in PV+ cells. (o) Population activity (mean ± SEM) in laser-on (blue) and laser-off (black) trials of PV+ cells (left), n = 269 cells, 20 sessions, 4 animals, and other cells (right), n = 1414 cells, 20 sessions, 4 animals. (p) ODI for an example session during offset detection task. Blue and black lines represent the ODI for laser-on and laser-off trials, respectively. (r) Difference in ODI for laser-off and laser-on trials at the end of the training (mean ± SEM), p = 0.74, n = 20 sessions, 4 animals, 1 sample Wilcoxon test.
Figure 2—figure supplement 1
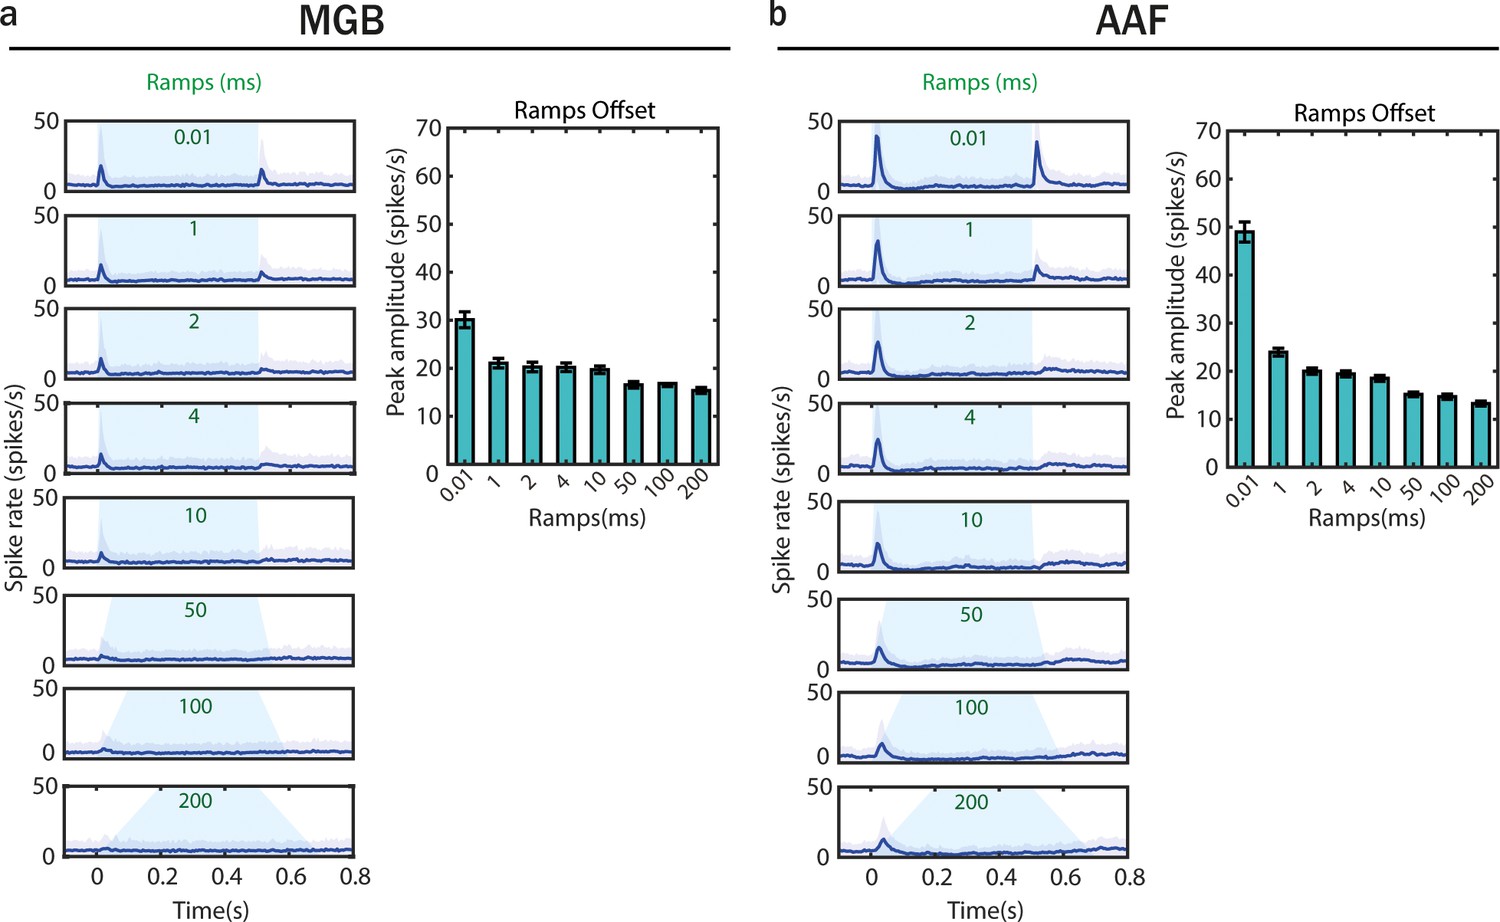
Offset responses evoked by sounds terminated with different fall-ramps emerge already in medial geniculate body (MGB).
Figure 2—figure supplement 2
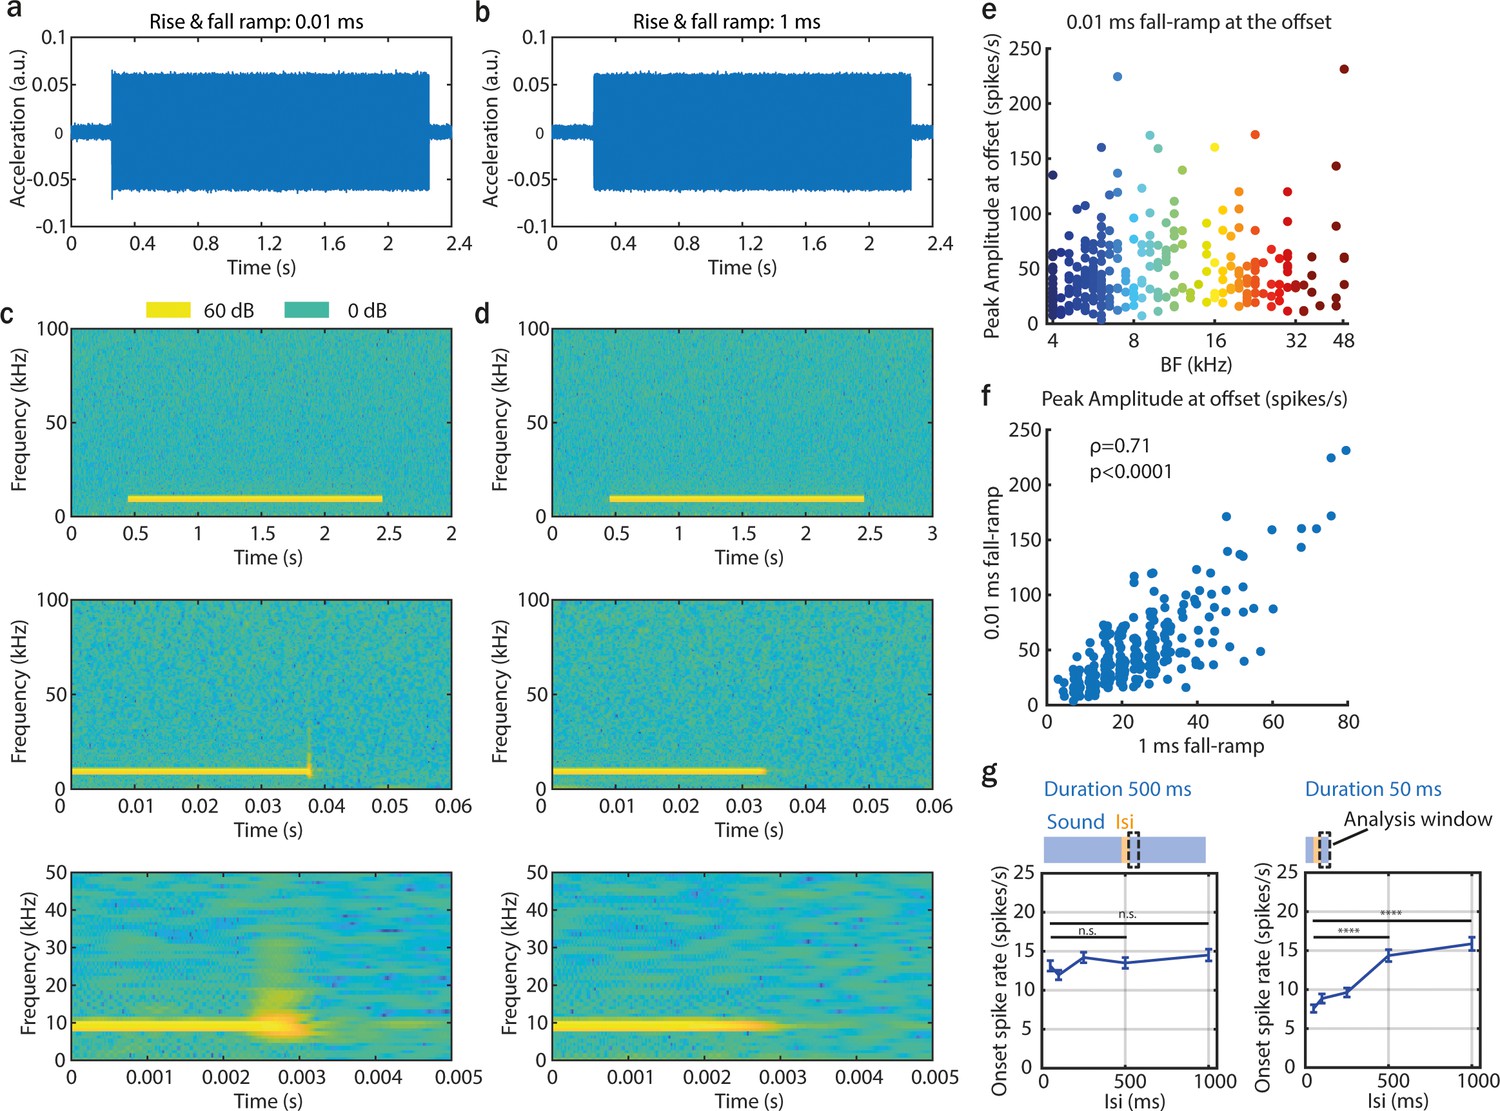
Properties of 9 kHz pure tones played at 60 dB SPL with different rise- and fall-ramps.
Acceleration traces of 9 kHz pure tone played at 60 dB SPL with 0.01 ms (a) and 1 ms (b) rise- and fall-ramp measured with an ultrasensitive microphone (Avisoft-Bioacoustics CM16/CMPA). Spectrograms of a 9 kHz pure tone played at 60 dB SPL with 0.01 ms (c) and 1 ms (d) rise- and fall-ramp. (e) The peak amplitude of offset responses evoked by 0.01 ms fall-ramp as a function of onset best frequency. (f) Comparison of the peak amplitude of offset responses evoked by 0.01 and 1 ms fall-ramp (ρ = 0.71, ****p < 0.0001, Spearman correlation). (g) Modulation of onset responses by preceding offset (left) or onset (right) responses.
Figure 3
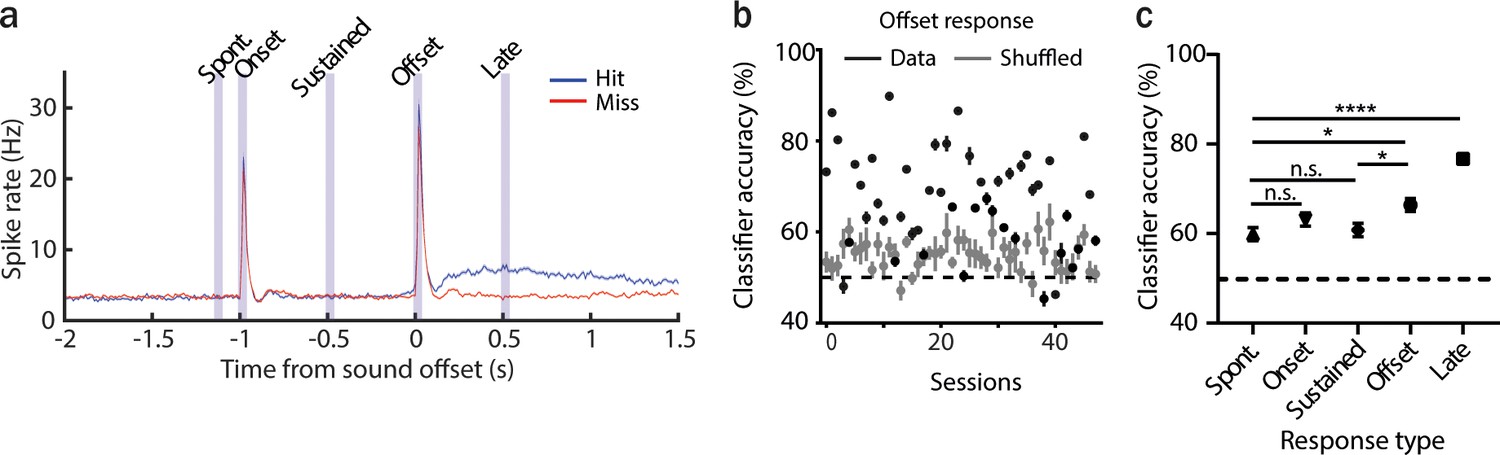
The activity of anterior auditory field (AAF) neurons can be predictive of animal performance.
(a) Averaged poststimulus time histogram (PSTH; mean ± standard error of mean [SEM]) of AAF neuron responses to 1 s long pure tone (PT; 9 kHz) played at 60 dB SPL during hit (blue) and miss (red) trials, n = 5076 cells, 59 sessions, 12 animals. (b) Classification accuracy based on offset responses (mean ± SEM) for real and shuffled data. (c) Comparison of classifier accuracy of decoders trained and tested on spontaneous activity, onset, sustained, offset, and the late response of AAF neurons (mean ± SEM): spont. vs offset: p = 0.027; offset vs sustained: *p = 0.037; spont. vs. late: ****p < 0.0001, n = 48 sessions, 12 animals, Friedman test with multiple comparisons.
Figure 4 with 2 supplements
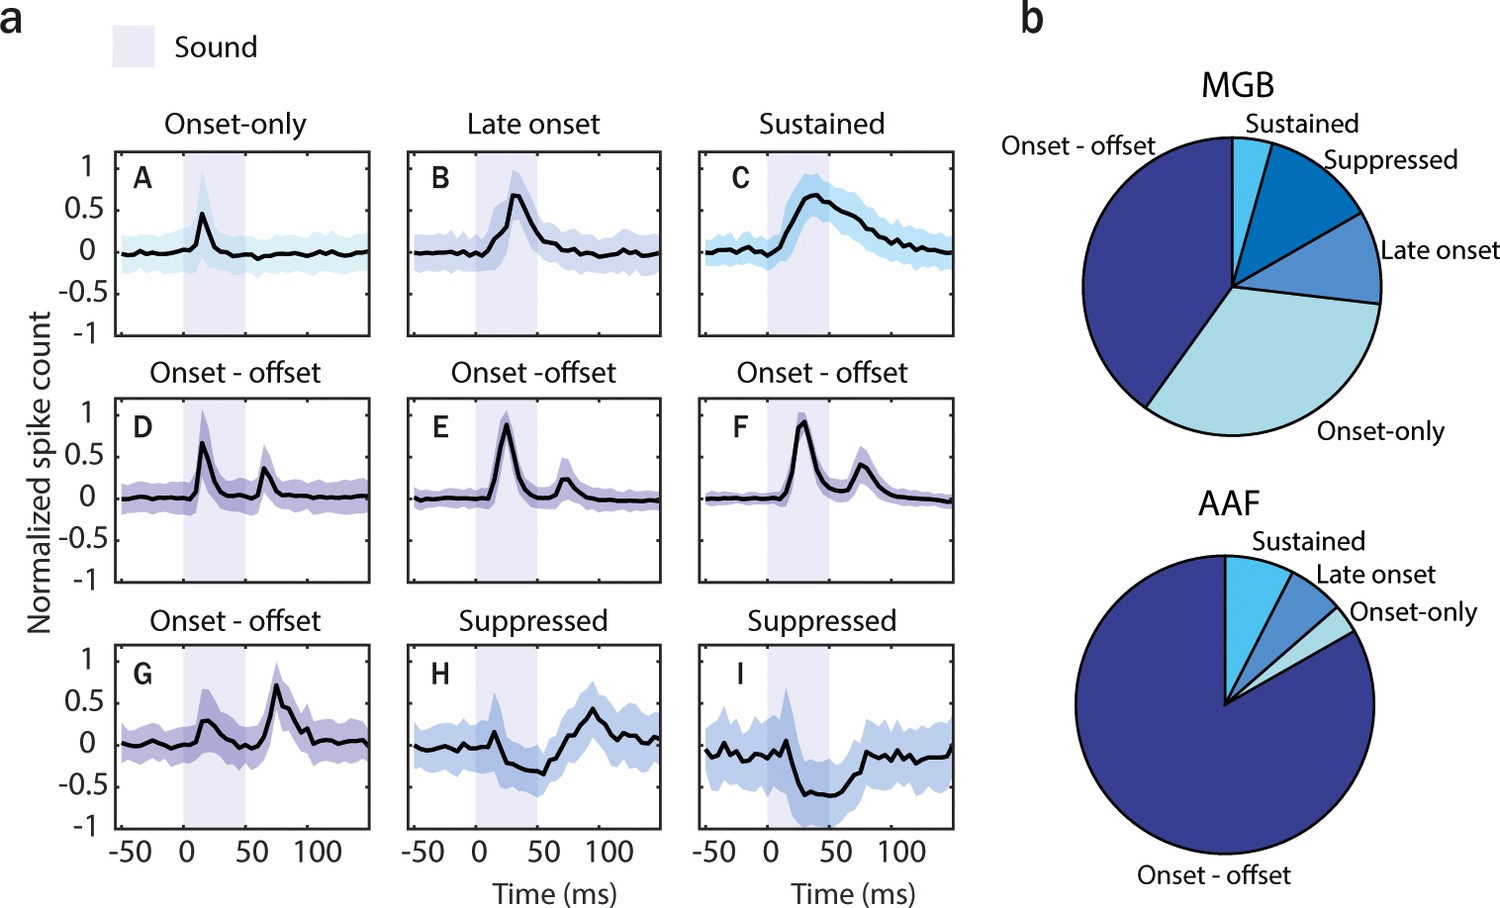
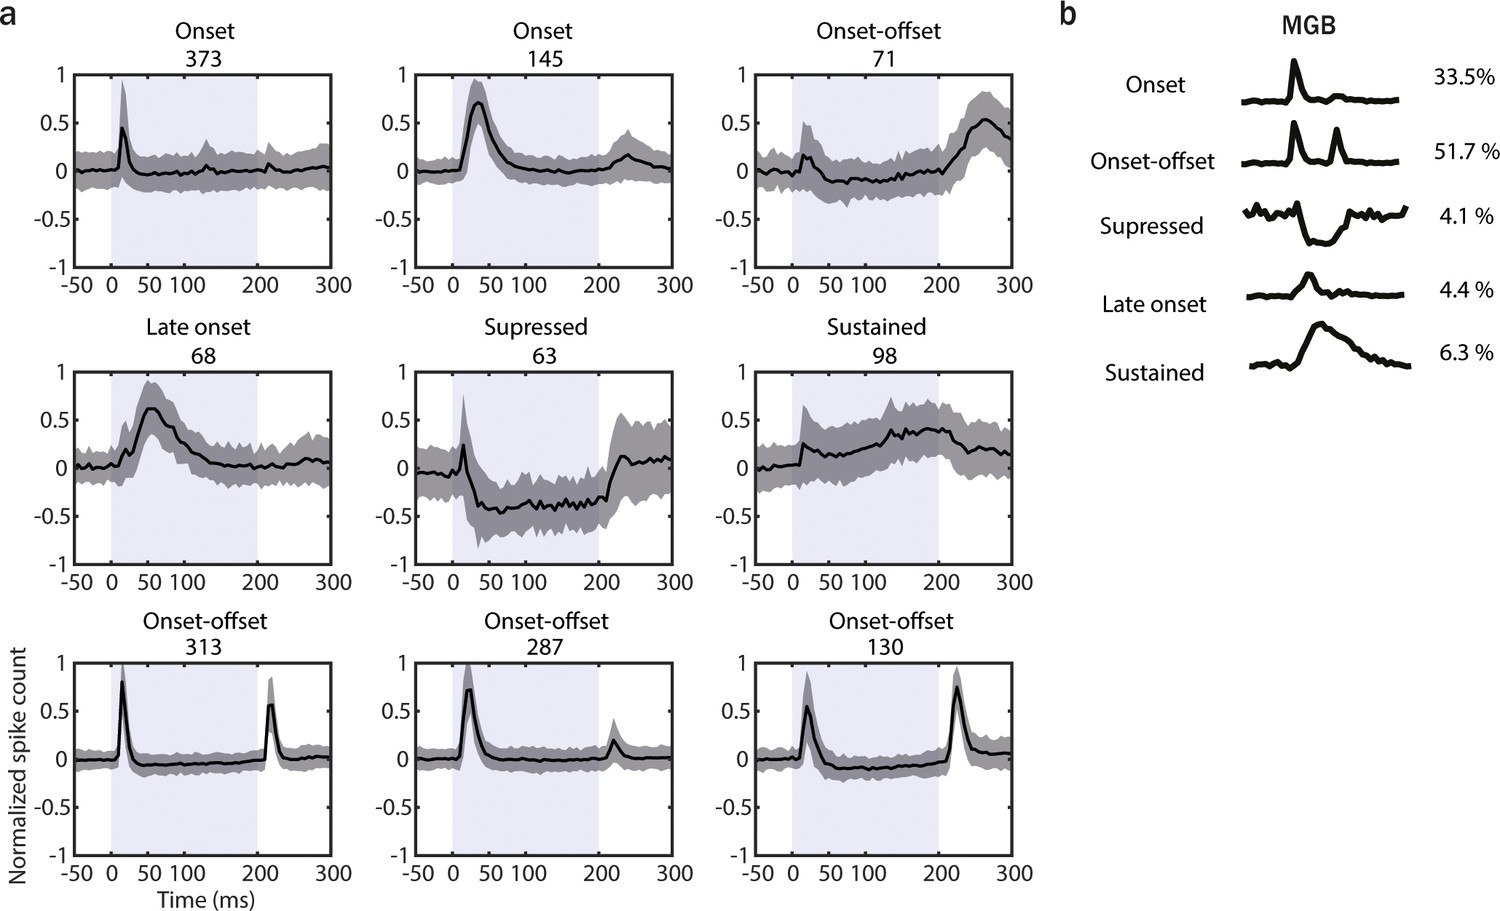
Anterior auditory field (AAF) has significantly more offset-responsive neurons than its input nucleus.
(a) Results of k-means clustering performed on both medial geniculate body (MGB; n = 779, 6 animals) and AAF (n = 346, 6 animals) neuron’s responses (time window: 25–75 ms, bin size: 5 ms) evoked by 50 ms pure tone (PT) with varied frequency (4–48.5 kHz) and sound level (0–80 dB SPL) presented with randomized interstimulus interval (ISI; 500–1000 ms). Graphs represent the mean signal of cells belonging to each cluster. Data represent mean ± STD. The blue shaded bars represent the tone. (b) Representation of cells with distinct temporal dynamic of responses in MGB (onset-only [A]: 40.1%, late-onset [B]: 10.2%, sustained [C]: 4.4%, onset–offset [D-G]: 33.0%, and suppressed [H-I]: 12.3%) and AAF (onset-only [A]: 3.2%, late-onset [B]: 6.1%, sustained [C]: 7.5%, and onset–offset [D-G]: 83.2%). See also Figure 4—figure supplements 1 and 2.
Figure 4—figure supplement 1
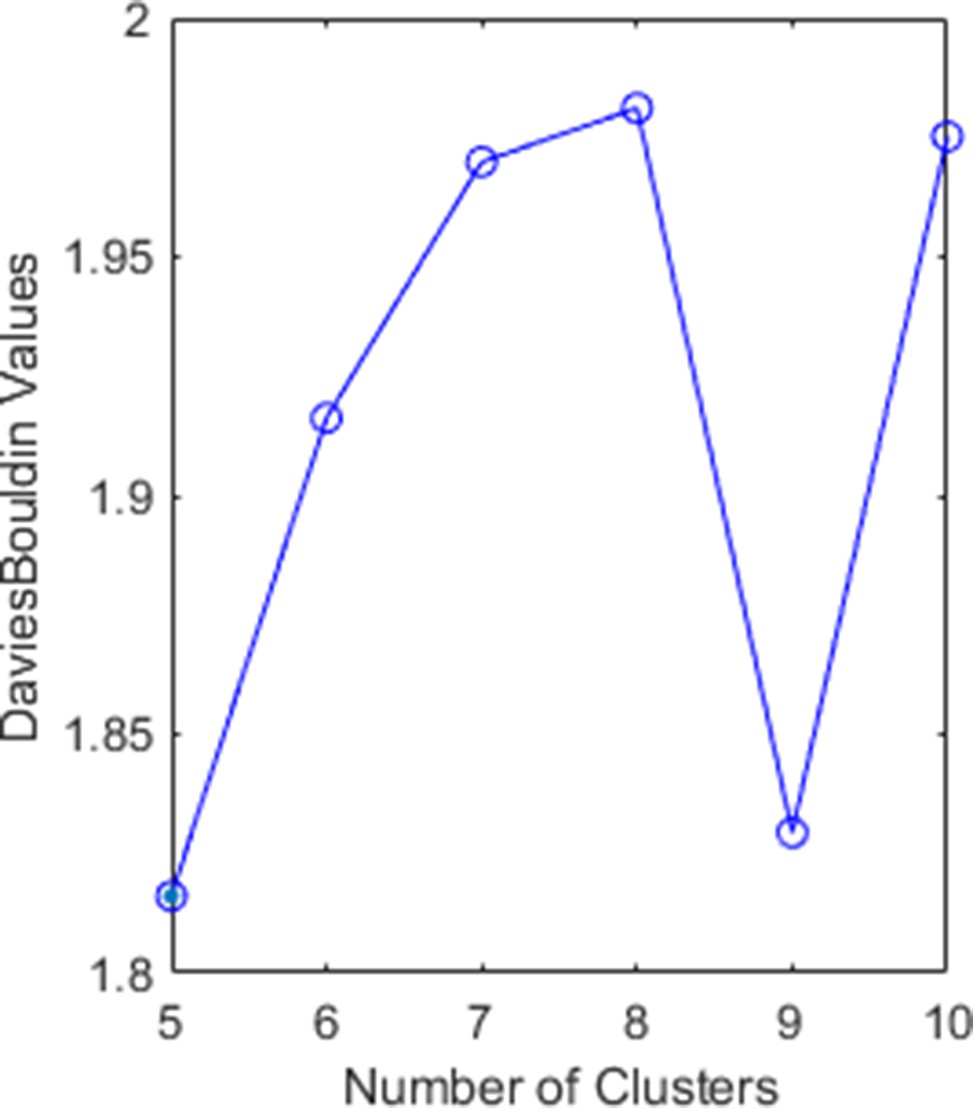
Davies–Bouldin index for a different number of clusters.
The minimum value is reached for five and nine clusters.
Figure 4—figure supplement 2
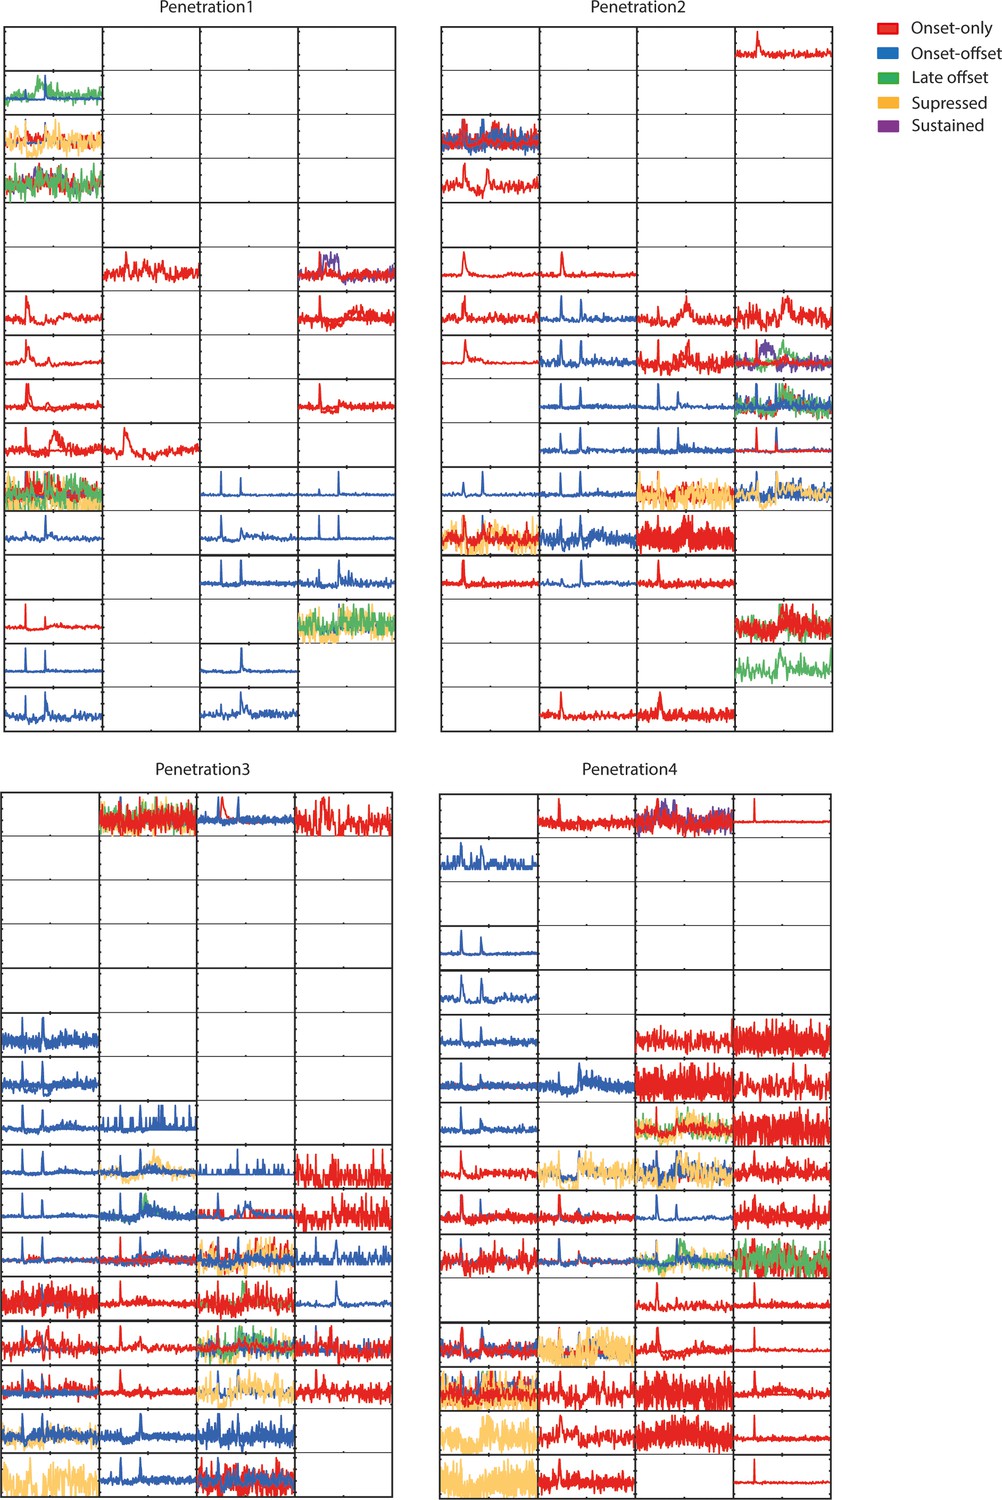
2D representation of temporal dynamics of medial geniculate body (MGB) cells recorded during 4 experiments with a 64-channel electrode (16 × 4).
Figure 5 with 1 supplement
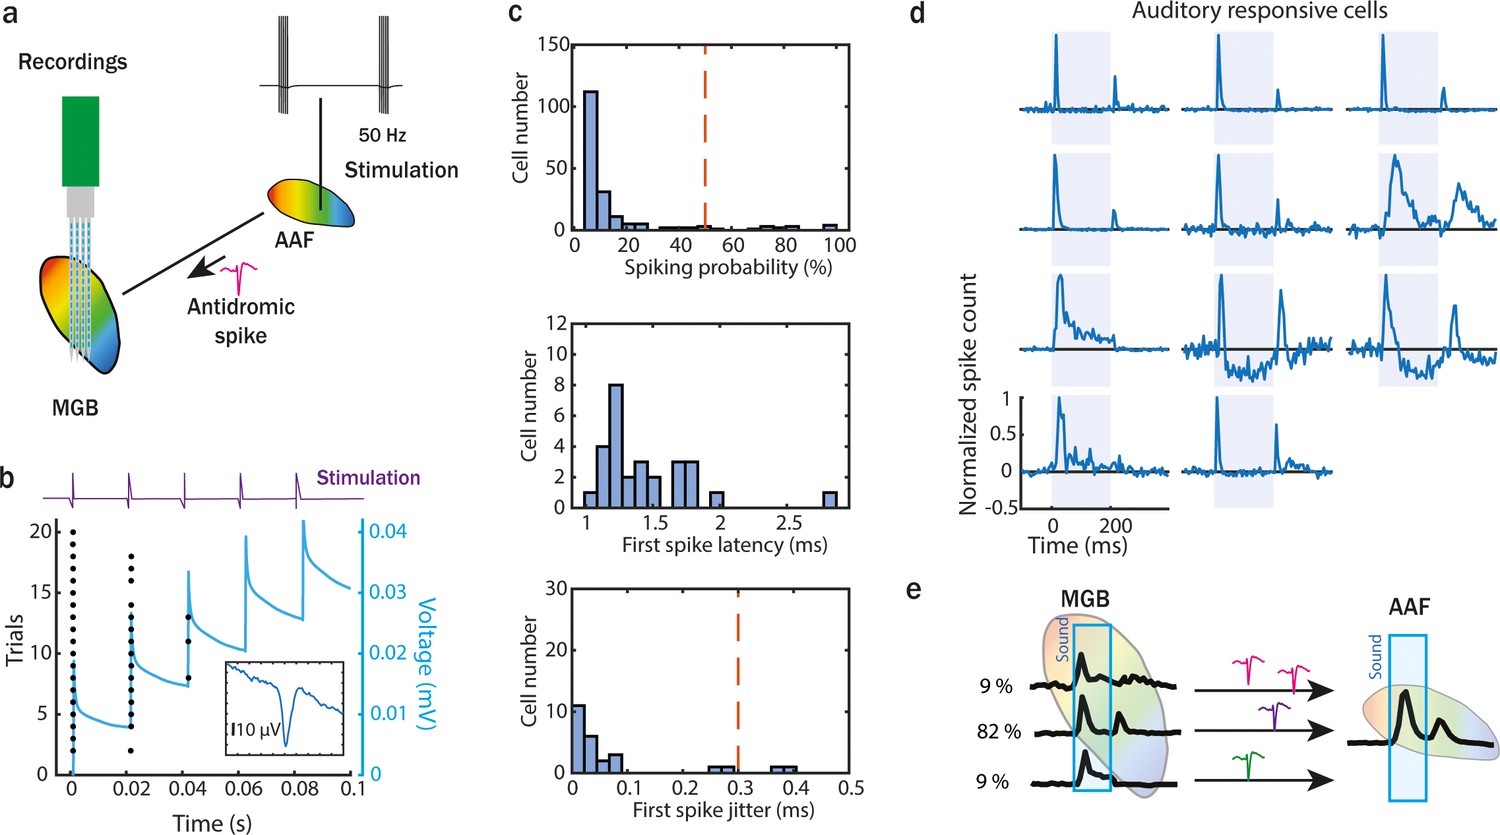
Onset–offset-responsive cells are the main inputs from medial geniculate body (MGB) to anterior auditory field (AAF).
(a) Illustration of experimental setup to perform an antidromic stimulation of MGB neurons projecting to AAF. The stimulation tip was placed in AAF after field identification (based on functional tonotopy). Monophasic electric pulses were delivered with 50 Hz at 30 µA. A 64-channel electrode was inserted in MGB to record antidromic activity. (b) Example MBG unit spike raster of antidromic activity for 20 trials (5 pulses in each trial). The blue line represents the increasing current injected during electric stimulation. (c) The number of recorded antidromic spikes in MGB neurons, where at least one spike following stimulation was detected in the time window from 1 to 5 ms after stimulation (top). Latency (middle) and jitter (bottom) of first antidromic spikes in MGB cells which were detected in at least half of the electric stimulation trials. (d) Poststimulus time histogram (PSTH) of auditory responsive MGB cells projecting to AAF identified during the antidromic experiment. Three main temporal categories of auditory evoked responses were identified: onset–offset, sustained and onset. MGB cells were considered AAF input if (1) antidromic spikes were detected in more than 50% of trials and (2) antidromic spikes jitter was lower than 0.3 ms. (e) Illustration of temporal dynamic and proportion of MGB cells projecting to AAF.
Figure 5—figure supplement 1
Response dynamics of medial geniculate body (MGB) cells recorded during antidromic stimulation experiments.
(a) Results of k-means clustering performed on MGB cells recorded during antidromic stimulation experiments (n = 1548) evoked by 200 ms pure tone (PT) with varied frequency (4–48.5 kHz) and sound level (0–80 dB SPL) presented with randomized interstimulus interval (ISI; 500–1000 ms). The graphs represent the mean temporal dynamic of cells belonging to each cluster. Data represent mean ± STD. The gray shaded bars represent the tone. (b) Percentage of cells with the distinct temporal dynamic of responses in the MGB cells recorded during the antidromic experiment.
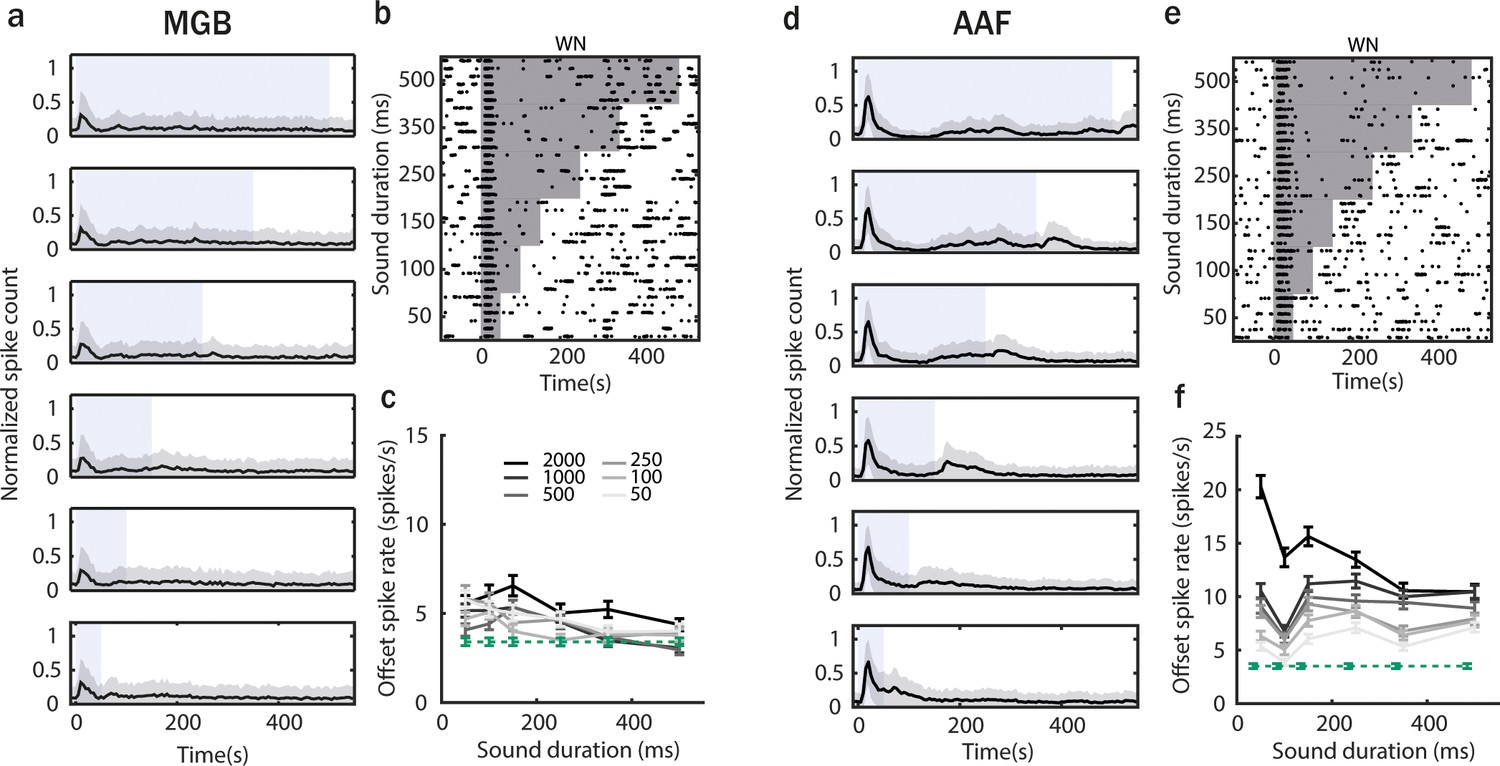
Figure 6

Offset responses increase with sound duration mainly in anterior auditory field (AAF).
(a) Raster plot of an example medial geniculate body (MGB) neuron’s response to pure tone (PT; frequency chosen based on offset tuning) with sound duration varying between 50 and 500 ms and interstimulus interval (ISI) between 50 and 2000 ms (top) and poststimulus time histogram (PSTH; mean ± STD) averaged over all neurons population (bottom). The blue shaded bars represent the tone. (b) MGB neurons offset responses (mean ± standard error of mean [SEM]) to PT with increasing duration across all ISI of 2000 ms (correlation between sound duration and response rate: PT, ρ = 0.05, p = 0.019, n = 307 SU, 6 animals, Spearman correlation). Comparison of offset responses: 50 vs 100 ms: n.s. p = 0.080; 50 vs 150 ms: n.s. p = 1; 50 vs 250 ms: p = 0.032; 50 vs 350 ms: n.s. p = 0.70; 50 vs 500 ms: n.s. p = 0.91, Dunn’s multiple comparisons test. (c) Distribution of peak-to-trough times (p2t) of MGB neurons. (d) Raster plot of an example AAF neuron’s response to PT (9 kHz) played at 60 dB SPL with sound duration varying between 50 and 500 ms and ISI between 500 and 2000 ms (top), and PSTH (mean ± STD) averaged over all neurons population (bottom). The blue shaded bars represent the tone. (e) AAF neurons offset responses (mean ± SEM) to PT with increasing duration across ISI of 2000 ms (correlation between sound duration and response rate: PT, ρ = 0.25, p < 0.0001, n = 285 SU, 6 animals, Spearman correlation). Comparison of offset responses: 50 vs 100 ms: n.s. p = 0.57; 50 vs 150 ms: n.s. p > 0.99; 50 vs 250 ms: n.s. p = 0.082; 50 vs 350 ms: p = 0.041; 50 vs 500 ms: p < 0.0001, Dunn’s multiple comparisons test. (f) Distribution of p2t of AAF neurons. (g) Comparison of offset spike rate in L2/3 and L4 neurons in AAF for sounds with duration varying between 50 and 500 ms and longest tested ISI of 2000 ms (mean ± SEM), L2/3: ρ = 0.26, p < 0.0001, n2/3 = 87, L4: ρ = 0.24, p < 0.0001, n4 = 198, Spearman correlation. (h) Comparison of offset spike rate of fast spiking and regular spiking (RS) neurons in AAF for sounds with duration varying between 50 and 500 ms and longest tested ISI of 2000 ms (mean ± SEM), FS: ρ = 0.29, p = 0.0001, nFS = 28, RS: ρ = 0.24, p < 0.0001, nRS = 257, Spearman correlation.
Figure 7 with 2 supplements
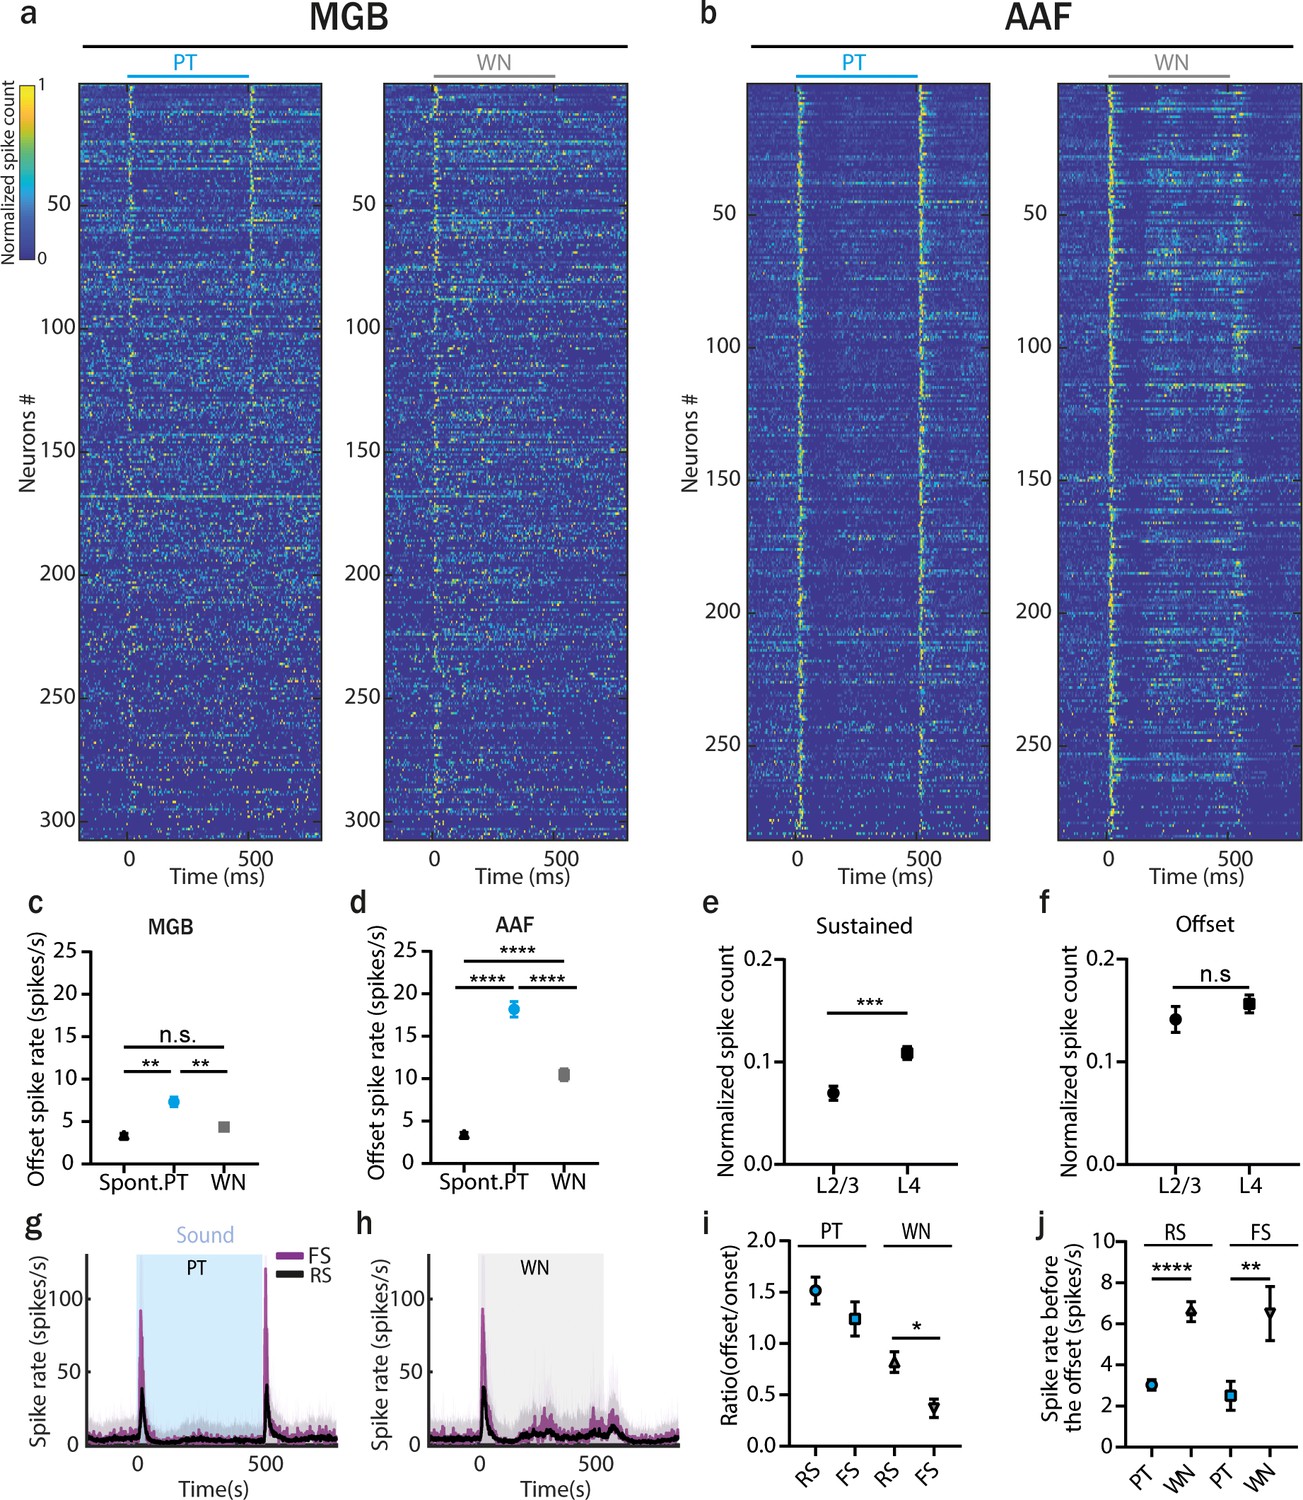
Offset responses to white noise (WN) stimulation are present in anterior auditory field (AAF) but not in medial geniculate body (MGB).
(a) Normalized poststimulus time histogram (PSTH) of MGB neurons to 500 ms pure tone (PT) or WN bursts, bin size: 5 ms. Data are sorted by descending spike rate at the PT offset. (b) Normalized PSTH of AAF neurons to 500 ms PT or WN bursts, bin size: 5 ms. Data are sorted by descending spike rate at the PT offset. (c) Comparison of MGB offset responses evoked by PT and WN for onset–offset cells. Data represent mean ± standard error of mean (SEM), PT vs spont. rate: **p = 0.0079; WN vs spont. rate: p > 0.99, PT vs WN: **p = 0.0037, n = 307, Friedman test with multiple comparisons. (d) Comparison of AAF offset responses evoked by PT and WN for onset–offset cells. Data represent mean ± SEM, PT vs spont. rate: ****p < 0.0001; WN vs spont. rate: ****p < 0.0001, PT vs WN: ****p < 0.0001, n = 285, Friedman test with multiple comparisons. (e) Comparison of sustained responses (calculated in the window: 100–500 ms) for AAF cells from L2/3 and L4 evoked by 500 ms WN stimulation (mean ± SEM), ***p = 0.0003, n2/3 = 87, n4 = 198, Mann–Whitney test. (f) Comparison of offset responses for AAF cells from L2/3 and L4 evoked by 500 ms WN stimulation (mean ± SEM), p = 0.30, n2/3 = 87, n4 = 198, Mann–Whitney test. (g, h) Averaged PSTH of fast (n = 29) and regular (n = 249) spiking AAF neuron’s response to PT and WN bursts played at 60 dB SPL with sound duration 500 ms and interstimulus interval (ISI) between 500 and 2000 ms. (i) Ratio of offset/onset responses evoked by 500 ms PT or WN in fast spiking and regular spiking (RS) AAF neurons (mean ± SEM), p = 0.020, nFS = 28, nRS = 246, Mann–Whitney test. (j) Spike rate preceding sound offset (calculated in window: 450–500 ms) in AAF neurons for longest ISI of 2000 ms (mean ± SEM), RS: ****p < 0.0001, n = 257; FS: **p = 0.0013, n = 28, Wilcoxon test.
Figure 7—figure supplement 1
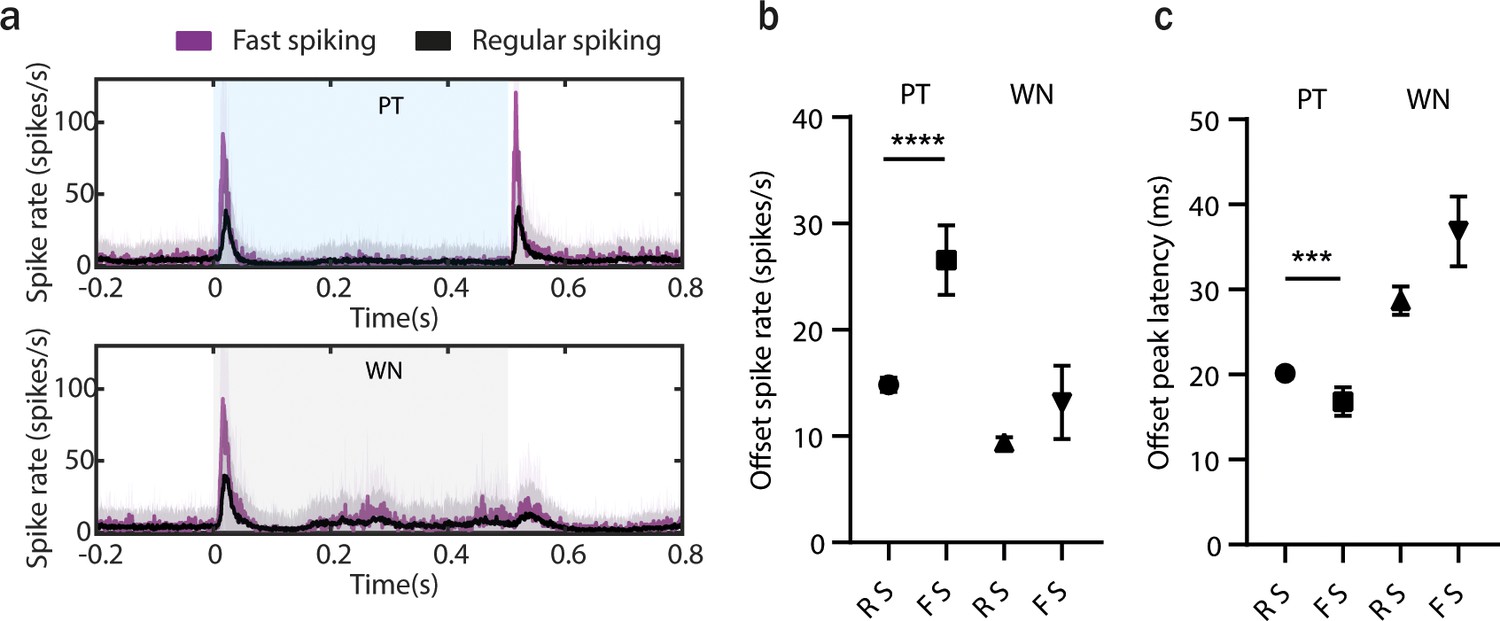
Offset processing in fast spiking (FS) and regular spiking (RS) anterior auditory field (AAF) neurons.
(a) Averaged poststimulus time histogram (PSTH; mean ± STD) of FS and RS anterior auditory field (AAF) neuron’s response to pure tones (PTs; 9 kHz) or white noise (WN) bursts played at 60 dB SPL with a sound duration of 500 ms and interstimulus interval (ISI) between 500 and 2000 ms. (b) Comparison of offset spike rate for RS and FS units in response to termination of 500 ms PT or WN, ****p < 0.0001, Mann–Whitney test. (c) Comparison of offset response latencies of RS and FS units in response to termination of 500 ms PT or WN, ***p = 0.0006, Mann–Whitney test.
Figure 7—figure supplement 2
Offset responses to white noise (WN) stimulation do not increase with sound duration.
(a) Poststimulus time histogram (PSTH; mean ± STD) averaged over all medial geniculate body (MGB) neuron responses to WN bursts played at 60 dB SPL with sound duration varying between 50 and 500 ms and interstimulus interval (ISI) between 500 and 2000 ms. (b) Raster plot of an example MGB neuron response to WN. The gray shaded bars represent the sound. (c) MGB neuron offset responses to WN with increasing duration across all ISI (correlation between sound duration and response rate ρ = −0.08, p < 0.0001, Spearman correlation). (d) PSTH (mean ± STD) averaged over all anterior auditory field (AAF) neuron’s response to WN bursts played at 60 dB SPL with sound duration varying between 50 and 500 ms and ISI between 500 and 2000 ms. (e) Raster plot of an example AAF neuron’s response to WN. The gray shaded bars represent the sound. (f) AAF neuron offset responses to WN with increasing duration across all ISI (correlation between sound duration and response rate ρ = 0.01, p < 0.0001, Spearman correlation).
Figure 8 with 1 supplement
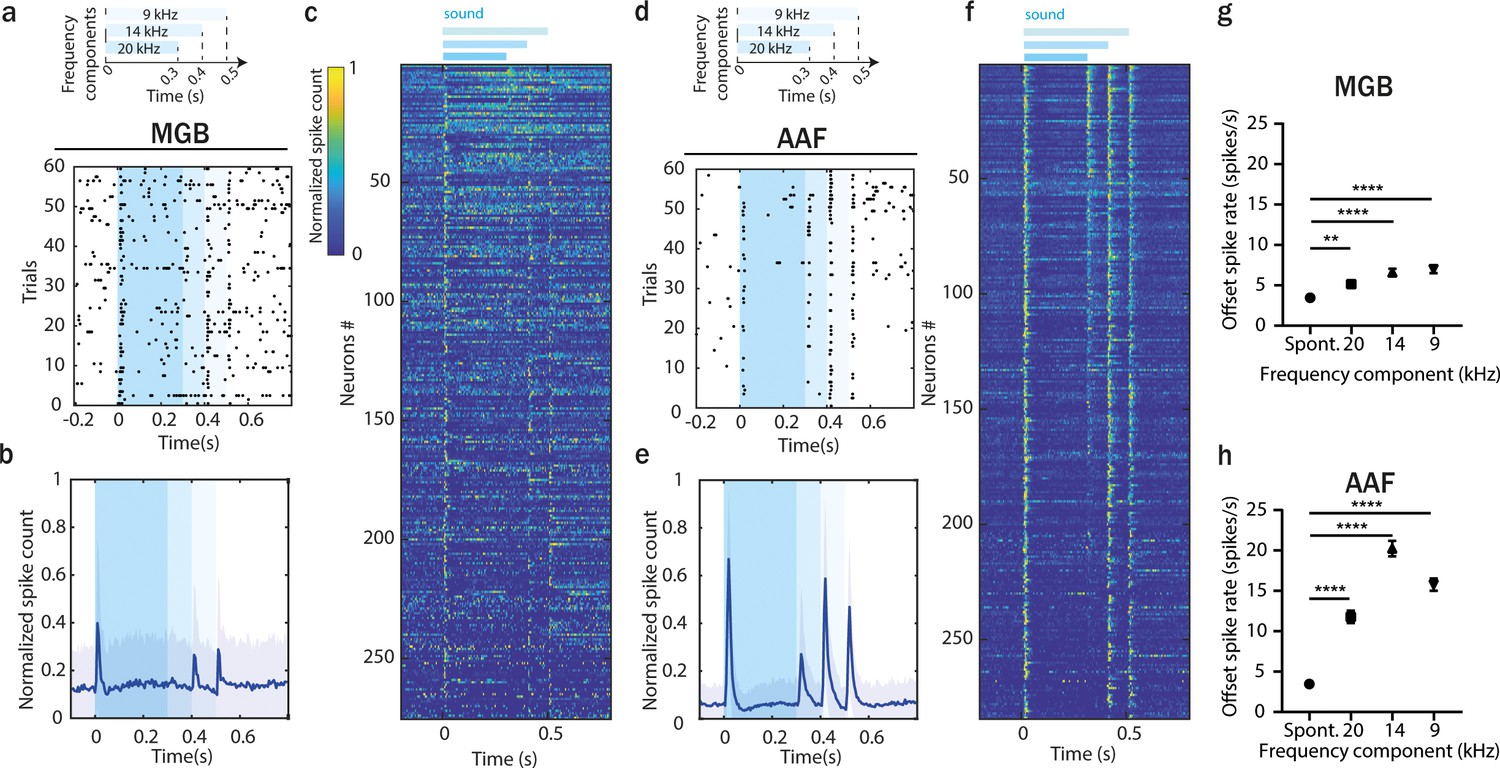
Offset responses encode more than just silence.
(a) Raster plot of an example MGB neuron’s response to three-component stimuli. (b) Averaged poststimulus time histogram (PSTH; mean ± STD) of MGB neuron’s response to three-component stimuli, n = 275, n = 6 animals. (c) Normalized PSTH of MGB neuron’s response to three-component stimuli, bin size: 5 ms. Data are sorted by descending spike rate at the first component termination. (d) Raster plot of an example AAF neuron’s response to three-component stimuli. (e) Averaged PSTH (mean ± STD) of AAF neuron’s response to three-component stimuli, n = 284, n = 6 animals. (f) Normalized PSTH of AAF neuron’s response to three-component stimuli, bin size: 5 ms. (g) Comparison of spiking rate of MGB neurons following removal of each frequency component. Data represent mean ± standard error of mean (SEM), Spont. vs 20 kHz: **p = 0.0011, Spont. vs 14 kHz: ****p < 0.0001, Spont. vs 9 kHz: ****p < 0.0001, n = 275, n = 6 animals, Friedman test with multiple comparisons. (h) Comparison of spiking rate of AAF neurons following removal of each frequency component. Data represent mean ± SEM, ****p < 0.0001, n = 284, n = 6 animals, Friedman test with multiple comparisons.
Figure 8—figure supplement 1
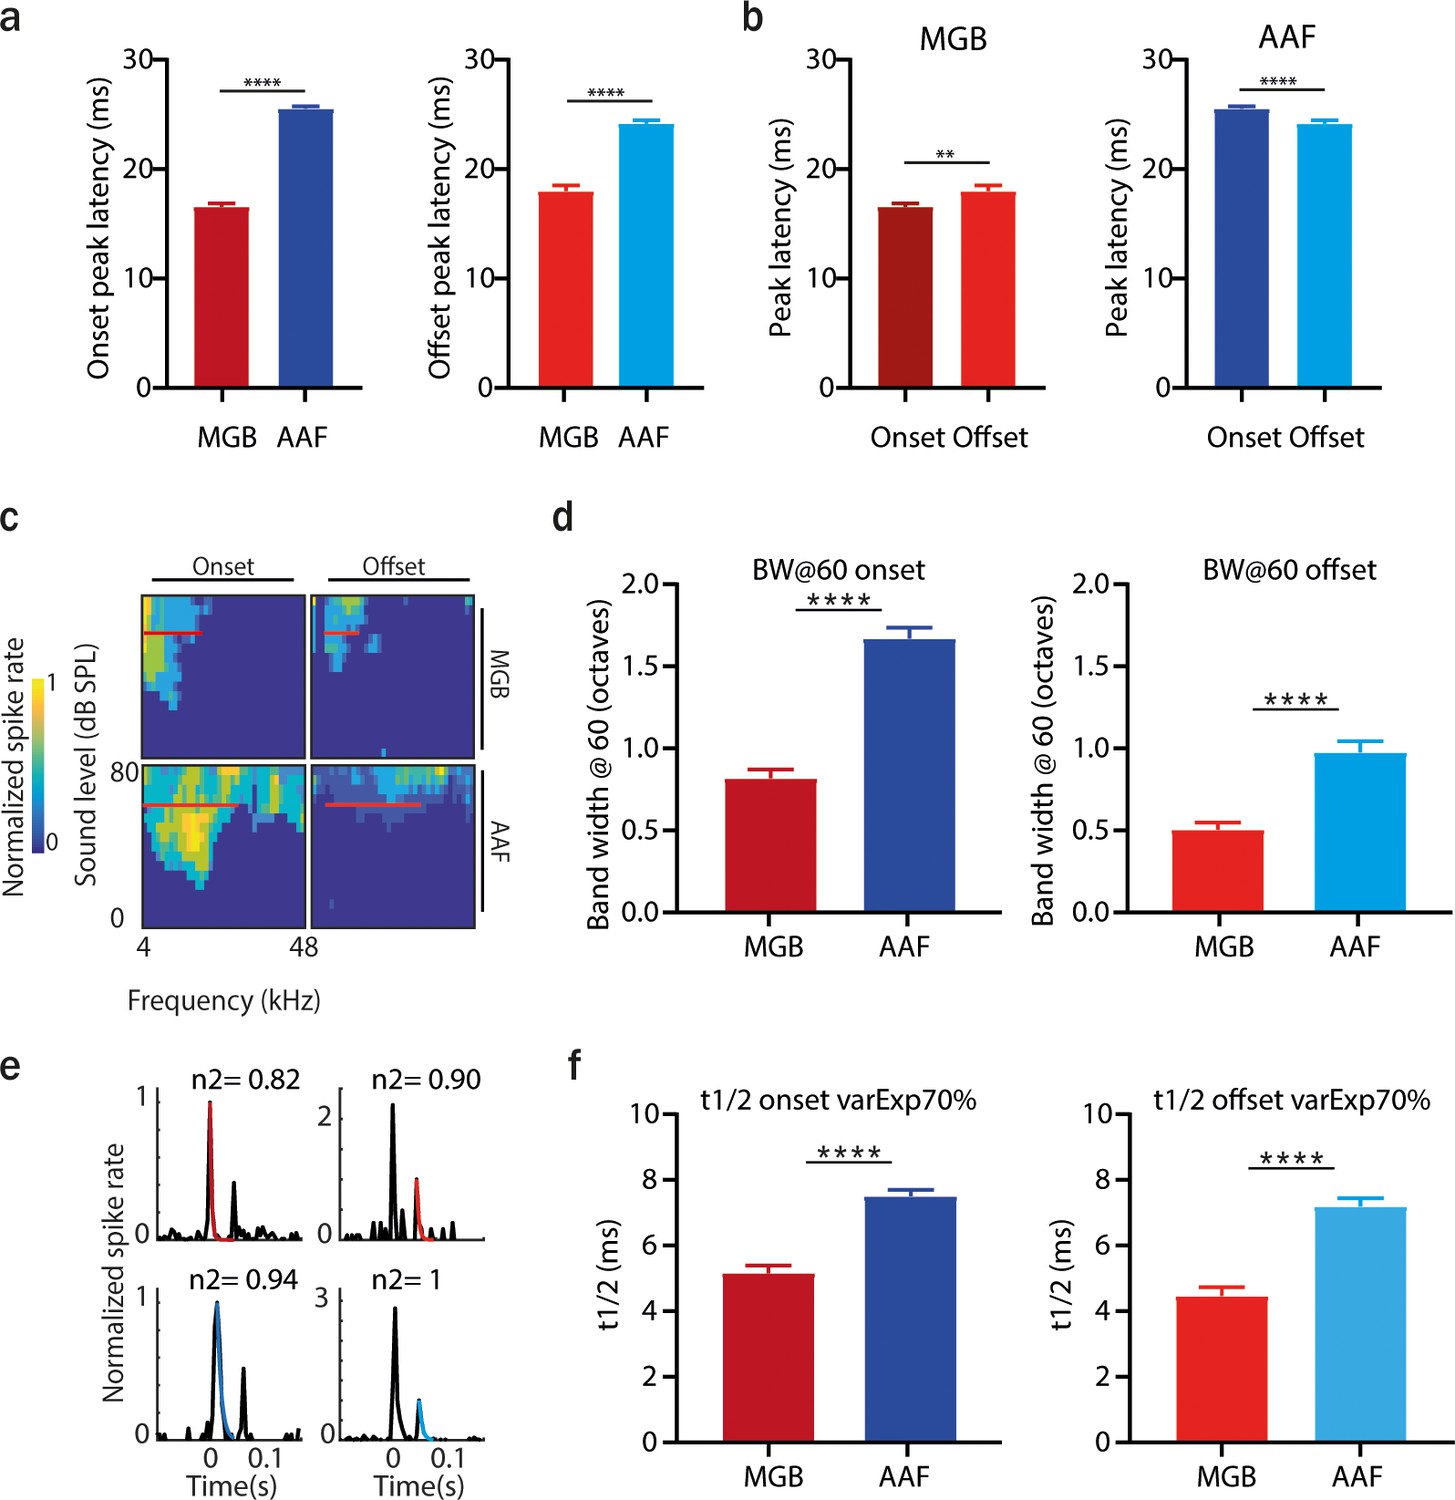
Distinct spectral and temporal tuning properties of medial geniculate body (MGB) and anterior auditory field (AAF) cells.
(a) Comparison of onset (left) and offset (right) peak latency between MGB and AAF neurons. Data represent mean ± standard error of mean (SEM). (b) Comparison of onset and offset peak latency within MGB (left) and AAF (right) neurons. Data represent mean ± SEM. (c) Example of tuning receptive fields (TRFs) of onset and offset responses of an MGB and AAF neuron. (d) Comparison of tuning bandwidth at 60 dB SPL of onset and offset responses in MGB and AAF neurons. (e) Example fit of exponential decay model to poststimulus time histogram (PSTH) of MGB and AAF neurons’ onset and offset responses (n2: the amount of variance explained). (f) Comparison of half decay time (t1/2) of onset and offset responses in MGB and AAF neurons. Data represent mean ± SEM, **p < 0.01, ****p<0.0001.
Author response image 1
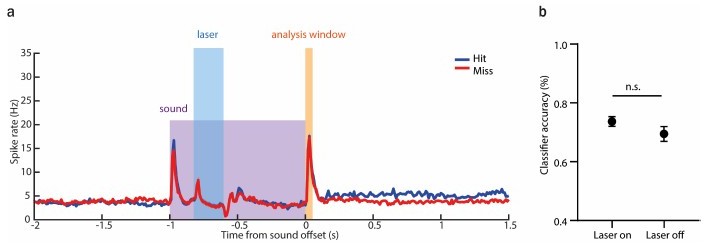
The classifier does not predict any reduction in performance following the suppression of AAF activity during the sound presentation.
(a) Averaged PSTH (mean± SEM) of AAF neuron's response to 1 s long pure tone (9 kHz) played at 60 dB SPL during hit (blue) and miss (red) trials with laser applied for 200 ms during ongoing sound (0.2-0.4s). (b) Comparison of classifier accuracy of decoders trained and tested on offset response of AAF neurons in trials with laser-on and -off (mean± SEM), p=0.3060.
Author response image 2
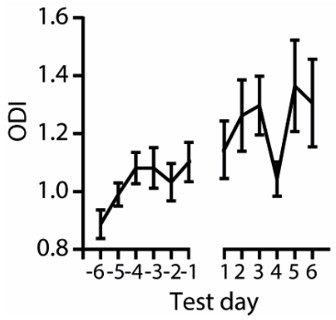
Increasing ODI value over the training and test days.
Author response image 3
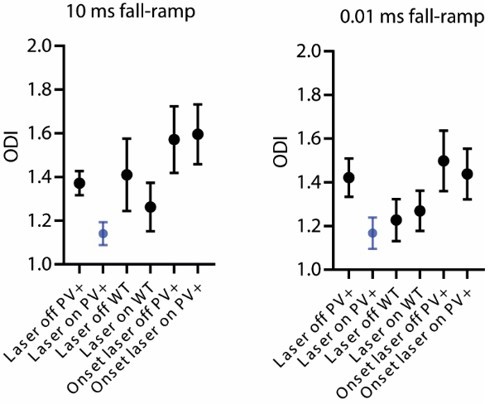
Overall performance levels in different experimental groups.
Tables
Key resources table
| Reagent type (species) or resource | Designation | Source or reference | Identifiers | Additional information |
|---|---|---|---|---|
| Chemical compound, drug | Ketamin | Vetoquinol | ATCvet-Code: QN01A × 03 | |
| Chemical compound, drug | Xylazin hydrochlorine | Provet AG | ATCvet-Code: QN05CM92 | |
| Chemical compound, drug | Lidocain | Streuli | ATCvet-Code: QN01BB02 | |
| Chemical compound, drug | Bupivicaine | Sintetica | ATCvet-Code: N01BB01 | |
| Strain, strain background (Mus musculus) | Wild-type (C57BL/6J) | Janvier | C57BL/6JRj | |
| Strain, strain background (M. musculus) | PV-Cre | Jackson | Stock #017320 | PValb-Cre knock-in line |
| Strain, strain background (M. musculus) | Ai32 line | Jackson | Stock #024109 | ChR2-lox |
| Software, algorithm | Active X and RPvdsX data acquisition software | Tucker-Davis Technologies | https://www.tdt.com | |
| Software, algorithm | MATLAB | Mathworks | https://www.mathworks.com/ | |
| Software, algorithm | Kilosort | Github CortexLab | https://github.com/cortex-lab/Kilosort (Pachitariu et al., 2019) | |
| Software, algorithm | phy | Github CortexLab | https://github.com/cortex-lab/phy (Buccino et al., 2021) | |
| Software, algorithm | Logistic regression model | Github Neuromatch | https://github.com/NeuromatchAcademy/course-content/blob/master/tutorials/README.md#w1d4---generalized-linear-models (Fiquet et al., 2020) | |
| Other | Electrodes | Neuronexus | AA4 × 8-5 mm-50-200-177-A32A1 × 32-5 mm-25-177-A32A4 × 16-5 mm-50-200-177-A64 |
Additional files
Download links
A two-part list of links to download the article, or parts of the article, in various formats.
Downloads (link to download the article as PDF)
Open citations (links to open the citations from this article in various online reference manager services)
Cite this article (links to download the citations from this article in formats compatible with various reference manager tools)
Emergence and function of cortical offset responses in sound termination detection
eLife 10:e72240.
https://doi.org/10.7554/eLife.72240


