The Cl--channel TMEM16A is involved in the generation of cochlear Ca2+ waves and promotes the refinement of auditory brainstem networks in mice
- Neuroscience Department, Max Delbrück Center for Molecular Medicine, Germany
- Faculty of Biology, Chemistry, Pharmacy, Freie Universität Berlin, Germany
- Institute of Human Genetics, University Hospital Jena, Germany
- Institute for Auditory Neuroscience and InnerEarLab, University Medical Center Göttingen, Germany
- Institute of Biology, Faculty of Life Sciences, University of Leipzig, Germany
Figures
Figure 1 with 2 supplements
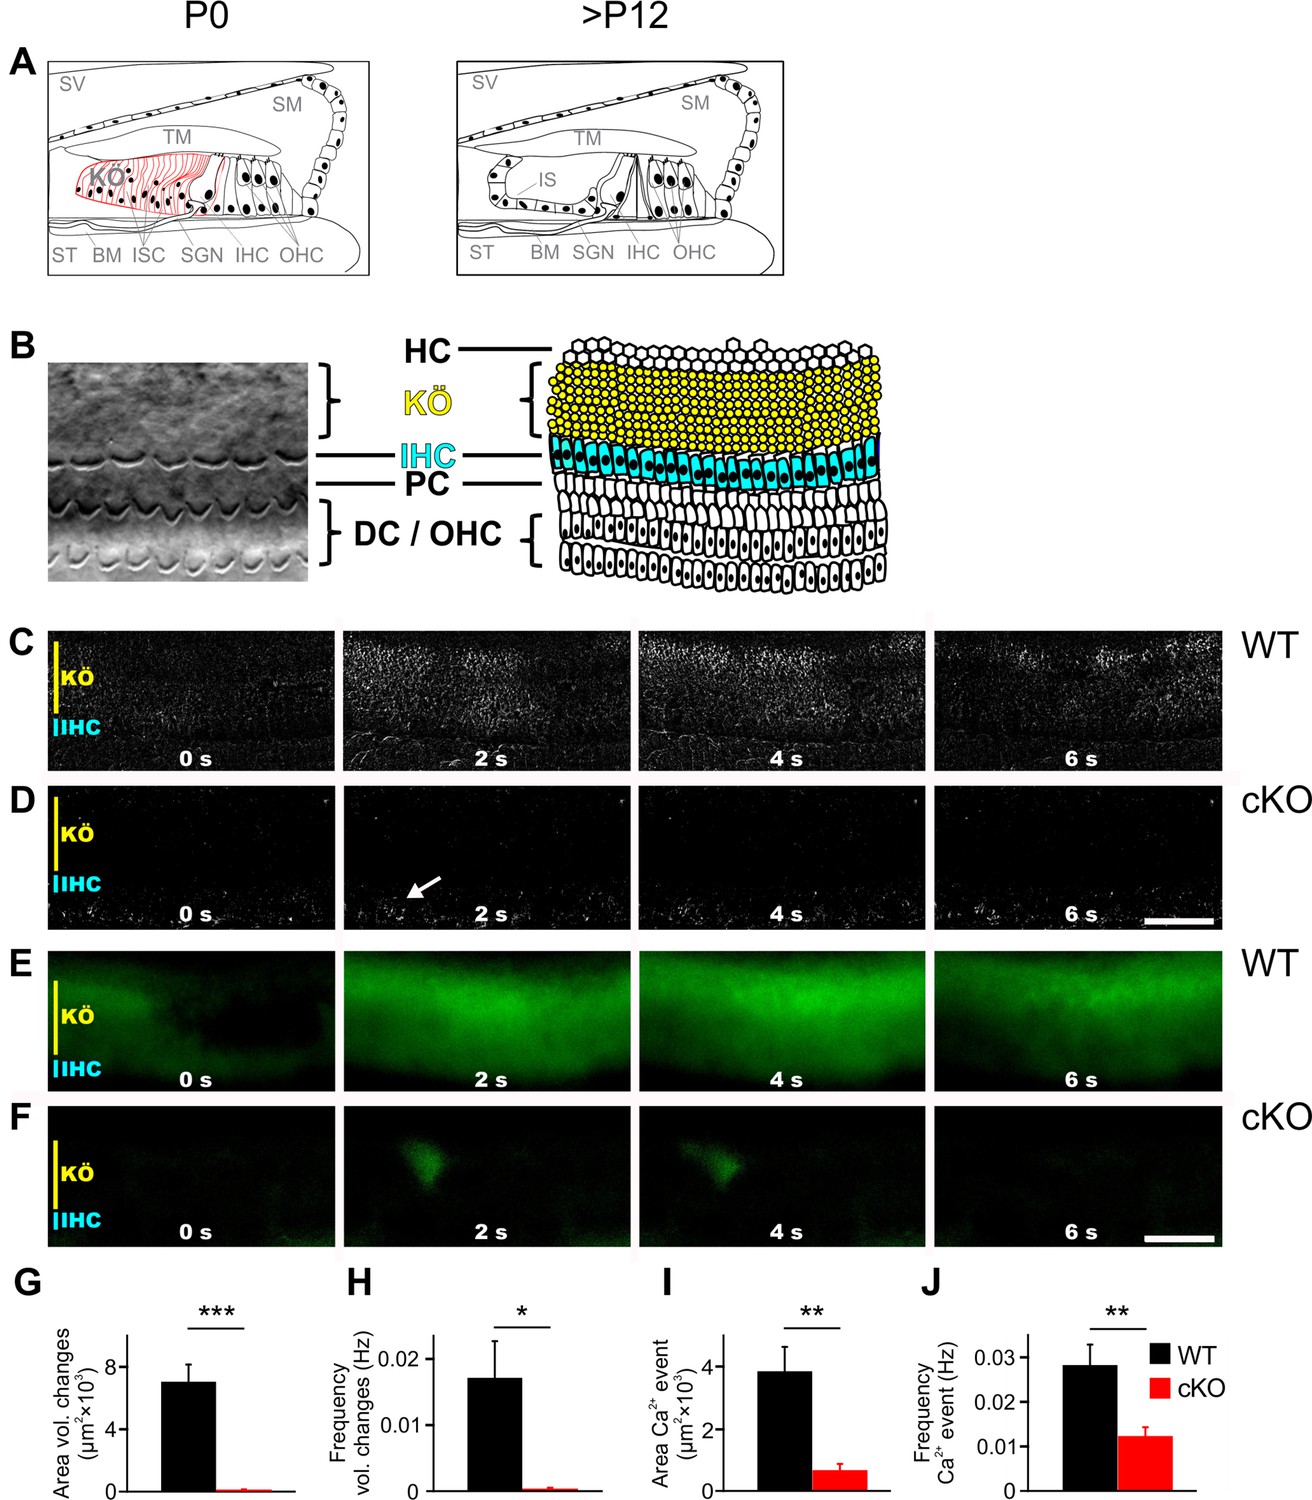
TMEM16A is required for the generation of spontaneous volume changes and Ca2+ waves in Kölliker’s organ.
(A) Schematic representation of the organ of Corti at birth (left) and after hearing onset (right). BM, basilar membrane; IHC, inner hair cells; IS, inner sulcus; ISC, inner supporting cells; KÖ, Kölliker’s organ; OHC, outer hair cells; SGN, spiral ganglion neurons; SM, scala media; ST, scala tympani; SV, scala vestibuli; TM, tectorial membrane. (B) Left: example differential interference contrast (DIC) image from the area of the cochlea turn imaged in (C–F). Right: the schematic drawing highlights the location of IHCs (blue) and ISCs (yellow) of KÖ. HC, Hensen cells; DC, Deiter’s cells; PC, pillar cells. (C, D) DIC time-lapse imaging at P7 reveals spontaneous volume changes of ISCs in a wildtype mouse indicated by changes in light intensity, which are almost absent in the cKO littermate. The arrow in (D) indicates erythrocytes moving in a blood vessel. Scale bar 50 μm. (E, F) Ca2+ imaging at P6 reveals spontaneous Ca2+ waves traveling across ISCs of KÖ in a wildtype mouse (E) that are reduced to small local Ca2+ transients in the cKO littermate (F). Scale bar 50 μm. (G, H) Quantification of areas and frequencies of spontaneous ISC volume changes. A time-lapse series of 1200 images with one image per second was analyzed. Values represent mean ± SEM (P5–7; n = 7 WT, n = 9 cKO; two-tailed unpaired Student’s t-test: area: p=0.0000056, frequency: p=0.0042). (I, J) Quantification of area and frequency of spontaneous Ca2+ events. A time-lapse series of 400 images with one image per second was analyzed. Values represent mean ± SEM (P5–7; n = 14 WT, n = 16 cKO; two-tailed unpaired Student’s t-test: area: p=0.00032; frequency: p=0.0027).
-
Figure 1—source data 1
Source data for Figure 1.
- https://cdn.elifesciences.org/articles/72251/elife-72251-fig1-data1-v2.xlsx
Figure 1—figure supplement 1
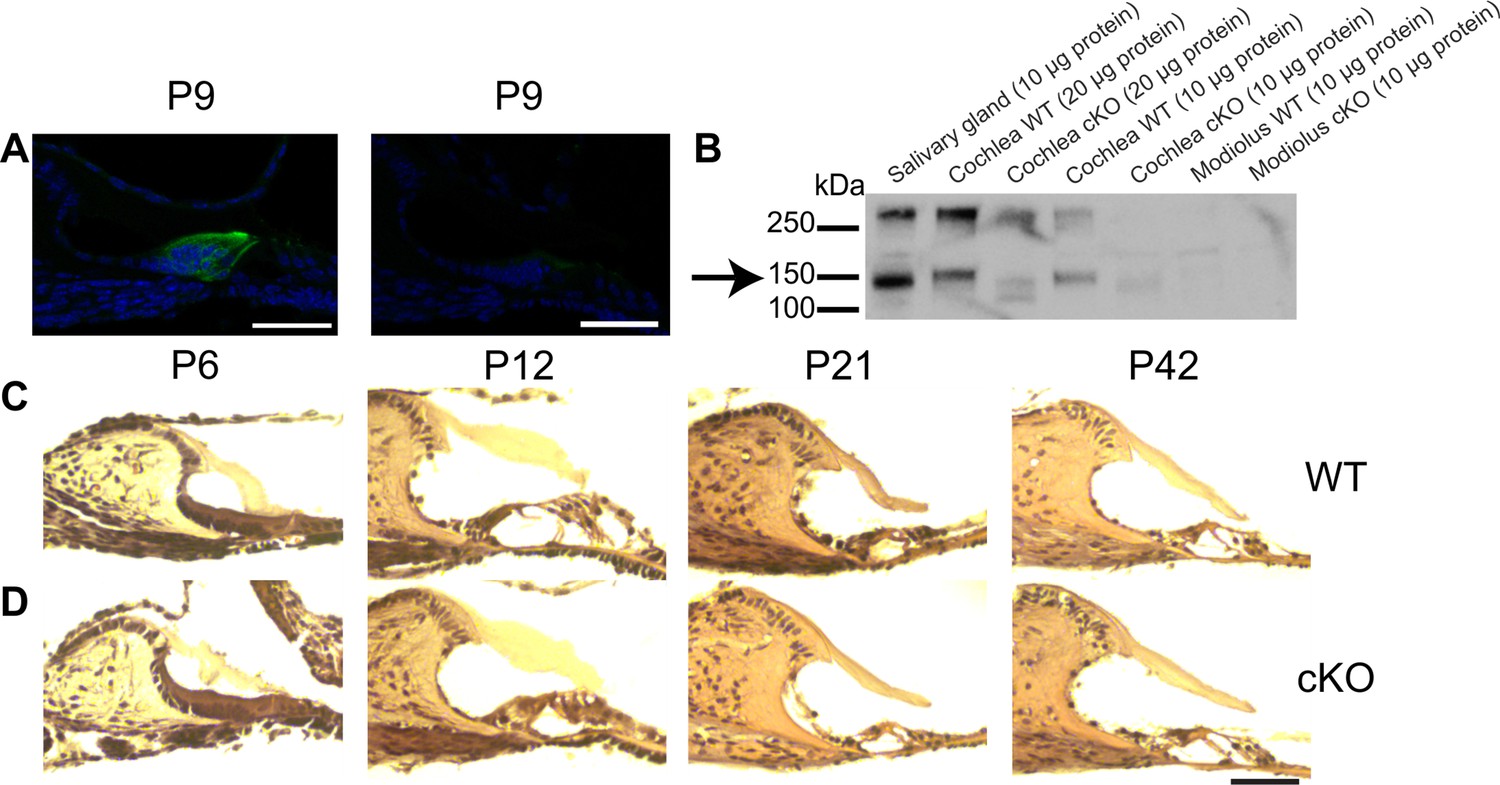
Comparison of morphology and TMEM16A expression patterns in the developing organ of Corti between wildtype and cKO mice.
(A) Immunohistochemical stainings for TMEM16A of cryosections from the organ of Corti in P9 wildtype (left) and cKO (right) mice. TMEM16A is broadly expressed in plasma membranes of inner supporting cells (ISCs) and phalangeal cells in the wildtype organ of Corti while the cKO cryosection shows a faint TMEM16A staining in the ISC area of Kölliker’s organ, indicating that the TMEM16A antibody recognizes the truncated TMEM16A protein. Green, TMEM16A; blue, DAPI. Scale bar 50 μm. (B) Western blot analysis of protein lysates reveals that TMEM16A (arrow) is expressed in the salivary gland as previously reported, which is here used as a positive control. The upper band represents TMEM16A dimers. TMEM16A is also expressed in the cochlea of wildtype mice. The TMEM16A signal in the cochlea migrates at a slightly higher molecular weight compared to the salivary gland, which might be explained by a difference in glycosylation or tissue-specific splicing. In cKO mice, the bands corresponding to TMEM16A were shifted to a smaller size, confirming that the knockout was successful (Heinze et al., 2014). In contrast, no expression of TMEM16A is detected in the modiolus in wildtype and cKO mice. (C, D) HE stainings of organ of Corti cryosections dissected at different ages do not reveal morphological differences between wildtype and cKO mice between 1 and 6 weeks of age (P6, P12, P21, P42). Scale bar 50 μm.
Figure 1—figure supplement 2

Absence of P2 receptor activation in cKO mice.
The purinergic receptor blocker suramin reduces Ca2+ waves to uncoordinated Ca2+ transients in wildtype (black) but does not have an effect on Ca2+ transients in cKO littermates (red) (mean values ± SEM, n = 6 WT, n = 5 cKO [P5–7]; two-tailed paired Student’s t-test comparing area of Ca2+ event before suramin application versus area of Ca2+ event after suramin application: p=0.0323 WT, p=0.4843 cKO).
-
Figure 1—figure supplement 2—source data 1
Source data for Figure 1—figure supplement 2.
- https://cdn.elifesciences.org/articles/72251/elife-72251-fig1-figsupp2-data1-v2.xlsx
Figure 2 with 1 supplement
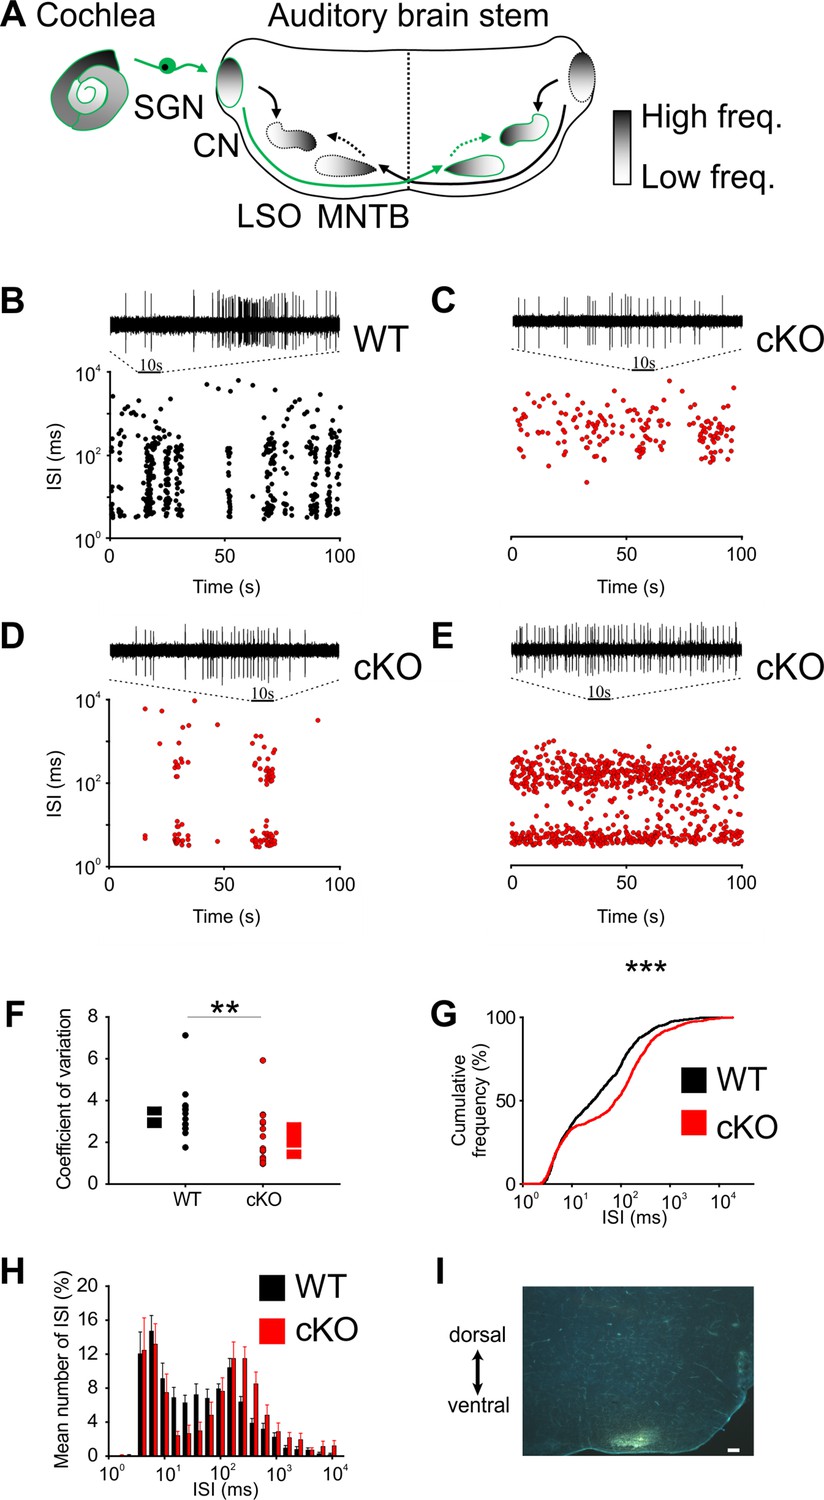
Disruption of Kölliker’s organ activity changes prehearing burst firing of medial nucleus of the trapezoid body (MNTB) neurons in vivo.
(A) Simplified model of auditory connections in the brainstem. The pathways relevant for this experiment are marked in green. Inhibitory pathways are indicated by dotted arrows. CN, cochlear nucleus; LSO, lateral superior olive; SGN, spiral ganglion neurons. (B–E) Patterns of spontaneous discharge activity from individual MNTB neurons recorded from mice before hearing onset (P8) in wildtype and cKO littermates. Dotplot graphs show respective interspike interval (ISI) distributions for 100 s of spontaneous discharge activity. On top of each dotplot raster is a 10 s period of original spike trains. Note that the wildtype MNTB neuron shows prominent burst firing, which is either strongly reduced (D) or absent in cKO mice (C, E). (F) Quantification of spike bursting patterns by calculating the coefficient of variation of ISIs yields significant differences between wildtype (n = 14) and cKO units (n = 15) (Mann–Whitney rank-sum test: p=0.006); also shown are boxplots indicating medians and 25% and 75% quartiles. (G) The mean cumulative distribution of ISIs reveals the significant shift toward larger values in cKO mice (wildtype n = 14 and cKO n = 15; Kolmogorov–Smirnov test: p=0.0008, D = 0.19), with the median ISI increasing from 26.9 ms in wildtype to 76.3 ms in cKO mice. (H) The overlaid log-binned histogram compares the distribution of ISIs between wildtype and cKO mice. Values represent mean ± SEM (n = 14 wildtype, n = 15 cKO [P8]). For statistical analysis, the chi-square test was used (see Supplementary file 1a for p-values). (I) Iontophoretic injection with Fluorogold verifies recording site from in vivo juxtacellular voltage recordings from MNTB neurons in a prehearing wildtype mouse (P8). Scale bar 200 μm.
-
Figure 2—source data 1
Source data for Figure 2A–G.
- https://cdn.elifesciences.org/articles/72251/elife-72251-fig2-data1-v2.xlsx
-
Figure 2—source data 2
Source data for Figure 2H.
- https://cdn.elifesciences.org/articles/72251/elife-72251-fig2-data2-v2.xlsx
Figure 2—figure supplement 1

Spontaneous activity of an exemplary P8 medial nucleus of the trapezoid body (MNTB) wildtype neuron in vivo.
(A) A representative 20 s voltage trace showing one prominent 3.5 s burst. (B) Fine structure of the burst shown in (A) reveals mini-bursts separated by 50–200 ms silent periods. (C) The mini-burst shown in (B) is composed of four successive spikes. Note that each spike is composed of the prepotential, coming from the calyx of Held and the action potential from the MNTB principal neuron.
Figure 3 with 1 supplement
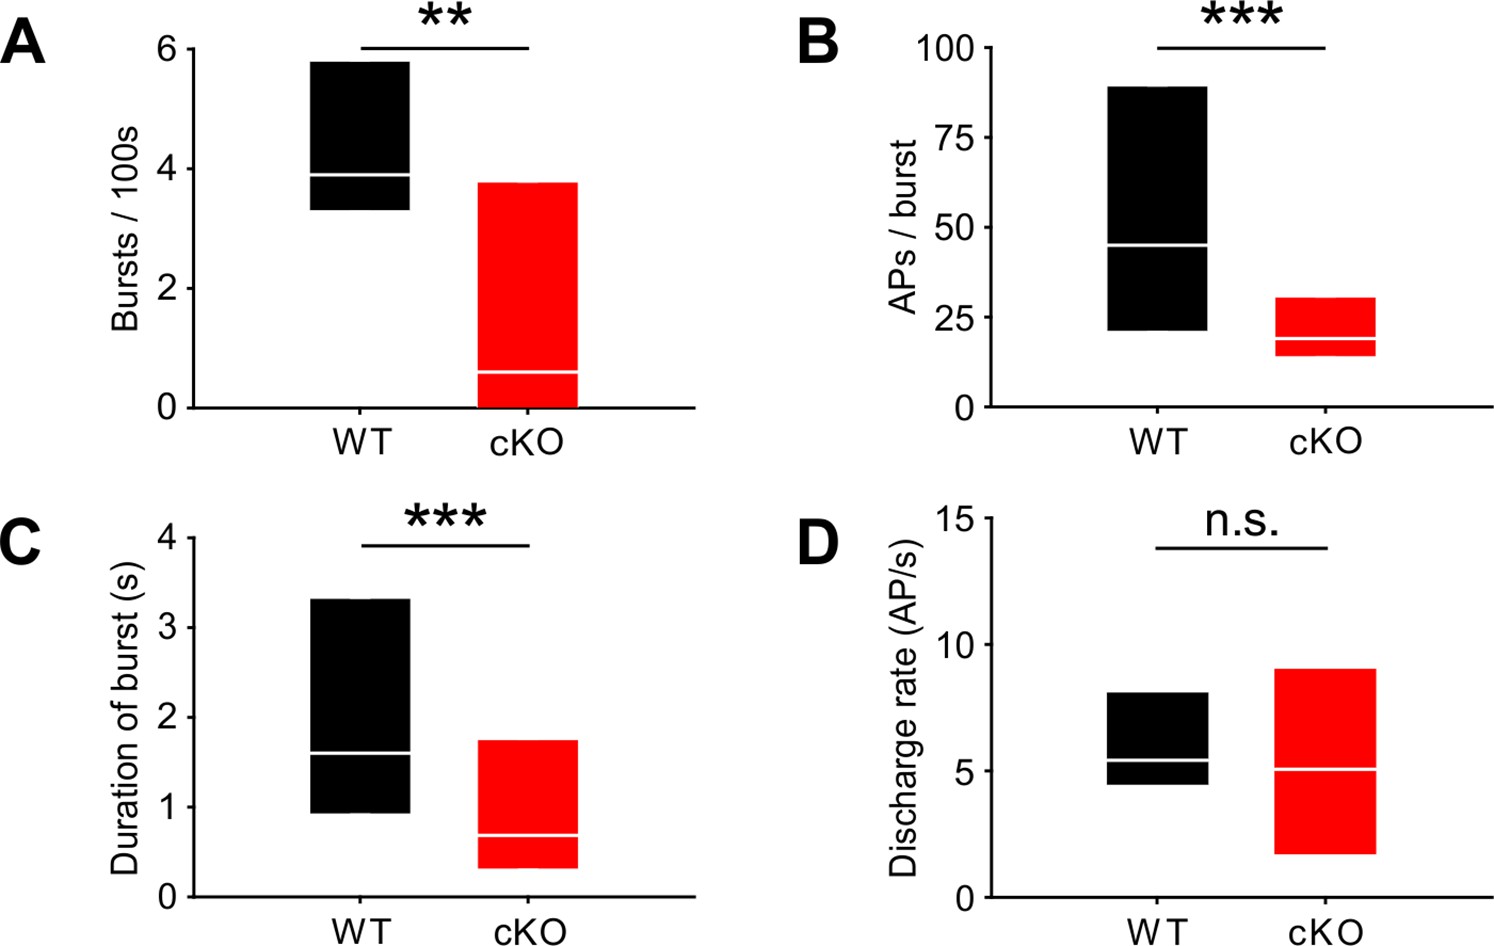
Lack of TMEM16A in cochlear inner supporting cells (ISCs) changes bursts but not the overall firing rate in medial nucleus of the trapezoid body (MNTB) auditory brainstem neurons in vivo.
(A–C) Spontaneous discharge patterns of MNTB neurons recorded from cKO mice show a reduced number of bursts per 100 s (A), a reduced number of spikes per burst (B), and a reduced duration of bursts (C) compared to wildtype. Values represent median with 25%, 75% quartiles (n = 14 WT; n = 15 cKO [P8]; Mann–Whitney rank-sum test: number of bursts per 100 s: p=0.009; number of spikes per burst: p=0.00001; duration of burst: p=0.000002). (D) The overall discharge rates did not differ between wildtype (n = 14) and cKO (n = 15) (two-tailed unpaired Student’s t-test: p=0.73).
-
Figure 3—source data 1
Source data for Figure 3.
- https://cdn.elifesciences.org/articles/72251/elife-72251-fig3-data1-v2.xlsx
Figure 3—figure supplement 1
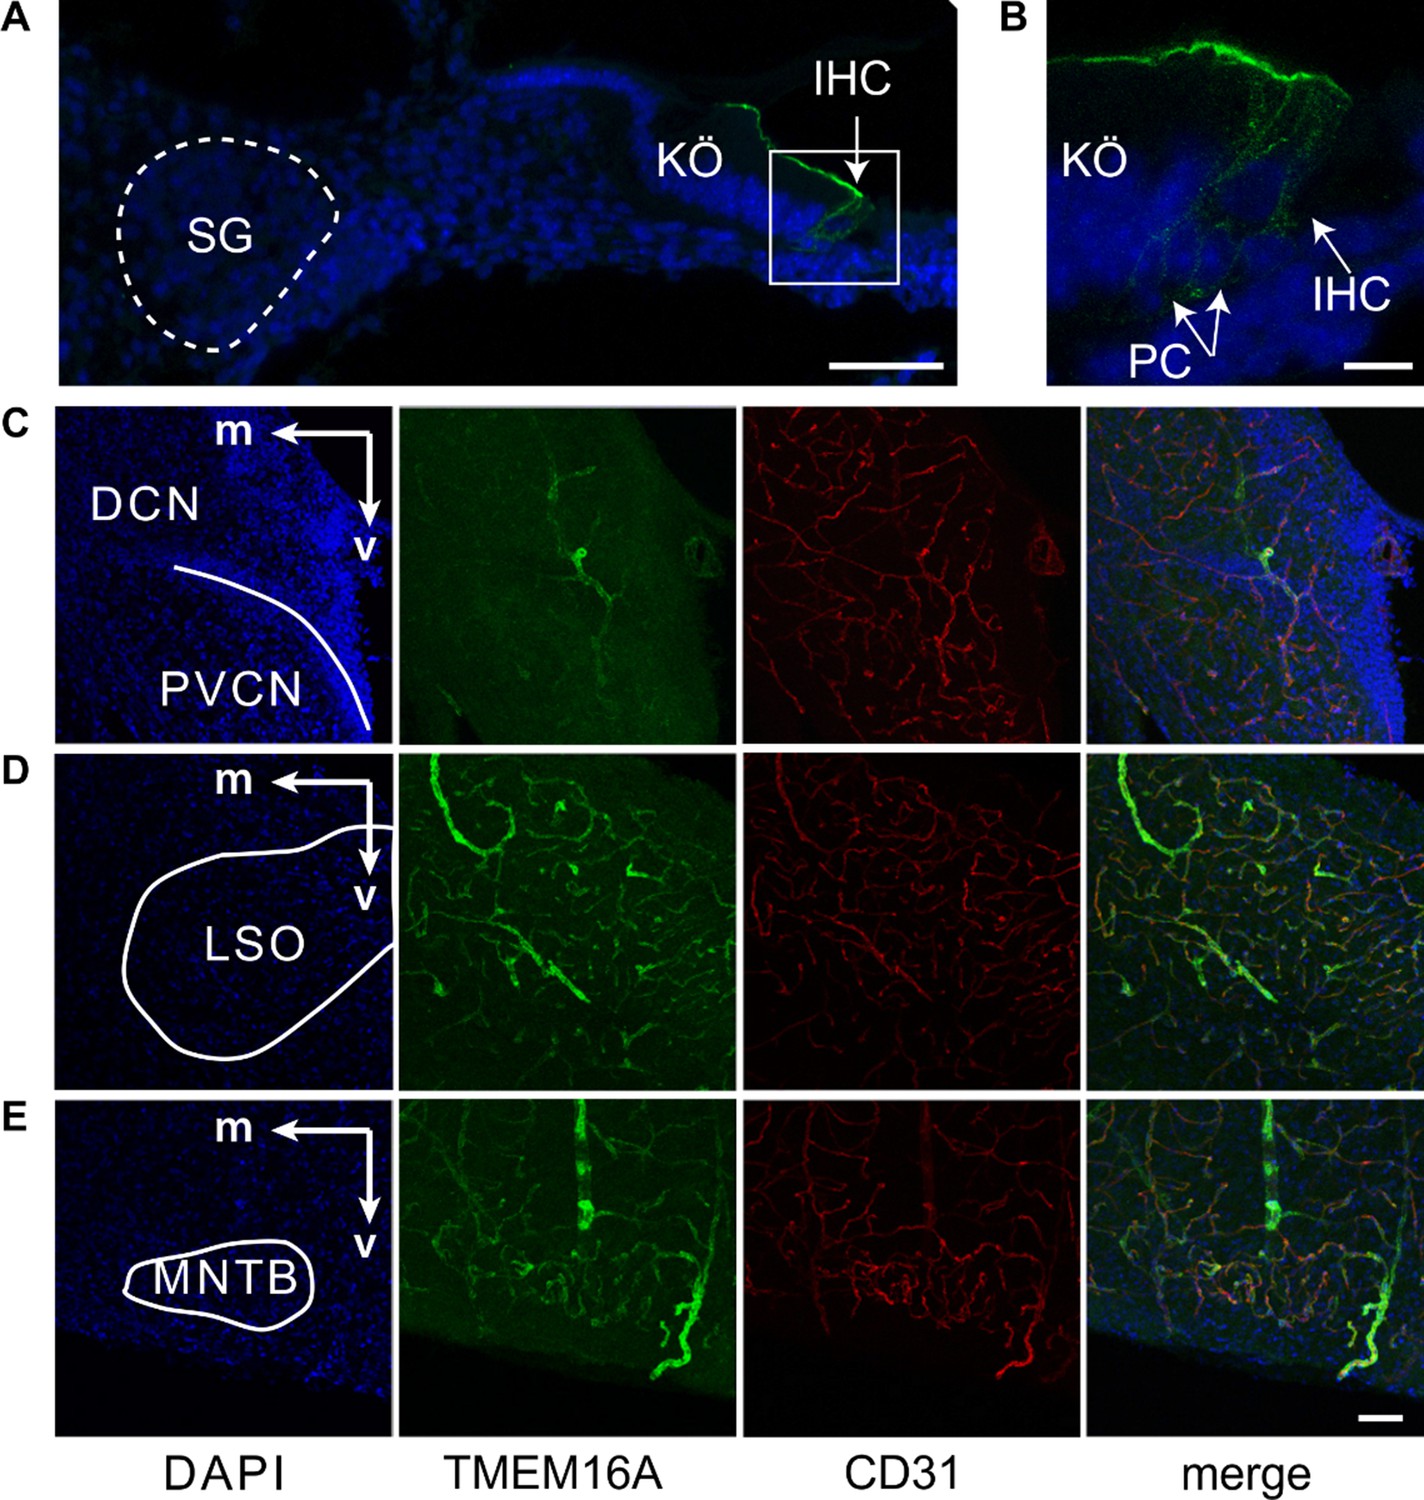
TMEM16A is not expressed in spiral ganglion (SG), cochlear nucleus (CN), medial nucleus of the trapezoid body (MNTB), and lateral superior olive (LSO) neurons before hearing onset in wildtype mice.
(A) At P2, TMEM16A is expressed in inner supporting cells (ISCs) of Kölliker’s organ (KÖ) and phalangeal cells (PCs) but not in SG neurons (dashed line). IHC, inner hair cells . Scale bar 50 μm. (B) Magnification of the IHC region from (A). Scale bar 10 μm. (C–E) lmmunohistochemical staining of brainstem slices for TMEM16A (green) and the endothelial marker CD31 (red) of wildtype mice (P8) showing TMEM16A expression in vascular smooth muscle cells, but no expression in neurons of the CN (C), LSO (D), or MNTB (E). m, medial; v, ventral; DCN, dorsal cochlear nucleus; PVCN, posteroventral cochlear nucleus. Scale bars 50 μm.
Figure 4 with 1 supplement
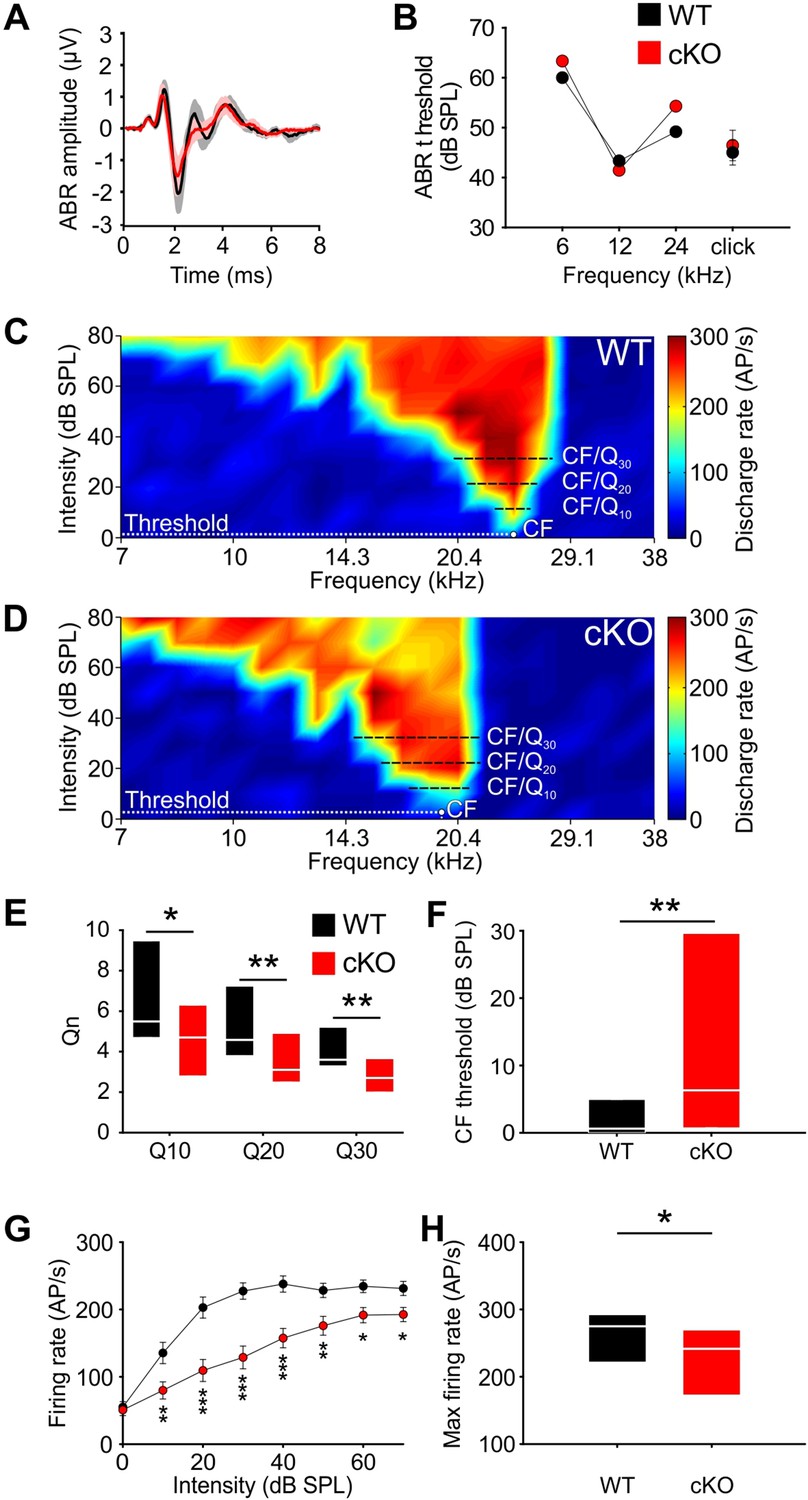
Wildtype and cKO mice show similar auditory brainstem response (ABR) thresholds, but differences in frequency selectivity, response threshold, and maximal firing rate in neurons of the medial nucleus of the trapezoid body (MNTB).
(A) Grand averages of ABR waveforms to 80 dB click stimulation recorded from cKO (red) and wildtype (black) at P13–14. (B) ABR thresholds in response to 6, 12, or 24 kHz tone bursts and click stimuli did not differ between wildtype (n = 7) and cKO (n = 6) at P13–14. For values, see Supplementary file 1b. (C, D) Representative frequency response areas of MNTB neurons (P14) recorded juxtacellularly in a wildtype mouse (C) (characteristic frequencies [CF]: 24 kHz, threshold 0.1 dB SPL, Q10/20/30 = 6.4/4.3/4.2), and in a cKO littermate (D) (CF: 18.4 kHz, threshold = 3 dB SPL, Q10/20/30 = 3.7/3.2/2.8). Note that the response area is broader and that the CF thresholds are increased in cKO. (E) Frequency selectivity of MNTB neurons was reduced in cKO mice as indicated by lower Q-factors (shown are medians and 25%, 75% quartiles [n = 25 WT; n = 32 cKO, P14]; Mann–Whitney rank-sum test: Q10: p=0.03, Q20: p=0.008, Q30: p=0.002). (F) Sound thresholds of individual MNTB neurons are elevated in cKO mice compared to wildtype (p=0.006). (G) Average rate-level functions at CF show decreased action potential firing in cKO at SPLs above 10 dB (two-way ANOVA: effect of strain p<0.001, effect of intensity p<0.001). (H) Maximum firing rates during acoustic stimulation are significantly decreased in cKO mice compared to wildtype littermates (two-tailed unpaired Student’s t-test: p=0.015).
-
Figure 4—source data 1
Source data for Figure 4A and B.
- https://cdn.elifesciences.org/articles/72251/elife-72251-fig4-data1-v2.xlsx
-
Figure 4—source data 2
Source data for Figure 4E–H.
- https://cdn.elifesciences.org/articles/72251/elife-72251-fig4-data2-v2.xlsx
Figure 4—figure supplement 1
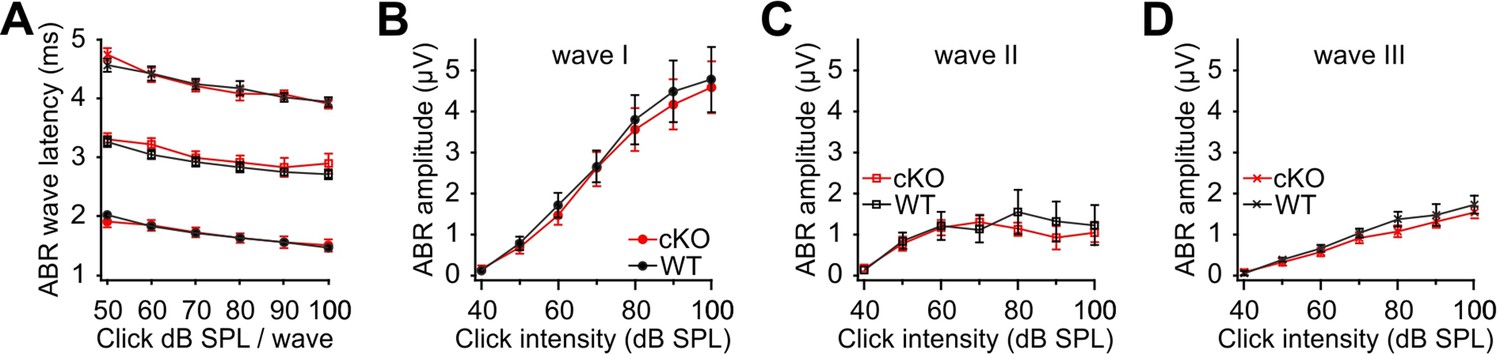
Wildtype and cKO mice have similar auditory brainstem responses (ABRs).
Shown are latencies (A) and amplitudes (B–D) of the first three ABR peaks (wave I–III) in response to click stimuli presented at different intensities (40–100 dB) (n = 6 WT; n = 7 cKO; P13–14).
Figure 5 with 1 supplement
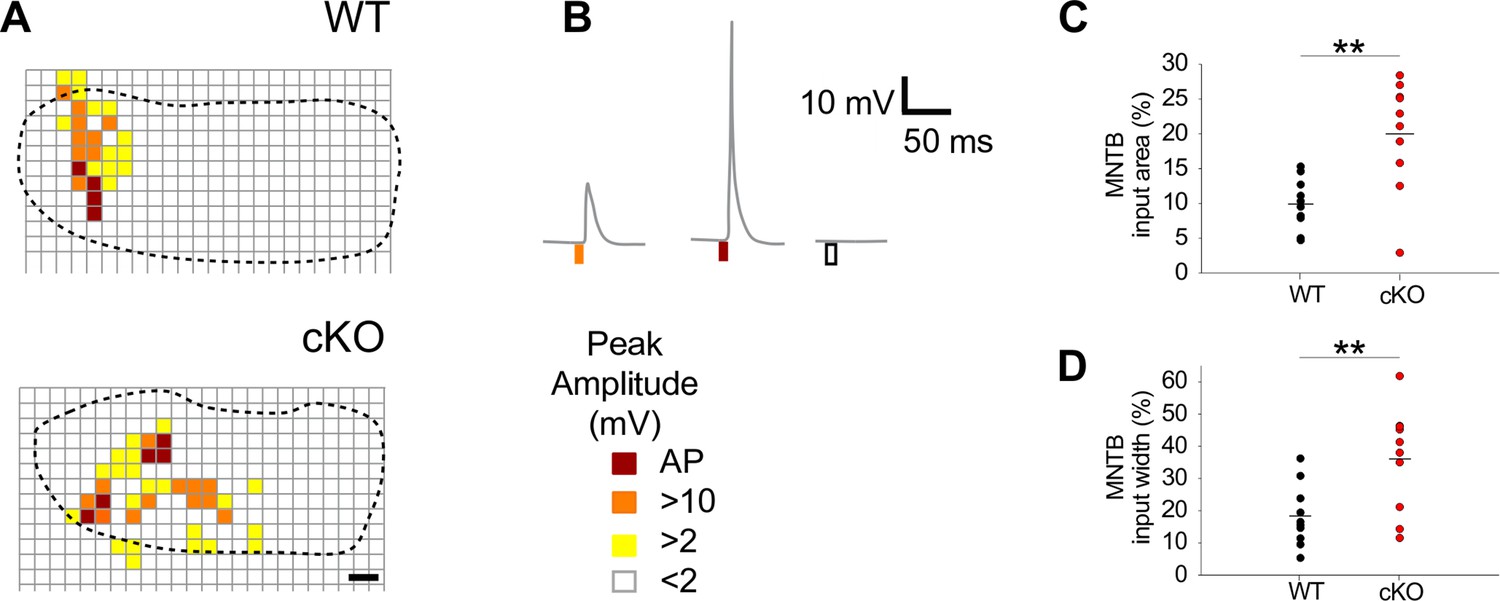
Medial nucleus of the trapezoid body-lateral superior olive (MNTB-LSO) input maps are enlarged upon disruption of TMEM16A.
(A) Exemplary MNTB input maps from wildtype (P9) and cKO mice (P10) as revealed by whole-cell current-clamp recordings (dotted line outlines the MNTB area, grid points indicate glutamate uncaging sites). The location of responsive (colored squares) and unresponsive (open squares) uncaging sites is indicated. Scale bar 40 µm. (B) Uncaging of glutamate close to presynaptic MNTB neurons gives rise to synaptic responses of various peak amplitudes (left), elicits action potentials (middle), or fails to evoke significant voltage signals (right) in the recorded LSO neurons (see color code below). (C, D) Quantification of MNTB input areas (summed area of all responsive uncaging sites) on a recorded LSO neuron and of the MNTB input widths (maximal distance of stimulations sites that evoked depolarization greater than 10 mV along the mediolateral [tonotopic] axis of the MNTB). MNTB input areas were normalized to the corresponding MNTB cross-sectional area and MNTB input widths to the length of the mediolateral axis of the MNTB. Values represent mean ± SEM (n = 10 WT; n = 10 cKO [P9–11]; two-way unpaired Student’s t-test: MNTB input area: p=0.0017, MNTB input width: p=0.0073).
-
Figure 5—source data 1
Source data for Figure 5A-D.
- https://cdn.elifesciences.org/articles/72251/elife-72251-fig5-data1-v2.xlsx
Figure 5—figure supplement 1
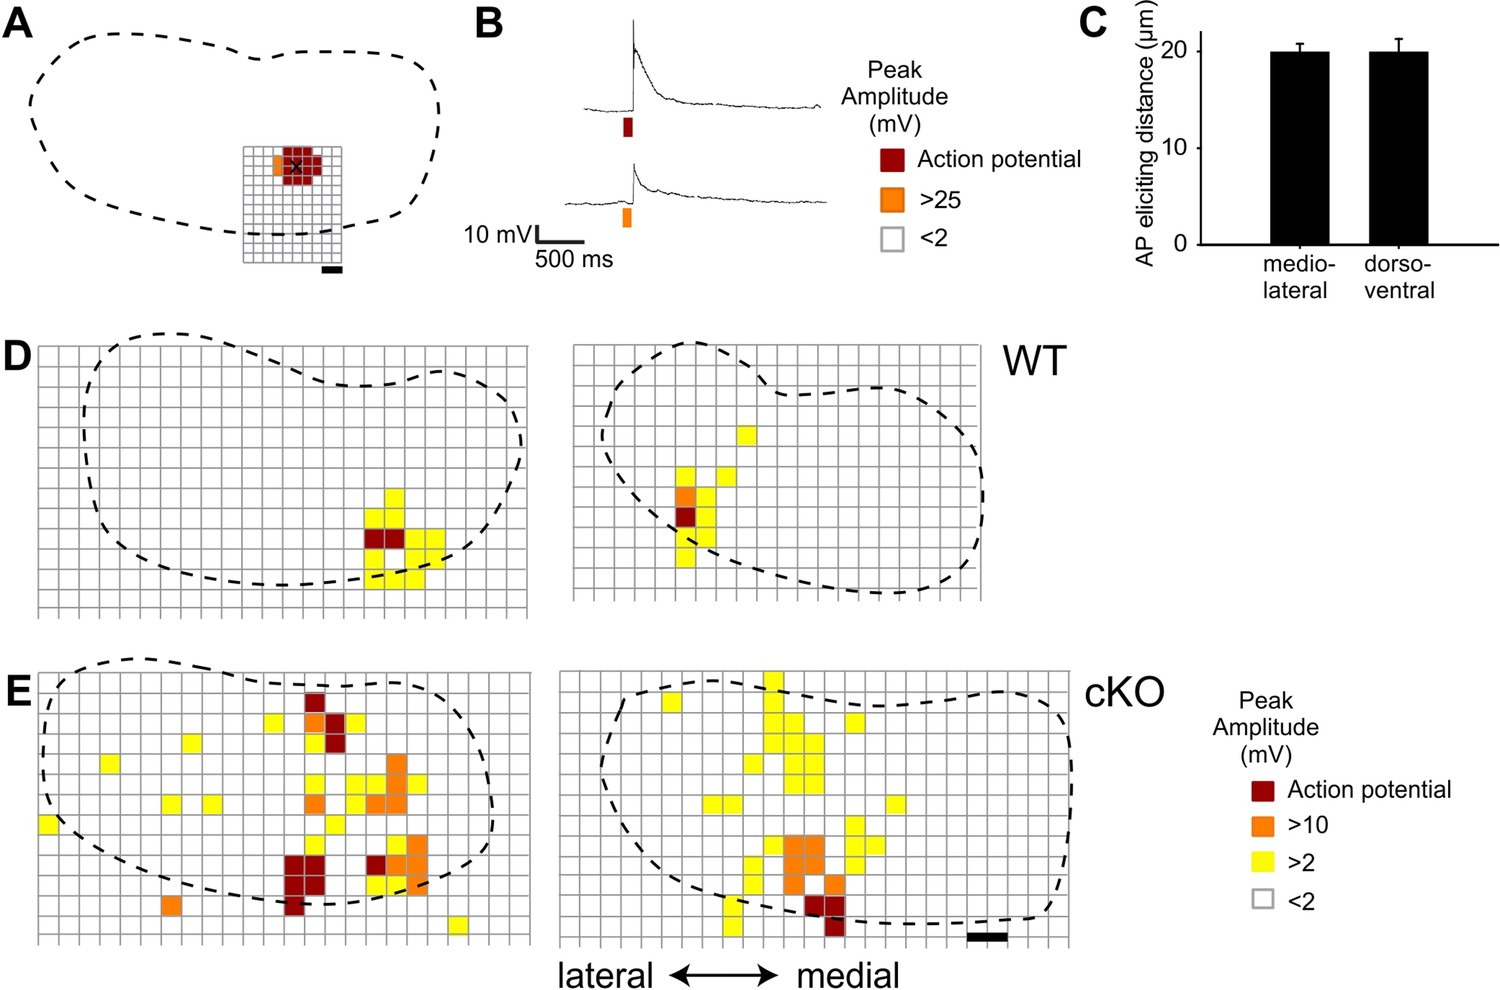
Spatial resolution of glutamate uncaging and additional examples of medial nucleus of the trapezoid body (MNTB) input maps recorded from wildtype and cKO mice.
(A) Schematic representation of the MNTB from a wildtype mouse recorded at P8 (dotted line represents the MNTB area, grid points show glutamate uncaging sites, black cross indicates the location of the recorded MNTB neuron). Spatial resolution of glutamate uncaging was assessed by whole-cell current-clamp recordings. Stimulation sites that evoked action potentials (red squares) were limited to the close proximity of the recorded MNTB neuron. Stimulation sites that were located in greater distance to the recorded MNTB neuron evoked subthreshold responses (orange squares) or no response (white squares). Scale bar 20 µm. (B) Uncaging of glutamate close to the recording site strongly depolarizes or elicits action potentials in the recorded MNTB neuron (see color code). (C) Quantification of the maximal action potential eliciting distance from the uncaging site to the center of the recorded MNTB neuron. Values represent mean ± SEM (n = 6 [P8–11]). (D, E) Schematic representations of the MNTB showing reconstructed maps of MNTB inputs, based on the current-clamp recordings in the lateral superior olive (LSO) (LSO not shown) from wildtype (D, left P11; D, right) and cKO mice (E, left P10; E, right P11). Scale bar 40 µm.
-
Figure 5—figure supplement 1—source data 1
Source data for Figure 5—figure supplement 1.
- https://cdn.elifesciences.org/articles/72251/elife-72251-fig5-figsupp1-data1-v2.xlsx
Author response image 1

(A-C) Example traces from the WT LSO cell for which the MNTB input map is shown in Figure S6D on the right.
The upper part of each trace shows the response of the LSO cell to glutamate uncaging in the MNTB. The timepoints of glutamate uncaging are shown in the lower part. (A) 1.5 min recording time. (B) 26 s recording time. (C) 1.3 s recording time. The trace clearly shows a depolarization of the LSO cell following glutamate uncaging in the MNTB (left) as well as a spontaneous signal (right).
Videos
Video 1
TMEM16 A is required for the generation of spontaneous volume changes in Kölliker’s organ (KÖ).
Time-lapse imaging (one image per second) reveals spontaneous volume changes of inner supporting cells of in a wildtype mouse cochlea (P7), which propagate in a wave-like manner up and down the cochlea turn. In contrast, volume changes are almost absent in the cochlea isolated from a cKO littermate (the bottom of the video shows erythrocytes moving in a blood vessel). Images were processed using a custom-written ImageJ macro and the ImageJ software. Each frame was subtracted from an average of five preceding frames to highlight the changes in light scattering caused by the changes in cell volume. The video (seven images per second) shows the top view of an area from an isolated cochlea turn. KÖ, Kölliker's organ; IHC, inner hair cells.
Video 2
TMEM16A is required for the propagation of cochlear Ca2+ waves.
Time-lapse imaging (one image per second) reveals spontaneous Ca2+ signals in the inner supporting cells that propagate up and down the cochlear turn in a wildtype mouse cochlea (P7). In contrast, Ca2+ waves are reduced to local Ca2+ events in the cochlea of a cKO littermate. Images were processed using a custom-written ImageJ macro and the ImageJ software. Each frame was subtracted from an average of five preceding frames to highlight the changes in Ca2+ concentration. The video (seven images per second) shows the top view of an area from an isolated cochlea turn. KÖ, Kölliker’s organ; IHC, inner hair cells.
Tables
Key resources table
| Reagent type (species) or resource | Designation | Source or reference | Identifiers | Additional information |
|---|---|---|---|---|
| Gene (mouse) | Ano1(Tmem16a) | GenBank | MGI:2142149 | |
| Strain, strain background (Mus musculus) | Ano1fl/fl | Published in Heinze et al., 2014 | ||
| Strain, strain background (M. musculus) | Ano2 KO | Published in Billig et al., 2011 | ||
| Strain, strain background (M. musculus) | Pax2Cre | Published in Ohyama and Groves, 2004 | ||
| Strain, strain background (M. musculus) | C57BL6/J | Jackson | 000664 | |
| Antibody | Anti-TMEM16A polyclonal rabbit | Published in Heinze et al., 2014 | IF (1:500) | |
| Antibody | Anti-TMEM16B polyclonal rabbit | Published in Billig et al., 2011 | IF (1:100)WB (1:1000) | |
| Antibody | Anti-CD31monoclonal rat | BioLegend | 102,502 | IF (1:500) |
| Antibody | Alexa Fluor 488, polyclonal goat anti-rabbit | Molecular Probes | A11008 | IF (1:1000) |
| Antibody | Cy3, polyclonal donkey anti-rabbit | Jackson ImmunoResearch | 711-165-152 | IF (1:10,000) |
| Antibody | DyLight 488polyclonal goat anti-rat | Bethyl Laboratories | A110-305D2 | IF (1:1000) |
| Antibody | HRP polyclonal goat anti-guinea pig | Merck | AP108P | WB (1:1000) |
| Chemical compound, drug | Fura-2 AM | Thermo Fisher | F1221 | Ca2+ dye |
| Chemical compound, drug | MNI-caged glutamate trifluoroacetate | Femtonics | Caged glutamate | |
| Chemical compound, drug | DAPI stain | Invitrogen | D1306 | (1 µg/ml) |
| Chemical compound, drug | Fluorogold hydroxystilbamidin-bis-(methansulfonat) | Sigma-Aldrich | 39286 | Fluorescent tracer |
| Chemical compound, drug | KetavetKetamine hydrochloride | Pfizer | 0.1 mg/g body weight | |
| Chemical compound, drug | RompunXylazine hydrochloride | Bayer | 0.5 µg/g body weight | |
| Software, algorithm | SigmaPlot 12.5 | Systat Software Inc | Statistical analysis | |
| Software, algorithm | GraphPad Prism | GraphPad Software Inc | Statistical analysis |
Additional files
-
Supplementary file 1
Distribution of interspike intervals and quantification of auditory brainstem response.
(a) Comparison of the distribution of interspike intervals (ISIs) between wildtype and cKO mice. (b) Quantification of auditory brainstem response (ABR) thresholds (mean ± SEM) in response to stimulation with tone bursts at 6, 12, and 24 kHz, or click stimulation. (c) Quantification of peak amplitudes (mean ± SEM) of the first three ABR waves (I–III) in response to click stimuli of various intensities (40–100 dB). (d) Quantification of latencies (mean ± SEM) of the first three ABR waves (I–III) in response to click stimuli of various intensities (40–100 dB).
- https://cdn.elifesciences.org/articles/72251/elife-72251-supp1-v2.docx
-
Transparent reporting form
- https://cdn.elifesciences.org/articles/72251/elife-72251-transrepform1-v2.pdf
Download links
A two-part list of links to download the article, or parts of the article, in various formats.
Downloads (link to download the article as PDF)
Open citations (links to open the citations from this article in various online reference manager services)
Cite this article (links to download the citations from this article in formats compatible with various reference manager tools)
The Cl--channel TMEM16A is involved in the generation of cochlear Ca2+ waves and promotes the refinement of auditory brainstem networks in mice
eLife 11:e72251.
https://doi.org/10.7554/eLife.72251


