ACE2 pathway regulates thermogenesis and energy metabolism
- Beijing Key Laboratory of Diabetes Research and Care, Department of Endocrinology, Beijing Diabetes Institute, Beijing Tongren Hospital, Capital Medical University, China
- Department of Physiology, UT Southwestern Medical Center at Dallas, United States
- Key Laboratory of Animal Ecology and Conservation Biology, Institute of Zoology, and State Key Laboratory of Brain and Cognitive Sciences, Institute of Biophysics, Chinese Academy of Sciences, China
- Center for Research on Genomics and Global Health, National Human Genome Research Institute, National Institutes of Health, United States
- State Key Laboratory of Pharmaceutical Biotechnology, Department of Medicine, University of Hong Kong, China
Figures
Figure 1
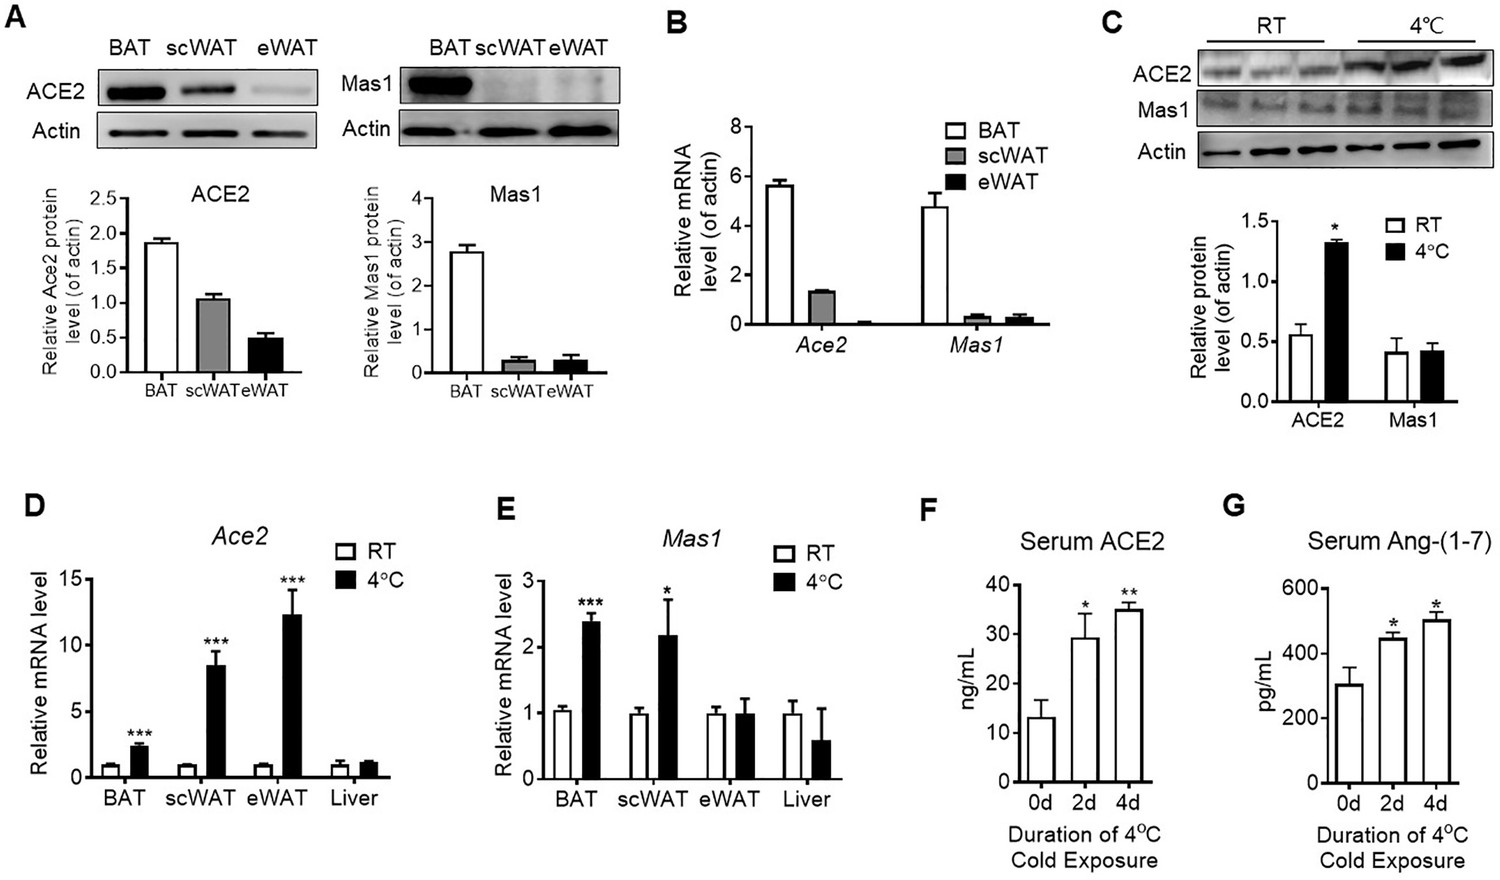
ACE2 pathway is activated by cold exposure.
Eight-week-old male C57BL/6 J mice were housed at room temperature (RT) for 2 weeks before cold exposure at 4 °C for various time periods as indicated. (A) Levels of ACE2 and Mas1 protein from interscapular brown adipose tissue (BAT), subcutaneous and epididymal white adipose tissue (scWAT and eWAT) of C57BL/6 mice at room temperature (RT), as determined by Western blotting (n = 3/each group). (B) Levels of Ace2 and Mas1 mRNA from BAT, scWAT and eWAT of C57BL/6 mice at RT, as determined by qPCR (n = 3/each group). (C) Levels of ACE2 and Mas1 protein from interscapular BAT of C57BL/6 mice at RT or exposed to 4 °C for 6 hr, as determined by western blotting (n = 3/each group). (D, E) Levels of Ace2 and Mas1 mRNA from BAT, scWAT, eWAT and liver of C57BL/6 mice exposed to 4 °C for 24 hr, as determined by qPCR (n = 6/each group). (F, G) Serum levels of ACE2 (F) and Ang-(1-7) (G), as determined by ELISA (n = 4–6/each group). Data represent mean ± SEM. *p < 0.05, **p < 0.01 and ***p < 0.001 vs Control group by Student’s t-test, or one-way ANOVA.
Figure 2 with 1 supplement
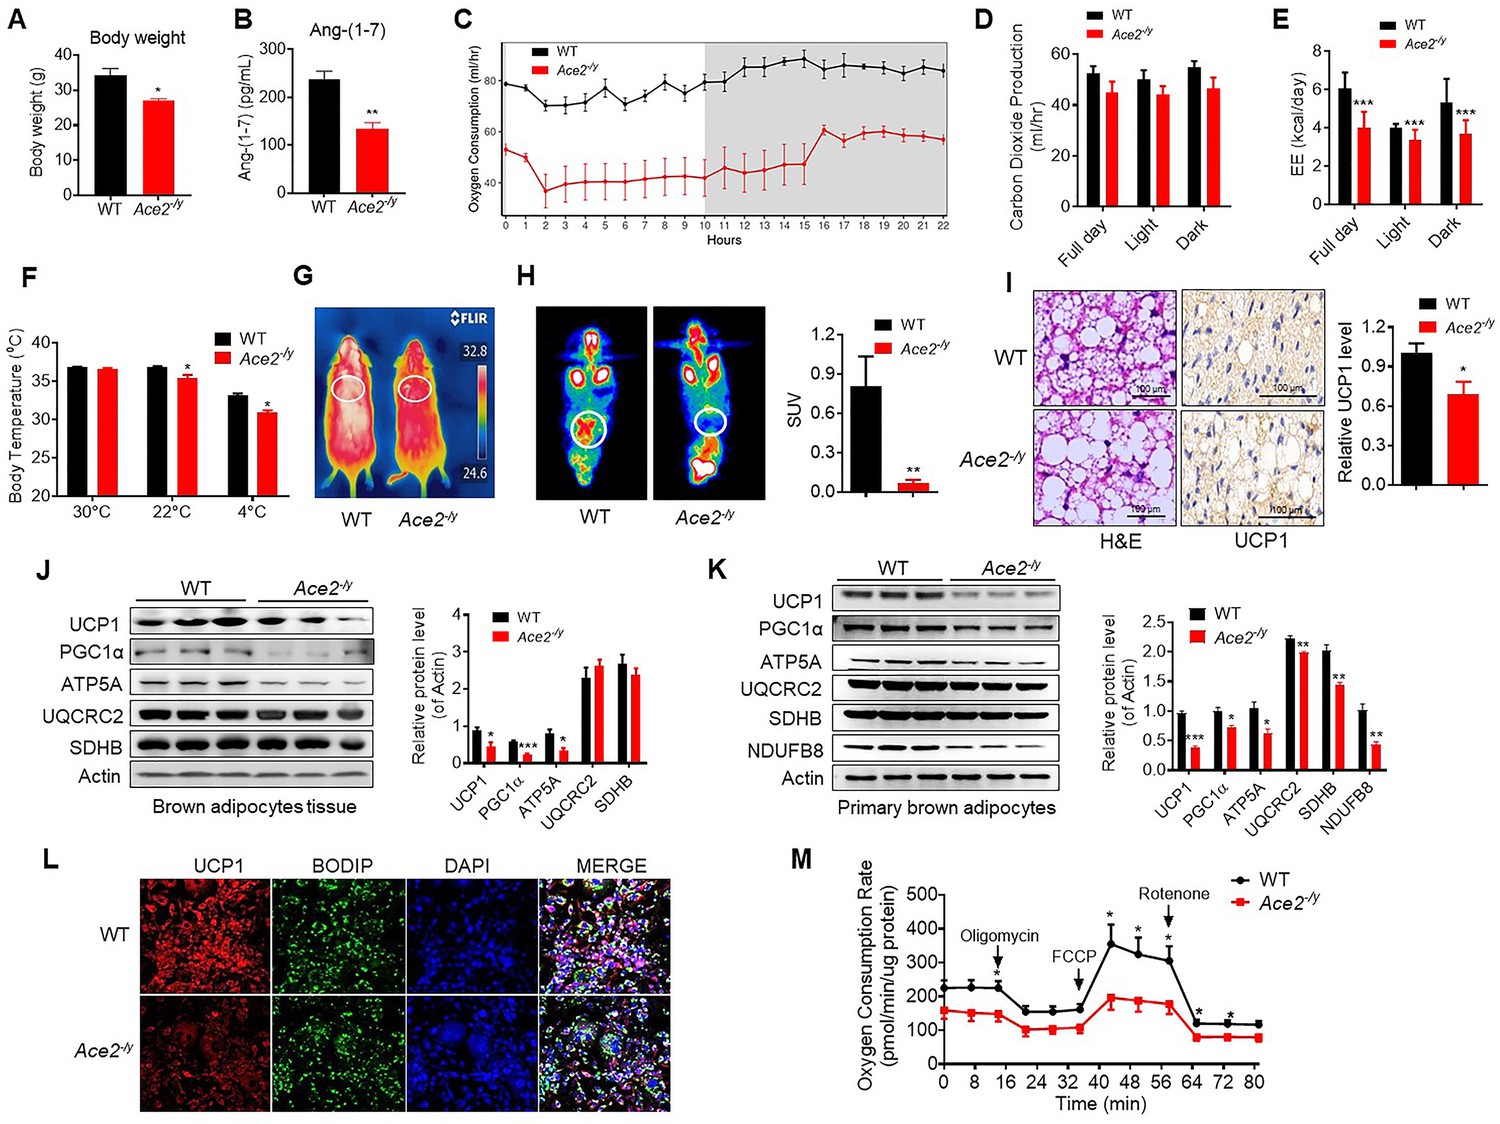
Ace2 deficiency impairs thermogenesis, BAT activity, and energy metabolism.
Eight-week-old male Ace2-/y mice and their wild-type (WT) mice (controls) had a high-fat diet (HFD) for 8 weeks. (A) Body weight of Ace2-/y and WT mice fed a HFD for 8 weeks (n = 4–5/each group). (B) Serum levels of Ang-(1-7), as determined by ELISA (n = 4–6/each group). (C–E) Energy expenditure was evaluated by measurement of oxygen consumption (VO2) (C), carbon dioxide release (VCO2) (D) and energy expenditure (EE) (E) over a 24 hours period (n = 5/each group). (F) Core body temperature at 30 °C, 22°C and 4°C for 8 hr in Ace2-/y and WT mice (n = 5/each group). (G) Infrared thermal images at 22 °C in Ace2-/y and WT mice. (H) Representative tomography–computed tomography (PET-CT) image and standard uptake values (SUVs) (n = 4/each group). (I) Representative haematoxylin and eosin (H&E) staining and uncoupling protein-1 (UCP1) immunostaining from BAT sections of Ace2-/y and WT mice exposure at 4 °C (n = 5/each group). (J) Representative western blots showing the changes of key proteins of energy expenditure and thermogenesis in BAT of Ace2-/y and WT mice exposure at 4 °C (n = 3/each group). (K) Representative western blots showing the key protein changes in primary brown adipocytes from Ace2-/y and WT mice (n = 3/each group). (L) Representative immunofluorescent images of in vitro differentiated primary brown adipocytes of Ace2-/y and WT mice, primary brown adipocytes show staining for UCP1 (red), boron-dipyrromethene (BODIPY) (green; neutral lipid dye), and DAPI (blue; nuclei). (M) Continuous measurement of oxygen consumption rate (OCR) in primary brown adipocytes from Ace2-/y mice and WT littermates. Oxygen consumption was performed under basal conditions, following the addition of oligomycin (1 μM), the pharmacological uncoupler FCCP (1 μM) or the Complex III and I inhibitor antimycin A and rotenone (0.5 μM) (n = 4–5/each group). Data represent mean ± SEM. *p < 0.05, **p < 0.01 vs WT group by Student’s t-test, or ANCOVA.
Figure 2—figure supplement 1
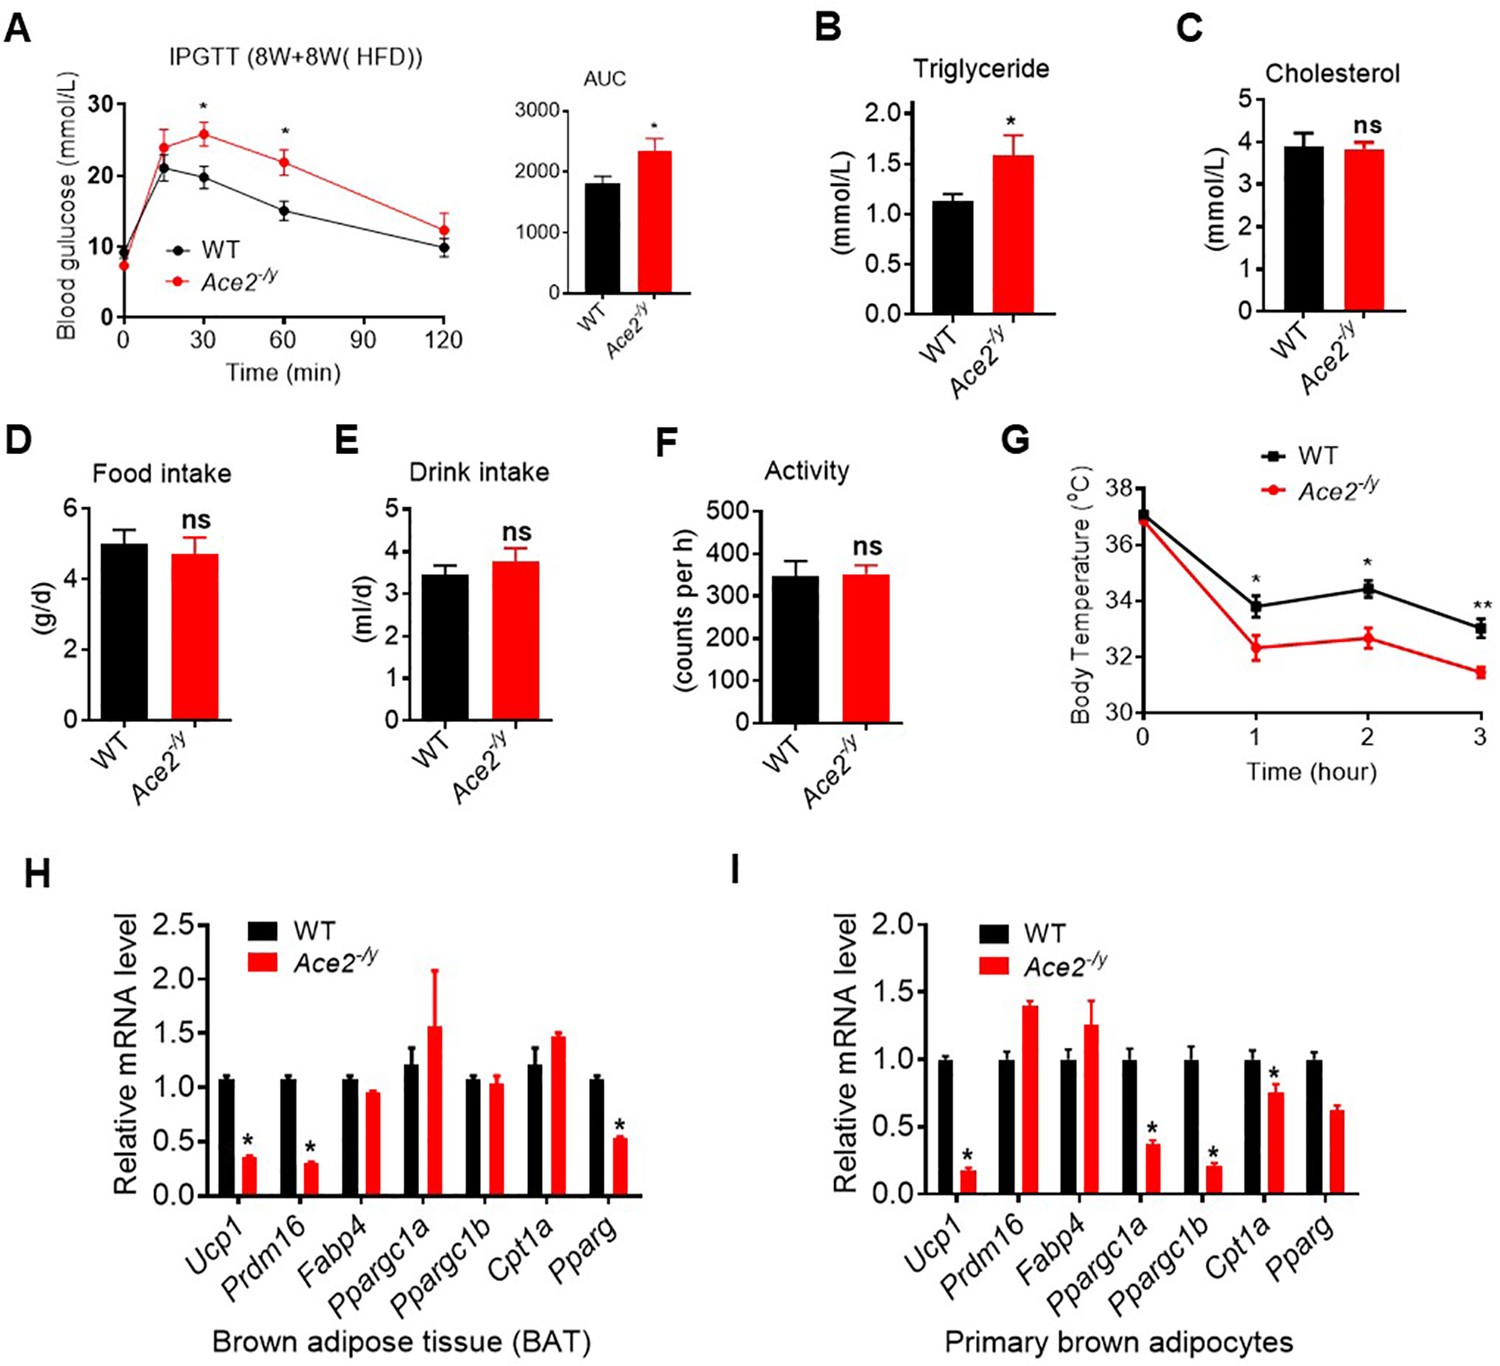
Ace2 deficiency impairs adaptative thermogenesis by cold stimulation.
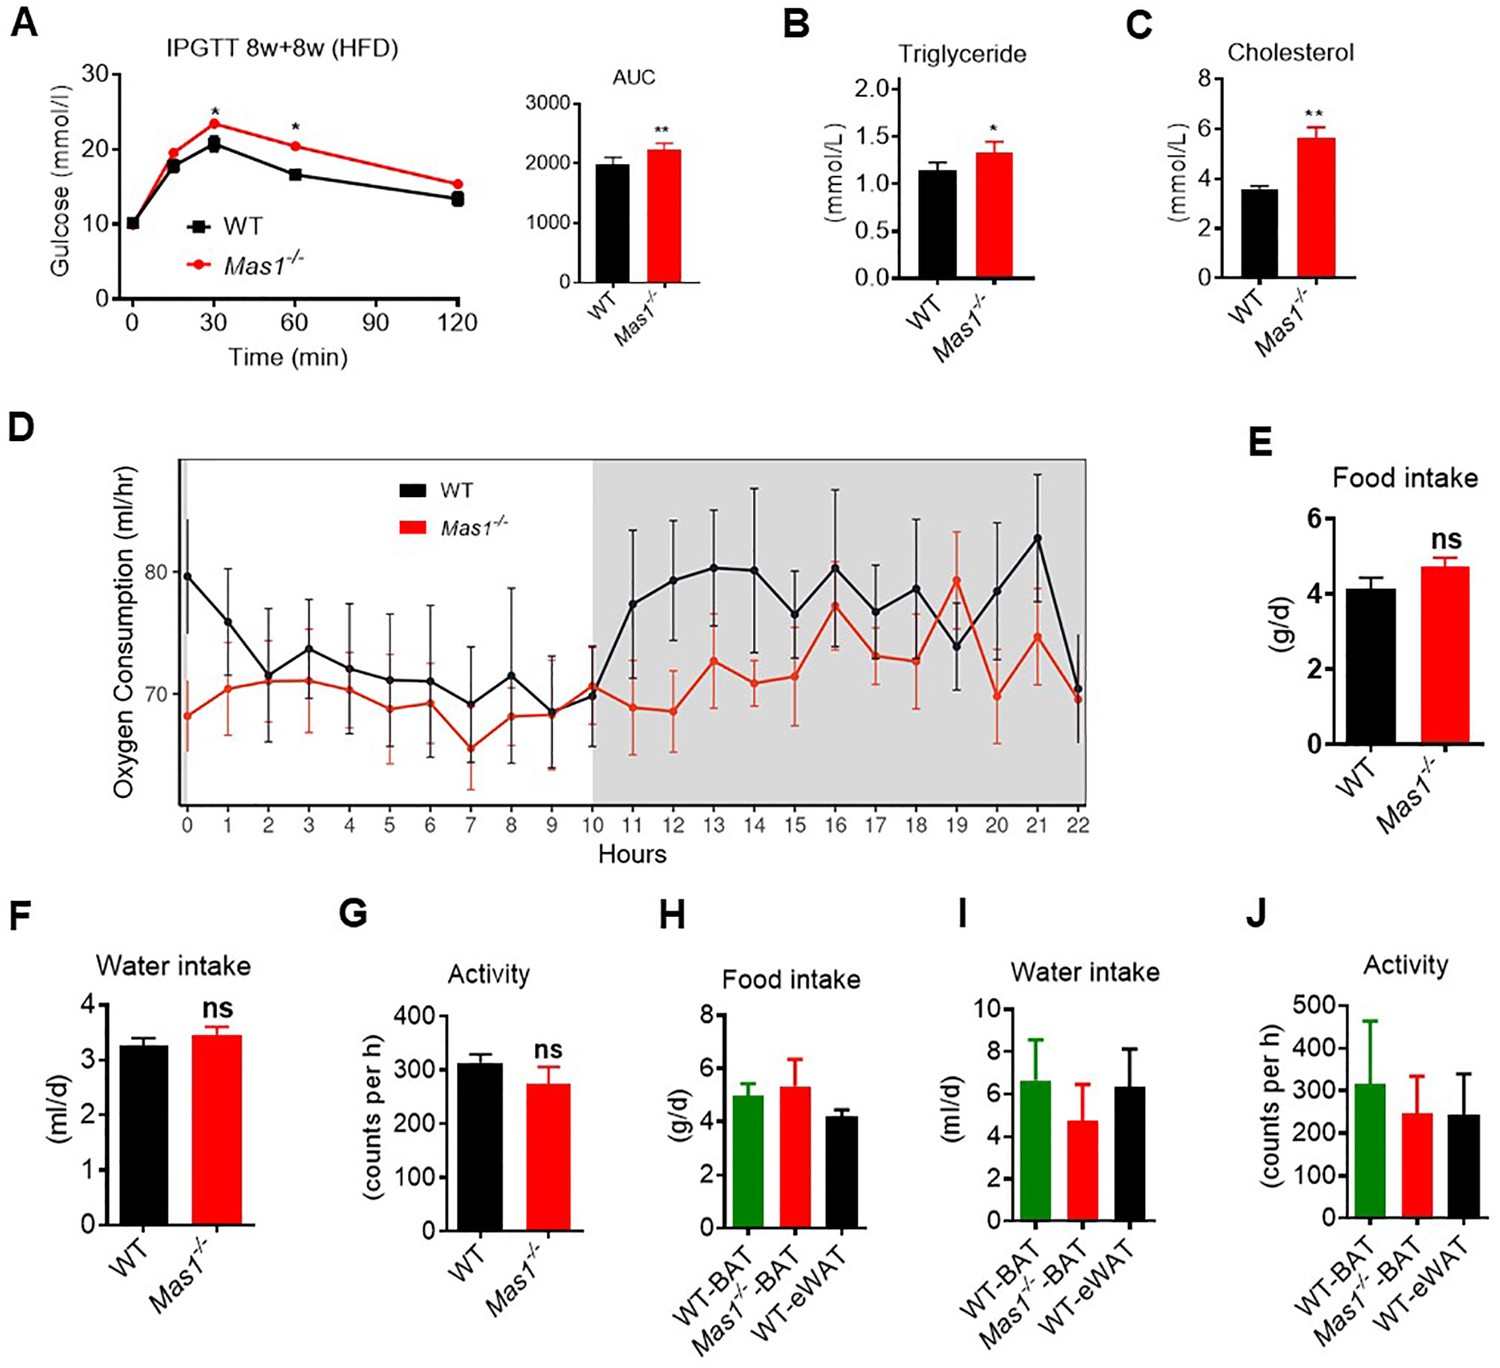
Eight-week-old male Ace2-/y mice and their WT (control) mice had an HFD for 8 weeks (Ace2-/y vs WT). (A–C) Intraperitoneal glucose tolerance test (IPGTT), serum triglyceride and cholesterol levels in Ace2-/y and WT mice (n = 5–6/each group). (D–F) 24 hr food intake, water intake and physical activity were measured in Ace2-/y and WT mice (n = 5/each group). (G) Core body temperature at 4 °C for the indicated lengths of time in Ace2-/y and WT mice (n = 4/each group). (H) Relative mRNA levels of mitochondrial related genes, fatty acid oxidation related genes and transcription factors in BAT of in Ace2-/y and WT mice exposure at 4 °C (n = 3/each group). (I) Relative mRNA levels of mitochondrial related genes, fatty acid oxidation related genes and transcription factors in primary brown adipocytes from Ace2-/y and WT mice (n = 3/each group). Data represent mean ± SEM. *p < 0.05, **p < 0.01 vs WT group by Student’s t-test.
Figure 3 with 1 supplement
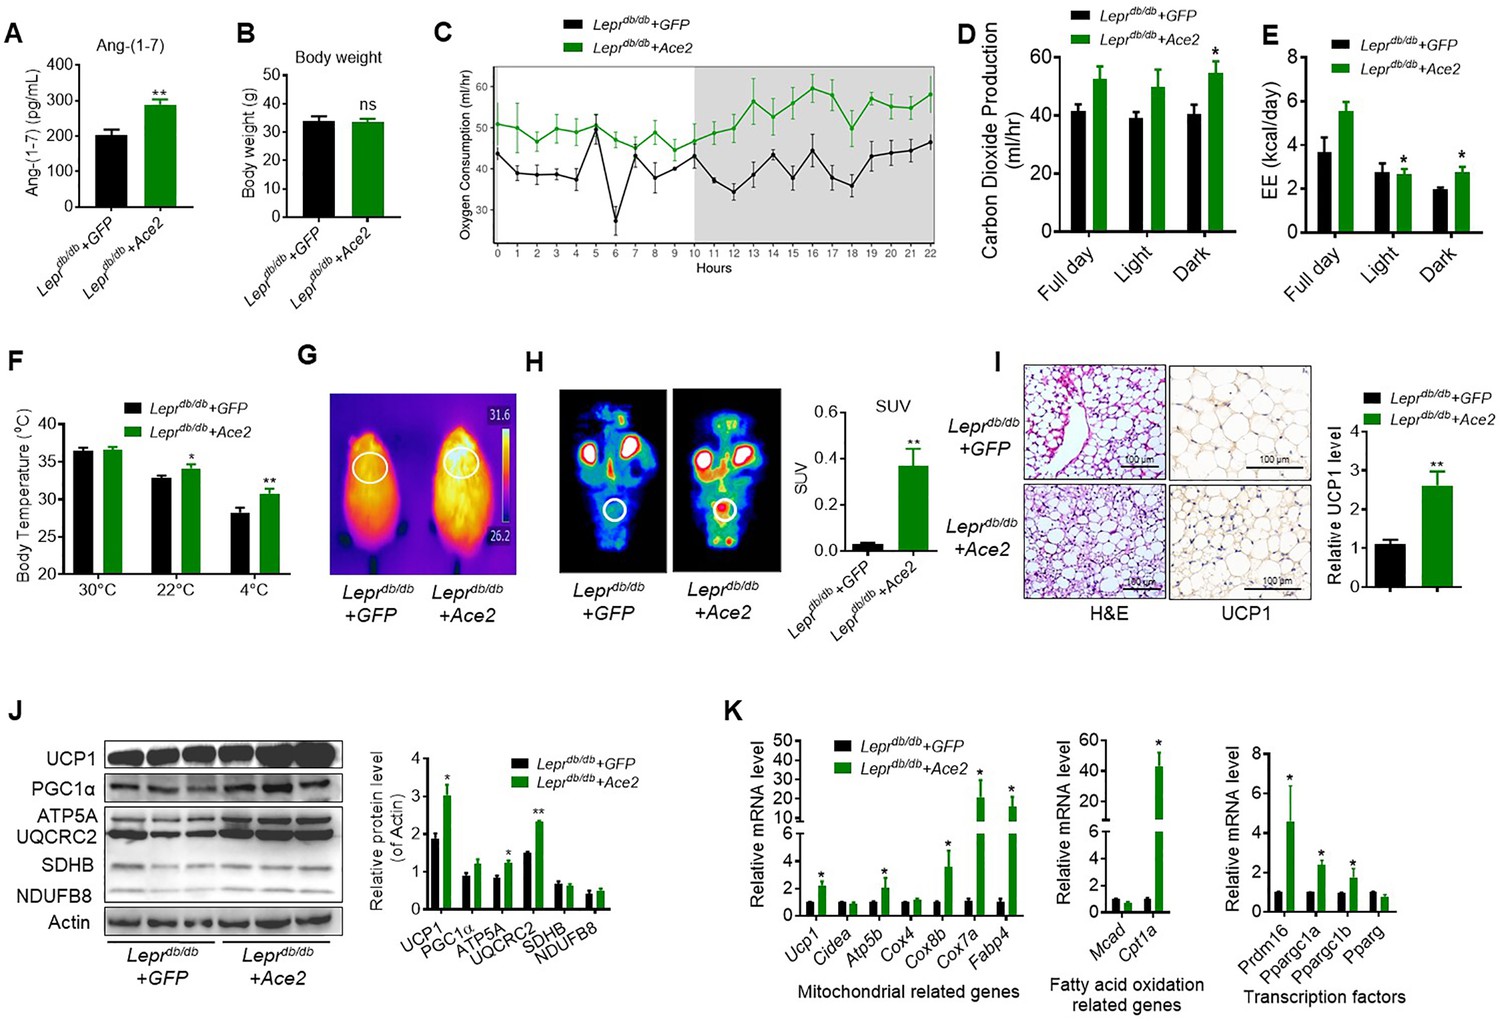
ACE2 enhances thermogenesis, BAT activity, and energy metabolism in Leprdb/db obese mice.
Ace2 over-expression adenovirus (Ad-Ace2) and Ad-GFP (control) were introduced into the Leprdb/db obese mice by tail vein injection. The ad-Ace2 and Ad-GFP treated Leprdb/db mice were used at the 6th day post-virus injection. (A) Serum levels of Ang-(1-7), as determined by ELISA (n = 6–7/each group). (B) Body weight of ad-Ace2 and Ad-GFP treated Leprdb/db mice at the 6th day post-virus injection (n = 4–6/each group). (C–E) Energy expenditure was evaluated by measurement of oxygen consumption (VO2) (C), carbon dioxide release (VCO2) (D) and energy expenditure (EE) (E) over a 24-hr period (n = 4–6/each group). (F) Core body temperature at 30 °C, 22°C and 4°C for 8 hr (n = 5/each group). (G) Infrared thermal images at 22 °C in Leprdb/db+ Ace2 and Leprdb/db+ GFP mice (n = 4/each group). (H) Representative tomography–computed tomography (PET-CT) image and standard uptake values (SUVs) (n = 4/each group). (I) Representative H&E staining and UCP1 immunostaining from BAT sections of Leprdb/db+ Ace2 and Leprdb/db+ GFP mice exposure at 4 °C (n = 5/each group). (J) Representative western blots showing the changes of key proteins of energy expenditure and thermogenesis in BAT of Leprdb/db+ Ace2 and Leprdb/db+ GFP mice exposure at 4 °C (n = 3/each group). (K) Relative mRNA levels of mitochondrial related genes, fatty acid oxidation related genes and transcription factors in BAT of Leprdb/db+ Ace2 and Leprdb/db+ GFP mice exposure at 4 °C (n = 5–6/each group). Data represent mean ± SEM. *p < 0.05, **p < 0.01 vs Ad-GFP group by Student’s t-test, or ANCOVA.
Figure 3—figure supplement 1
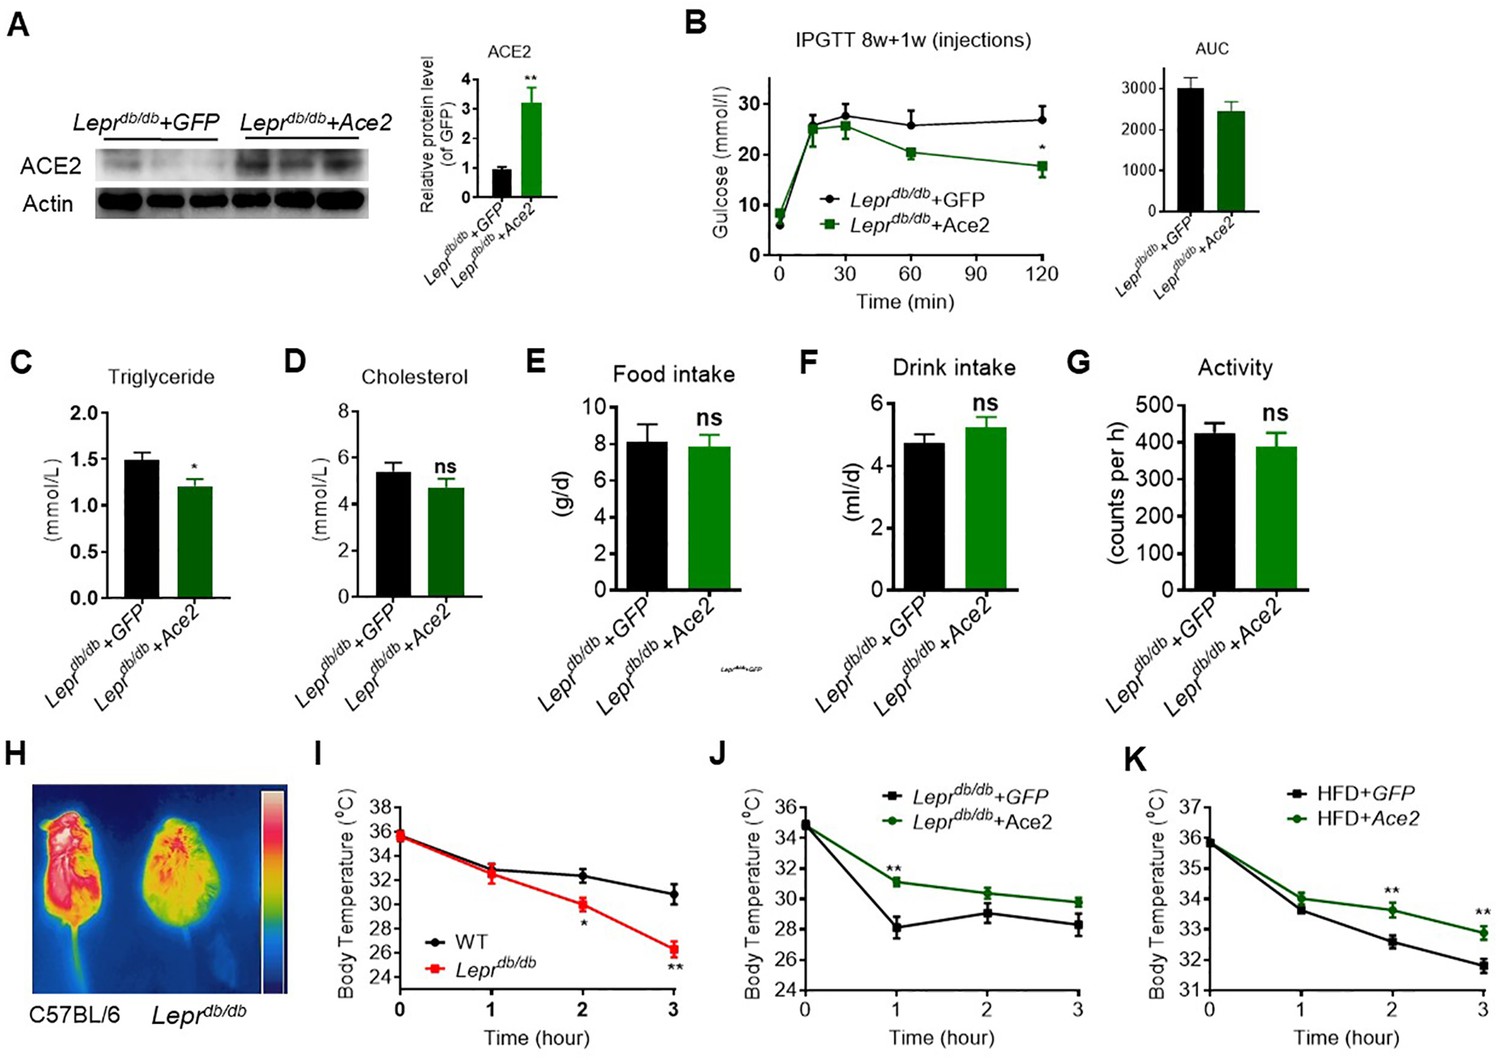
ACE2 enhance BAT activity and whole-body energy metabolism in Leprdb/db mice.
The ad-Ace2 and Ad-GFP-treated Leprdb/db mice were used at the 6th day post-virus injection (Leprdb/db+ Ace2 vs Leprdb/db+ GFP). (A) Ace2 overexpression was verified in BAT of Ad-Ace2-treated Leprdb/db mice by Western blotting (n = 3/each group). (B–D) Intraperitoneal glucose tolerance test (IPGTT), serum triglyceride and cholesterol levels in Leprdb/db+ Ace2 and Leprdb/db+ GFP mice (n = 3–5/each group). (E–G) 24 hr food intake, water intake and physical activity were measured in Leprdb/db+ Ace2 and Leprdb/db+ GFP mice (n = 4–6/each group).(H, I) Infrared thermal images at 22 °C and core body temperature at 4 °C for the indicated lengths of time in C57BL/6 and Leprdb/d mice (n = 5/each group). (J) Core body temperature at 4 °C for the indicated lengths of time in Leprdb/db+ Ace2 and Leprdb/d + GFP mice (n = 4–7/each group). (K) Core body temperature at 4 °C for the indicated lengths of time in HFD + Ace2 and HFD + GFP mice (n = 6–7/each group). Data represent mean ± SEM. *p < 0.05, **p < 0.01 vs WT/GFP group by Student’s t-test.
Figure 4 with 1 supplement
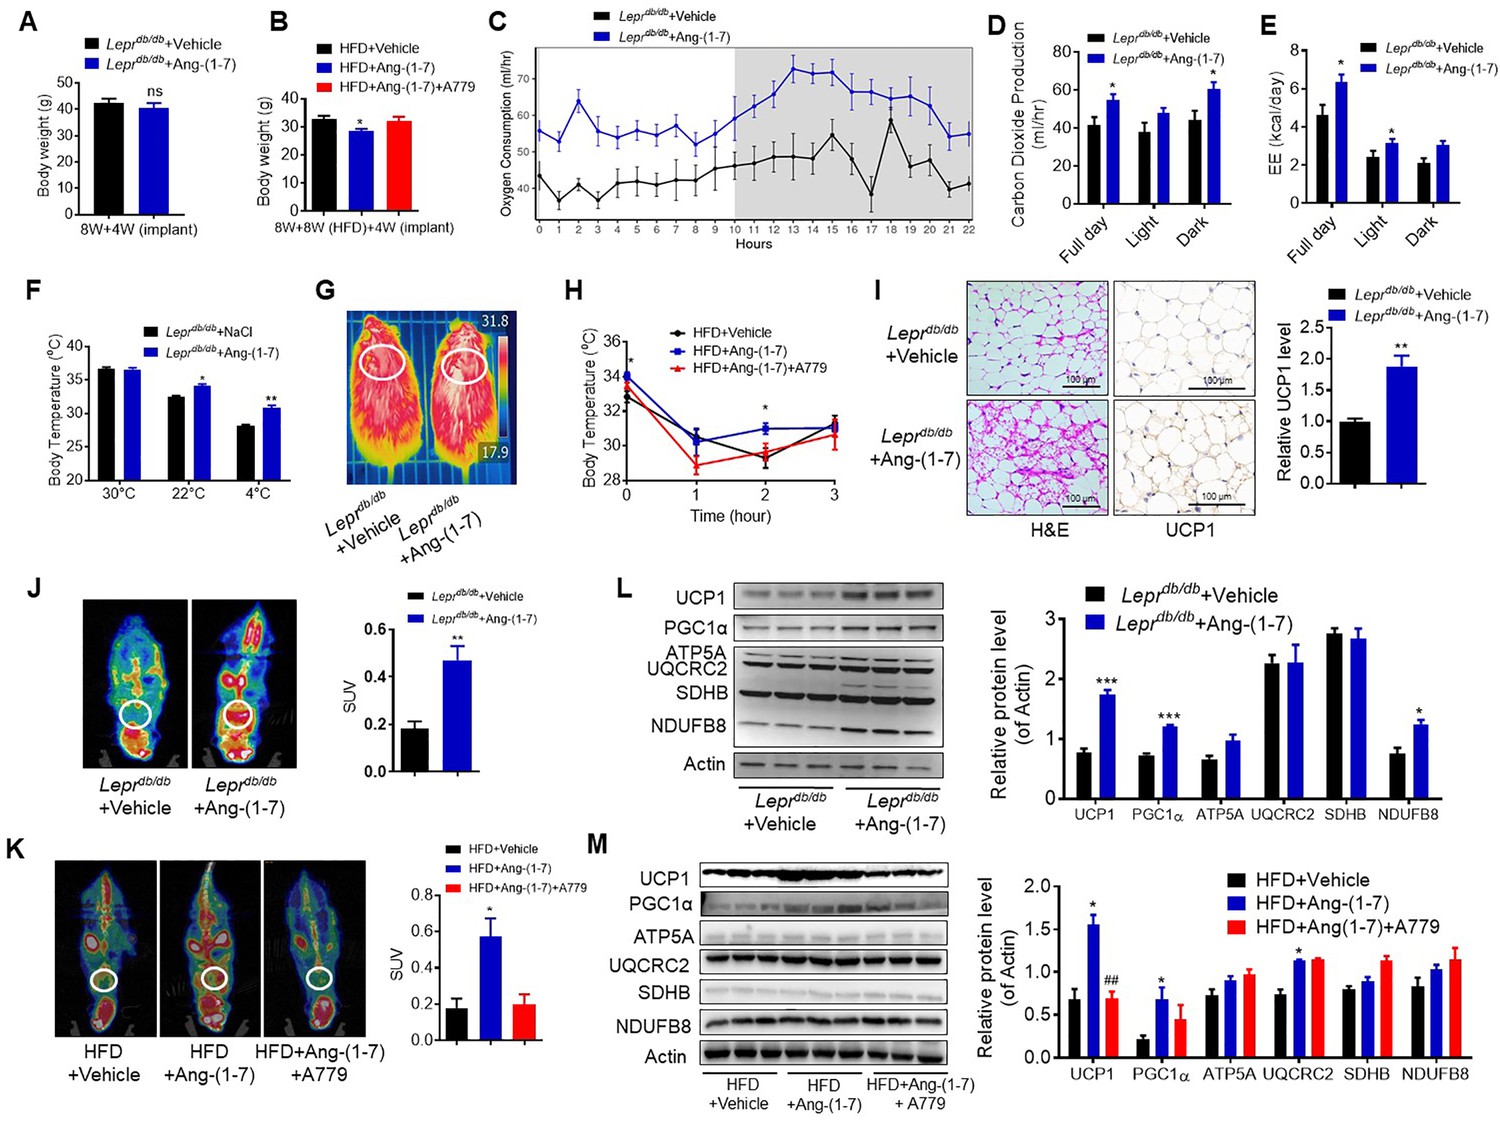
Ang-(1-7) promotes thermogenesis, BAT activity, and energy metabolism in the Leprdb/db and the HFD-induced obese mice.
Ang-(1-7) administration by subcutaneous implanted micro-osmotic pumps in the Leprdb/db obese mice and the high-fat diet (HFD)-induced obese mice were used. The Leprdb/db mice were treated with Ang-(1-7) by subcutaneous infusion of Ang-(1-7) or saline using osmotic mini-pumps for 4 weeks. Six-week-old male C57BL/6 J mice were used to develop obesity by HFD diet for 8 weeks, and the mice treated with Ang-(1-7), A779 (an Ang-(1-7) antagonist), or saline by osmotic mini-pumps at the 4th weeks post-HFD. (A) Body weight of Leprdb/db+ Ang-(1-7) and Leprdb/db+ Vehicle mice at the 4th week post micro-osmotic pumps implantation (n = 5–6/each group). (B) Body weight of HFD + Ang-(1-7), HFD + A779 and HFD + Vehicle mice at the 4th week post micro-osmotic pumps implantation (n = 4–7/each group). (C–E) Energy expenditure was evaluated by measurement of oxygen consumption (VO2) (C), of carbon dioxide release (VCO2) (D) and of energy expenditure (EE) (E) over a 24 hr period in Leprdb/db+ Ang-(1-7) and Leprdb/db+ Vehicle mice (n = 4–6/each group). (F) Core body temperature at 30 °C, 22°C and 4°C for 8 hr in Leprdb/db+ Ang-(1-7) and Leprdb/db-Vehicle mice (n = 5/each group). (G) Infrared thermal images at 22 °C in Leprdb/db+ Ang-(1-7) and Leprdb/db+ Vehicle mice. (H) Core body temperature at 4 °C for the indicated lengths of time in HFD + Ang-(1-7), HFD + A779 and HFD + Vehicle mice (n = 4–5/each group). (I) Representative H&E staining and UCP1 immunostaining from BAT sections of Leprdb/db+ Ang-(1-7) and Leprdb/db+ Vehicle mice exposure at 4 °C (n = 5/each group). (J) Representative Positron emission tomography–computed tomography (PET-CT) image and SUVs of Leprdb/db+ Ang-(1-7) and Leprdb/db+ Vehicle mice (n = 4/each group). (K) Representative PET-CT image and SUVs of HFD + Ang-(1-7), HFD + A779 and HFD + Vehicle mice (n = 3/each group). (L) Representative western blots showing the changes of key proteins of energy expenditure and thermogenesis in BAT of Leprdb/db+ Ang-(1-7) and Leprdb/db+ Vehicle mice exposure at 4 °C (n = 3/each group). (M) Representative western blots showing the changes of key proteins of energy expenditure and thermogenesis in BAT of HFD + Ang-(1-7), HFD + A779 and HFD + Vehicle mice exposure at 4 °C (n = 3/each group). Data represent mean ± SEM. *p < 0.05, **p < 0.01 vs Vehicle group by Student’s t-test, ANCOVA, or one-way ANOVA.
Figure 4—figure supplement 1
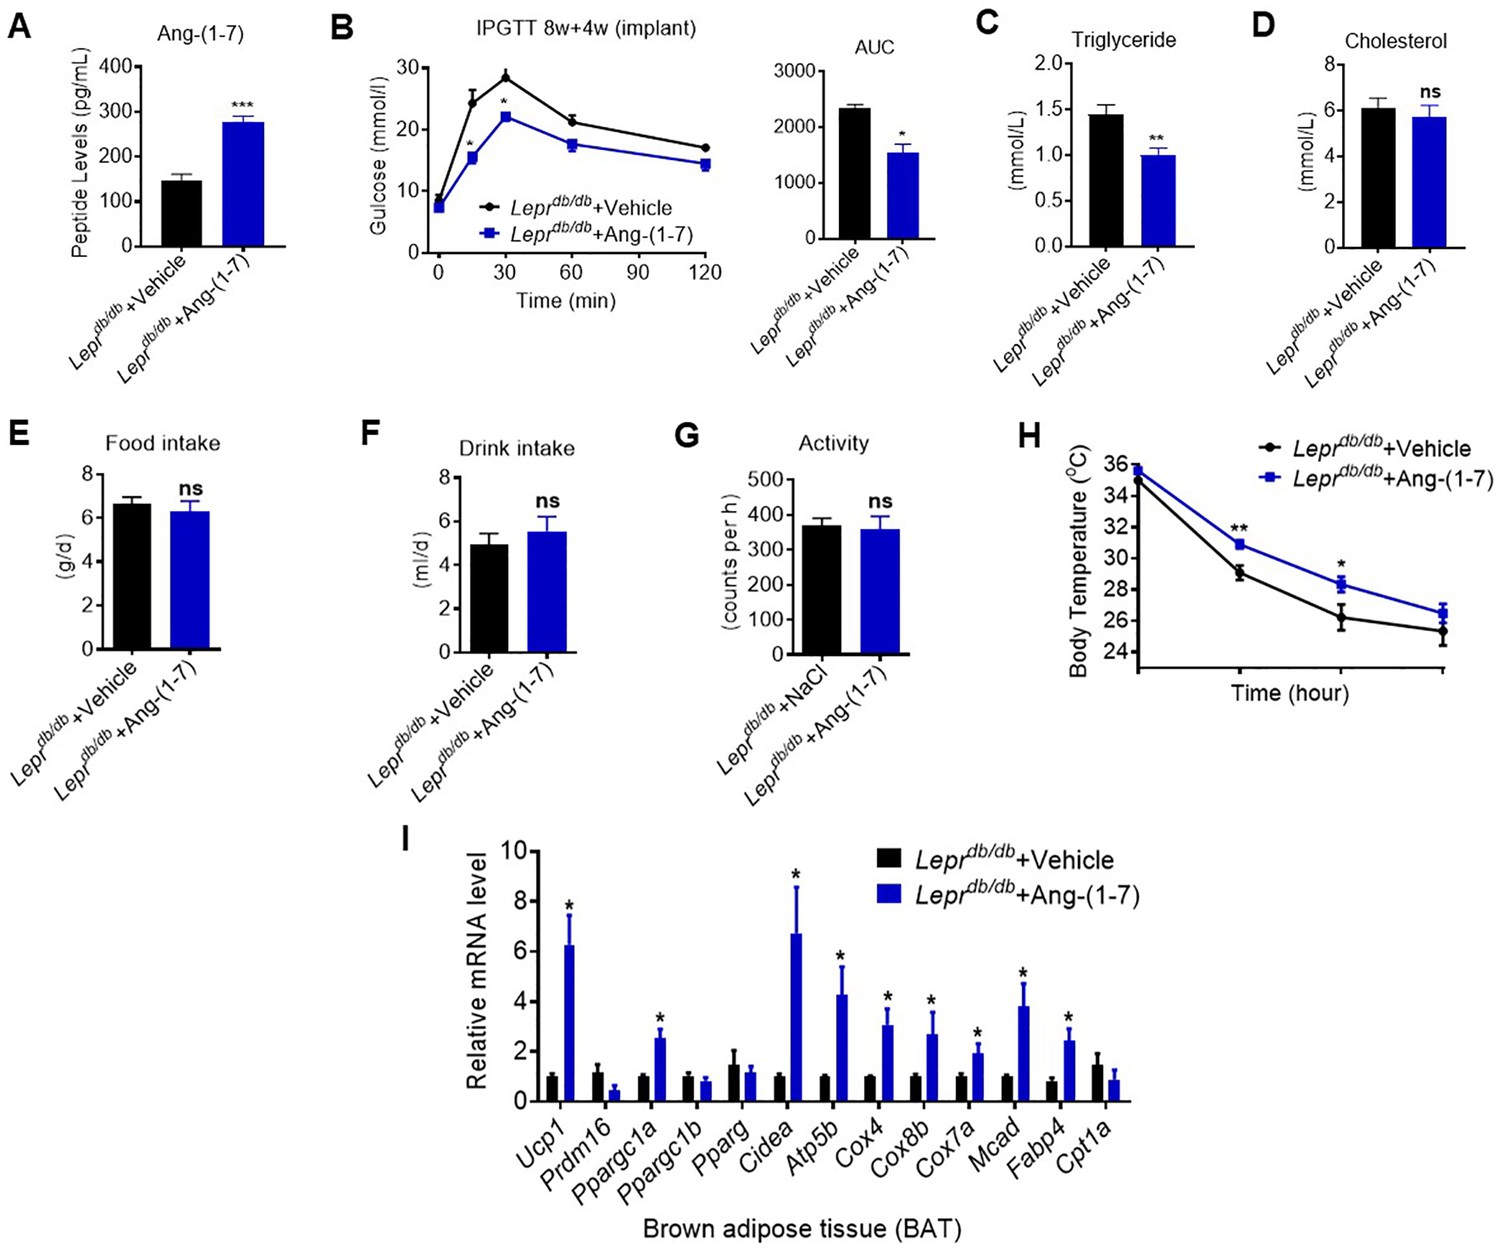
Ang-(1-7) promoted thermogenesis and energetic metabolism in BAT of Leprdb/db mice during cold challenge.
Leprdb/db mice were treated with Ang-(1-7) by subcutaneous infusion of Ang-(1-7) or saline using osmotic mini-pumps for 4 weeks (Leprdb/db+ Ang-(1-7) vs Leprdb/db+ Vehicle). (A) Serum levels of Ang-(1-7) as determined by ELISA in Leprdb/db+ Ang-(1-7) and Leprdb/db+ Vehicle mice (n = 6–8/each group). (B–D) Intraperitoneal glucose tolerance test (IPGTT), serum triglyceride and cholesterol levels in Leprdb/db+ Ang-(1-7) and Leprdb/db+ Vehicle mice (n = 4–5/each group). (E–G) 24 h food intake, water intake and physical activity were measured in Leprdb/db+ Ang-(1-7) and Leprdb/db+ Vehicle mice (n = 4–6/each group). (H) Core body temperature at 4 °C for the indicated lengths of time in Leprdb/db+ Ang-(1-7) and Leprdb/db+ Vehicle mice (n = 5–6/each group). (I) Relative mRNA levels of mitochondrial related genes, fatty acid oxidation related genes and transcription factors in BAT of in Leprdb/db+ Ang-(1-7) and Leprdb/db+ Vehicle mice exposure at 4 °C (n = 5–6/each group). Data represent mean ± SEM. *p< 0.05, **p < 0.01 vs Vehicle group by Student’s t-test.
Figure 5 with 1 supplement
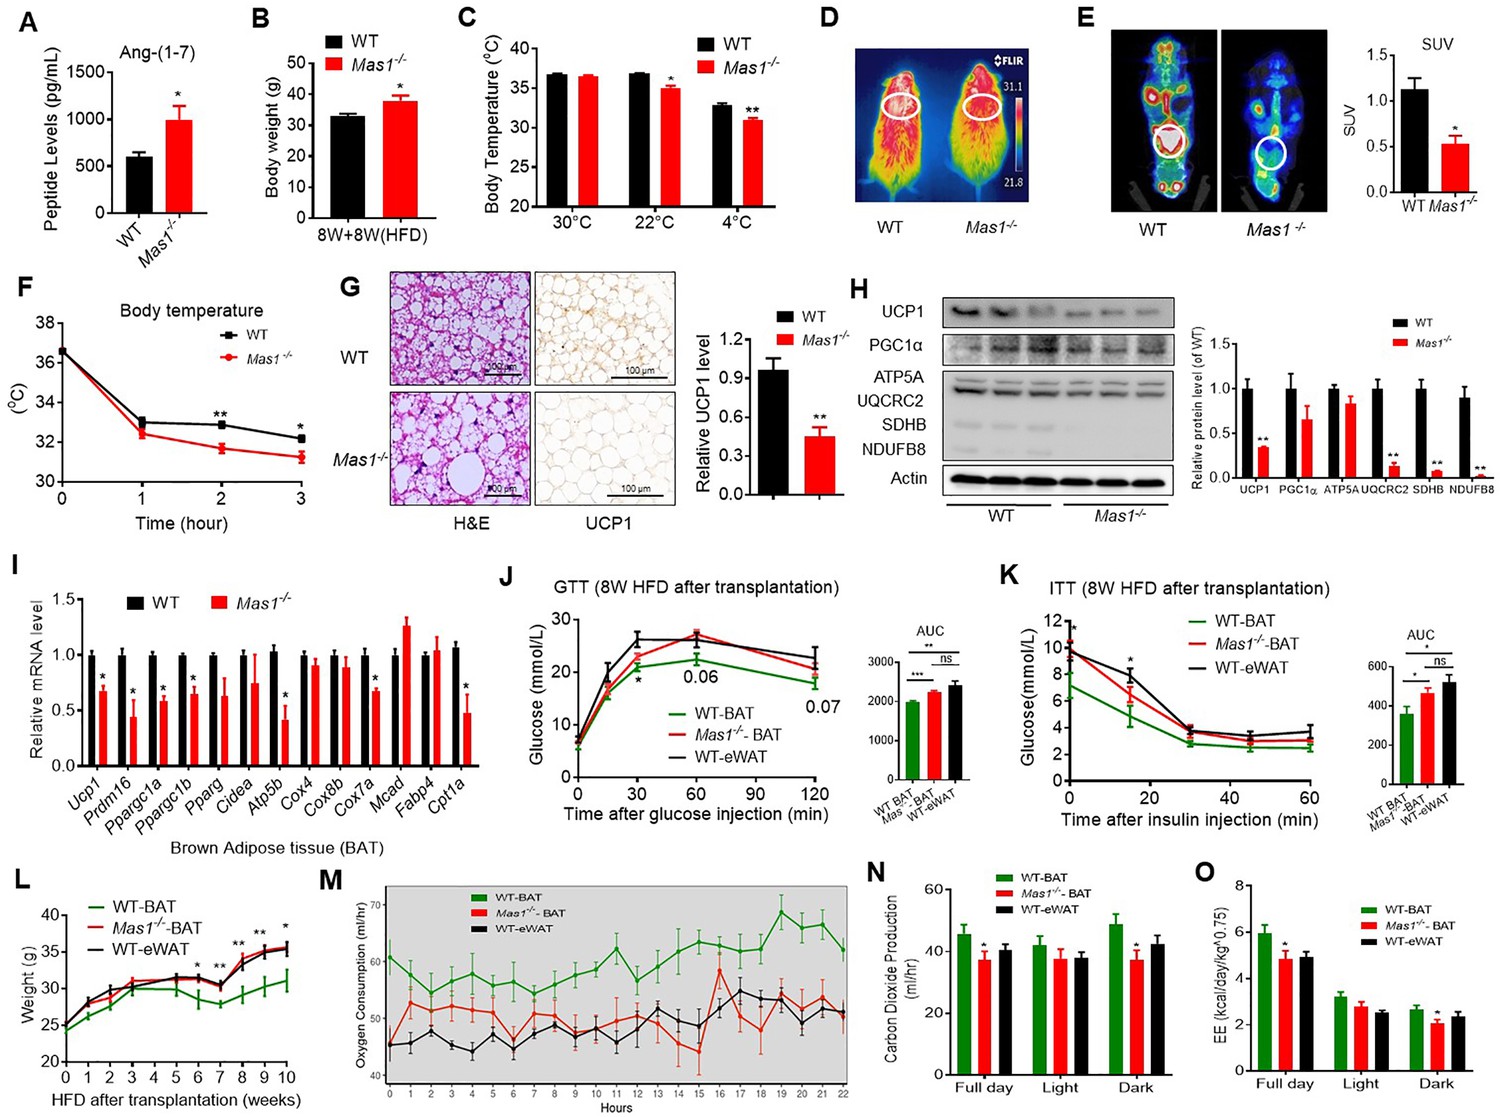
Ablation of Mas1 impairs thermogenesis, BAT activity, and energetic metabolism.
(A–I) Eight-week-old male Mas1-/- mice and their WT (control) mice had a high-fat diet (HFD) for 8 weeks (Mas1-/- vs WT). (J–O) BAT of C57B/L6 recipient mice was removed from the interscapular region. Then, the BAT dissected from Mas1-/- donor mice, was subcutaneously transplanted into the dorsal interscapular region of C57B/L6 recipient mice (WT+ Mas1-/--BAT). C57B/L6 recipient mice transplanted with C57B/L6 BAT (WT+ WT BAT) and C57B/L6 epididymal white adipose tissue (eWAT) (WT+ WT eWAT) were used as control. The recipient mice were then fed an HFD immediately after the transplantation and continued for 10 weeks (WT+ Mas1-/--BAT vs WT+ WT BAT, WT+ WT eWAT). (A) Serum levels of Ang-(1-7) as determined by ELISA in Mas1-/- and WT mice (n = 3–5/each group). (B) Body weight in Mas1-/- and WT mice fed an HFD for 8 weeks (n = 4–5/each group). (C) Core body temperature at 30 °C, 22°C and 4°C for 8 hr in Mas1-/- and WT mice (n = 5/each group).(D) Infrared thermal images at 22 °C in Mas1-/- and WT mice. (E) Representative PET-CT image and SUVs of Mas1-/- and WT mice (n = 3/each group). (F) Core body temperature at 4 °C for the indicated lengths of time in Mas1-/- and WT mice (n = 4–5/each group). (G) Representative H&E staining and UCP1 immunostaining from BAT sections of Mas1-/- and WT mice exposure at 4 °C (n = 5/each group). (H) Representative western blots showing the changes of key proteins in BAT of Mas1-/- and WT mice exposure at 4 °C (n = 3/each group). (I) Relative mRNA levels of mitochondrial related genes, fatty acid oxidation related genes and transcription factors in BAT of in Mas1-/- and WT mice exposure at 4 °C (n = 5–6/each group). (J) Intraperitoneal glucose tolerance test (GTT) and the average area under the curve (AUC) in WT+ Mas1-/--BAT, WT+ WT BAT and WT+ WT eWAT mice fed an HFD for 8 weeks after transplantation (n = 6–7/each group). (K) Insulin tolerance test (ITT) and AUC in WT+ Mas1-/--BAT, WT+ WT BAT and WT+ WT eWAT mice fed an HFD for 8 weeks after transplantation (n = 5–6/each group). (L) Body weight time course in WT+ Mas1-/--BAT, WT+ WT BAT and WT+ WT eWAT mice fed an HFD over 10 weeks after transplantation (n = 10/each group). (M–O) Energy expenditure was evaluated by measurement of oxygen consumption (VO2) (M), of carbon dioxide release (VCO2) (N) and of energy expenditure (EE) (O) over a 24 hr period in WT+ Mas1-/--BAT, WT+ WT BAT and WT+ WT eWAT mice (n = 5/each group). Data represent mean ± SEM. *p < 0.05, **p < 0.01 vs WT/WT-BAT group by Student’s t-test, ANCOVA, or one-way ANOVA.
Figure 5—figure supplement 1
Ablation of Mas1 impairs thermogenesis, BAT activity, and energetic metabolism.
(A–C) Eight-week-old male Mas1-/- mice and their WT (control) mice had a high-fat diet (HFD) for 8 weeks (Mas1-/- vs WT). (D–F) BAT of C57B/L6 recipient mice was removed from the interscapular region. Then, the BAT dissected from Mas1-/- donor mice, was subcutaneously transplanted into the dorsal interscapular region of C57B/L6 recipient mice (WT+ Mas1-/--BAT). C57B/L6 recipient mice transplanted with C57B/L6 BAT (WT+ WT BAT) and C57B/L6 epididymal white adipose tissue (eWAT) (WT+ WT eWAT) were used as control. The recipient mice were then fed an HFD immediately after the transplantation and continued for 10 weeks (WT+ Mas1-/--BAT vs WT+ WT BAT, WT+ WT eWAT). (A–C) Intraperitoneal glucose tolerance test (IPGTT), serum triglyceride and cholesterol levels in Mas1-/- and WT mice (n = 5–10/each group). (D) Energy expenditure was evaluated by measurement of oxygen consumption (VO2) over a 24 hr period in Mas1-/- and WT mice (n = 5/each group). (E–G) 24 hr food intake, water intake and physical activity were measured in Mas1-/- and WT mice (n = 5/each group). (H–J) 24 hr food intake, water intake and physical activity were measured in WT+ Mas1-/--BAT, WT+ WT BAT and WT+ WT eWAT mice fed an HFD for 8 weeks after transplantation (n = 4/each group). Data represent mean ± SEM. *p < 0.05, **p < 0.01 vs WT/WT-BAT group by Student’s t-test, or one-way ANOVA.
Figure 6
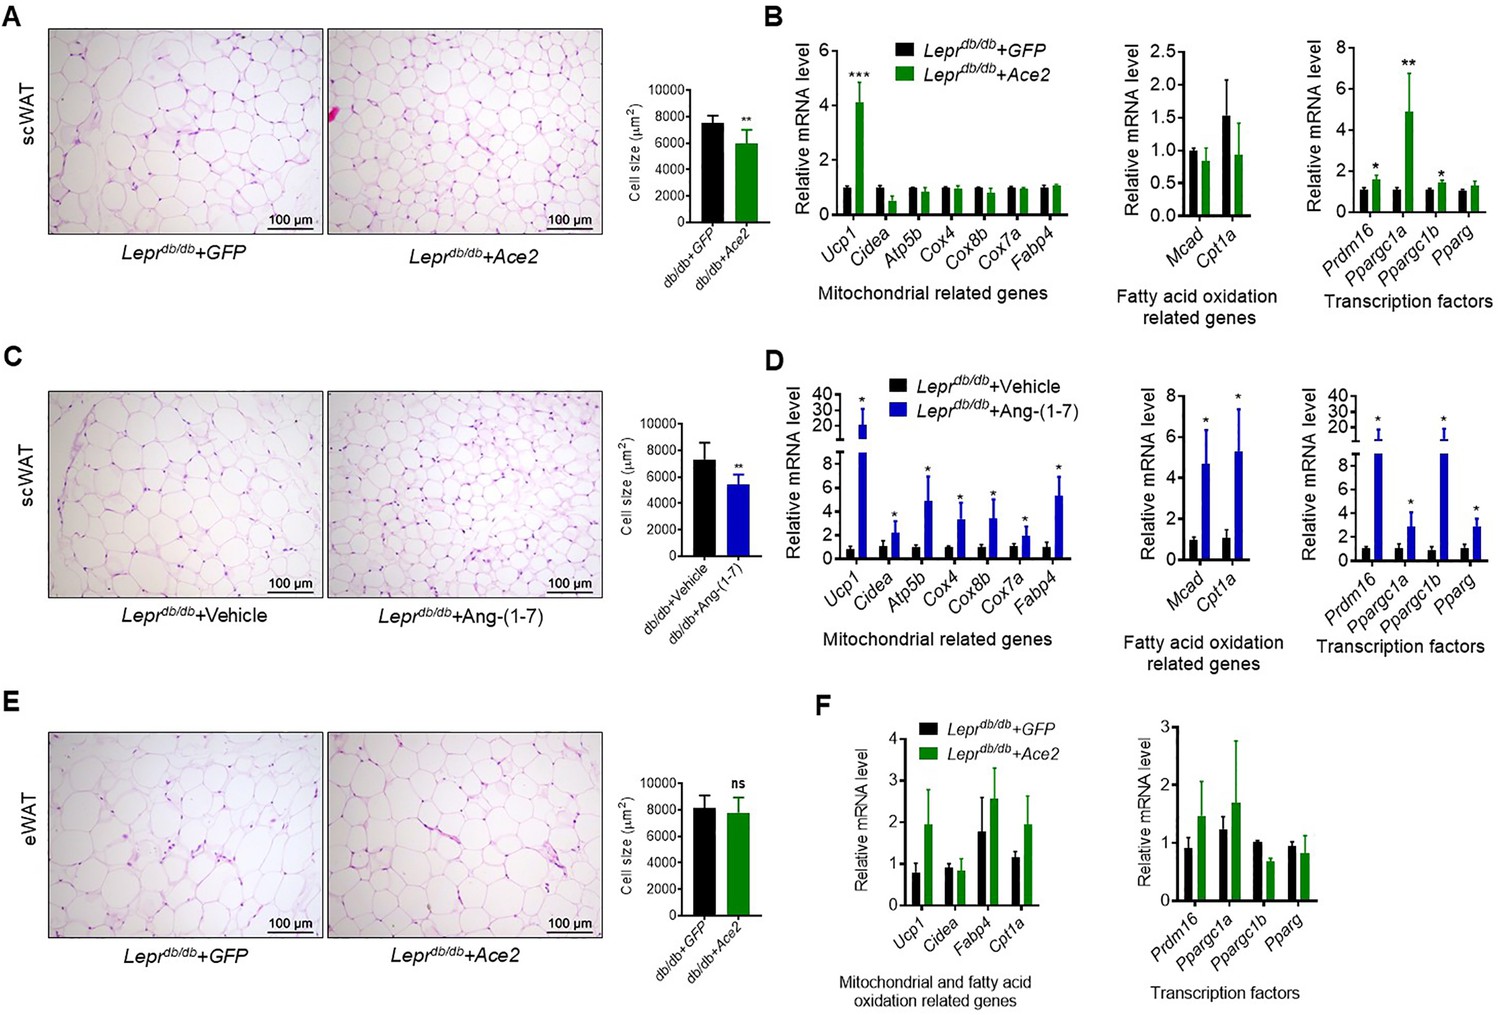
ACE2 pathway induced white adipose tissue browning in the Leprdb/db obese mice.
(A) Representative H&E staining from subcutaneous white adipose tissue (scWAT) sections of Leprdb/db+ Ace2 and Leprdb/db+ GFP mice exposure at 4 °C (n = 6–7/each group). (B) Relative mRNA levels of mitochondrial related genes, fatty acid oxidation related genes and transcription factors in scWAT of Leprdb/db+ Ace2 and Leprdb/db+ GFP mice exposure at 4 °C (n = 3–5/each group). (C) Representative H&E staining from scWAT sections of Leprdb/db+ Ang-(1-7) and Leprdb/db + Vehicle mice exposure at 4 °C (n = 6–7/each group). (D) Relative mRNA levels of mitochondrial related genes, fatty acid oxidation related genes and transcription factors in scWAT of Leprdb/db+ Ang-(1-7) and Leprdb/db+ Vehicle mice exposure at 4 °C (n = 4/each group). (E) Representative H&E staining from epididymal white adipose tissue (eWAT) sections of Leprdb/db+ Ace2 and Leprdb/db+ GFP mice exposure at 4 °C (n = 6–7/each group). (F) Relative mRNA levels of mitochondrial related genes, fatty acid oxidation related genes, and transcription factors in eWAT of Leprdb/db+ Ace2 and Leprdb/db+ GFP mice exposure at 4 °C (n = 4/each group). Data represent mean ± SEM. *p < 0.05, **p < 0.01 vs GFP/Vehicle group by Student’s t-test.
Figure 7 with 2 supplements
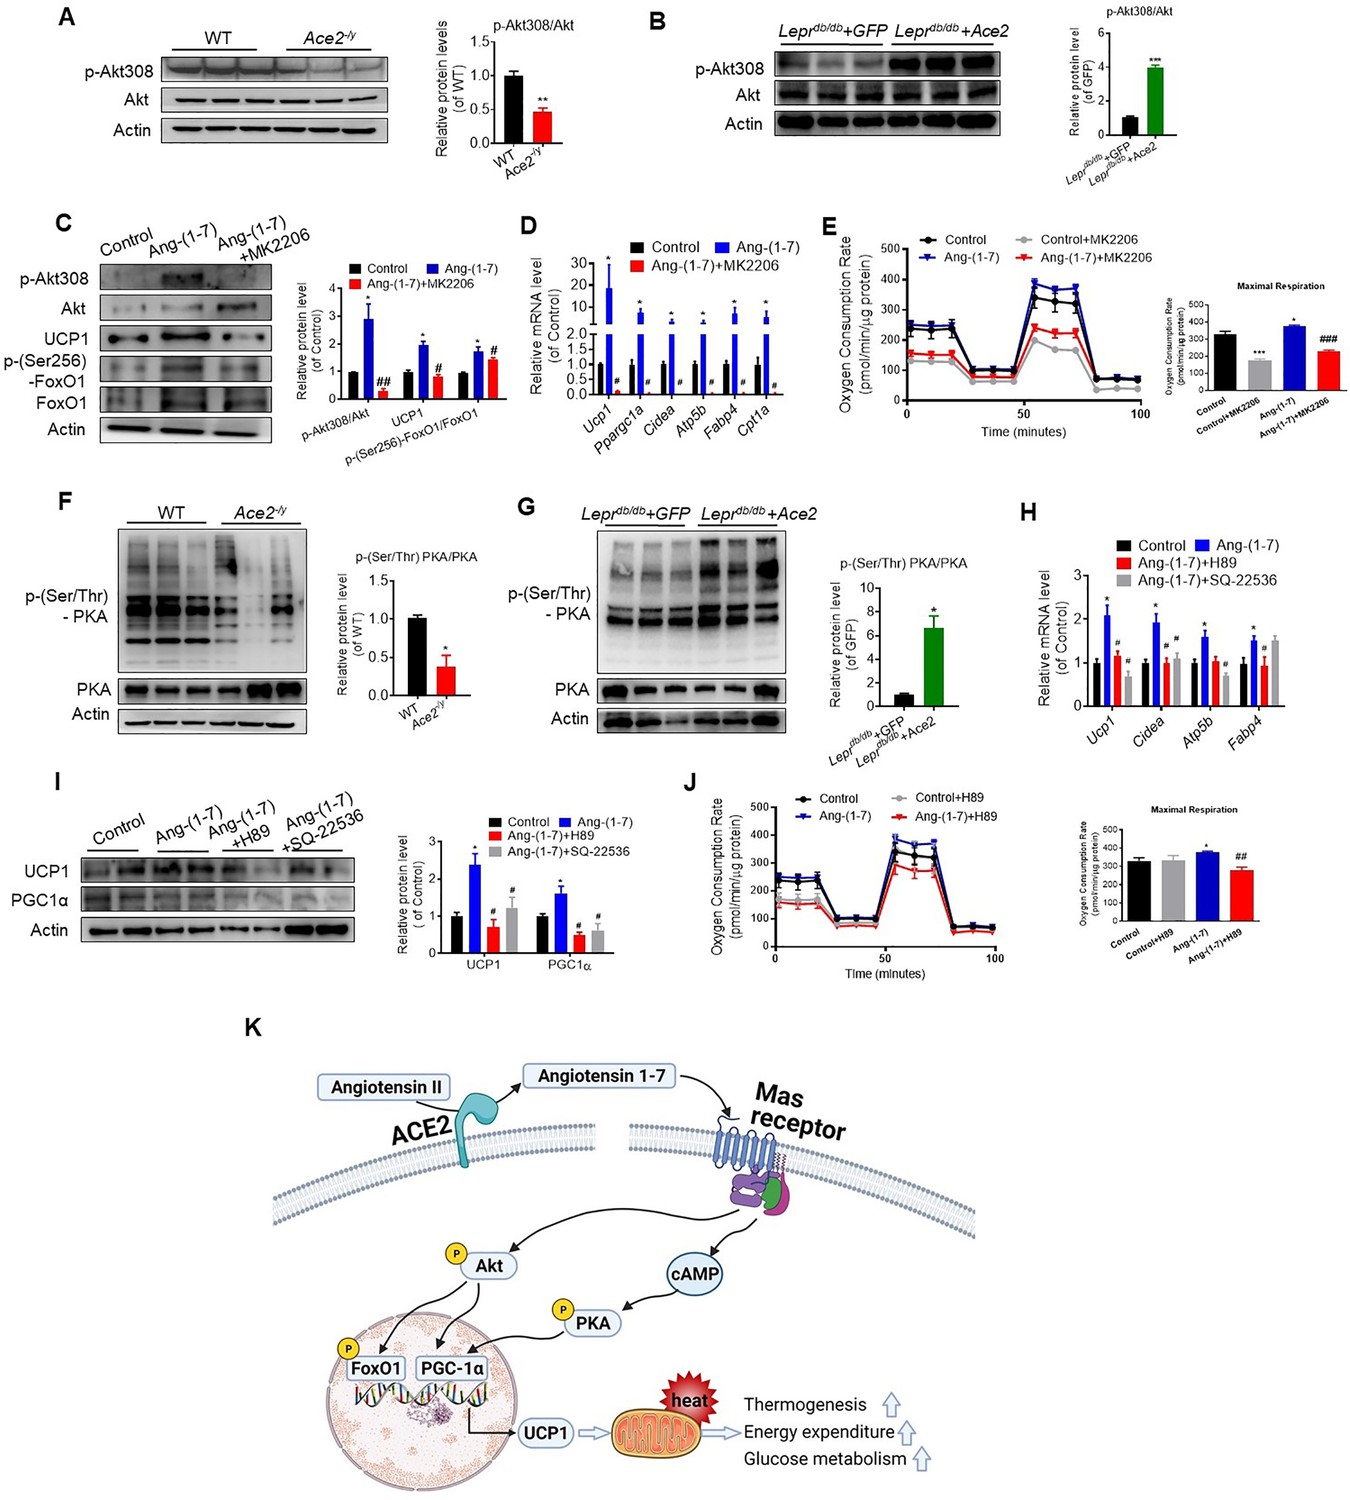
ACE2 pathway induces a thermogenesis program through the Akt signaling and the PKA signaling.
Primary brown adipocytes were isolated, cultured, and treated with Ang-(1-7) (10–6 M) for 24 hr, Akt inhibitor MK2206 (20 μM) for 24 hr, PKA inhibitor H89 (30 μM) for 24 hr, or adenylylcyclase inhibitor SQ-22536 (10 μM) for 24 hours. (A, B) Representative western blots showing the changes of p-Akt308 and Akt in BAT of Ace2-/y (A) and Leprdb/db+ Ace2 mice (B) exposure at 4 °C (n = 3/each group). (C) Representative western blots showing the Akt, UCP1 and forkhead box protein O 1 (FoxO1) Changes (n = 3/each group). (D) Relative mRNA levels of thermogenic and mitochondrial genes (n = 4–6/each group). (E) Continuous measurement of oxygen consumption rate (OCR) in Ang-(1-7) and MK2206 treated primary brown adipocytes. Oxygen consumption was performed under basal conditions, following the addition of oligomycin (1 μM), the pharmacological uncoupler FCCP (1 μM) or the Complex III and I inhibitor antimycin A and rotenone (0.5 μM) (n = 3–4/each group). (F, G) Representative western blots showing the p-PKA and PKA changes in BAT of Ace2-/y (F) and Leprdb/db+ Ace2 mice (G) exposure at 4 °C (n = 3/each group). (H) Relative mRNA levels of thermogenic and mitochondrial genes (n = 4–6/each group). (I) Representative western blots showing the UCP1 and PGC1α changes (n = 3/each group). (J) Continuous measurement of OCR in Ang-(1-7) and H89-treated primary brown Adipocytes (n = 3–5/each group). Data represent mean ± SEM. *p< 0.05, **p < 0.01 vs GFP/WT group by Student’s t-test. *p < 0.05, **p < 0.01 vs control group, # p < 0.05, ## p < 0.01 vs Ang-(1-7) group by one-way ANOVA. (K) Mechanisms involved in ACE2 pathway activation-induced improvement of BAT function.
Figure 7—figure supplement 1
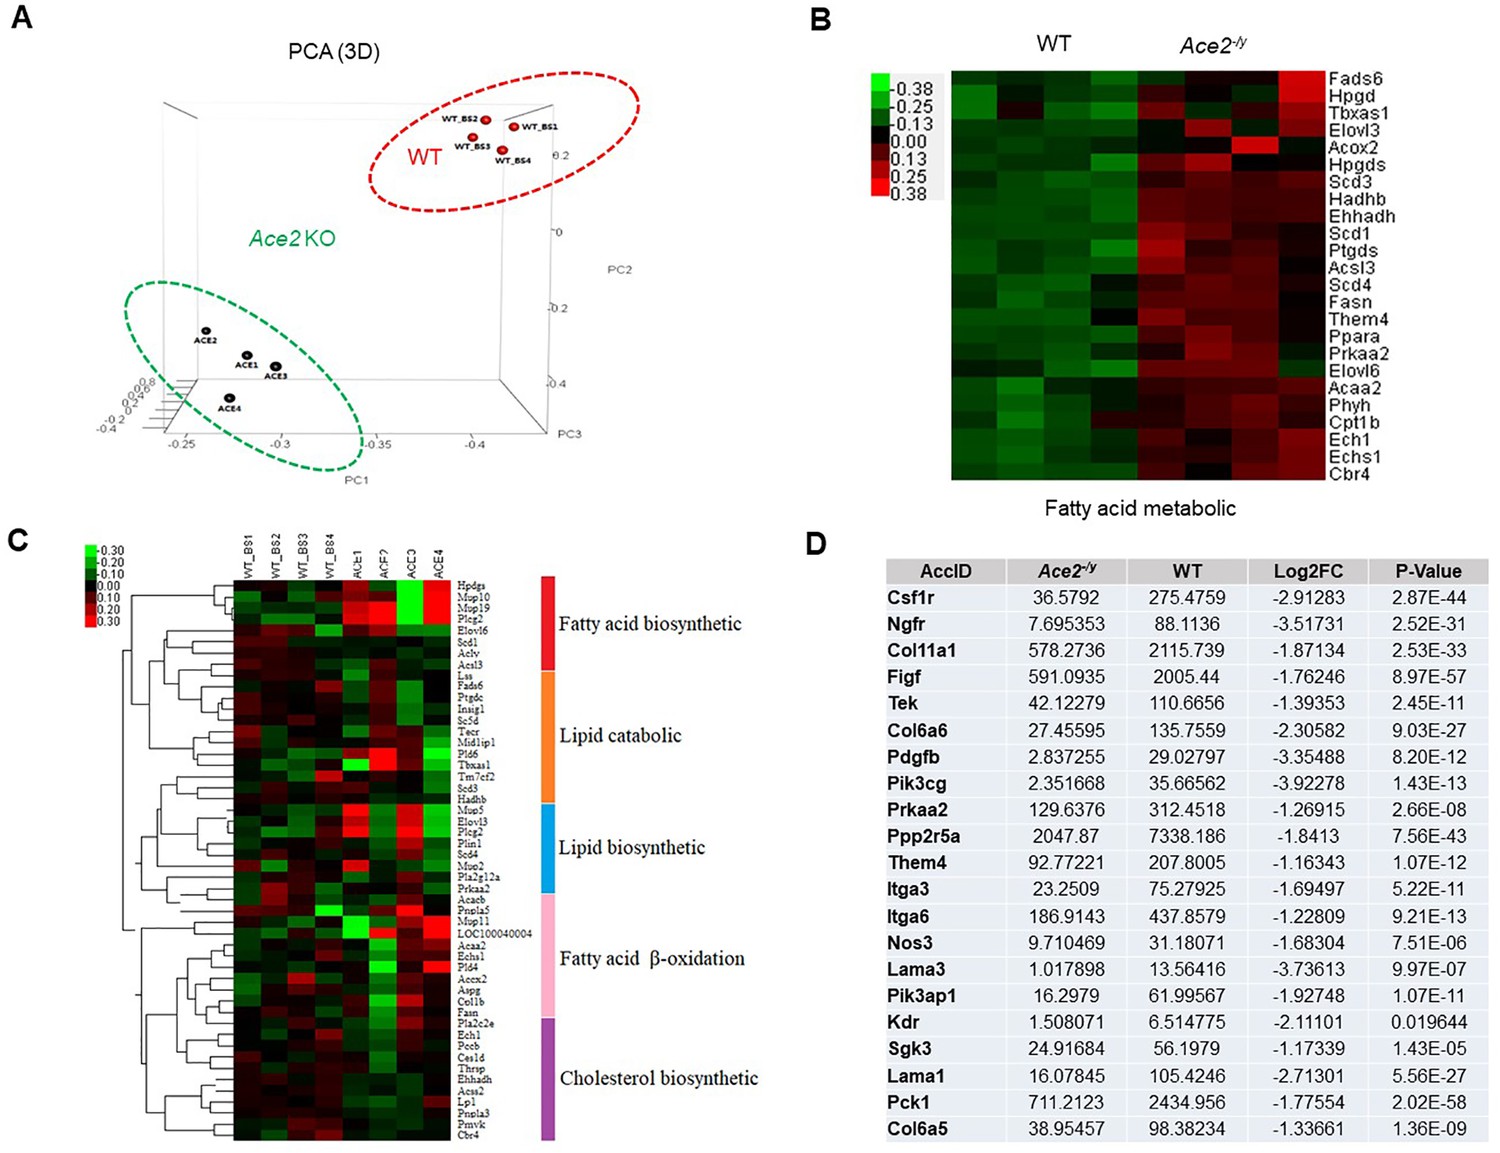
RNA-Seq analysis of primary brown adipocytes from Ace2-/y and WT mice.
(A) 3D-PCA analysis represent the deviation of 4 replication within Ace2-/y (Ace2 1–4) and WT mice (WT_BS 1–4). (B) Heat map representation of the differentially expressed genes in Ace2-/y and WT mice. Gene expression is coded in color scale (−2–2). Red or green indicates expression levels above or below the median, respectively. The magnitude of deviation from the median is represented by color saturation. (C) Heat map of selected genes associated with fatty acid biosynthetic, lipid catabolic, lipid biosynthetic, fatty acid beta-oxidation, and cholesterol biosynthetic, which derived from GO analysis results. (D) Table for the expression of Akt signal pathways related genes.
Figure 7—figure supplement 2
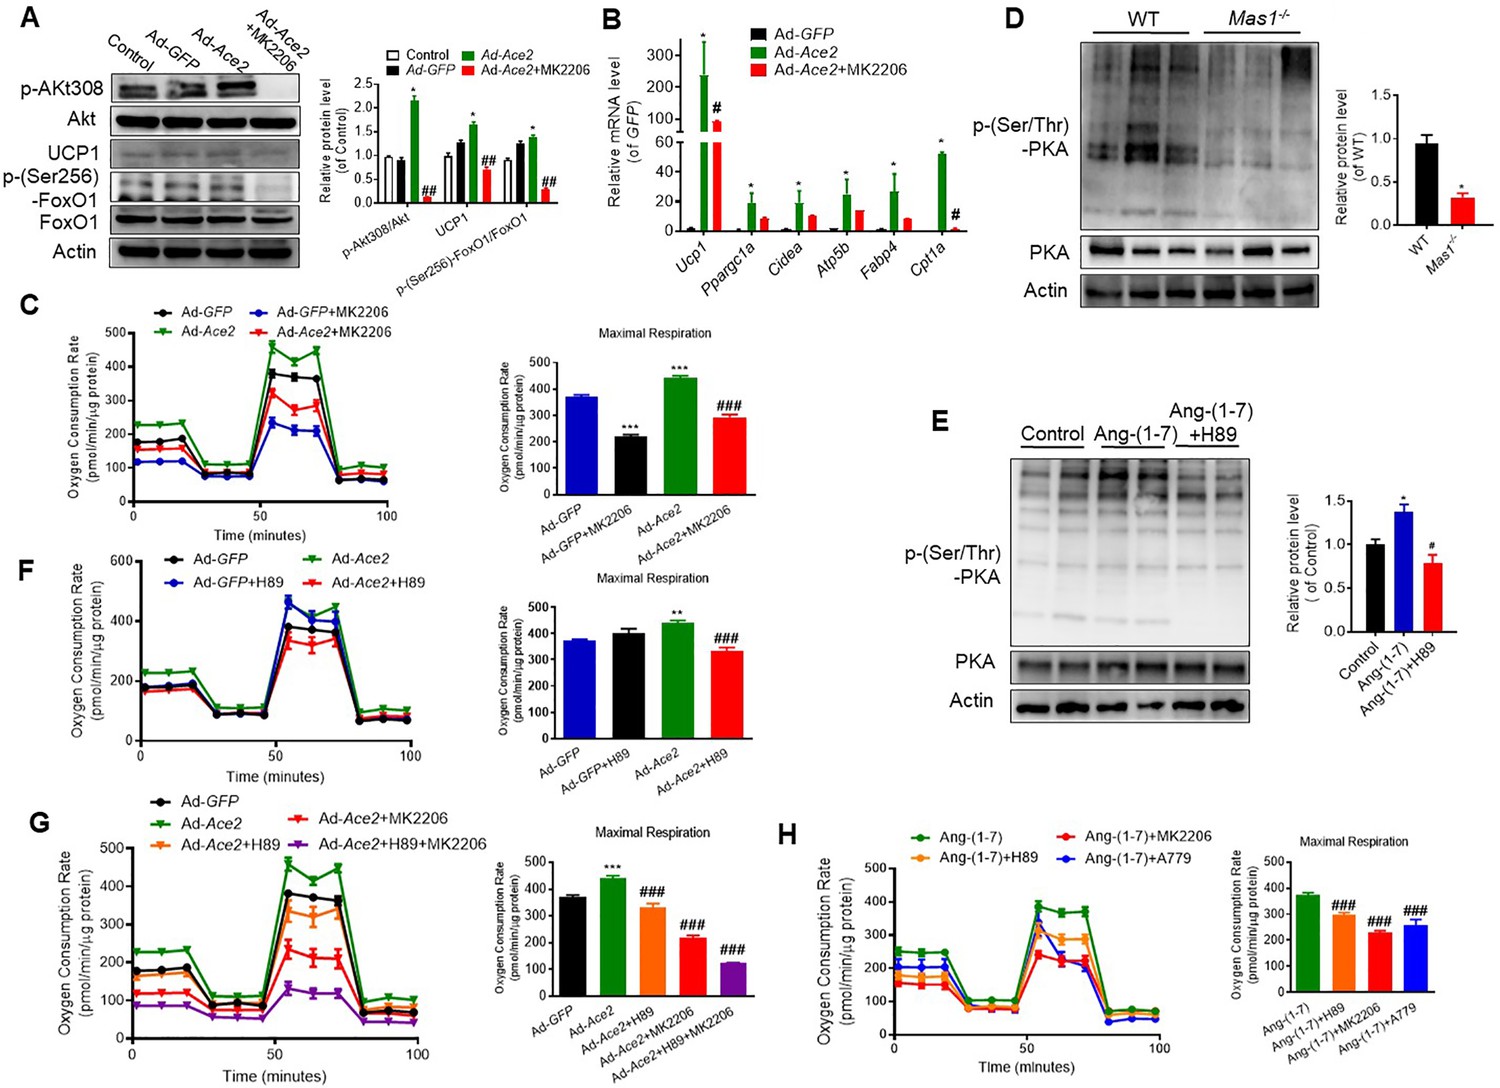
Ang-(1-7) regulates thermogenesis through Akt and PKA signaling in BAT.
Primary brown adipocytes were isolated, cultured, infected with Ace2 adenovirus, treated with Ang-(1-7) (10–6 M) for 24 hr, Akt inhibitor MK2206 (20 μM) for 24 hr, PKA inhibitor H89 (30μ M) for 24 hr, or A779 (10–5 M) for 24 hr. (A) Representative western blots showing the Akt, UCP1, and FoxO1 changes in primary brown adipocytes overexpressing Ace2 at day 7 and treated with MK2206 (n = 3/each group). (B) Relative mRNA levels of thermogenic and mitochondrial genes. n = 3/each group. (C) Continuous measurement of OCR in primary brown adipocytes overexpressing Ace2 and treated with MK2206. Oxygen consumption was performed under basal conditions, following the addition of oligomycin (1 μM), the pharmacological uncoupler FCCP (1 μM) or the Complex III and I inhibitor antimycin A and rotenone (0.5 μM) (n = 3–9/each group). (D) Representative western blots showing the p-PKA and PKA changes in BAT of Mas1-/- mice exposure at 4 °C (n = 3/each group). (E) Representative western blots showing the p-PKA and PKA changes in Ang-(1-7) and H89-treated primary brown adipocytes (n = 3/each group). (F) Continuous measurement of OCR in primary brown adipocytes overexpressing Ace2 and treated with H89 (n = 3–9/each group). (G) Continuous measurement of OCR in primary brown adipocytes overexpressing Ace2 and treated with H89, MK2206, and H89+ MK2206 (n = 3–9/each group). (H) Continuous measurement of OCR in Ang-(1-7), Ang-(1-7)+ H89, Ang-(1-7)+ MK2206, and Ang-(1-7)+ A779 treated primary brown adipocytes (n = 3–15/each group). Data represent mean ± SEM. *p < 0.05, **p < 0.01 vs WT group by Student’s t-test. *p < 0.05, **p < 0.01 vs control group, # p < 0.05, ## p < 0.01 vs Ace2/Ang-(1-7) group by one-way ANOVA.
Tables
Key resources table
| Reagent type (species) or resource | Designation | Source or reference | Identifiers | Additional information |
|---|---|---|---|---|
| Genetic reagent (Mus musculus) | WT C57BL/6 J | GemPharmatech. Co., Ltd | JAX 000664 RRID: IMSR_JAX:000664 | |
| Genetic reagent (Mus musculus) | BKS-db (Leprdb/db) | GemPharmatech. Co., Ltd | ||
| Genetic reagent (Mus musculus) | Ace2 KO | Institute of Laboratory Animal Science, Chinese Academy of Medical Sciences | ||
| Genetic reagent (Mus musculus) | Mas1 KO | GemPharmatech. Co., Ltd | ||
| Transfected construct (Mus musculus) | Ad-Ace2-eGFP | SinoGenoMax | ||
| Chemical compound, drug | Ang-(1-7) | MCE | 51833-78-4 | |
| Chemical compound, drug | A779 | Selleck | 159432-28-7 | |
| Chemical compound, drug | FCCP | Sigma-Aldrich | C2920 | |
| Chemical compound, drug | Oligomycin A | Sigma-Aldrich | 75351–5 MG | |
| Chemical compound, drug | Rotenone | Sigma-Aldrich | R8875-1G | |
| Chemical compound, drug | MK2206 | Selleck | 1032350-13-2 | |
| Chemical compound, drug | H89 | Selleck | 130964-39-5 | |
| Chemical compound, drug | SQ-22536 | Selleck | 17318-31-9 | |
| Other | Chow, 60% HFD | Research Diets | D12492 | |
| Antibody | Anti-UCP1(rabbit polyclonal) | Abcam | #10983 RRID: AB_2241462 | (1:1000) |
| Antibody | Anti-PGC1ɑ(rabbit polyclonal) | Abcam | #54,481RRID: AB_881987 | (1:1000) |
| Antibody | Anti-OXPHOS | Abcam | #110413 RRID: AB_2629281 | (1:1000) |
| Antibody | Anti-Mas1(rabbit polyclonal) | Alomone | #AAR-013 RRID: AB_2039972 | (1:1000) |
| Antibody | Anti-Akt(rabbit polyclonal) | Cell signaling | #9272 RRID: AB_329827 | (1:1000) |
| Antibody | Anti-p-Akt308 (rabbit monoclonal) | Cell signaling | #13038 RRID: AB_2629447 | (1:1000) |
| Antibody | Anti-PKA(rabbit polyclonal) | Cell signaling | #4782 RRID: AB_2170170 | (1:1000) |
| Antibody | Anti-p-PKA(rabbit polyclonal) | Cell signaling | #9,621RRID: AB_330304 | (1:1000) |
| Antibody | Anti-ACE2(rabbit monoclonal) | Cell signaling | #92,485 | (1:1000) |
| Antibody | Actin(rabbit monoclonal) | Cell signaling | #4,970RRID: AB_2223172 | (1:1000) |
| Sequence-based reagent | Cidea_F | Invitrogen | RT-qPCR primer | TCCTATGCTGCACAGATGACG |
| Sequence-based reagent | Cidea_R | This paper | RT-qPCR primer | TGCTCTTCTGTATCGCCCAGT |
| Sequence-based reagent | Ppargc1a_F | This paper | RT-qPCR primer | GCACCAGAAAACAGCTCCAAG |
| Sequence-based reagent | Ppargc1a_R | This paper | RT-qPCR primer | CGTCAAACACAGCTTGACAGC |
| Sequence-based reagent | Ucp1_F | This paper | RT-qPCR primer | TCTCAGCCGGCTTAATGACTG |
| Sequence-based reagent | Ucp1_R | This paper | RT-qPCR primer | GGCTTGCATTCTGACCTTCAC |
| Sequence-based reagent | Prdm16_F | This paper | RT-qPCR primer | ACACGCCAGTTCTCCAACCTGT |
| Sequence-based reagent | Prdm16_R | This paper | RT-qPCR primer | TGCTTGTTGAGGGAGGAGGTA |
| Software, algorithm | GraphPad Prism Software | GraphPad Software,La Jolla, CA, USA | Version 8.0.0 for WindowsRRID: SCR_002798 | |
| Software, algorithm | ANCOVA | PMID:30017358 | https://calrapp.org/ |
Additional files
-
Transparent reporting form
- https://cdn.elifesciences.org/articles/72266/elife-72266-transrepform1-v3.docx
-
Source data 1
An Excel sheet with numerical quantification data.
- https://cdn.elifesciences.org/articles/72266/elife-72266-supp1-v3.zip
Download links
A two-part list of links to download the article, or parts of the article, in various formats.
Downloads (link to download the article as PDF)
Open citations (links to open the citations from this article in various online reference manager services)
Cite this article (links to download the citations from this article in formats compatible with various reference manager tools)
ACE2 pathway regulates thermogenesis and energy metabolism
eLife 11:e72266.
https://doi.org/10.7554/eLife.72266


