Cryo-EM reconstructions of inhibitor-bound SMG1 kinase reveal an autoinhibitory state dependent on SMG8
- Max Planck Institute of Biochemistry, Germany
Figures
Figure 1 with 2 supplements

SMG1i specifically inhibits SMG1 kinase activity in vitro.
(A) Structure of the SMG1 inhibitor (SMG1i). (B) Titration of SMG1i using a mass spectrometry-based phosphorylation assay with 500 nM SMG1-8-9 and the indicated UPF1-derived peptides as substrates. (C) Titration of SMG1i using a radioactivity-based phosphorylation assay with 100 nM SMG1-8-9 and full-length UPF1 as a substrate. The Coomassie-stained gel is shown on top, and the corresponding radioactive signal is below. (D, E) Titration of SMG1i using a radioactivity-based phosphorylation assay with either SMG1-8-9 and full-length UPF1 (D) or mTORΔN-LST8 and GST-AKT1 (E) as a substrate. Stain-free gels are shown on top and the corresponding radioactive signal at the bottom (Ladner et al., 2004). (F) Quantification of normalized UPF1 or mTOR (auto-)phosphorylation in the presence of increasing amounts of SMG1i for both SMG1 and mTOR. For each data point, the mean is shown with standard deviations of the three replicates indicated.
-
Figure 1—source data 1
Unedited images for gels shown in Figure 1.
- https://cdn.elifesciences.org/articles/72353/elife-72353-fig1-data1-v2.zip
Figure 1—figure supplement 1
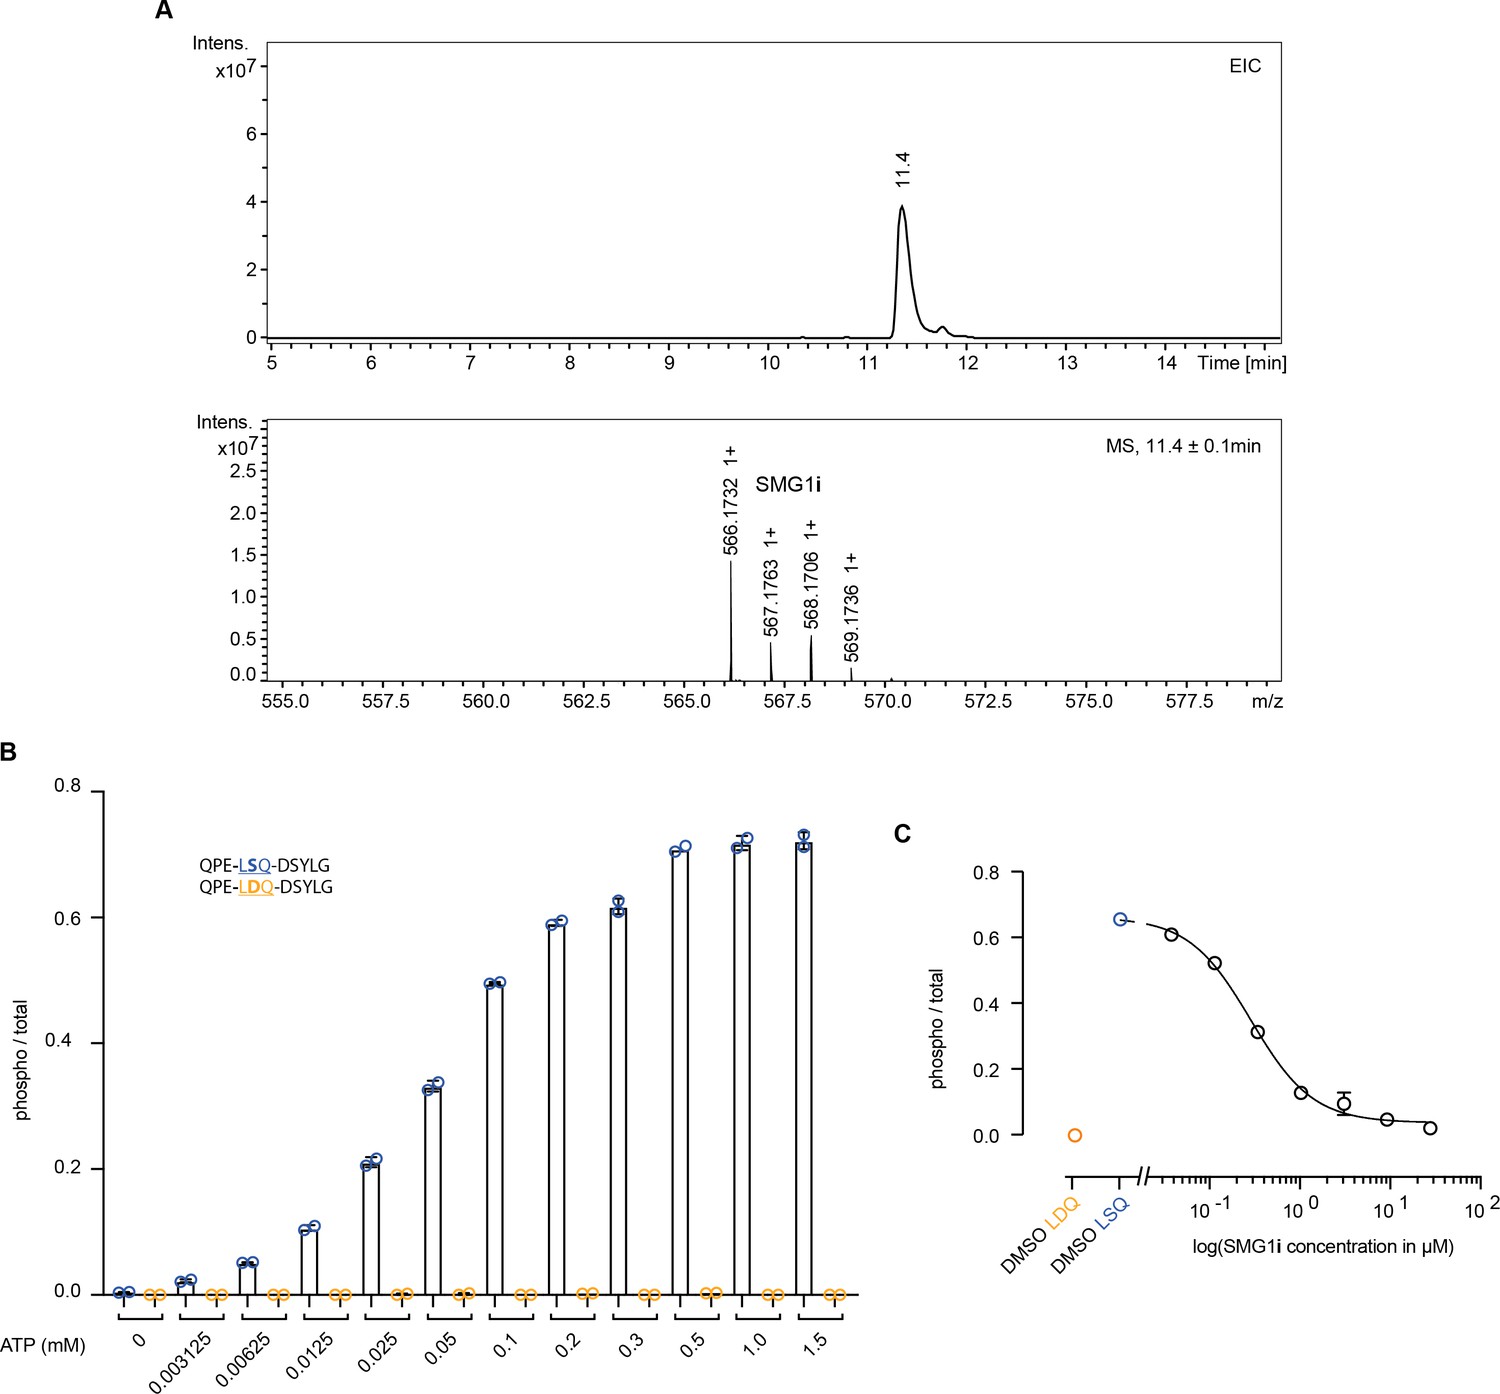
Characterization of SMG1 inhibitor.
(A) Liquid chromatography-mass spectrometry (LC-MS) experiment with the SMG1 inhibitor sample used throughout this study. The expected mass for SMG1i is 566.13 Da. Differences of +1 are caused by the varying composition of naturally occurring carbon isotopes. (B) Titration of ATP requirement in mass spectrometry-based phosphorylation assay using 500 nM SMG1-8-9 and the indicated UPF1-derived peptides as substrates. 0.75 mM ATP was chosen for later experiments. (C) Dose-response curve for SMG1i in mass spectrometry-based phosphorylation assay (using triplicate data points shown in Figure 1B). Phosphorylation ratios of substrate (blue) and control peptide (orange) in the absence of SMG1i are shown as mean values with error bars indicating standard deviation (were large enough to visualize). The control peptide was included for reference but was not used for fitting.
Figure 1—figure supplement 2
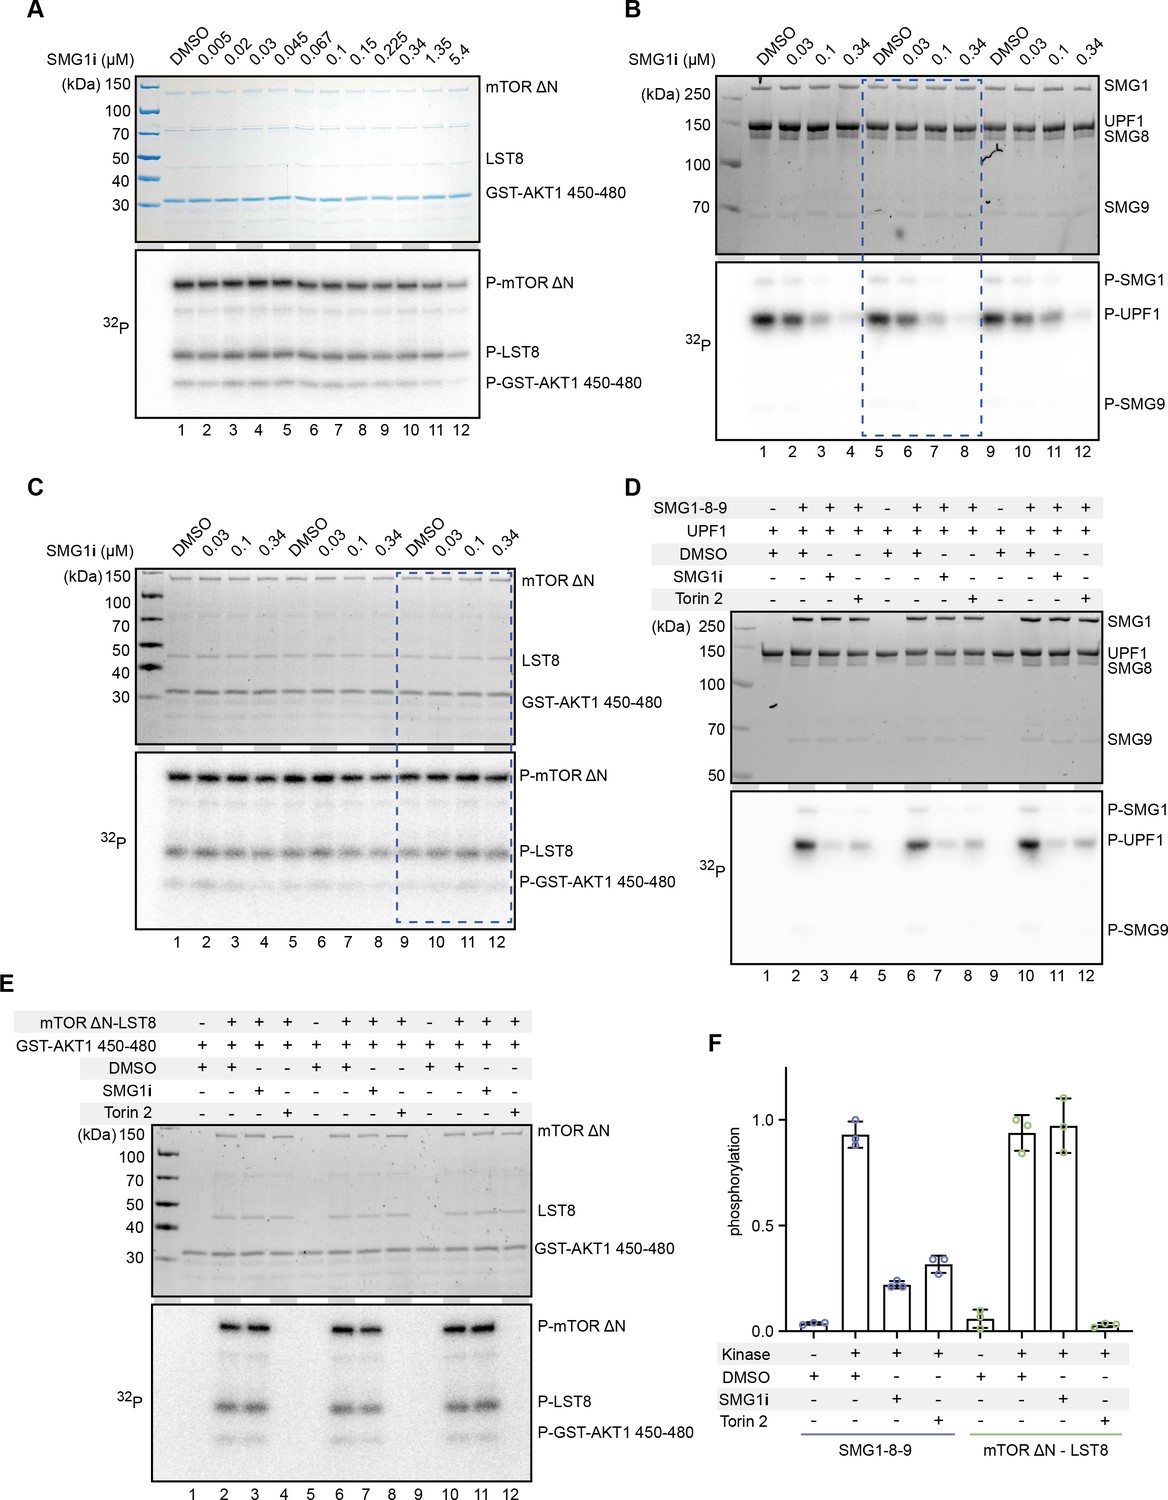
Radioactivity-based phosphorylation assays using SMG1 inhibitor with SMG1 and mTOR.
(A) Titration of SMG1i using 100 nM mTOR-LST8 and GST-AKT1 as a substrate. The Coomassie-stained gel is shown on top and the radioactive signal on the bottom. (B, C) SMG1-8-9 or mTOR-LST8 kinase assay with four selected concentrations of SMG1i. Assays were performed in triplicates and used for quantification. The blue rectangle indicates the replicate of the assays shown in Figure 1. (D, E) SMG1-8-9 or mTOR-LST8 kinase assay supplemented with either DMSO, SMG1i, or Torin 2. A control without kinase was included. The highest concentration of SMG1i (0.34 µM) was used in panels (B, C) and the same amount of Torin 2 was used. Both assays were performed in triplicates. (F) Quantification of normalized UPF1 or mTOR (auto-)phosphorylation of the experimental triplicates shown in panels (D, E).
-
Figure 1—figure supplement 2—source data 1
Unedited images for gels shown in Figure 1—figure supplement 2.
- https://cdn.elifesciences.org/articles/72353/elife-72353-fig1-figsupp2-data1-v2.zip
Figure 2 with 3 supplements

Structural basis for selective targeting of SMG1 by the SMG1 inhibitor.
(A) Model of the SMG1-8-9 kinase complex bound to SMG1i. SMG1 is in gray, SMG8 is in blue, and SMG9 is shown in green. SMG1i is shown as a magenta model overlaid with the isolated transparent density. Approximate location of the SMG1 active site is indicated by a black circle. (B) Key interactions of SMG1i with SMG1 active site residues. Important residues located in either the N- or the C-lobe of the SMG1 kinase domain are colored gray. Other parts of SMG1 are transparent and interactions of SMG1i with SMG1 backbone are not shown. (C) Superposition of SMG1i-bound SMG1 with the mTOR active site (PDB identifier: 4JSP) over the catalytic loops of both kinases. Key SMG1 residues indicated in (B) are shown alongside the respective mTOR residues colored in green. Regions possibly accounting for preferential interaction of SMG1i with SMG1 over mTOR are circled and the relevant residues are labeled.
Figure 2—figure supplement 1
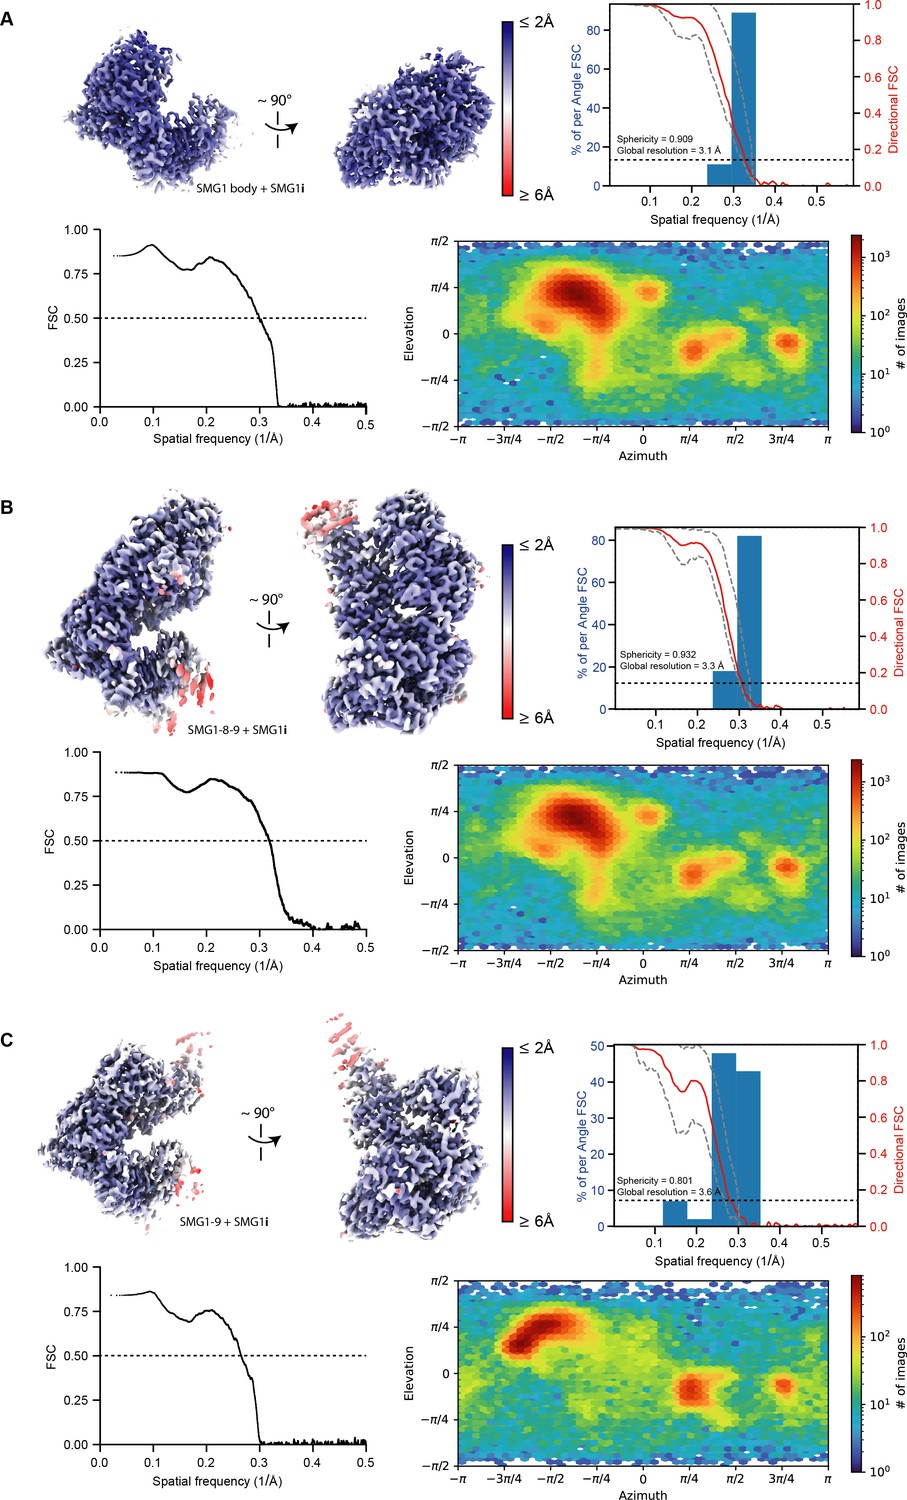
Resolution distribution and isotropy of SMG1-centered cryo-EM maps bound to SMG1i.
SMG1i-bound reconstructions used in this study for model building are colored according to estimated local resolution shown in two different orientations. A three-dimensional Fourier shell correlation (FSC) plot is included for each reconstruction (Tan et al., 2017). The red line represents the estimated global masked half map FSC. The resolutions according to the gold standard FSC cutoff of 0.143 are indicated and shown as a black dashed line (Rosenthal and Henderson, 2003). The spread of directional resolution values is defined as ±1σ (dashed gray lines). Overall isotropy of the maps is indicated by the given sphericity values (out of 1). In the bottom row of each panel, a model versus map FSC is shown alongside a plot visualizing the distribution of particle views. (A) SMG1 body bound to SMG1i after focused refinement (EMD-13676, PDB identifier: 7PW6). (B) SMG1-8-9 bound to SMG1i (EMD-13674, PDB identifier: 7PW4). (C) SMG1-9 bound to SMG1i (EMD-13677, PDB identifier: 7PW7). cryo-EM, cryo-electron microscopy; FSC, XXX.
Figure 2—figure supplement 2
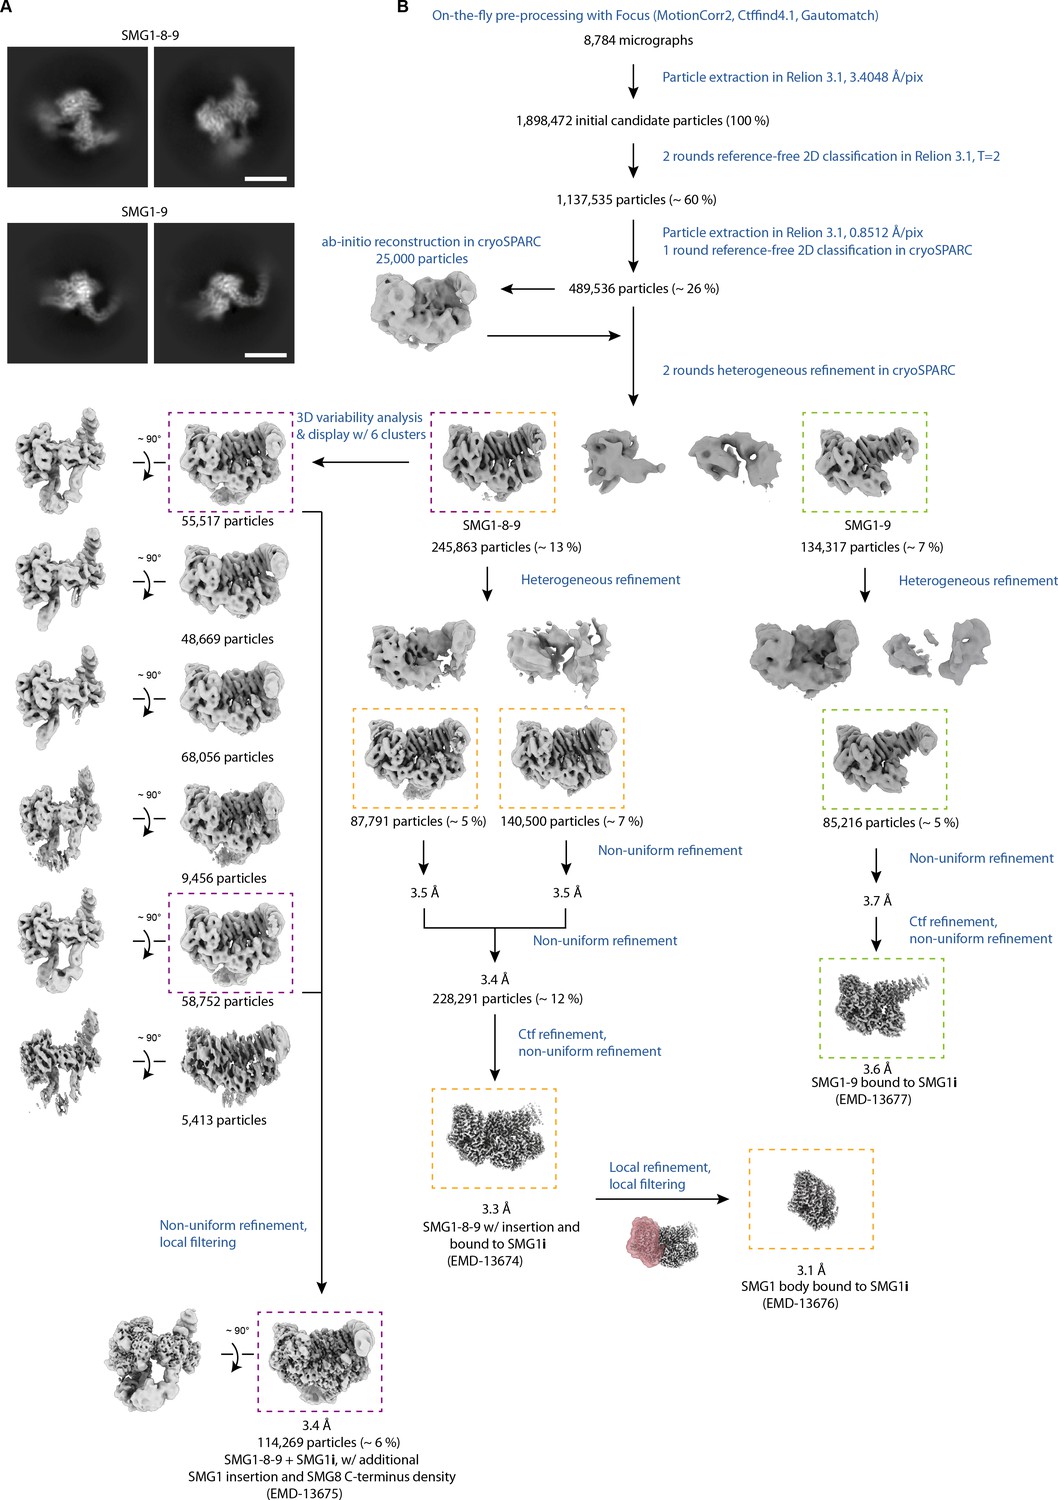
Cryo-EM data processing of SMG1i data set.
(A) 2D class averages of SMG1-8-9 and SMG1-9 are calculated from the final particle stacks. Scale bars≈100 Å. (B) Processing scheme. Processing steps are indicated in blue; particle numbers and percentages with respect to initial candidate particles are shown for relevant classes. Colored, dashed rectangles indicate the different final reconstructions and the respective classes obtained from the data set collected in the presence of SMG1i. cryo-EM, cryo-electron microscopy.
Figure 2—figure supplement 3
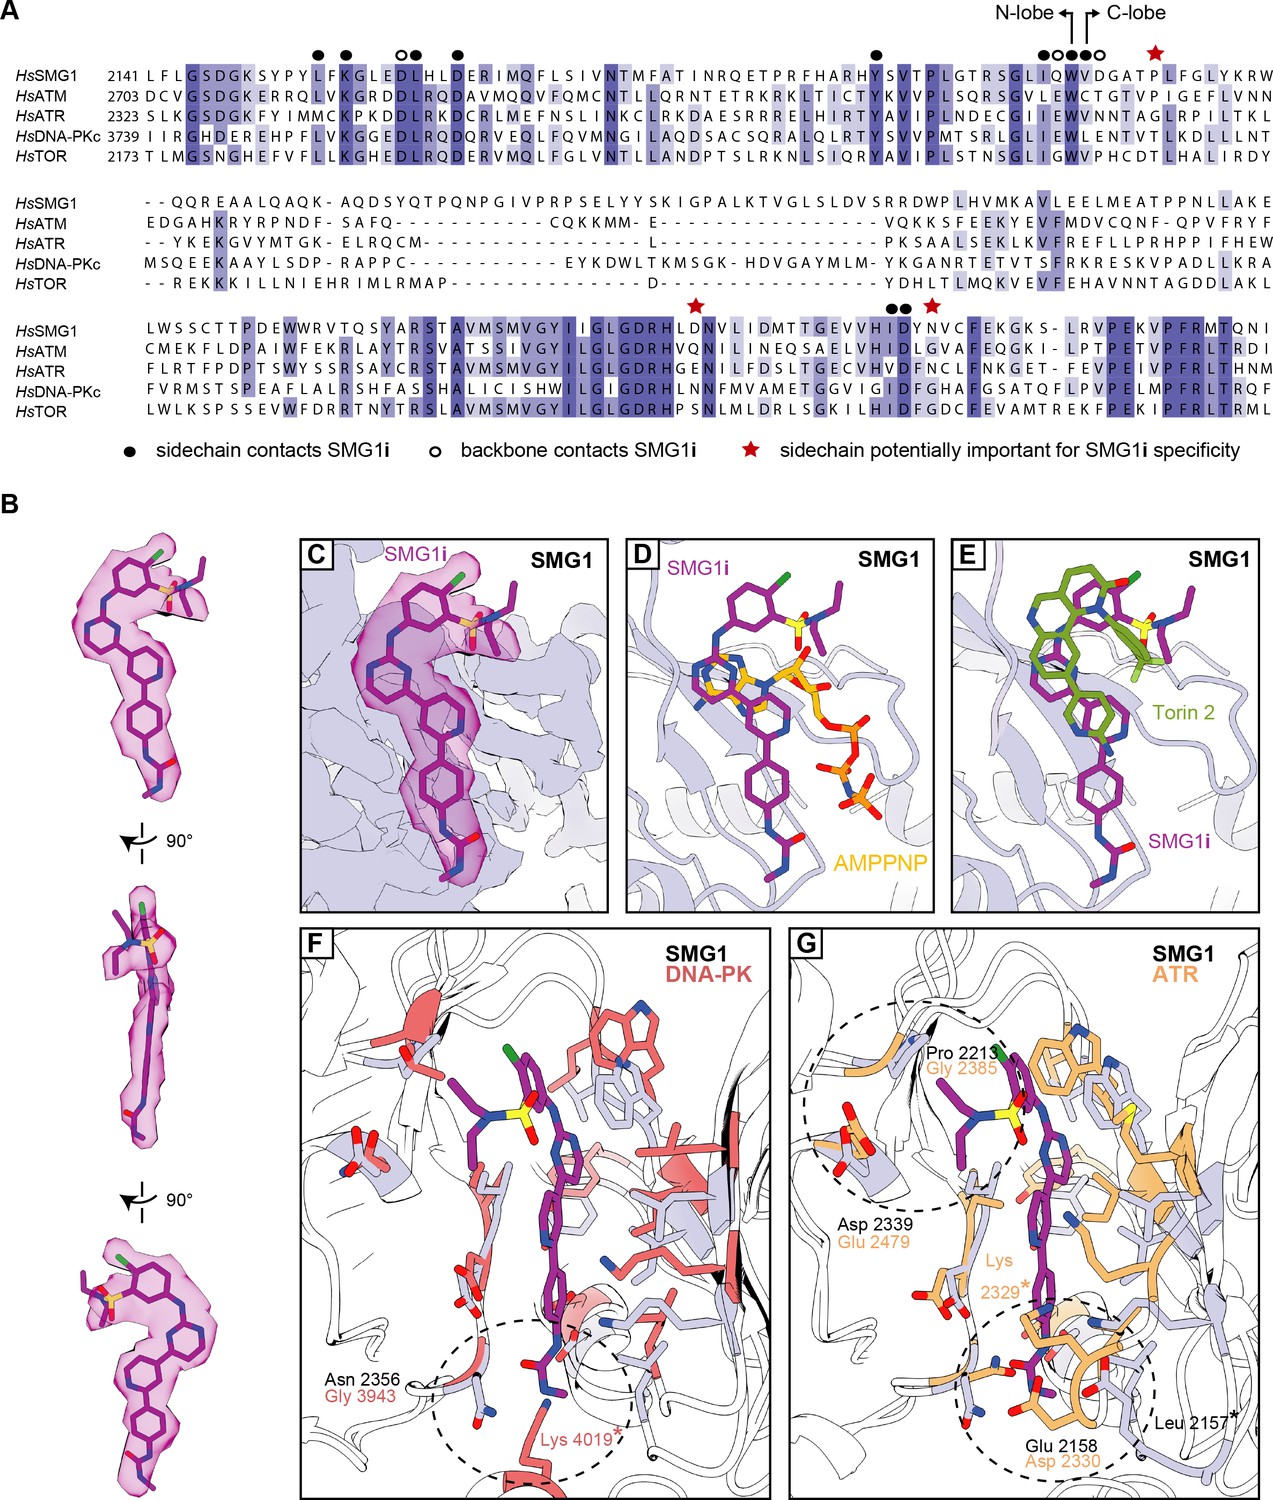
Further details of SMG1i binding and specificity.
(A) Multiple sequence alignment of parts of the kinase domains (N- and C-lobe indicated) belonging to the catalytically active members of the PIKK family with residues colored by identity. Residues of special interest are highlighted as indicated. (B) Different views of the isolated cryo-EM density for SMG1i with the fitted model. (C) Close-up side-view of cryo-EM density of SMG1-8-9 active site bound to SMG1i. The inhibitor model is shown and the corresponding segmented density is displayed in transparent magenta. (D) Superposition of SMG1i-bound active site with AMPPNP-bound active site (PDB identifier: 6Z3R). Same view as in (C). (E) Superposition of SMG1i-bound active site with Torin 2-bound mTOR active site (PDB identifier: 4JXP). Similar view as in (C). (F) Superposition of SMG1i-bound SMG1 with DNA-PK active site in the inactive conformation (PDB identifier: 7K11). Figure prepared and labeled as in Figure 2C, with DNA-PK residues colored in red. The asterisk indicates a residue only visible in the DNA-PK structure due to structural rearrangements. (G) Superposition of SMG1i-bound SMG1 with ATR active site (PDB identifier: 5YZ0). Figure prepared and labeled as in Figure 2C, with ATR residues colored in orange. An asterisk indicates corresponding residues in SMG1 and ATR that are separated due to conformational divergence. cryo-EM, cryo-electron microscopy.
Figure 3 with 4 supplements
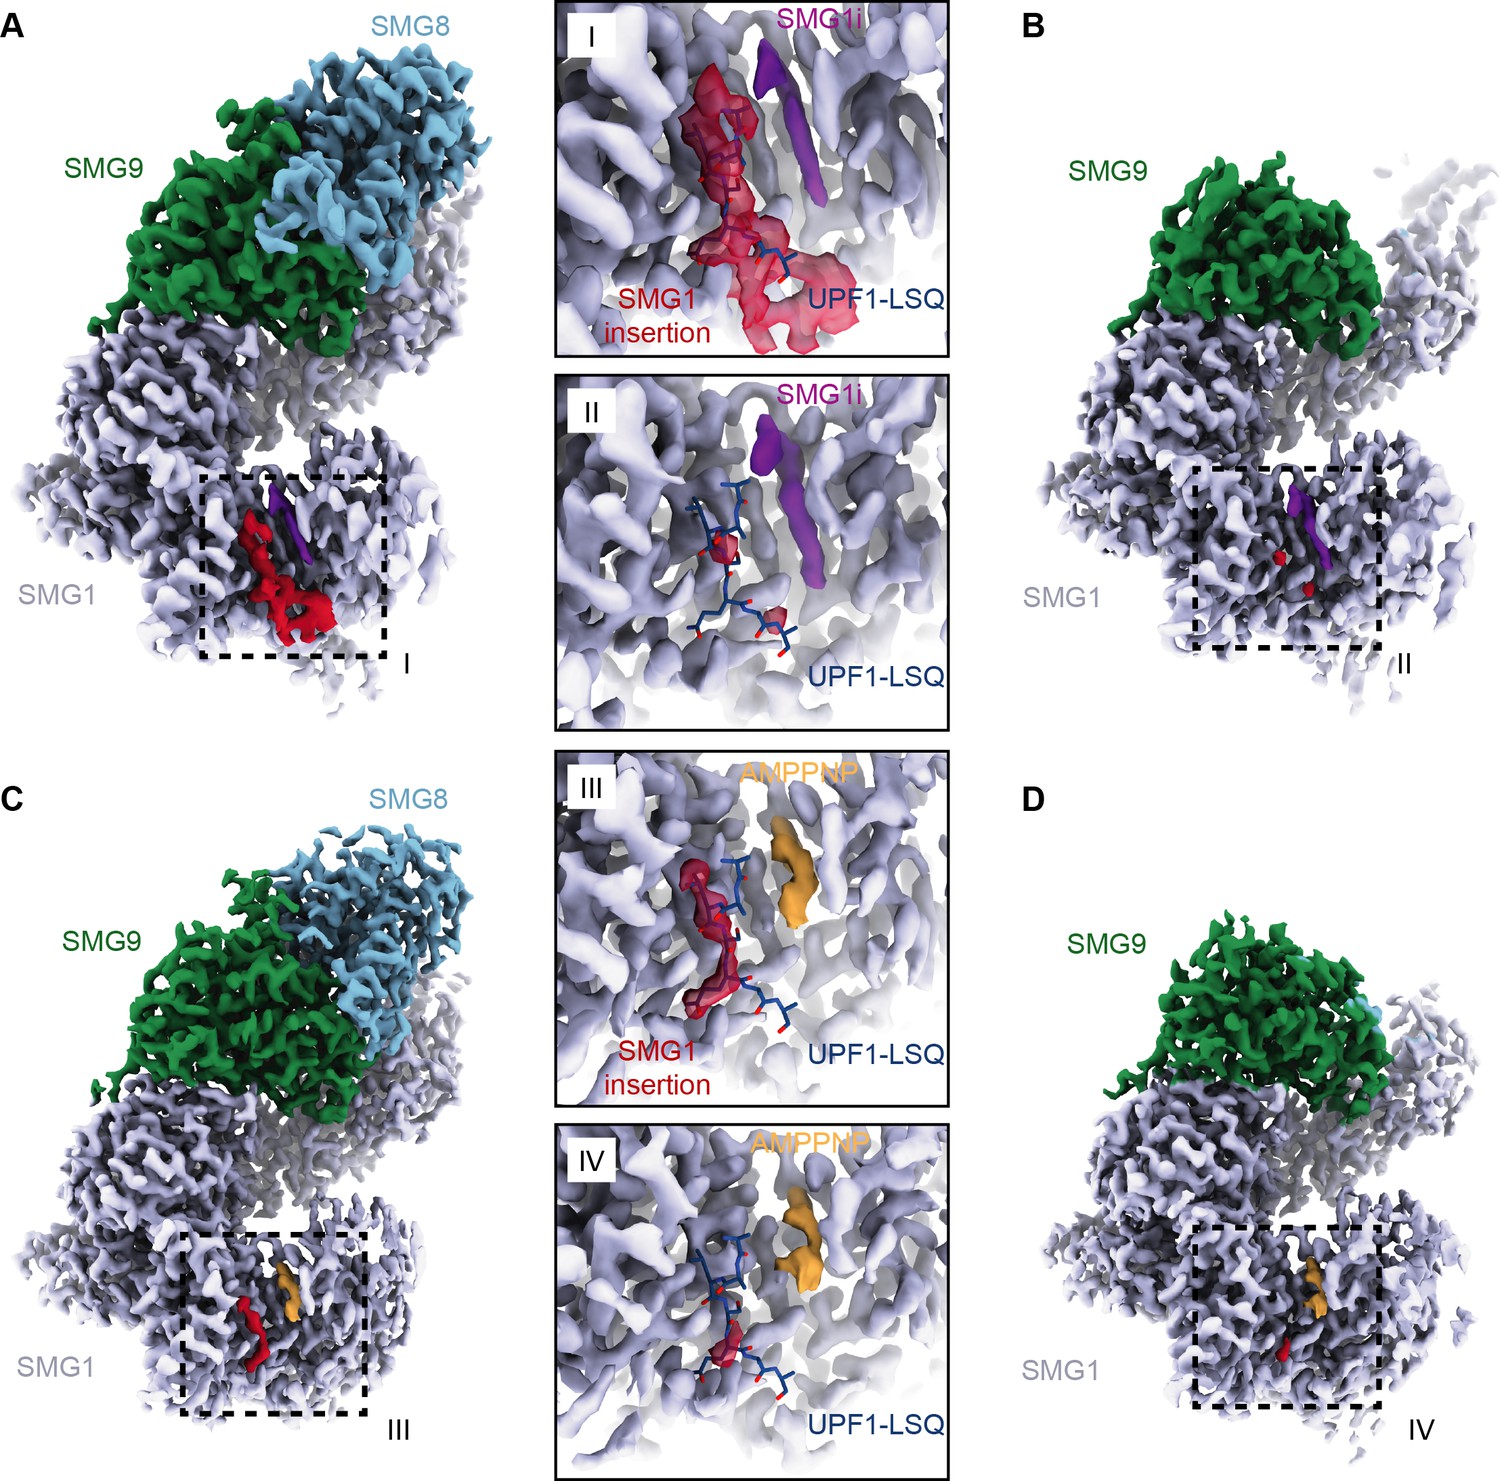
Structures of SMG1-8-9 and SMG1-9 complexes reveal that the SMG1 insertion domain can block the substrate-binding path in the presence of SMG8.
(A) Cryo-EM density of SMG1-8-9 bound to SMG1i. Density for the inhibitor is in magenta, the N-terminus of the SMG1 insertion is in red, and all other parts as indicated. (B) Cryo-EM density of SMG1-9 complex bound to the SMG1 inhibitor. Everything else as in (A). (C) Cryo-EM density of SMG1-8-9 bound to AMPPNP. Density for AMPPNP is in orange and extra density attributed to the SMG1 insertion is in red. (D) As in (C), but for the SMG1-9 complex bound to AMPPNP. Insets I–IV show close-ups of the indicated kinase active site densities superimposed with the model for the UPF1-LSQ substrate shown as blue sticks (PDB identifier: 6Z3R). All maps segmented. cryo-EM, cryo-electron microscopy.
Figure 3—figure supplement 1
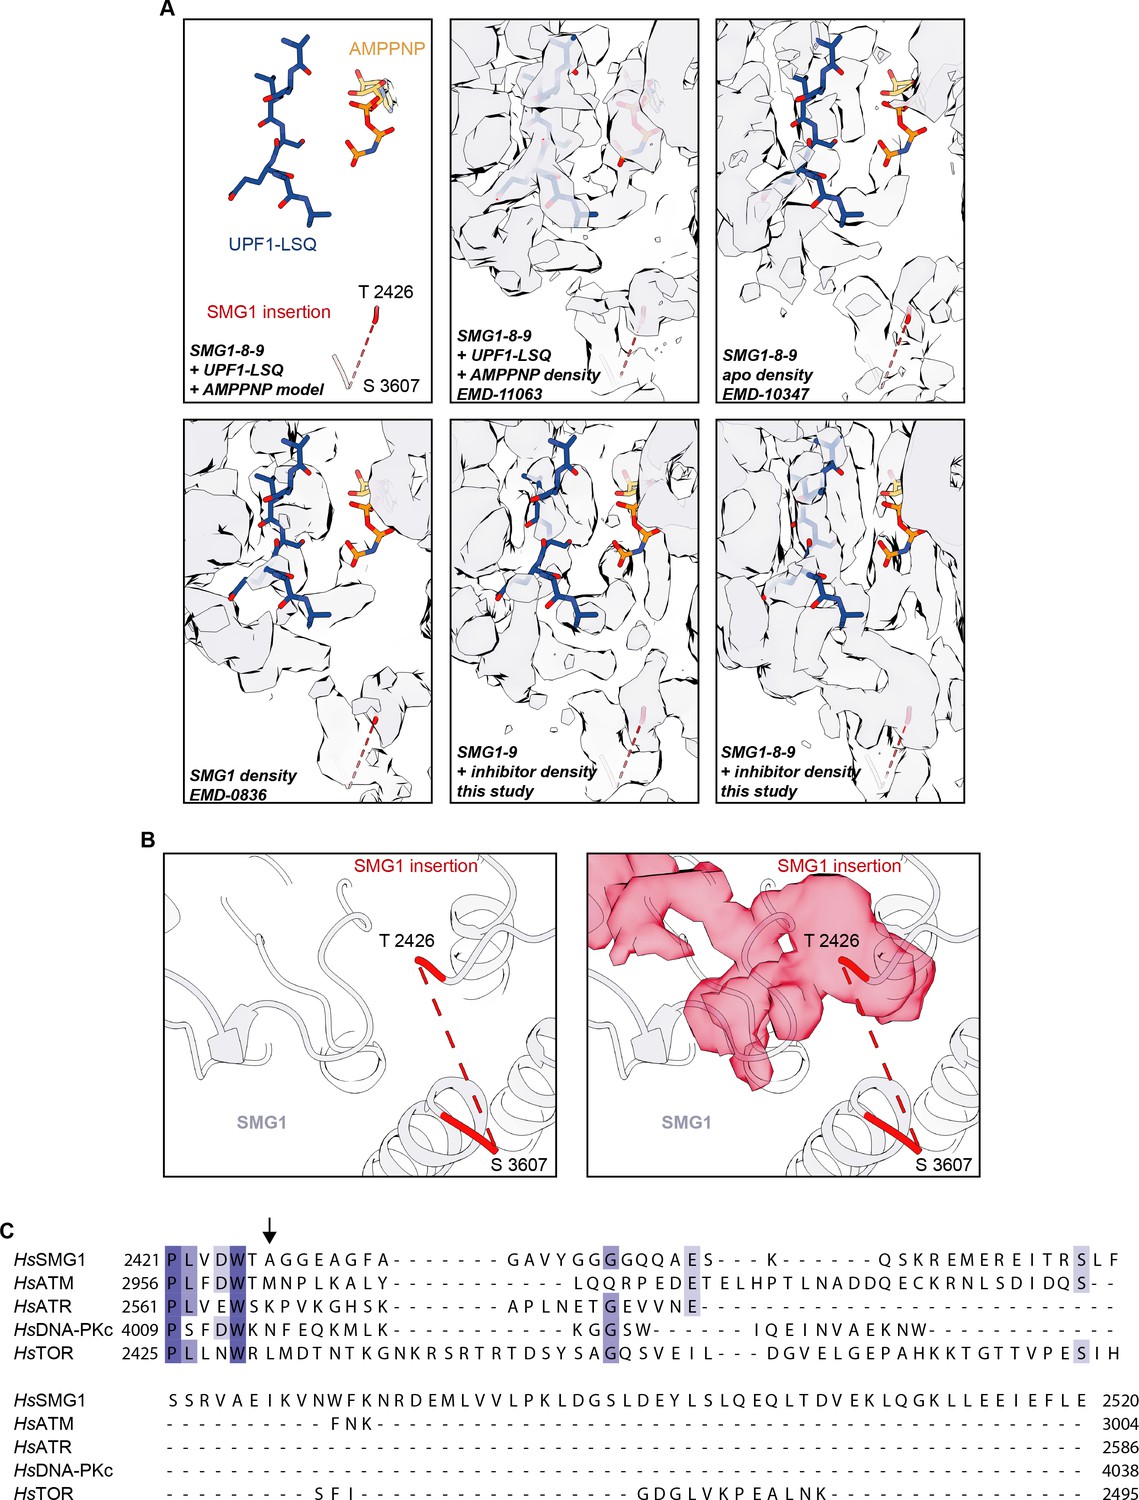
Details of the SMG1 insertion N-terminus.
(A) Model of SMG1 active site bound to UPF1-LSQ substrate and AMPPNP (PDB identifier: 6Z3R) shown superimposed with the corresponding EM density (EMD-11063) and the densities for apo SMG1-8-9 (EMD-10347), SMG1 (EMD-0836), SMG1i-bound SMG1-9, and SMG1i-bound SMG1-8-9. Note that the UPF1-LSQ model is partially covered by density protruding from the SMG1 insertion domain residue Thr2426 only in the inhibitor-bound SMG1-8-9 complex. (B) The isolated extra density (shown in red) observed in the active site of the SMG1i-bound SMG1-8-9 complex connects to the modeled N-terminus of the SMG1 insertion domain. The left panel highlights the last modeled N- and C-terminal residues of the insertion domain. The right panel shows the same view, superimposed with the isolated extra density. (C) Multiple sequence alignment of the N-terminal 100 residues of the SMG1 insertion domain and the PRDs of the other human PIKK family members colored by identity. The beginning of the unmodeled part of the SMG1 insertion is indicated by a black arrow (compare B). EM, electron microscopy.
Figure 3—figure supplement 2
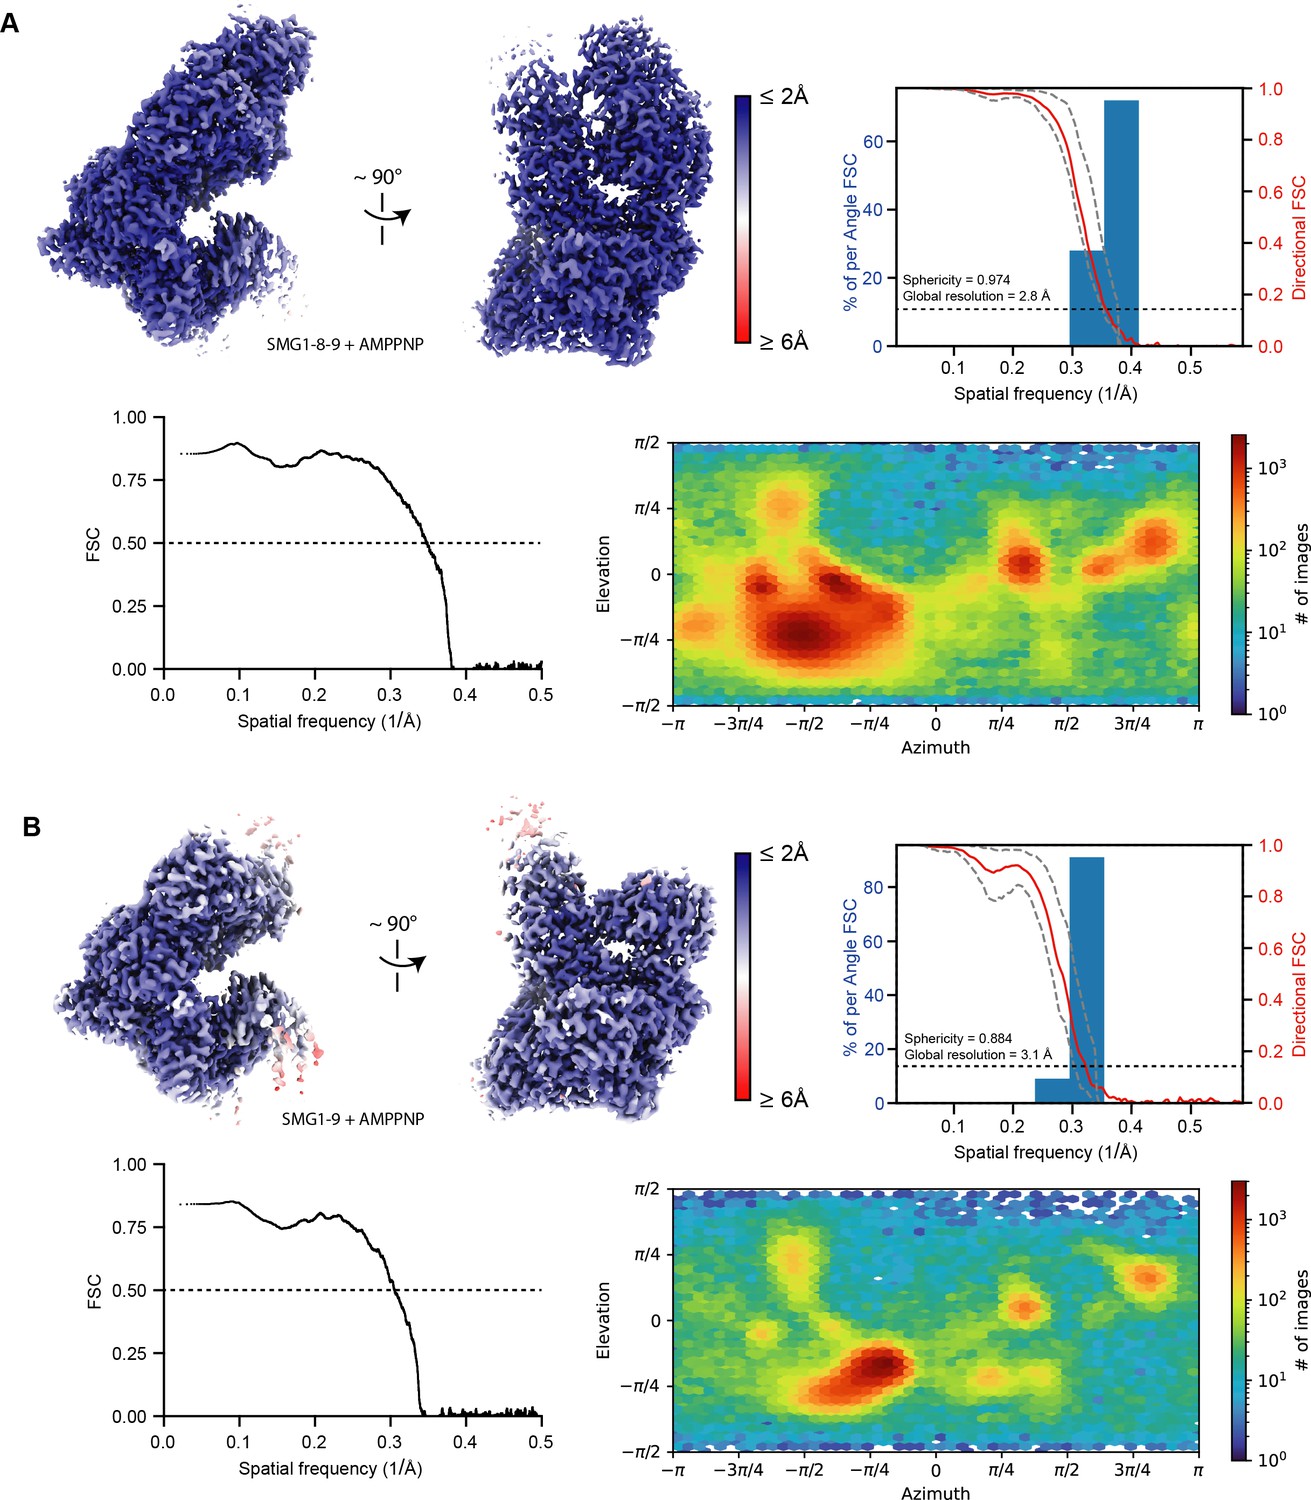
Resolution distribution and isotropy of SMG1-centered cryo-EM maps bound to AMPPNP.
AMPPNP-bound reconstructions used in this study for model building are colored according to estimated local resolution shown in two different orientations. A three-dimensional FSC plot is included for each reconstruction (Tan et al., 2017). The red line represents the estimated global masked half map FSC. The resolutions according to the gold standard FSC cutoff of 0.143 are indicated and shown as a black dashed line (Rosenthal and Henderson, 2003). The spread of directional resolution values is defined as ±1σ (dashed gray lines). Overall isotropy of the maps is indicated by the given sphericity values (out of 1). In the bottom row of each panel, a model versus map FSC is shown alongside a plot visualizing the distribution of particle views. (A) SMG1-8-9 bound to AMPPNP (EMD-13678, PDB identifier: 7PW8). (B) SMG1-9 bound to AMPPNP (EMD-13679, PDB identifier: 7PW9). cryo-EM, cryo-electron microscopy; FSC, XXX.
Figure 3—figure supplement 3
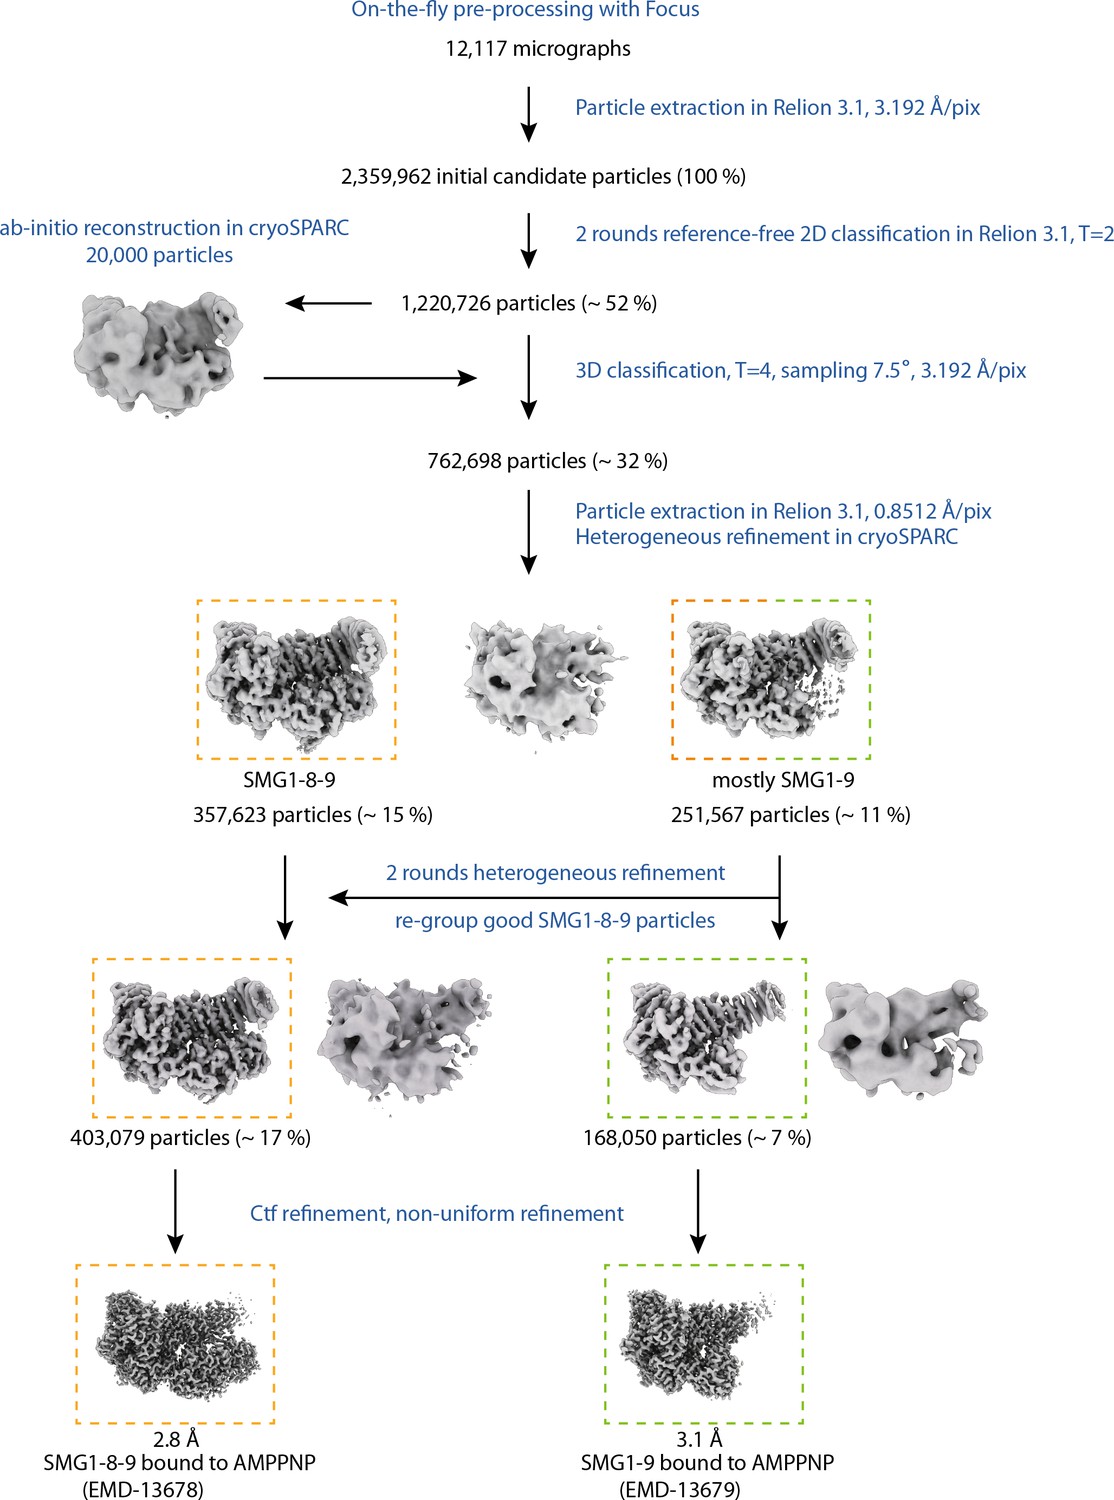
Cryo-EM data processing of AMPPNP data set.
Processing steps are indicated in blue; particle numbers and percentages with respect to initial candidate particles are shown for relevant classes. Colored, dashed rectangles indicate the different final reconstructions and the respective classes obtained from the data set collected in the presence of AMPPNP. cryo-EM, cryo-electron microscopy.
Figure 3—figure supplement 4
Details of the SMG1-9 complex.
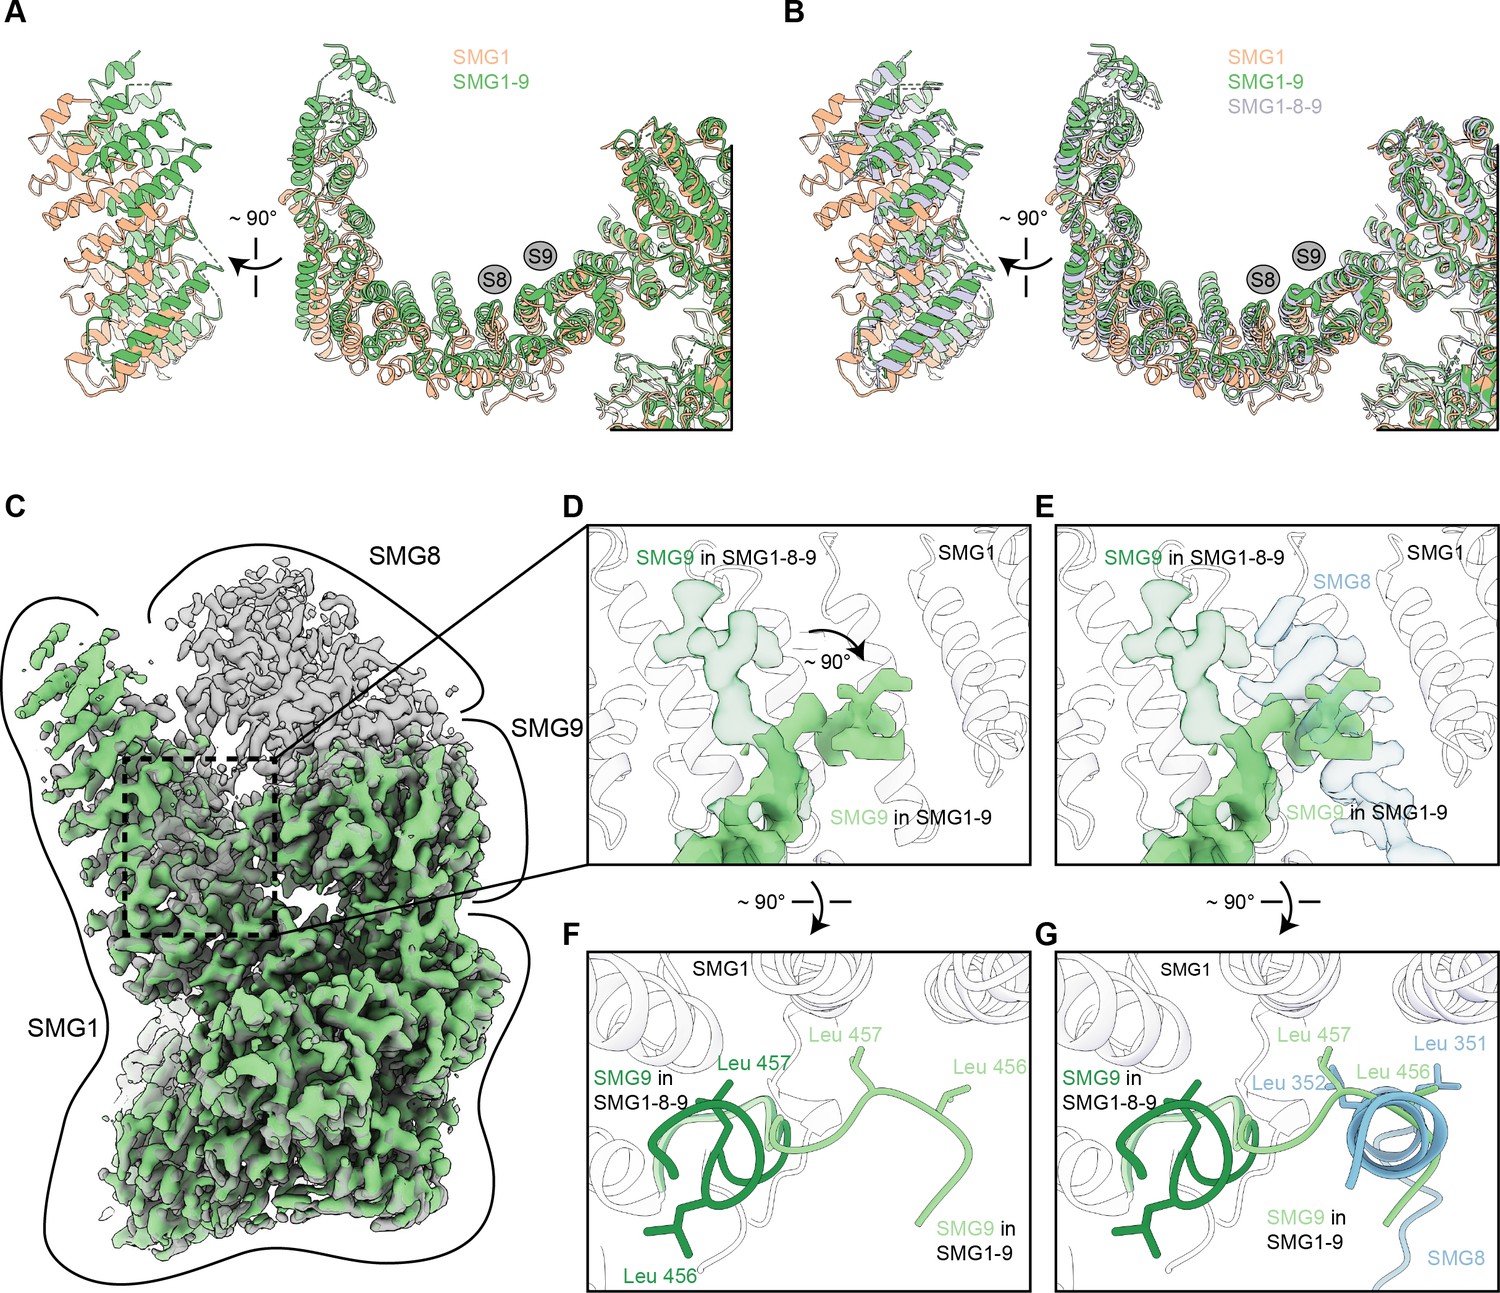
(A) Overlay of SMG1 (PDB identifier: 6L53) and SMG1-9 detailing movements of the N-terminal HEAT repeats. A front and a side view are shown and binding sites for SMG8 and SMG9 are indicated by gray circles. (B) As in (A), but including SMG1-8-9 (PDB identifier: 6Z3R). Models of SMG8 and SMG9 were occluded. (C) Overlay of densities for SMG1-9 and SMG1-8-9 complexes, with SMG1-9 density in light green and SMG1-8-9 density in transparent gray. Approximate location of the single proteins within the densities are indicated. (D) Close-up showing the rearrangement of an SMG9 segment in the SMG1-9 complex compared to the SMG1-8-9 complex. Density of the segment in SMG1-9 is shown in light green, superimposed with the SMG9 segment in SMG1-8-9 displayed in transparent dark green. The model for the interacting region of the SMG1 arch is shown as a transparent cartoon, and SMG8 is not shown. (E) same as (D), but with density for an SMG1-interacting SMG8 segment in the SMG1-8-9 complex shown in transparent blue, that would clash with the SMG9 segment conformation observed in the SMG1-9 complex. (F) Overlay of the model of the SMG9 segment in the SMG1-9 (light green) and the SMG1-8-9 (dark green) complex. Two Leu residues undergoing rearrangement between the two complexes are shown. Position of SMG1 is indicated, SMG8 is not shown. (G) same as in (F), but shown with the SMG1-interacting SMG8 segment (blue). In the SMG1-9 complex, the highlighted pair of Leu residues in SMG9 substitutes for a pair of SMG8 Leu residues on the SMG1 arch.
Figure 4 with 4 supplements
The SMG1 insertion domain can block overall access to the kinase active site.
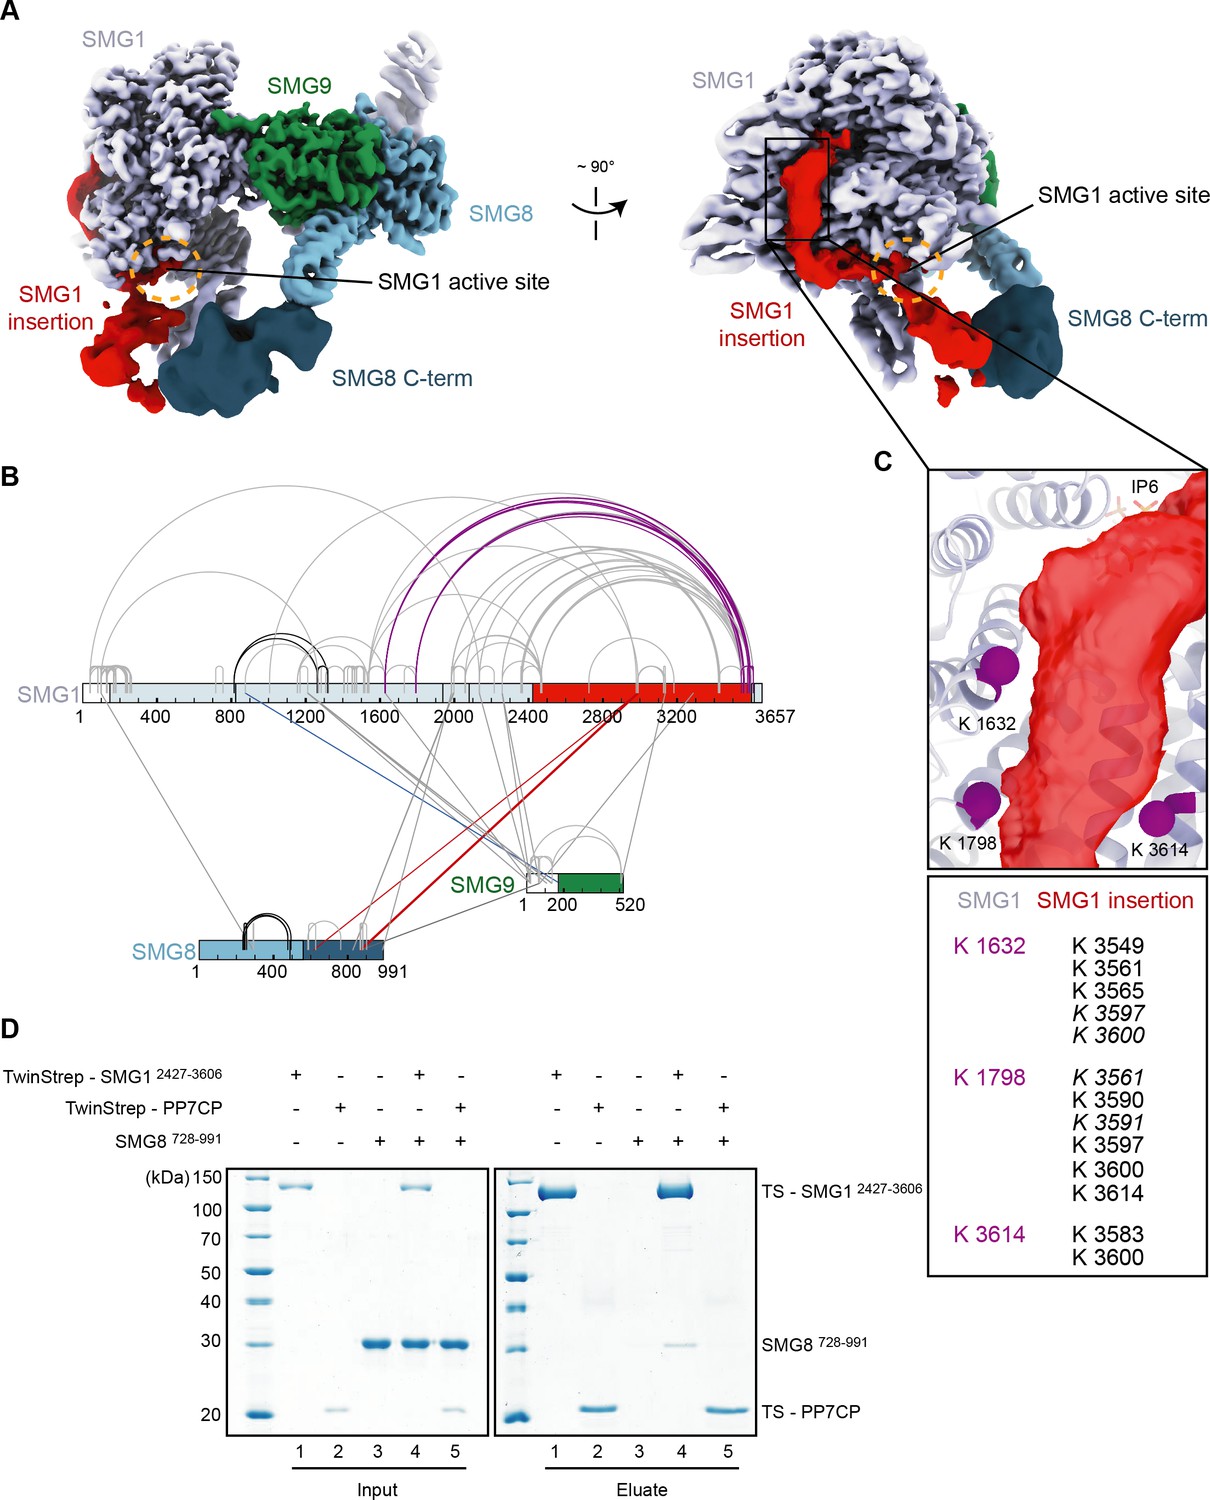
(A) Cryo-EM map after 3D variability analysis filtered by resolution and segmented. Two different views displaying extra density for SMG8 C-terminus (dark blue) and SMG1 insertion domain. The location of the SMG1 kinase active site is indicated by an orange circle. (B) Inter and intra cross-links of the SMG1-8-9 kinase complex. Proteins are colored as in (A). Intra-links shown in Figure 4—figure supplement 1B, C are in black, the inter-link shown in Figure 4—figure supplement 1D is in blue, and inter-links between SMG1 insertion and SMG1 C-terminus are in red. (C) Zoom-in highlighting positions of Lys residues (magenta spheres) crosslinking to the C-terminus of the SMG1 insertion domain. A table listing the cross-linked residues is shown below. Cross-links found in only one of two samples are in italics. (D) Coomassie-stained SDS-PAGE analysis of pull-down experiment showing an interaction between SMG1 insertion domain (SMG12427–3606) and SMG8 C-terminus (SMG8728–991). cryo-EM, cryo-electron microscopy.
-
Figure 4—source data 1
Table with cross-linking data used in Figure 4.
- https://cdn.elifesciences.org/articles/72353/elife-72353-fig4-data1-v2.xls
-
Figure 4—source data 2
Unedited images for gels shown in Figure 4.
- https://cdn.elifesciences.org/articles/72353/elife-72353-fig4-data2-v2.zip
Figure 4—figure supplement 1
Cross-linking mass spectrometry of SMG1-8-9.
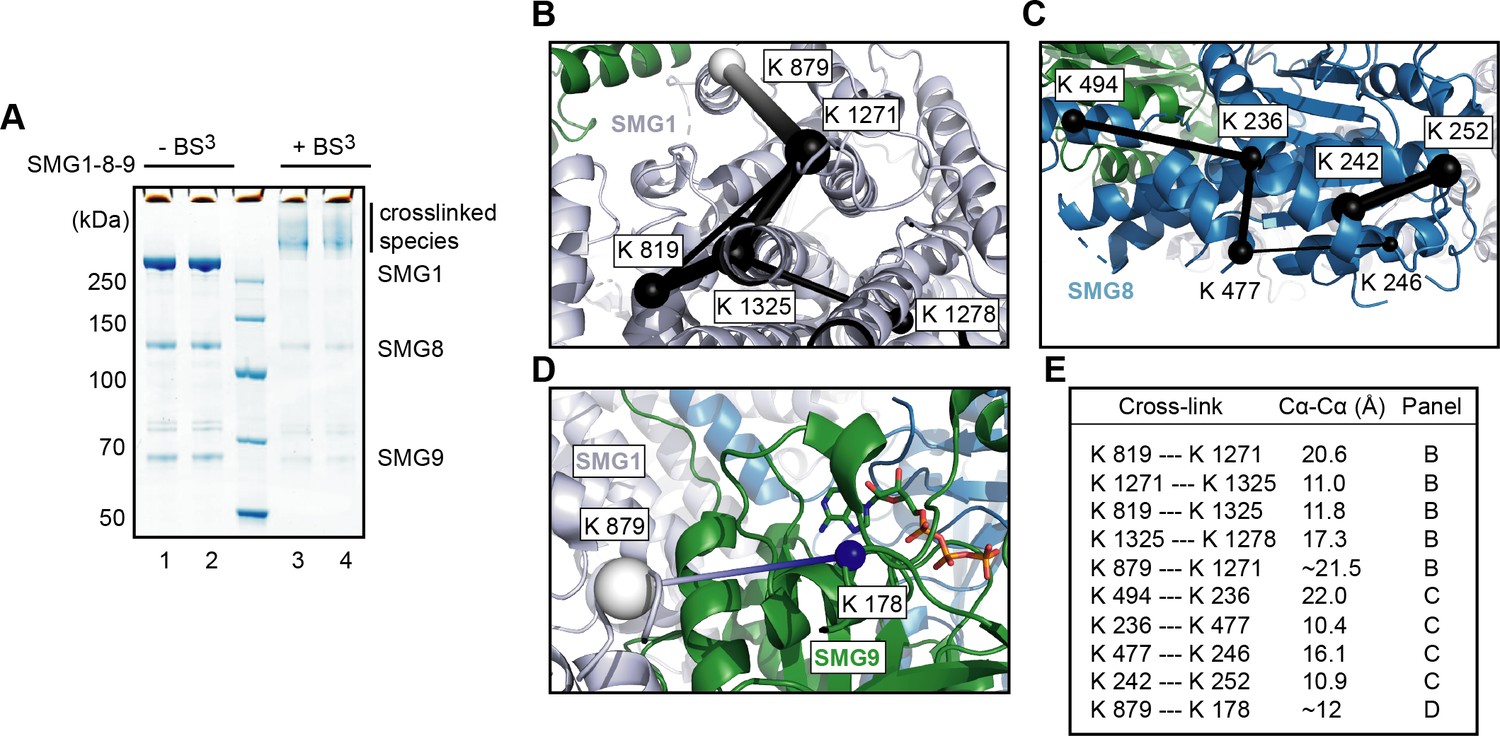
(A) Two samples of SMG1-8-9 (lanes 1 and 2) were incubated with BS3 (lanes 3 and 4) and analyzed using SDS-PAGE and Coomassie staining. (B) Exemplary intra cross-links detected for SMG1 mapped on the model of the apo complex (PDB identifier: 6SYT). Intra cross-links are shown in black with the thickness of the line indicating their score (thicker=higher score), and the respective residues indicated as spheres. A cross-link to an unmodeled region is shown in white (placed in the middle of the segment whose ends are the closest visible Cα atoms). (C) Same as (B), but for SMG8. (D) Inter cross-link between SMG1 and SMG9. The Mg2+-ion complexed with SMG9 was omitted. (E) Table listing measured distances for cross-links visualized in panels (B–D).
-
Figure 4—figure supplement 1—source data 1
Unedited images for gels shown in Figure 4—figure supplement 1.
- https://cdn.elifesciences.org/articles/72353/elife-72353-fig4-figsupp1-data1-v2.zip
Figure 4—figure supplement 2
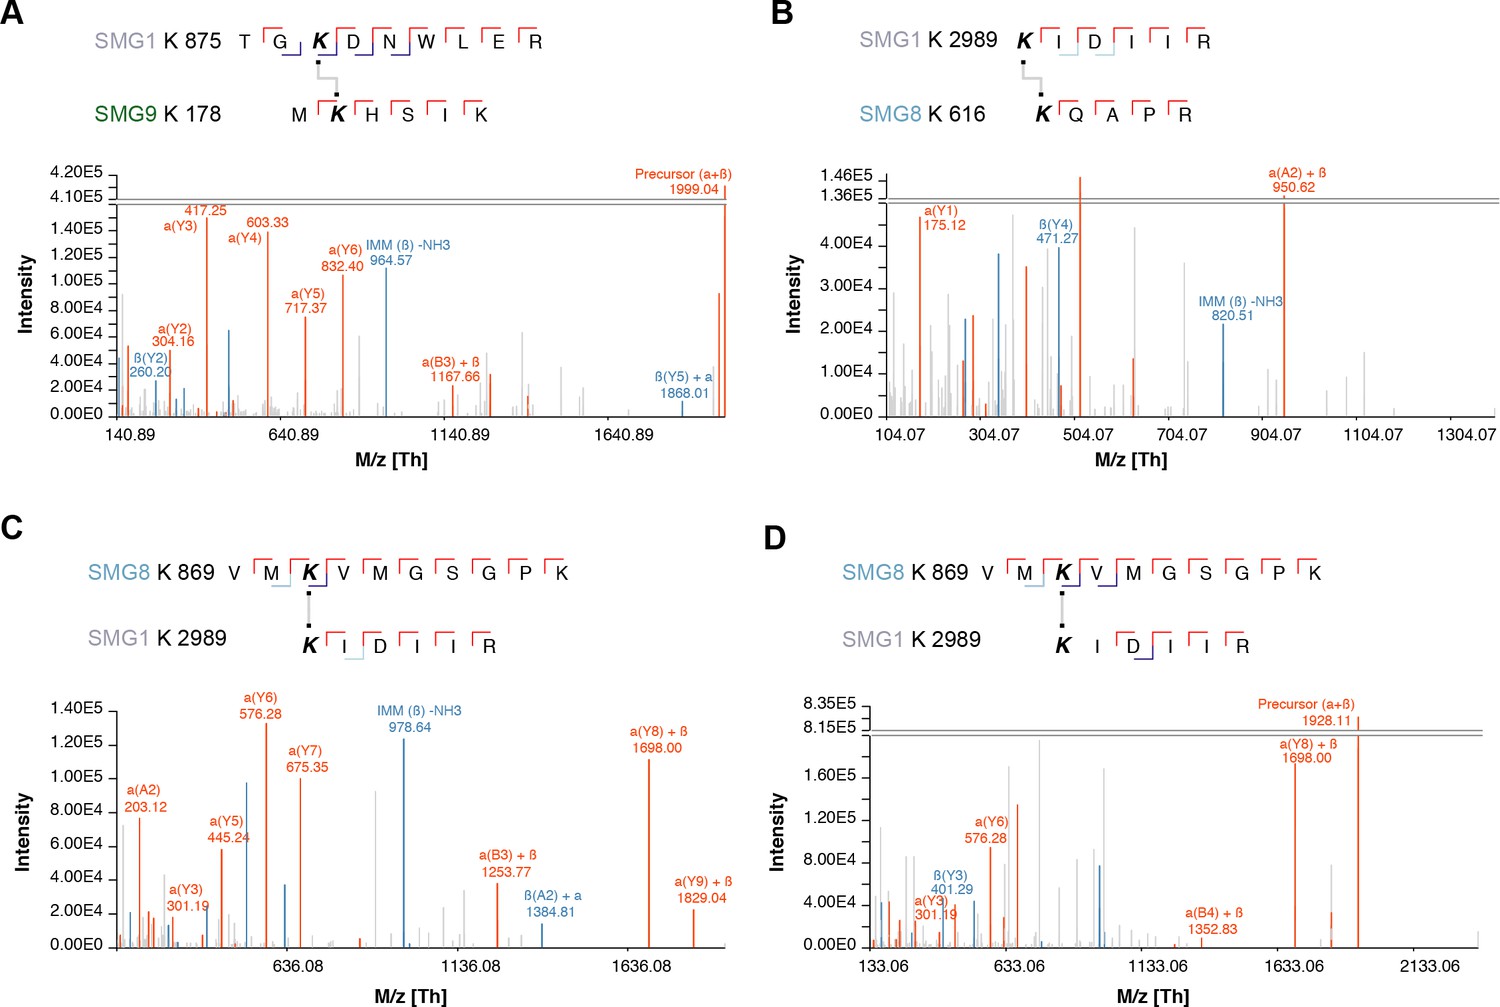
Selected spectra of detected SMG1-8-9 intra-links.
(A–D) Cross-links are shown above each panel. All spectra showed good sequence coverage with full y-ion series, many b-ions, and highly specific fragments.
Figure 4—figure supplement 3
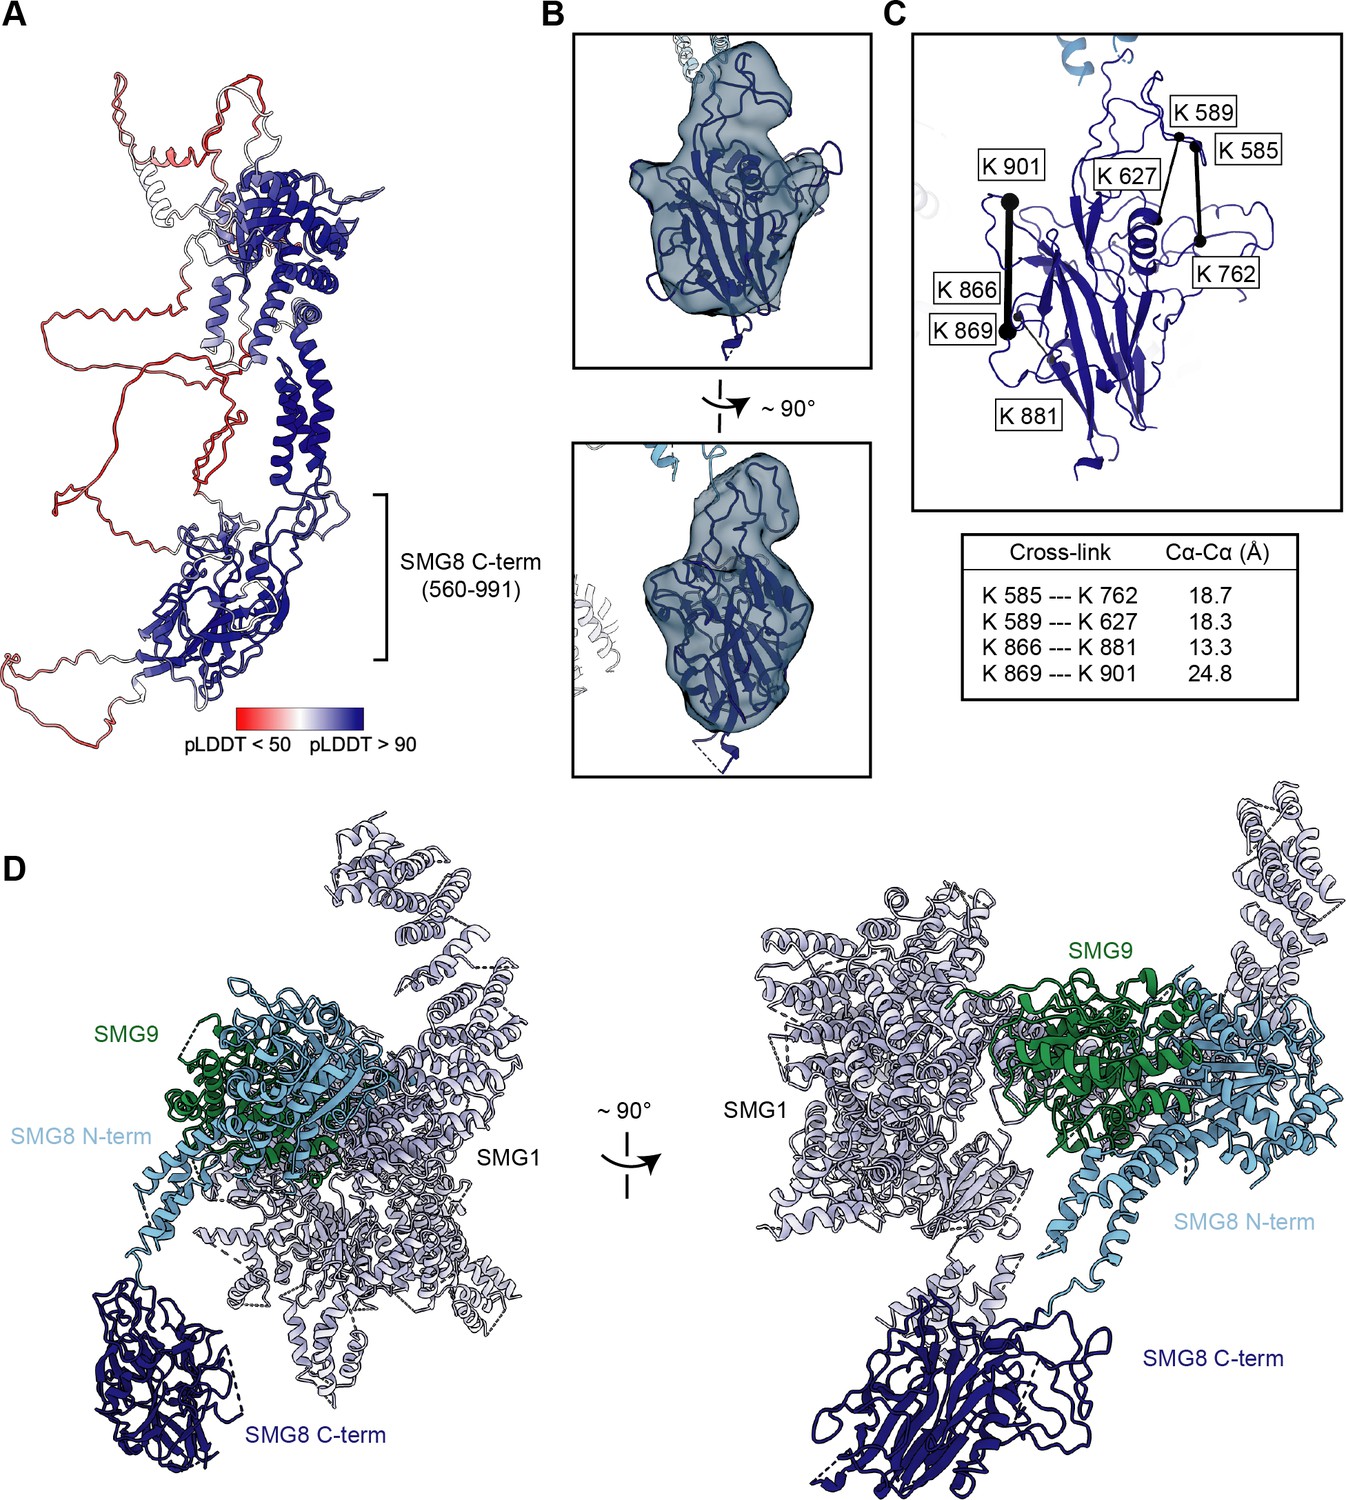
Integration of cryo-EM, cross-linking MS, and AlphaFold data reveals a model for the SMG8 C-terminus.
(A) AlphaFold model of full-length SMG8 (UniProt: Q8ND04) colored by per-residue confidence score (pLDDT) (Jumper et al., 2021). The previously unmodeled SMG8 C-terminus is indicated. (B) AlphaFold model of the SMG8 C-terminus (dark blue) rigid-body fitted into the isolated cryo-EM density and fused to the modeled N-terminal part of SMG8 (light blue), shown in two related views. Regions with a pLDDT<50 were deleted from the model. (C) Intra cross-links of the SMG8 C-terminus mapped on the model, as described in Figure 4—figure supplement 1. A table shows the corresponding measured distances. (D) New model of the SMG1-8-9 complex, now including the SMG8 C-terminal region, shown from two different perspectives (PDB identifier: 7PW5). cryo-EM, cryo-electron microscopy.
Figure 4—figure supplement 4
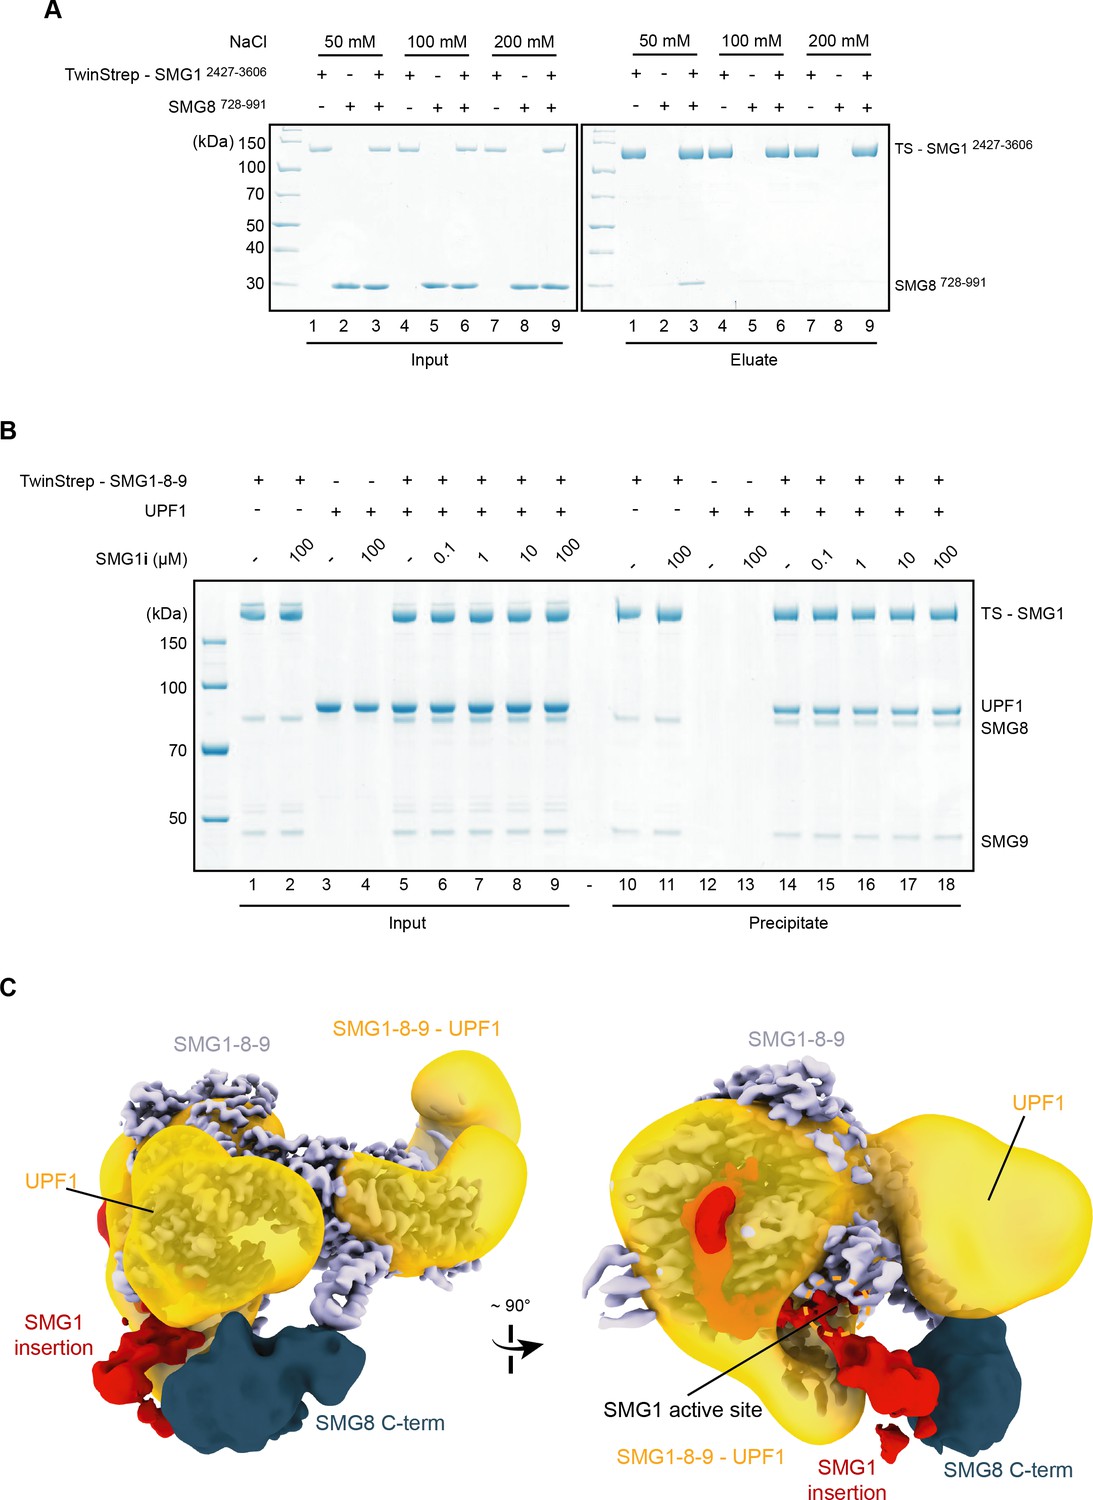
Further characterization of SMG1-8-9—centered interactions.
(A) Coomassie-stained SDS-PAGE analysis of pull-down experiment showing that the interaction between SMG1 insertion domain (SMG12427–3606) and SMG8 C-terminus (SMG8728–991) is dependent on low-salt conditions. (B) Coomassie-stained SDS-PAGE analysis of pull-down experiment showing that SMG1-8-9—SMG1i complex formation does not prevent interaction with UPF1. 0.12 μM of TS-SMG-1-8-9 and 0.4 μM of UPF1 were used throughout. (C) The resolution-filtered, segmented cryo-EM density of SMG1i-bound autoinhibited SMG1-8-9 complex fitted in a negative-stain reconstruction of a cross-linked SMG1-8-9—UPF1 complex (EMD-2664) shown in orientations similar to Figure 4A. The density within the negative-stain reconstruction assigned to UPF1 is indicated.
-
Figure 4—figure supplement 4—source data 1
Unedited images for gels shown in Figure 4—figure supplement 4.
- https://cdn.elifesciences.org/articles/72353/elife-72353-fig4-figsupp4-data1-v2.zip
Figure 5
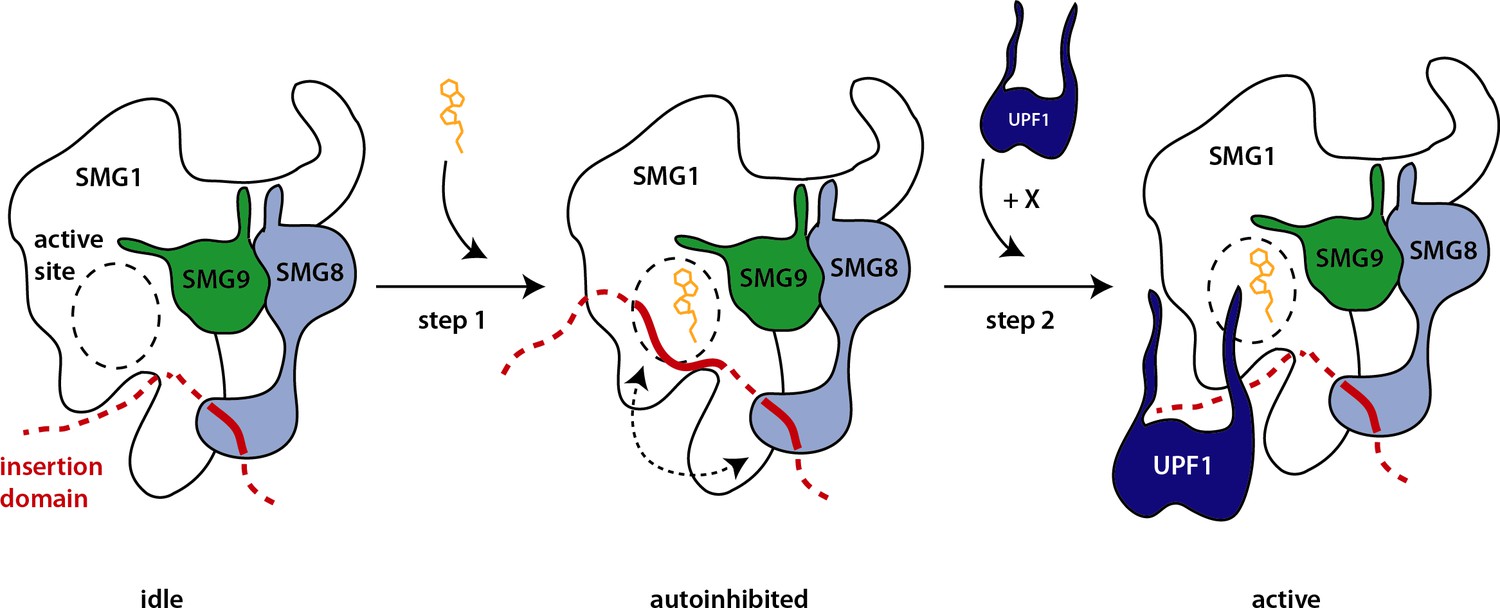
Hypothetical model of SMG1 kinase regulation.
Structural and biochemical data suggest different layers of regulation on SMG1 kinase activity. Upon ATP binding (orange), the SMG1 kinase adopts an autoinhibited conformation (step 1)—mediated by the concerted action of the SMG1 insertion domain in cis and the SMG8 C-terminus in trans (dotted arrow). The presence of the correct substrate and likely other factors/cues (indicated by X) then trigger the release of the autoinhibition and activity of the kinase toward UPF1 (step 2).
Author response image 1
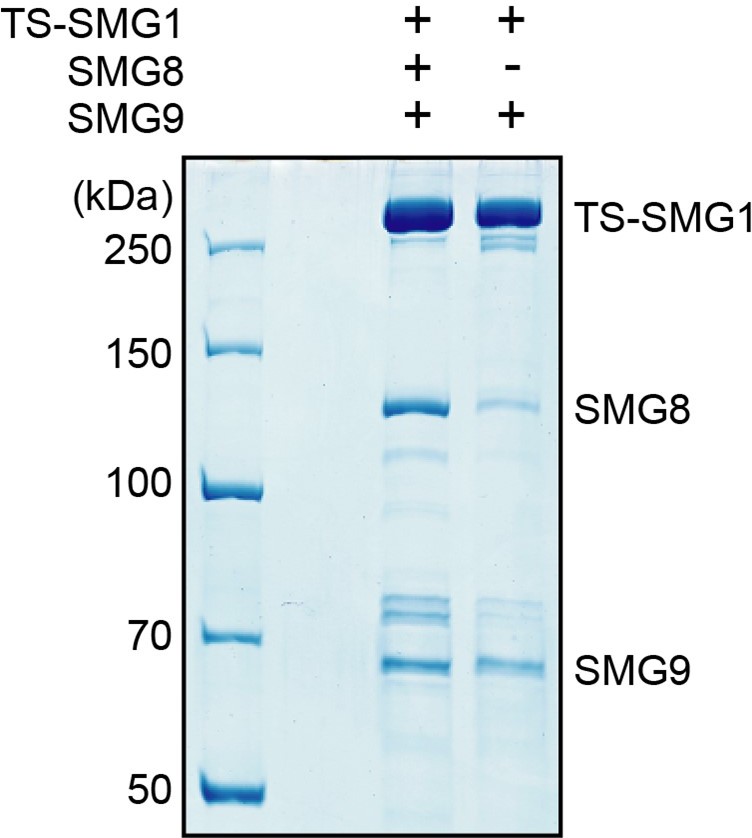
SDS-PAGE analysis of complexes purified from cells transfected to stably express either TwinStrep-SMG1-8-9 or TwinStrep-SMG1-9, as indicated.
Note the co-purification of endogenous SMG8 from the cell line not transfected with SMG8.
Author response image 2
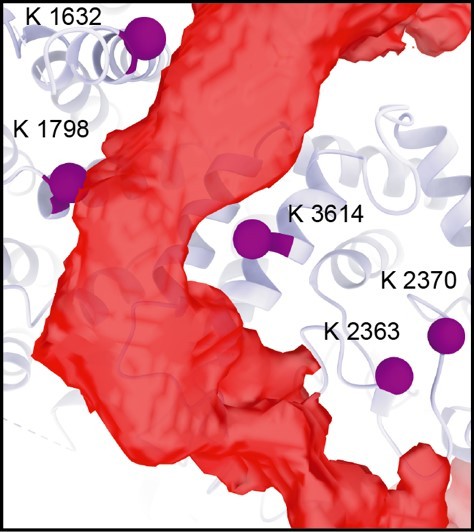
Residues of the SMG1 kinase domain (K2363, K2370) that cross-link to the SMG1 insertion C-terminus are observed in close proximity to the additional density (red).
Related to Figure 4 C.
Tables
Key resources table
| Reagent type (species) or resource | Designation | Source or reference | Identifiers | Additional information |
|---|---|---|---|---|
| Gene (Homo sapiens) | SMG1 | Shigeo Ohno lab | Uniprot Q96Q15 | |
| Gene (H. sapiens) | SMG8 | Shigeo Ohno lab | Uniprot Q8ND04 | |
| Gene (H. sapiens) | SMG9 | Shigeo Ohno lab | Uniprot Q9H0W8 | |
| Cell line (H. sapiens) | HEK293T | ATCC | ||
| Strain, strain background (Escherichia coli) | BL21 Star (DE3) pRARE | EMBL Heidelberg Core Facility | Electrocompetent cells | |
| Peptide, recombinant protein | UPF1-LSQ (peptide 1078) and derivative | In-house as described in doi: https://elifesciences.org/articles/57127 | ||
| Chemical compound, drug | SMG1 inhibitor | Robert Bridges, Rosalind Franklin University of Medicine and Science, and the Cystic Fibrosis Foundation | ||
| Chemical compound, drug | AMPPNP | Sigma-Aldrich | ||
| Chemical compound, drug | ATP | Sigma-Aldrich | ||
| Software, algorithm | SerialEM | https://bio3d.colorado.edu/SerialEM/ | ||
| Software, algorithm | Focus | https://focus.c-cina.unibas.ch/ wiki/doku.php | v1.1.0 | |
| Software, algorithm | RELION | doi: 10.7554/eLife.42166 | RELION 3.0 | |
| Software, algorithm | Cryosparc | doi: 10.1038/nmeth.4169 | Cryosparc2 | |
| Software, algorithm | UCSF Chimera | UCSF, https://www.cgl.ucsf.edu/chimera/ | ||
| Software, algorithm | UCSF ChimeraX | UCSF, https://www.rbvi.ucsf.edu/chimerax/ | ||
| Software, algorithm | COOT | http://www2.mrc-lmb.cam.ac.uk/personal/pemsley/coot/ | ||
| Software, algorithm | PHENIX | https://www.phenix-online.org/ | PHENIX 1.17 | |
| Software, algorithm | Molprobity | Duke Biochemistry, http://molprobity.biochem.duke.edu/ | ||
| Software, algorithm | PyMOL | PyMOL Molecular Graphics System, Schrodinger LLC | PyMOL 2.3.2 |
Additional files
-
Supplementary file 1
Cryo-EM data collection, refinement and validation statistics.
- https://cdn.elifesciences.org/articles/72353/elife-72353-supp1-v2.docx
-
Transparent reporting form
- https://cdn.elifesciences.org/articles/72353/elife-72353-transrepform1-v2.pdf
Download links
A two-part list of links to download the article, or parts of the article, in various formats.
Downloads (link to download the article as PDF)
Open citations (links to open the citations from this article in various online reference manager services)
Cite this article (links to download the citations from this article in formats compatible with various reference manager tools)
Cryo-EM reconstructions of inhibitor-bound SMG1 kinase reveal an autoinhibitory state dependent on SMG8
eLife 10:e72353.
https://doi.org/10.7554/eLife.72353


