Risk factors relate to the variability of health outcomes as well as the mean: A GAMLSS tutorial
- Centre for Longitudinal Studies, Social Research Institute, University College London, United Kingdom
- Great Ormond Street Institute of Child Health, University College London, United Kingdom
Figures
Figure 1
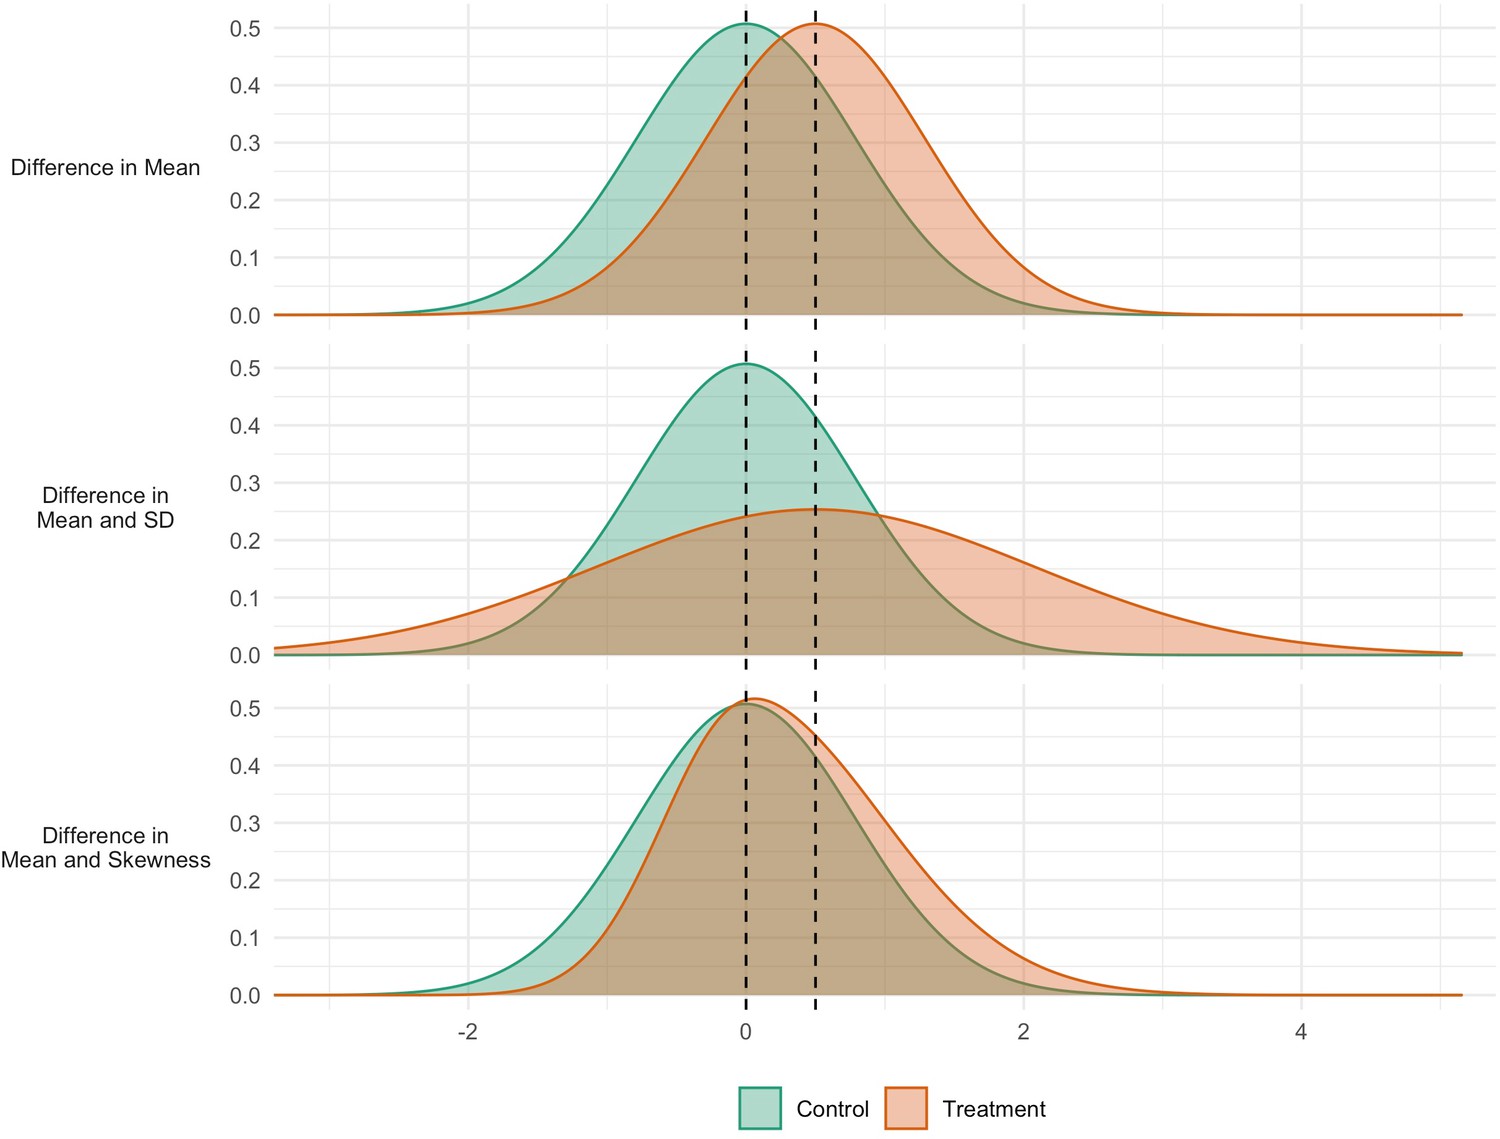
Simulated data for three interventions each having the same effect on the mean, but different effects on the variability (middle panel) and skewness (bottom panel).
Figure 2
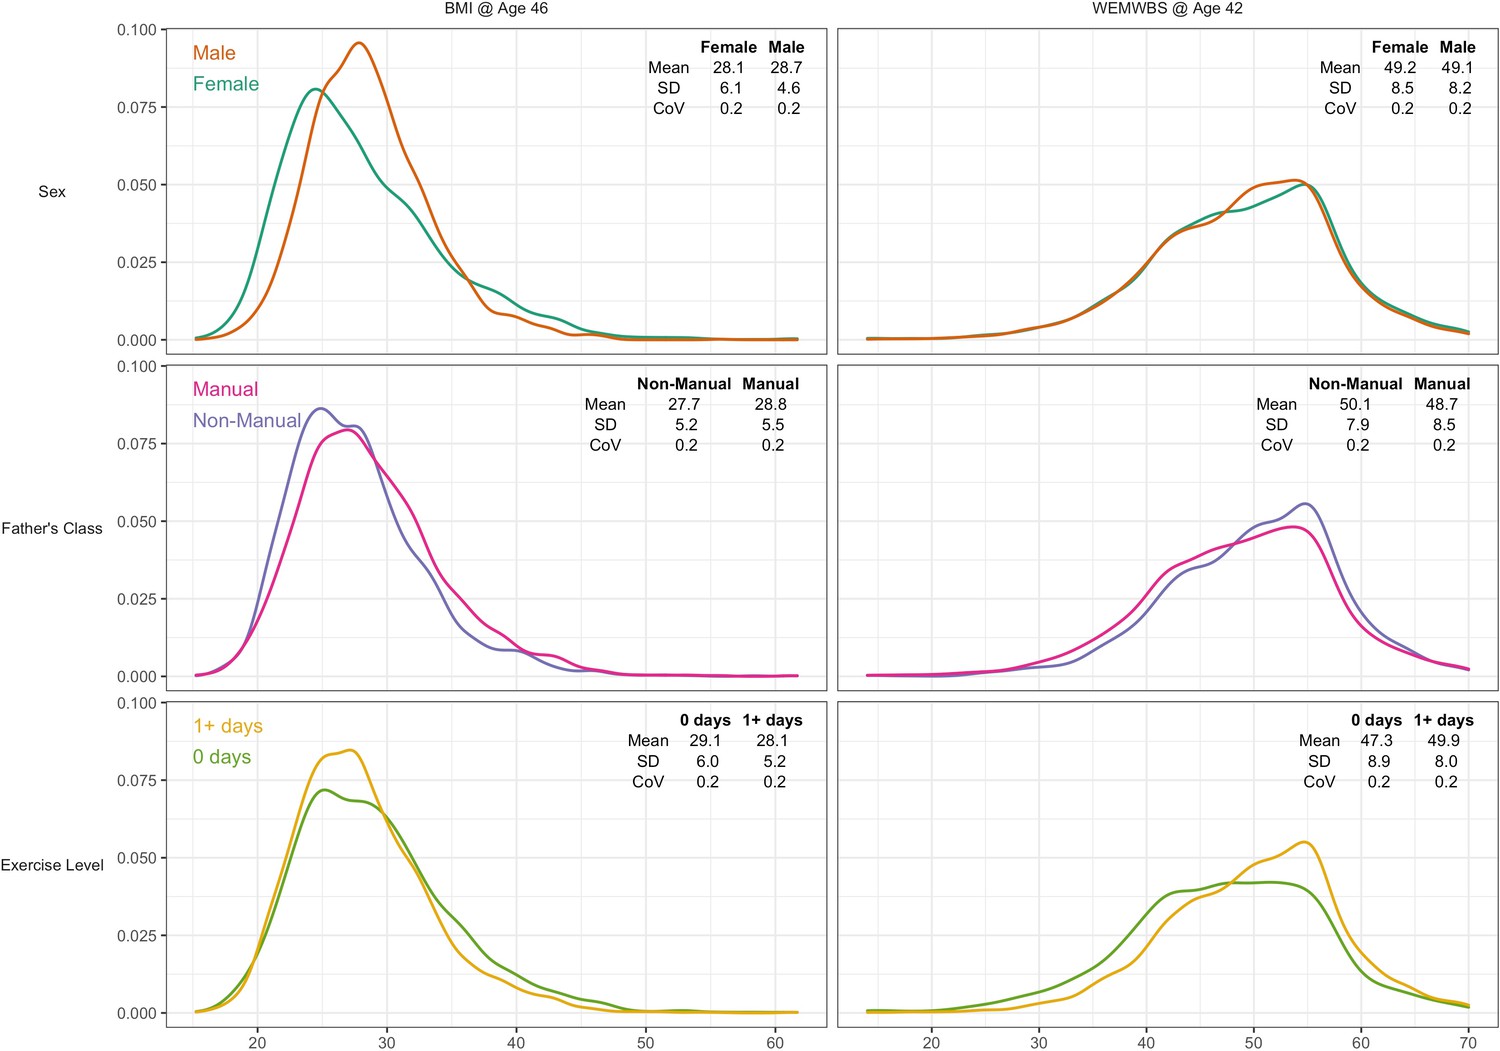
Kernel density plots for body mass index and mental wellbeing, stratified by risk factor group.
Note: CoV = coefficient of variation (SD/mean).
Figure 3

Association between risk factors and BMI by BMI centile.
Plotted lines are calculated using GAMLSS estimation results of the entire outcome distribution; points at the 25th, 50th, and 75th centiles are estimated using quantile regression models. Marginal effects show the differences in outcome between each risk group across the outcome distribution.
Figure 4
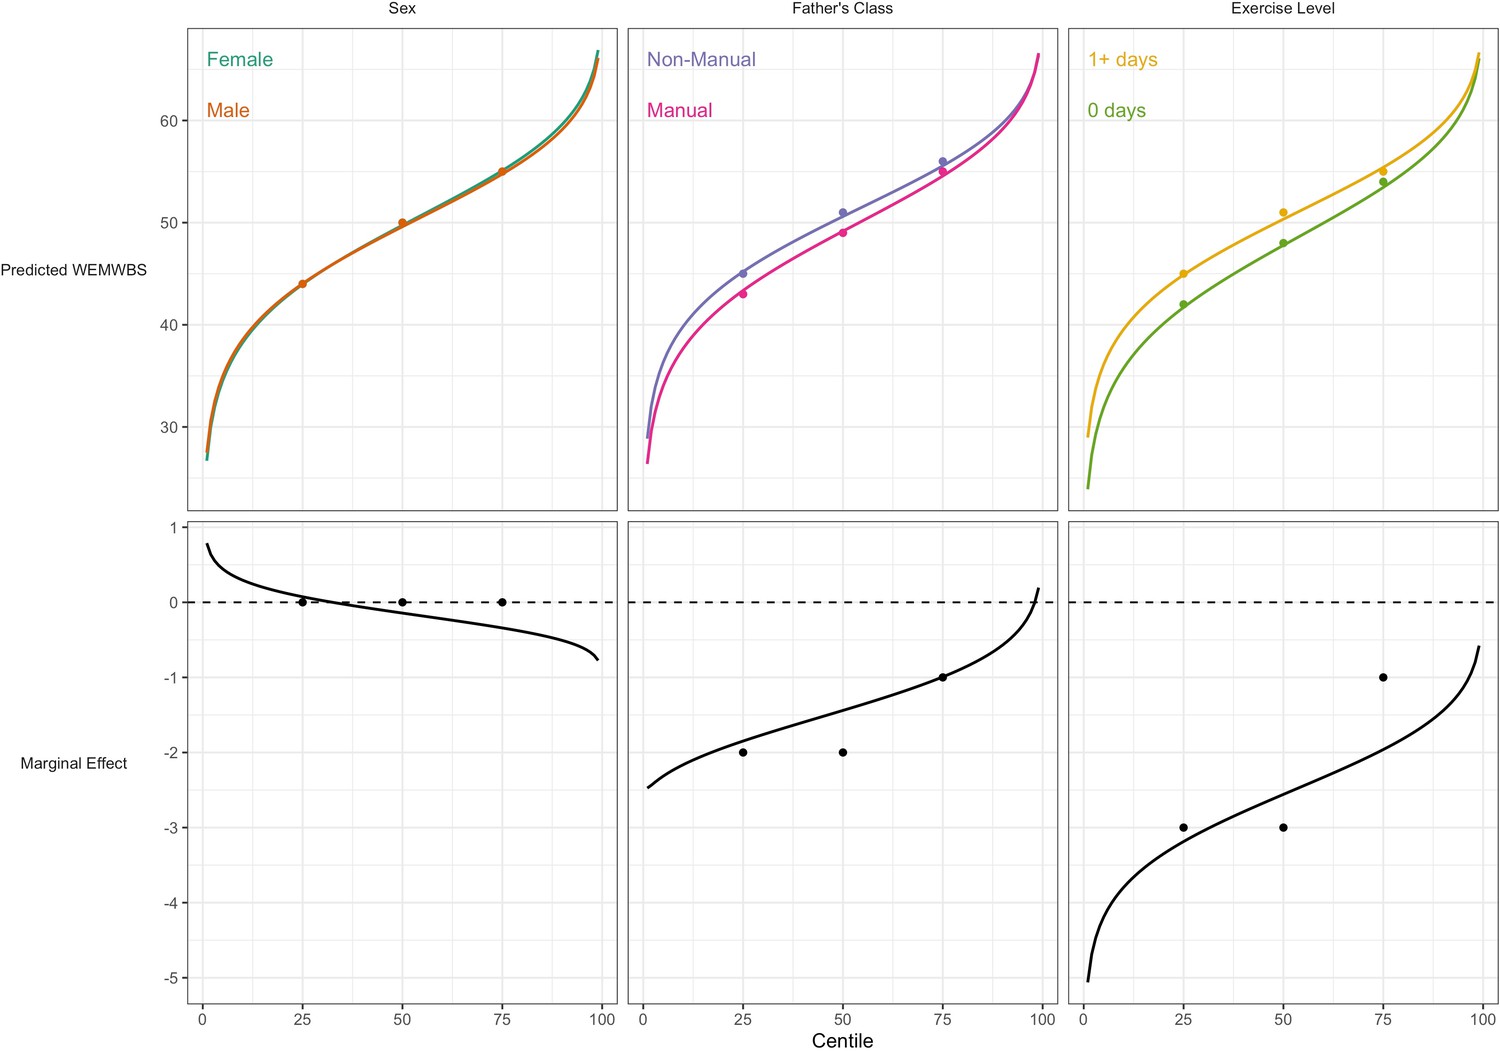
Association between risk factors and mental wellbeing (WEMWBS) by centile.
Plotted lines are calculated using GAMLSS estimation results of the entire outcome distribution; points at the 25th, 50th, and 75th centiles are estimated using quantile regression models. Marginal effects show the differences in outcome between each risk group across the outcome distribution.
Tables
Table 1
Risk factors in relation to body mass index: differences in mean, variability and skewness estimated by GAMLSS (n = 6007).
| Risk factor | % | NO distribution | BCCG distribution | |||
|---|---|---|---|---|---|---|
| Mean | SD | Median | CoV | Skewness* | ||
| Female (ref) | 52.4% | 28.1 | 6.1 | 26.9 | 0.22 | 1.10 |
| Male | 47.6% | 28.7 | 4.6 | 28.2 | 0.16 | 0.75 |
| Unadjusted difference, % (SE) | 1.9 (0.5) | –27.6 (1.8) | 4.1 (0.4) | –23 (1.8) | 0.48 (0.11) | |
| Adjusted† difference, % (SE) | 2.2 (0.5) | –27.4 (1.8) | 4.4 (0.4) | –22.6 (1.8) | 0.54 (0.11) | |
| Non-manual (ref) | 36.3% | 27.7 | 5.2 | 27 | 0.19 | 1.15 |
| Manual social class | 63.7% | 28.8 | 5.5 | 28 | 0.19 | 0.90 |
| Unadjusted difference, % (SE) | 4.0 (0.5) | 6.1 (1.9) | 4.4 (0.5) | 6 (1.9) | 0.39 (0.11) | |
| Adjusted† difference, % (SE) | 3.8 (0.5) | 5.5 (1.9) | 4.3 (0.4) | 5.6 (1.9) | 0.40 (0.12) | |
| Physically active (ref) | 73% | 28.1 | 5.2 | 27.4 | 0.19 | 0.97 |
| Inactive | 27% | 29.1 | 6.0 | 28.3 | 0.21 | 0.94 |
| Unadjusted difference, % (SE) | 3.3 (0.6) | 13.5 (2.1) | 2.9 (0.5) | 10.4 (2.1) | 0.08 (0.12) | |
| Adjusted† difference, % (SE) | 3.3 (0.6) | 12.1 (2.1) | 3.1 (0.5) | 9.3 (2.1) | 0.12 (0.12) | |
-
*
Skewness is estimated as the Box-Cox power (that is, the power required to transform the outcome to a normal distribution); differences are the absolute difference in Box-Cox power in each subgroup estimated by GAMLSS. GAMLSS estimates multiple distribution moments simultaneously; thus, differences may not exactly correspond to descriptive comparisons reported above.
-
†
Estimates mutually adjusted for sex, social class and physical inactivity.
-
NO: normal distribution; BCCG: Box-Cox Cole and Green distribution: SD: standard deviation; CoV: coefficient of variation; GAMLSS: Generalized Additive Models for Location, Scale and Shape; SE, standard error.
Table 2
Risk factors in relation to mental wellbeing (WEMWBS): differences in mean, variability and skewness estimated by GAMLSS (n = 7,104).
| Risk factor | % | NO distribution | BCCG distribution | |||
|---|---|---|---|---|---|---|
| Mean | SD | Median | COV | Skewness* | ||
| Female (ref) | 52.8% | 49.2 | 8.5 | 50 | 0.17 | –0.41 |
| Male | 47.2% | 49.1 | 8.2 | 50 | 0.17 | –0.40 |
| Unadjusted difference, % (SE) | –0.2 (0.4) | –3.9 (1.7) | –0.3 (0.4) | –3.5 (1.7) | 0.02 (0.11) | |
| Adjusted† difference, % (SE) | –0.6 (0.4) | –3.6 (1.7) | –0.7 (0.4) | –2.6 (1.7) | 0.00 (0.11) | |
| Non-manual (ref) | 34.8% | 50.1 | 7.9 | 51 | 0.16 | –0.45 |
| Manual social class | 65.2% | 48.7 | 8.5 | 49 | 0.17 | –0.37 |
| Unadjusted difference, % (SE) | –2.8 (0.4) | 7.2 (1.8) | –2.9 (0.4) | 10.9 (1.8) | –0.20 (0.12) | |
| Adjusted† difference, % (SE) | –2.5 (0.4) | 6.0 (1.8) | –2.7 (0.4) | 9.8 (1.8) | –0.24 (0.12) | |
| Physically active (ref) | 72.4% | 49.9 | 8.0 | 51 | 0.16 | –0.38 |
| Inactive | 27.6% | 47.3 | 8.9 | 48 | 0.19 | –0.36 |
| Unadjusted difference, % (SE) | –5.3 (0.5) | 10.9 (1.9) | –5.2 (0.4) | 16.2 (1.9) | –0.12 (0.12) | |
| Adjusted† difference, % (SE) | –5.3 (0.5) | 9.9 (1.9) | –5.1 (0.4) | 15.2 (1.9) | –0.10 (0.12) | |
-
*
Skewness is estimated as the Box-Cox power (that is, the power required to transform the outcome to a normal distribution); differences are the absolute difference in Box-Cox power in each subgroup estimated by GAMLSS. GAMLSS estimates multiple distribution moments simultaneously; thus, differences may not exactly correspond to descriptive comparisons reported above.
-
†
Estimates mutually adjusted for sex, social class and physical inactivity.
-
NO: normal distribution; BCCG: Box-Cox Cole and Green distribution: SD: standard deviation; CoV: coefficient of variation; GAMLSS: Generalized Additive Models for Location, Scale and Shape; SE, standard error.
Table 3
Risk factors in relation to body mass index (BMI) and mental wellbeing (WEMWBS): percentage differences at multiple points of the outcome distribution estimated by quantile regression.
| Outcome | Risk factor | 25th centile | 50th centile | 75th centile |
|---|---|---|---|---|
| BMI @ Age 46 | Male vs female | 6.8 (0.5) | 4.5 (0.6) | –0.8 (0.7) |
| Father’s Class | 3.7 (0.6) | 3.7 (0.6) | 4.9 (0.7) | |
| Exercise Level | 1 (0.7) | 3 (0.7) | 4.3 (0.8) | |
| WEMWBS @ Age 42 | Sex | 0 (0.7) | 0 (0.5) | 0 (0.3) |
| Father’s Class | –4.5 (0.7) | –4 (0.5) | –1.8 (0.3) | |
| Exercise Level | –6.9 (0.5) | –6.1 (0.5) | –1.8 (0.5) |
-
Note: results show the percentage difference (log-transformed x 100) in BMI or mental wellbeing (WEMWEBS; standard errors in parenthesis) at different centiles of the outcome distribution; estimates are mutually adjusted.
Additional files
-
Supplementary file 1
Risk factors in relation to body mass index (BMI): differences in mean, variability and skewness estimated by GAMLSS (b) Risk factors in relation to mental wellbeing (WEMWEBS): differences in mean, variability and skewness estimated by GAMLSS.
- https://cdn.elifesciences.org/articles/72357/elife-72357-supp1-v2.docx
-
Transparent reporting form
- https://cdn.elifesciences.org/articles/72357/elife-72357-transrepform1-v2.docx
Download links
A two-part list of links to download the article, or parts of the article, in various formats.
Downloads (link to download the article as PDF)
Open citations (links to open the citations from this article in various online reference manager services)
Cite this article (links to download the citations from this article in formats compatible with various reference manager tools)
Risk factors relate to the variability of health outcomes as well as the mean: A GAMLSS tutorial
eLife 11:e72357.
https://doi.org/10.7554/eLife.72357


