Developmental stage-specific spontaneous activity contributes to callosal axon projections
- Department of Biophysics, Kyoto University Graduate School of Science, Japan
- Department of Molecular Physiology, Kyushu University Graduate School of Medical Sciences, Japan
- Department of Physiology, The University of Tokyo School of Medicine, Japan
- International Research Center for Neurointelligence (WPI-IRCN), The University of Tokyo School of Medicine, Japan
- Institute for AI and Beyond, The University of Tokyo School of Medicine, Japan
- CREST, Japan Science and Technology Agency, Japan
- Department of Physiology, Graduate School of Medical and Dental Sciences, Kagoshima University, Japan
Figures
Figure 1 with 4 supplements
Restoration of neuronal activity in the second postnatal week recovers callosal axon projections.
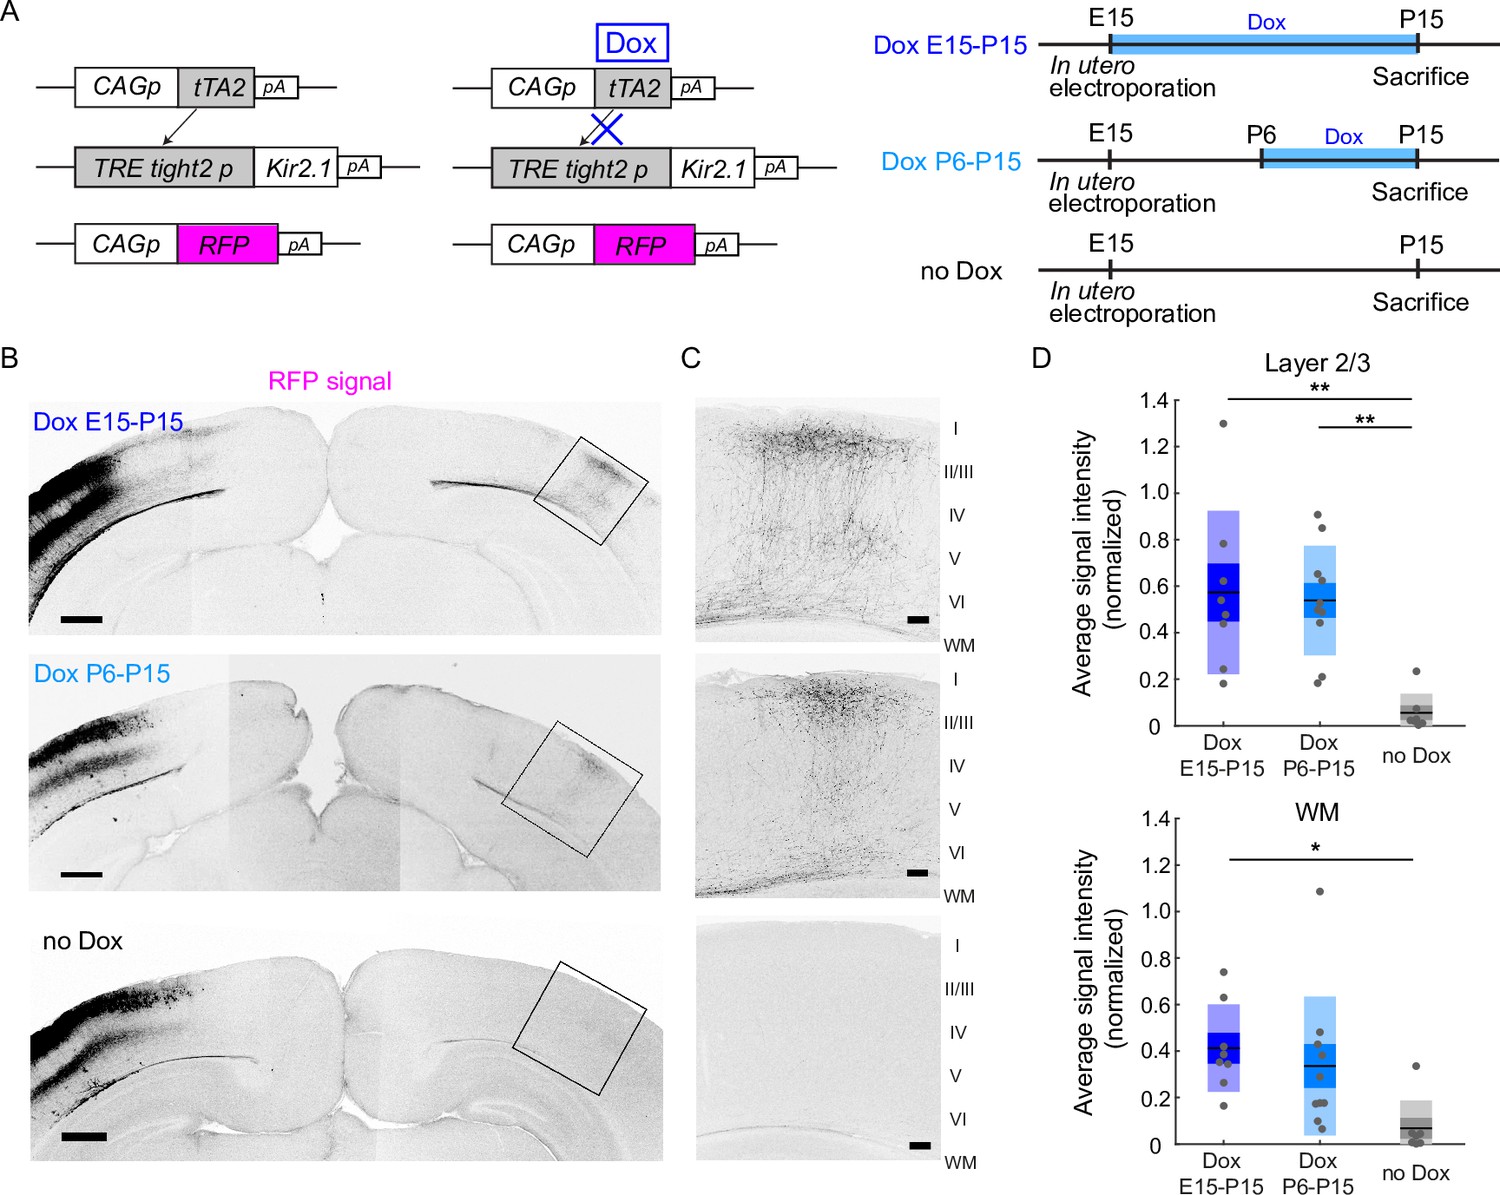
(A) Left, plasmids designed for temporally controlled expression of Kir2.1. Right, experimental timeline. Kir2.1 is a genetic tool to reduce neuronal activity. Transactivator tTA2s is expressed under the control of the CAG promoter (CAGp). Without doxycycline (Dox), tTA2s binds to the TRETight2 promoter (TRETight2p), and Kir2.1 expression is induced (left). With Dox administration, tTA2s cannot bind to the TRETight2 promoter, and Kir2.1 expression is suppressed (right). pA: polyA signal. (B) Coronal sections through the P15 cerebral cortex show the distribution of neurons expressing fluorescent proteins on the electroporated side and their axonal projections on the other side. Top: ‘Dox E15-P15’ condition where Dox was administered from E15 to P15; thus, Kir2.1 expression was suppressed throughout development. Middle: ‘Dox P6-15’ condition where Dox was administered from P6 to P15; thus, Kir2.1 expression was suppressed in the second postnatal week. Bottom: ‘no Dox’ condition where Kir2.1 is expressed throughout development. Scale bars, 500 μm. (C) Boxed regions in (B). WM: white matter. Scale bars, 100 μm. (D) Top, average signal intensity of fluorescently labeled callosal axons in layers 1–3. ‘Dox E15-P15’ group: n=8 sections from eight mice. ‘Dox P6-15’ group: n=10 sections from 10 mice. ‘no Dox’ group: n=7 sections from seven mice. **p<0.01 by Tukey–Kramer test. Bottom, average signal intensity of fluorescently labeled callosal axons in the white matter. *p<0.05 by Tukey–Kramer test.
-
Figure 1—source data 1
Source data for Figure 1D.
- https://cdn.elifesciences.org/articles/72435/elife-72435-fig1-data1-v1.xlsx
Figure 1—figure supplement 1
Callosal axon projections with or without activity manipulation.
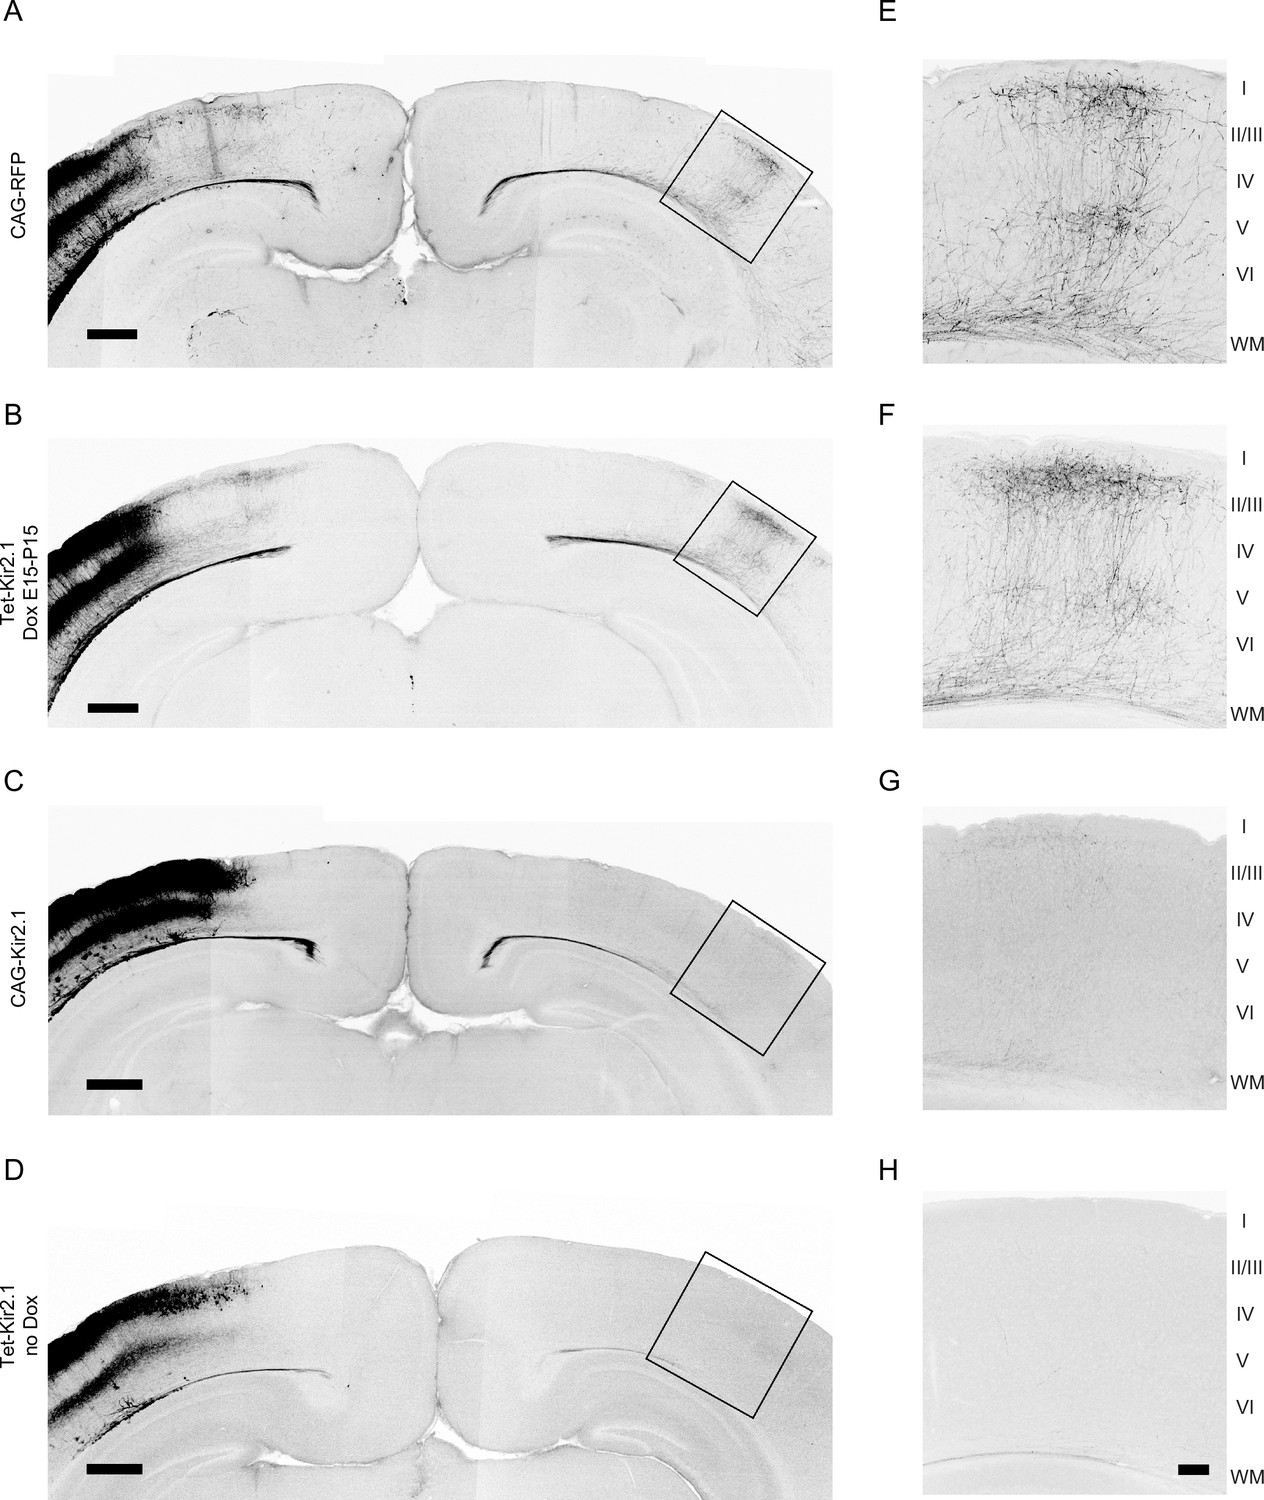
(A, E) Coronal sections through the P15 visual cortex show the distribution of neurons expressing fluorescent proteins on the electroporated side and their axonal projections on the other side. pCAG-TurboRFP was transfected to label callosal axons. n=10 sections from 10 mice. (B, F) TRETight2 promoter (pTRE-Tight2)-Kir2.1, pCAG-tTA2s, and pCAG-TurboRFP were transfected, and doxycycline (Dox) was administered from E15 to P15. Due to the presence of Dox, Kir2.1 expression is suppressed throughout development. n=8 sections from eight mice. (C, G) pCAG-Kir2.1 and pCAG-TurboRFP were transfected. Under the control of the pCAG, Kir2.1 is expressed throughout development. n=7 sections from seven mice. (D, H) pTRE-Tight2-Kir2.1, pCAG-tTA2s, and pCAG-TurboRFP were transfected, and Dox was not administered. Due to the absence of Dox, Kir2.1 is expressed throughout development. n = 7 sections from seven mice. Scale bars in A–D, 500 μm. Scale bar in H, 100 μm.
Figure 1—figure supplement 2
Validation of the Tet-off system with fluorescent proteins.
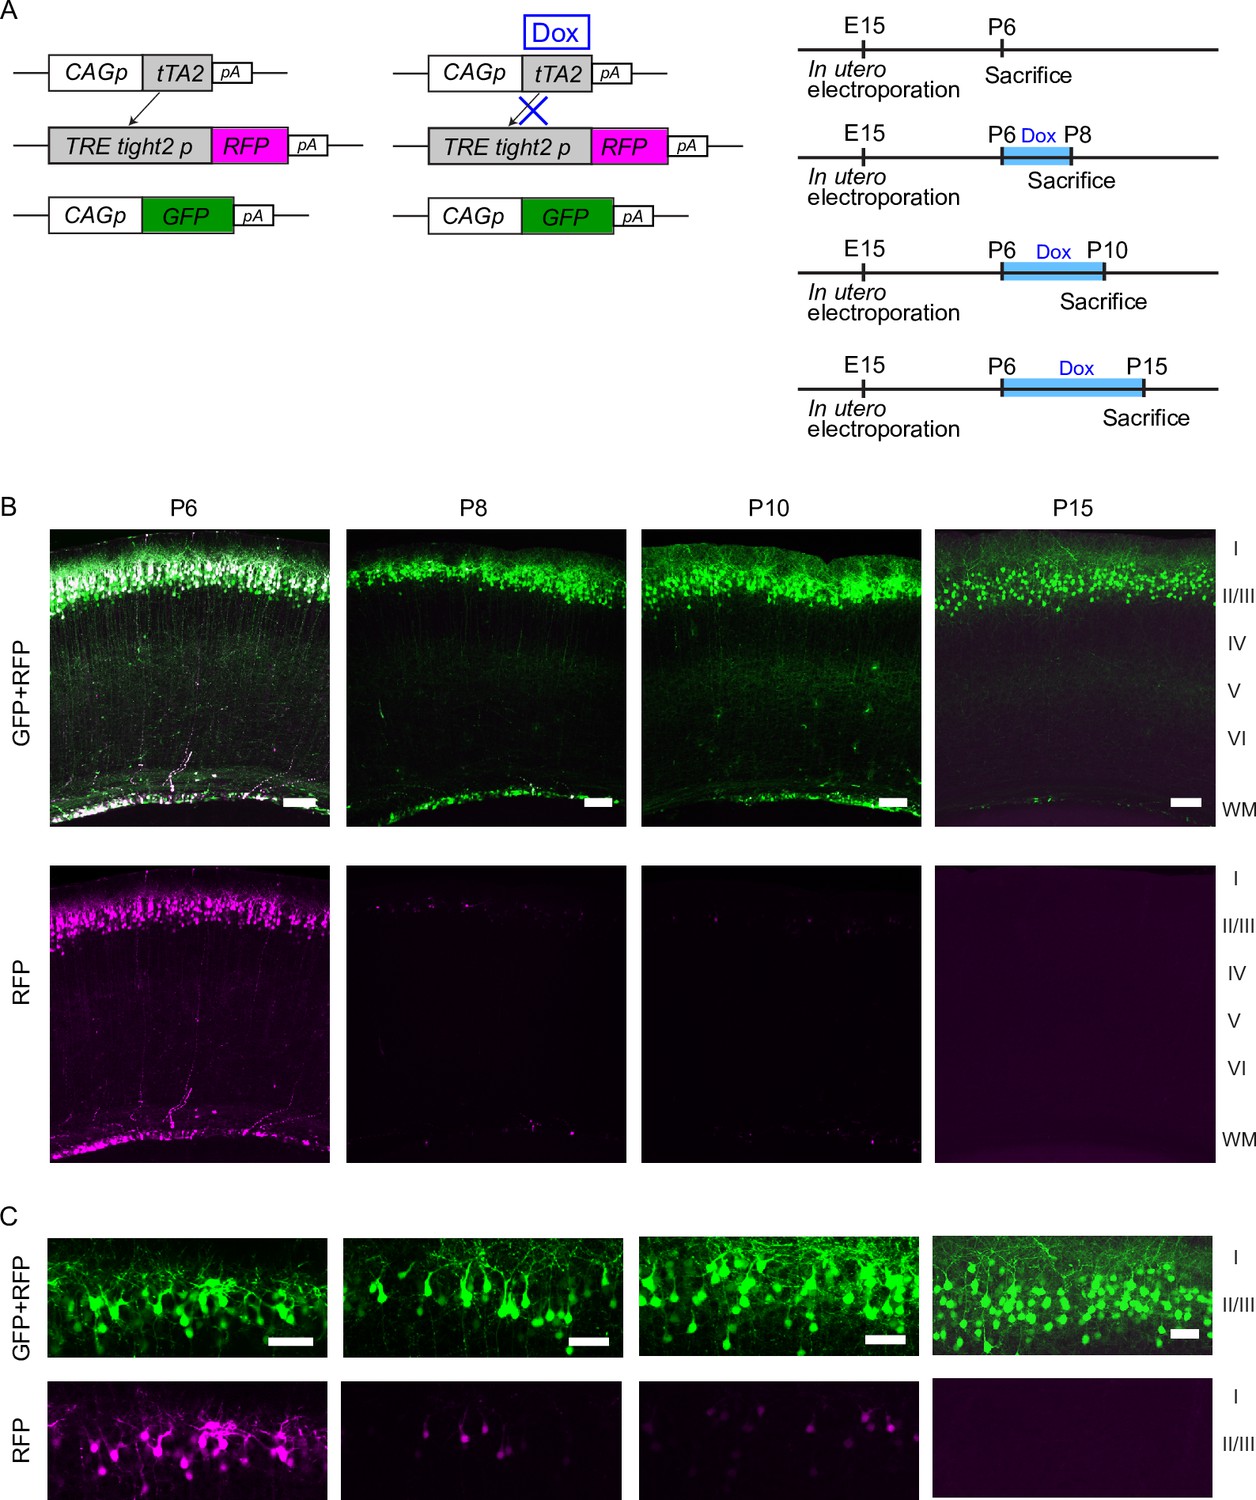
(A) pCAsal-EGFP, TRETight2 promoter (pTRE-Tight2)-TurboRFP, and CAG promoter (pCAG)-tTA2s were transfected, and doxycycline (Dox) was administered from P6. The blue bars indicate the period of Dox treatment. (B) Top panels show EGFP and TurboRFP signals. Bottom panels show TurboRFP signals. Note the rapid disappearance of TurboRFP signals after Dox administration. In (C), EGFP (top panels) and TurboRFP (bottom panels) signals in layer 2/3 are shown. Scale bars in (B), 100 μm. Scale bars in (C), 50 μm. P6, n=3 sections from three mice. P8, n=3 sections from three mice. P10, n=3 sections from three mice. P15, n=2 sections from two mice.
Figure 1—figure supplement 3
Validation of the Tet-off system with Kir2.1EGFP.
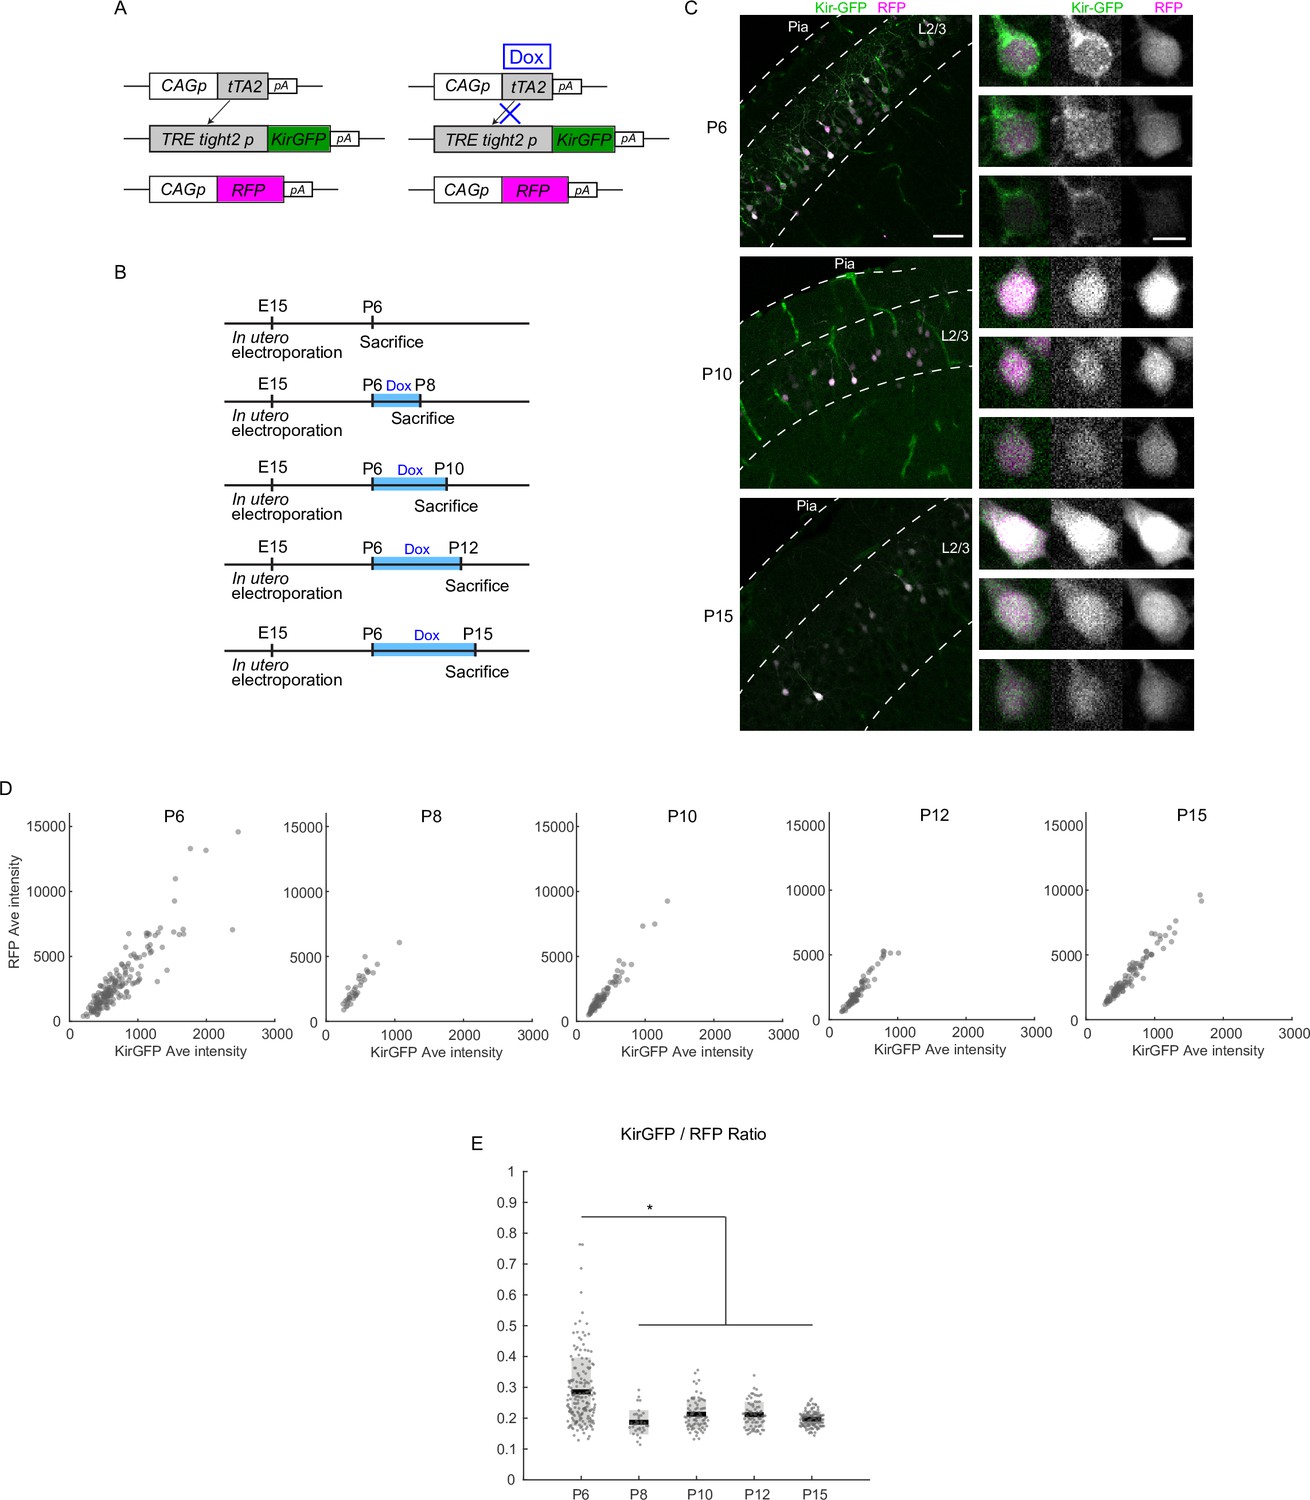
(A) CAG promoter (pCAG)-TurboRFP, TRETight2 promoter (pTRE-Tight2)-Kir2.1EGFP, and pCAG-tTA2s were transfected. (B) Doxycycline (Dox) was administered from P6. The blue bars indicate the period of Dox treatment. (C) Kir2.1EGFP (Kir-GFP) and TurboRFP (RFP) signals in P6, P10, and P15 cortical sections. Right panels show three representative neurons (in columns) with Kir-GFP and RFP signals (in rows) at each age. At P6 (before Dox treatment), the signals of Kir-GFP (stained with anti-GFP antibody) were primarily observed in the periphery of the soma and along dendrites, implying that Kir-GFP was transported to the cellular membrane. Note that RFP signals were localized in the central part of the cell body. At P10 and P15 (4 days and 9 days after Dox treatment), Kir-GFP signals were not preferentially observed in the periphery of the soma and along dendrites anymore. Low-level signals in the central part of the cell body may suggest low-level expression of Kir-GFP even after Dox treatment. Alternatively, these may reflect the contaminated RFP signals in the acquisition of the GFP channel. (D) Average signal intensity of Kir-GFP (x-axis) and RFP (y-axis) in each cell is displayed at P6, P8, P10, P12, and P15. (E) Each dot represents KirGFP/RFP ratio of a cell at each age. Note that KirGFP/RFP ratio decreases after Dox administration at P6. Scale bar in the left panel of (C), 50 μm; right panel, 10 μm. P6, n=10 sections from three mice. P8, n=7 sections from two mice. P10, n=10 sections from three mice. P12, n=10 sections from three mice. P15, n=10 sections from three mice.
-
Figure 1—figure supplement 3—source data 1
Source data for Figure 1—figure supplement 3D and E.
- https://cdn.elifesciences.org/articles/72435/elife-72435-fig1-figsupp3-data1-v1.xlsx
Figure 1—figure supplement 4
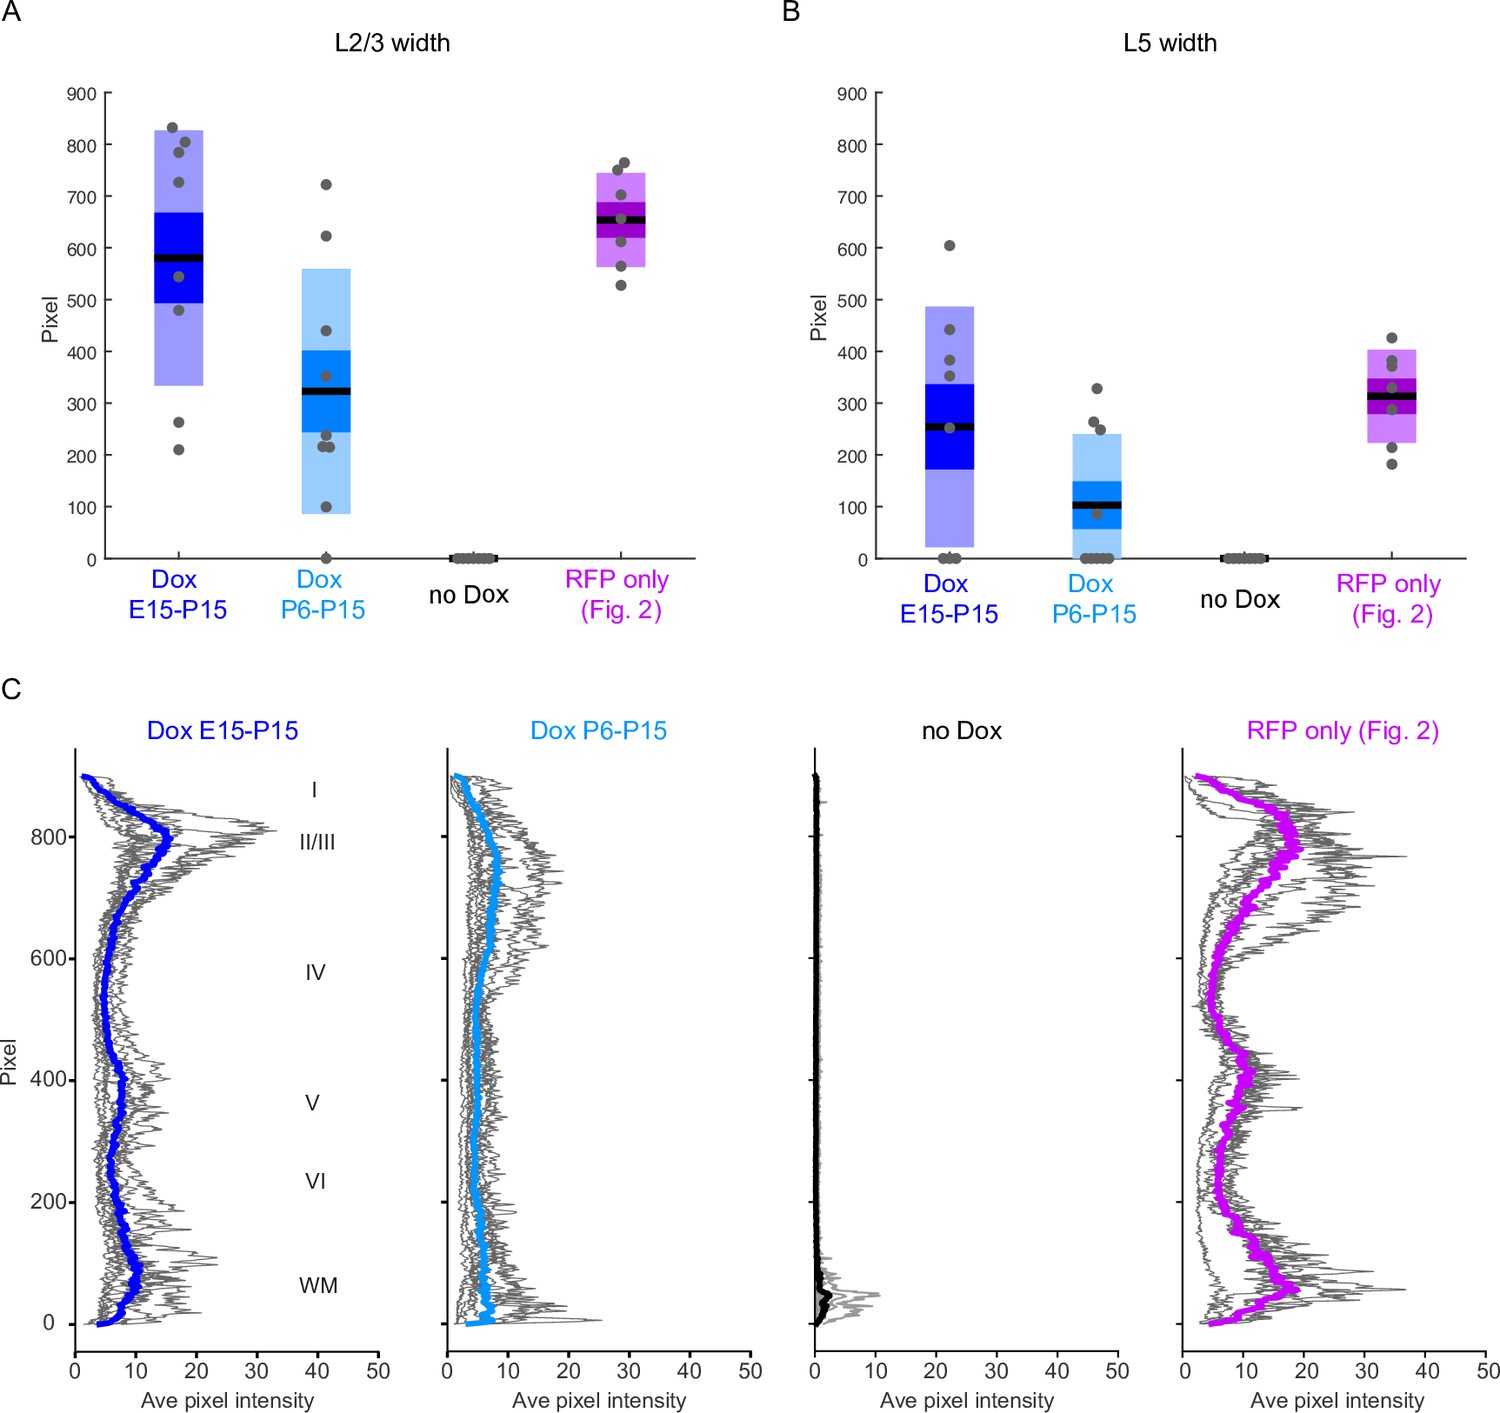
The width and laminar distribution of callosal axon projections.
(A, B) The width of callosal axon innervation zone in layers 2/3 (A) and 5 (B). The width of the zone along the mediolateral axis of the cortex was measured. Although callosal axon innervation zone was present in both layers 2/3 and 5 of doxycycline (Dox) P6-15 mice, the extent was not as much as in Dox E15-P15 mice, suggesting that some aspects of callosal projections might be partially recovered in Dox P6-15 mice. ‘Dox E15-P15’ group: n=8 sections from eight mice. ‘Dox P6-15’ group: n=9 sections from nine mice. ‘no Dox’ group: n=7 sections from seven mice. ‘RFP’ group: n=7 sections from seven mice. (C) Densitometric line scans of fluorescence intensity across all cortical layers. ‘Dox E15-P15’ group: n=8 sections from eight mice. ‘Dox P6-15’ group: n=9 sections from nine mice. ‘no Dox’ group: n=7 sections from seven mice. ‘RFP’ group: n=7 sections from seven mice.
-
Figure 1—figure supplement 4—source data 1
Source data for Figure 1—figure supplement 4.
- https://cdn.elifesciences.org/articles/72435/elife-72435-fig1-figsupp4-data1-v1.xlsx
Figure 2
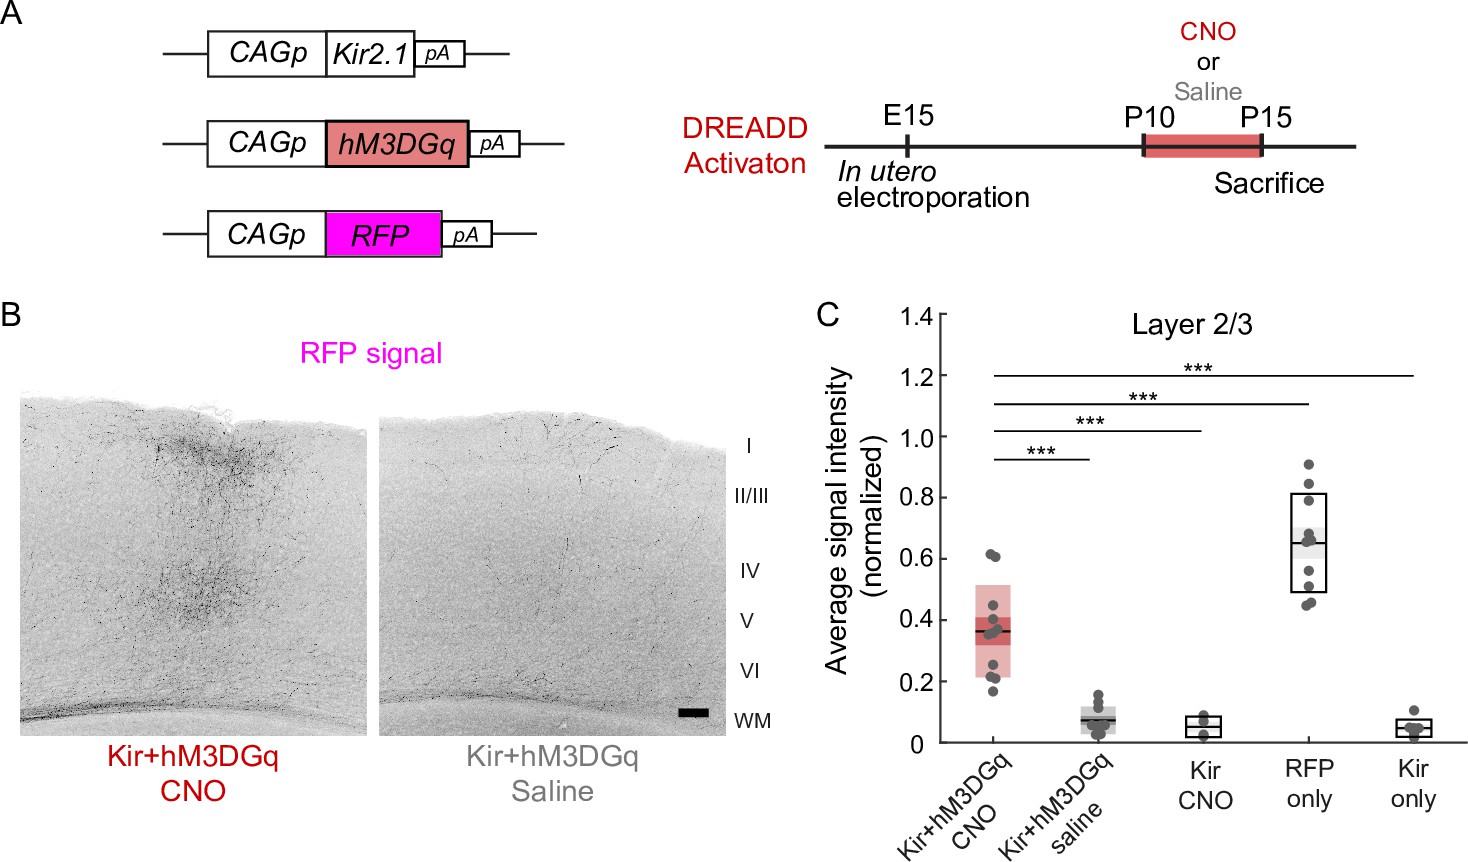
Effect of activity restoration on callosal axon projections using designer receptors exclusively activated by designer drugs (DREADD).
(A) Experimental design and timeline. Kir2.1 expression and hM3DGq expression plasmids were transfected at E15, clozapine-N-oxide (CNO) or saline was injected daily from P10 to P14, and brains were fixed at P15. (B) Fluorescently labeled callosal axon projections in the P15 cortex. Scale bar, 100 μm. (C) Average signal intensity of fluorescently labeled callosal axons in layers 1–3. ‘Kir + hM3 DGq with CNO injections’ group; n=11 sections from 11 mice. ‘Kir + hM3 DGq with saline injections’ group; n=10 sections from 10 mice. ‘Kir with CNO injections’ group: n=4 sections from four mice. ‘RFP‘ group (CAG promoter [pCAG]-TurboRFP was electroporated, no injection was performed): n=10 sections from 10 mice. ‘Kir’ group (pCAG-Kir2.1 was electroporated, no injection was performed): n=7 sections from seven mice. ***p<0.001 by Tukey–Kramer test.
-
Figure 2—source data 1
Source data for Figure 2.
- https://cdn.elifesciences.org/articles/72435/elife-72435-fig2-data1-v1.xlsx
Figure 3

A critical period for restoration of callosal axon projections.
(A) Experimental design and timeline. CAG promoter (pCAG)-tTA2s and TRETight2 promoter (pTRETight2)-Kir2.1 plasmids were transfected at E15, and doxycycline (Dox) was administered from P6 to P15, from P9 to P18, or from P12 to P21. (B) Fluorescently labeled callosal axon projections in the P15 cortex. Scale bar, 100 μm. (C) Average signal intensity of fluorescently labeled callosal axons in layers 1–3. ‘Dox P6-15’ group: n=10 sections from 10 mice. ‘Dox P9-P18’ group: n=9 sections from nine mice. ‘Dox P12-P21’ group: n=10 sections from 10 mice. ***p<0.001 by Tukey–Kramer test.
-
Figure 3—source data 1
Source data for Figure 3C.
- https://cdn.elifesciences.org/articles/72435/elife-72435-fig3-data1-v1.xlsx
Figure 4
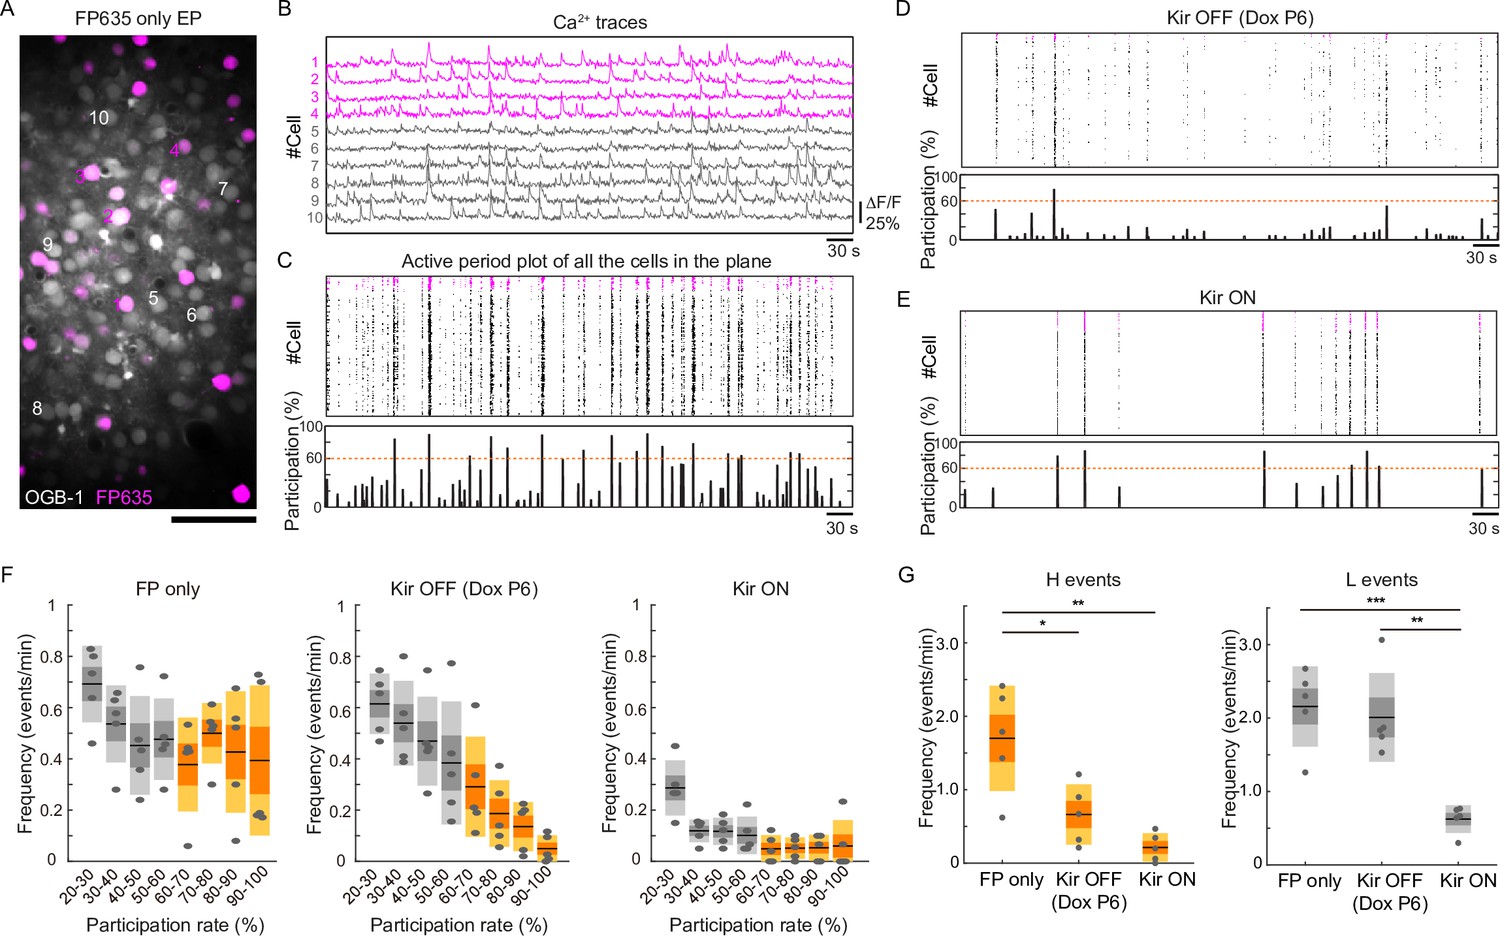
Partial restoration of synchronous activity revealed by in vivo two-photon Ca2+ imaging.
(A) A representative image of OBG1-loaded (gray) and FP635-expressing (magenta) neurons in the P13 mouse visual cortex obtained by two-photon microscopy. Scale bar: 50 μm. Numbers shown in the image correspond to the cell numbers shown in panel (B). (B) Ca2+ traces from representative FP635+ (#1–4) and FP635− (#5–10) neurons. Obtained from the same recording session as shown in the bottom panel. (C) Top: an active period plot of all identified FP635+ (magenta) and FP635− (black) neurons in the top image. Bottom: corresponding participation rate. Events with a participation rate above 60% were regarded as H events. (D) A representative active period plot and corresponding participation rate from a Tet-Kir2.1 with doxycycline (Dox) mouse. Because of Dox treatment from P6, Kir2.1 expression was suppressed from P6: Kir OFF. (E) A representative active period plot and corresponding participation rate from a Tet-Kir2.1 without Dox mouse. Because of the absence of Dox, Kir2.1 was expressed throughout development: Kir ON. (F) Histograms of synchronous activity frequency with different participation rates from FP635-electroporated (Left: FP only), Tet-Kir2.1 with Dox (Middle: Kir OFF Dox P6), and Tet-Kir2.1 without Dox (Right: Kir ON) mice. (G) Quantifications of H (>60%) and L (20–60%) events. FP only, five mice. Kir OFF (Dox P6), five mice. Kir ON, five mice. *p<0.05, **p<0.01, ***p<0.001 by Tukey–Kramer test.
-
Figure 4—source data 1
Source data for Figure 4F and G.
- https://cdn.elifesciences.org/articles/72435/elife-72435-fig4-data1-v1.xlsx
Additional files
Download links
A two-part list of links to download the article, or parts of the article, in various formats.
Downloads (link to download the article as PDF)
Open citations (links to open the citations from this article in various online reference manager services)
Cite this article (links to download the citations from this article in formats compatible with various reference manager tools)
Developmental stage-specific spontaneous activity contributes to callosal axon projections
eLife 11:e72435.
https://doi.org/10.7554/eLife.72435


