Mapping brain-wide excitatory projectome of primate prefrontal cortex at submicron resolution and comparison with diffusion tractography
- Institute of Neuroscience, State Key Laboratory of Neuroscience, Center for Excellence in Brain Science and Intelligence Technology, Chinese Academy of Sciences, China
- University of Chinese Academy of Sciences, China
- Institute of Science and Technology for Brain-inspired Intelligence, Fudan University, China
- School of Psychological and Cognitive Sciences; Beijing Key Laboratory of Behavior and Mental Health; IDG/McGovern Institute for Brain Research; Peking-Tsinghua Center for Life Sciences, Peking University, China
- College of Information Engineering, Zhejiang University of Technology, China
- Shenzhen Key Lab of Neuropsychiatric Modulation and Collaborative Innovation Center for Brain Science, Guangdong Provincial Key Laboratory of Brain Connectome and Behavior, CAS Key Laboratory of Brain Connectome and Manipulation, Brain Cognition and Brain Disease Institute (BCBDI), Shenzhen Institutes of Advanced Technology, Shenzhen-Hong Kong Institute of Brain Science-Shenzhen Fundamental Research Institutions, China
Figures
Figure 1 with 6 supplements
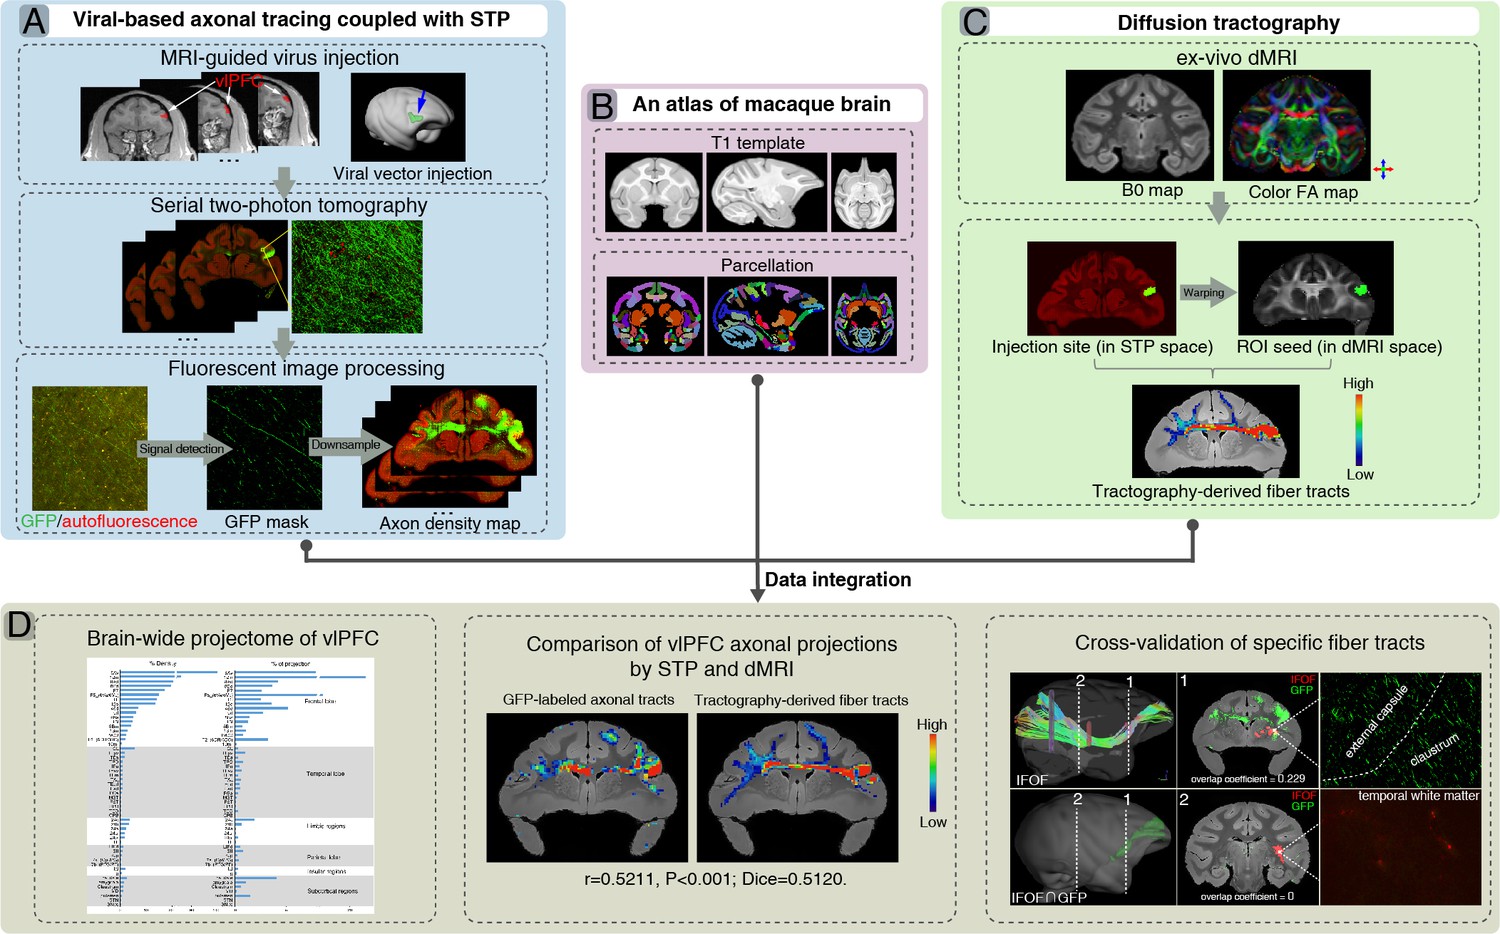
A flowchart diagram for brain-wide analyses of ventrolateral prefrontal cortex (vlPFC) projectome in macaques.
The pipeline integrates the serial two-photon (STP) data in the mesoscopic domain (A) with macroscopic dMRI data (C) in a common 3D space (B). (A) T1 images were used to guide stereotaxic injection of AAV vectors to vlPFC (upper panel). High-throughput fluorescent images of viral-based genetic axonal tracing were acquired by STP tomography throughout the brain, which enables a close-up view and quantitative analysis of any region of interest (middle panel). A supervised machine learning approach was used for segmentation of GFP-positive signal and removal of autofluorescence in STP data. The serial segmented GFP images were down-sampled to compute the total signal intensity for each 200 μm × 200 μm grid by summing the number of signal-positive pixels in that grid and to generate the axonal density map (bottom panel). (B) An MRI atlas of cynomolgus macaques was used to construct a common 3D space. (C) Ex-vivo dMRI of macaque brain was acquired using an 11.7T MRI scanner, illustrated as representative B0 (left) and direction-encoded color FA maps (right). Using the injection site identified from the STP data as seed regions, the target fiber tracts can be derived from diffusion tractography. (D) Integration of STP and dMRI data was implemented in a common 3D space, which allows quantitative analyses including whole-brain analysis of axonal projectome (left), comparison of vlPFC projectome by STP and dMRI (middle), and cross-validation of fiber tracking in both STP and dMRI (right).
Figure 1—figure supplement 1
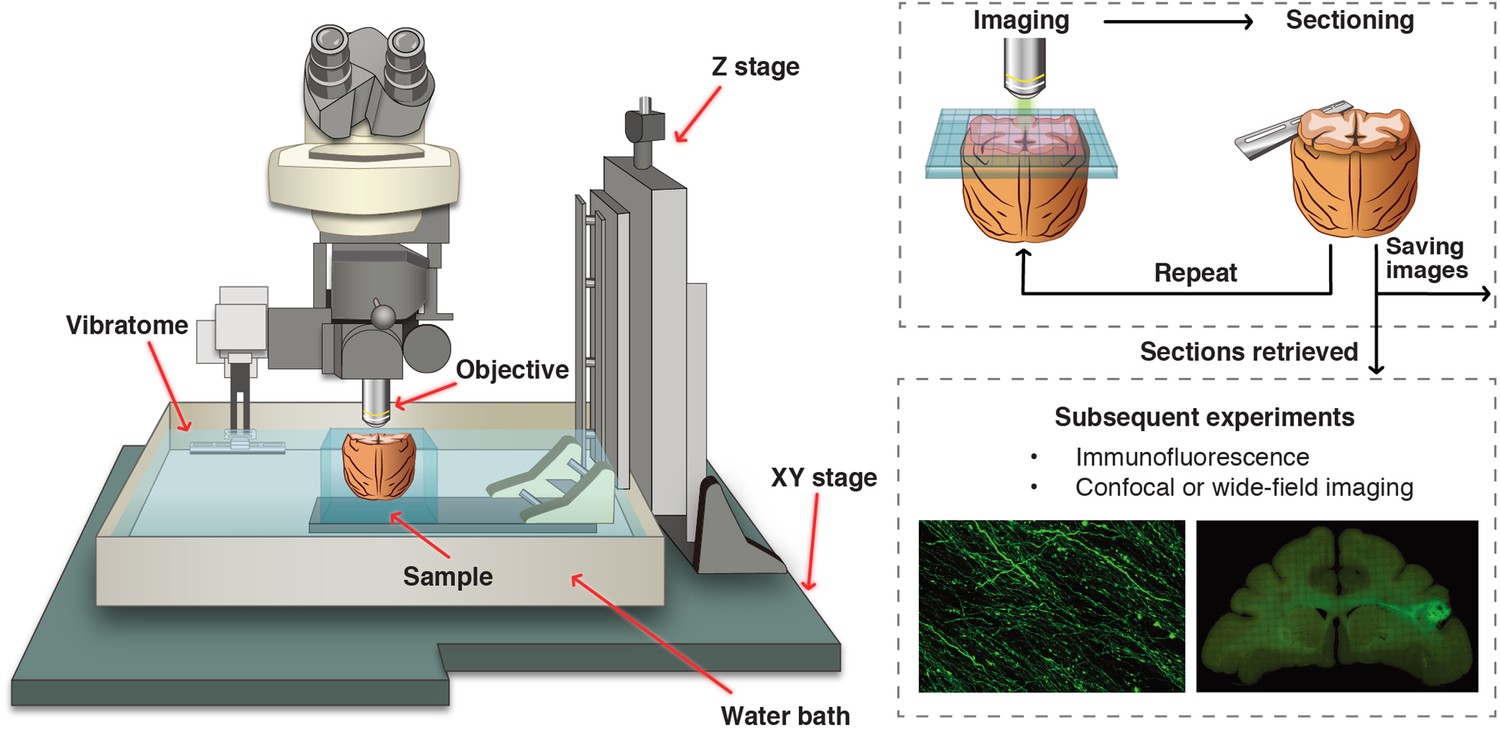
A customized setup of serial two-photon tomography for macaque brain.
The STP tomography was integrated with a two-photon microscope and a vibratome, both of which were computer controlled and fully automated. The traveling range of XYZ stage was customized to 50 by 60 by 70 mm to cover the entire macaque brain.
Figure 1—figure supplement 2
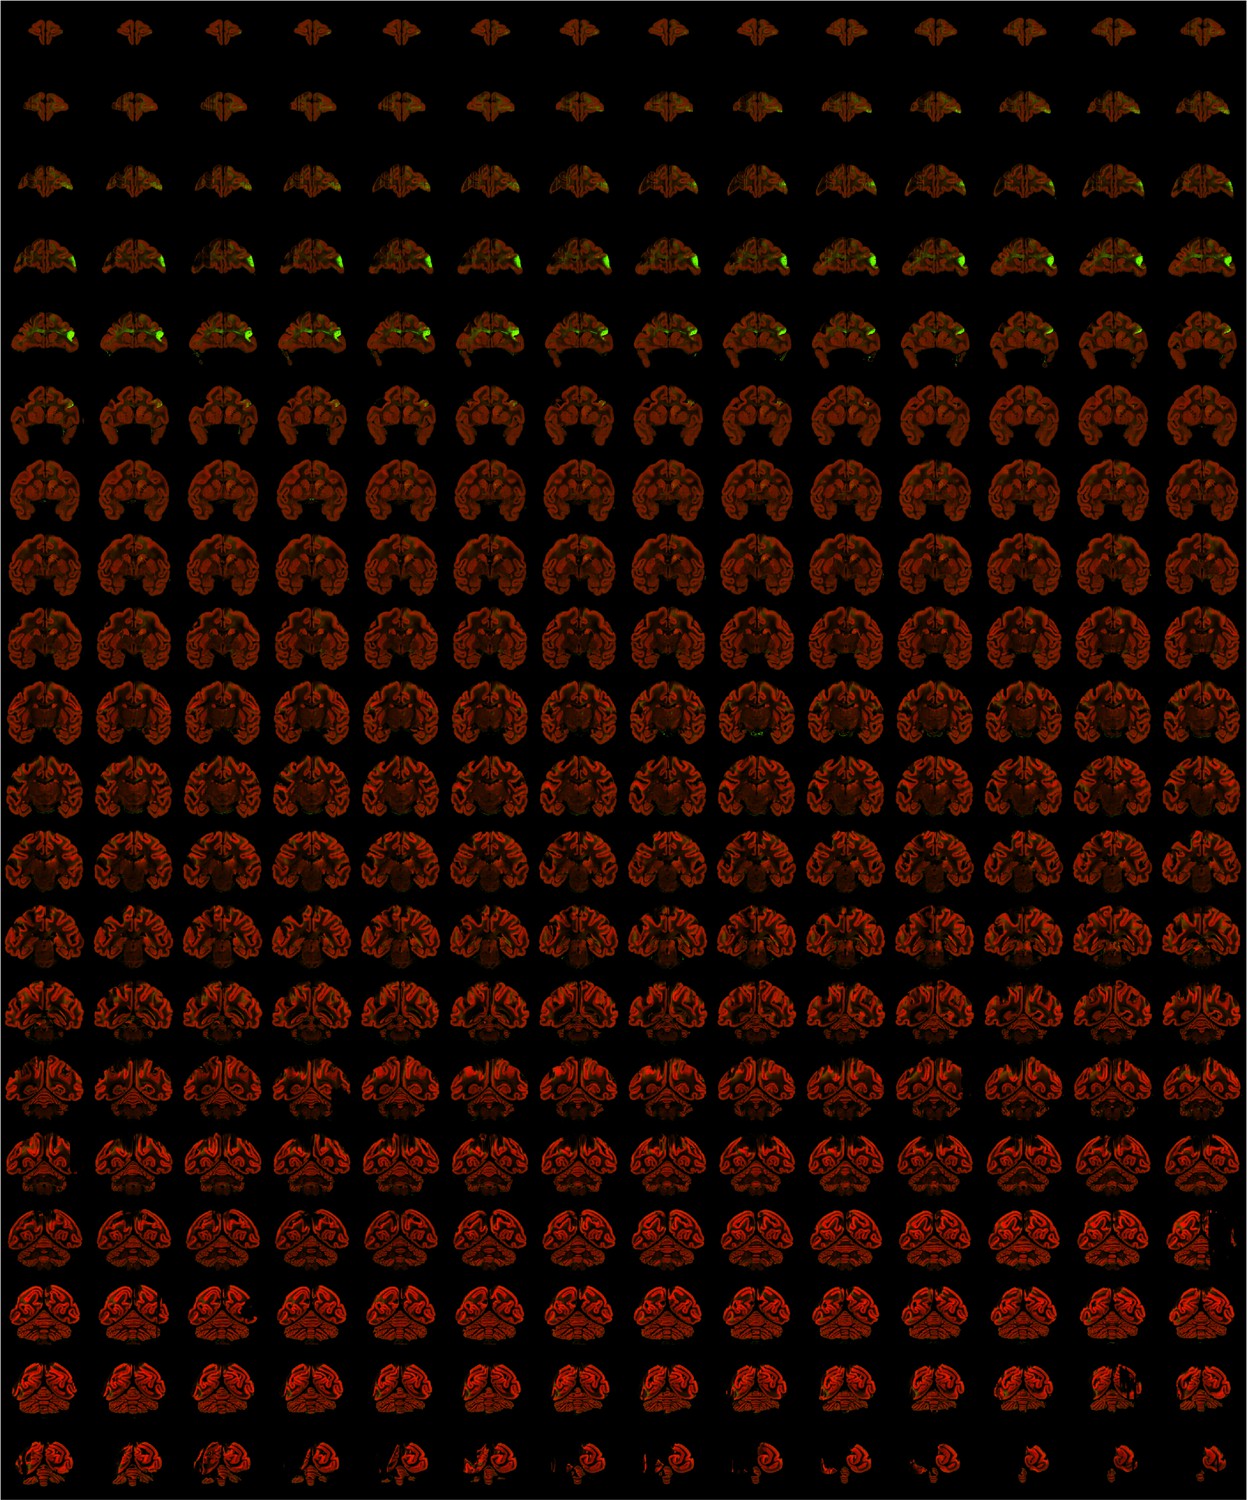
A typical STP tomography image set of a single macaque brain.
High-resolution (0.95 μm/pixel) images of serial sections of a single brain are shown as an example (injection into vlPFC). The stepping distance along the z-axis is 200 μm. The images acquired through the red channel are used as background. The injection site (vlPFC) and major projection targets can be readily observed in this ‘montage’ view.
Figure 1—figure supplement 3
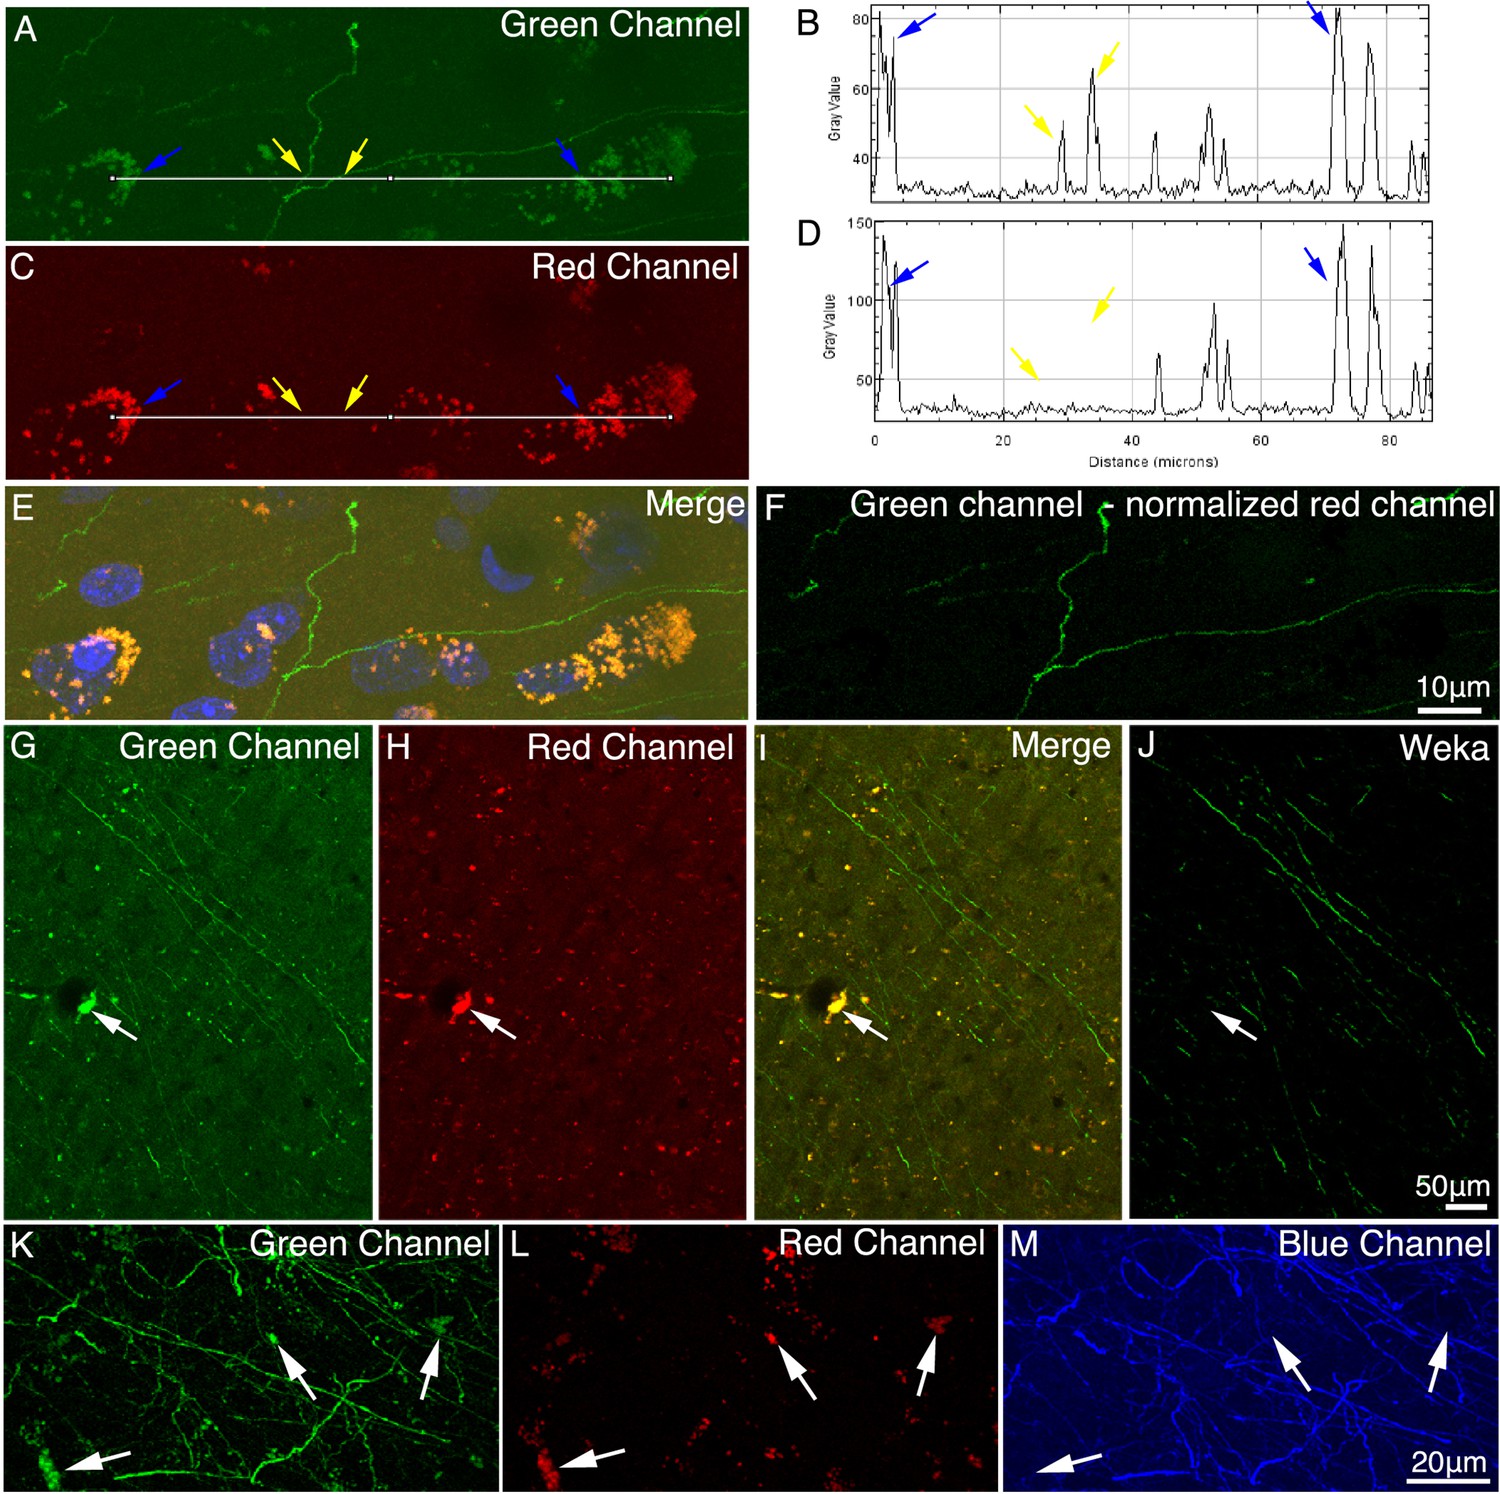
Autofluorescence in macaque brain.
(A–D) Properties of autofluorescence in macaque brain. Images in the right panel (B and D) show intensity profiles (measured using ImageJ on 8-bit TIF images) along the white line in the left panel (A and C). Yellow arrows indicate GFP signal, and blue arrows indicate background autofluorescence. Due to the broad emission spectrum of autofluorescence (E), the autofluorescence was reduced by subtracting the normalized autofluorescence signal in the red channel from the green channel (F). (G–J) A supervised machine learning approach was applied for removing autofluorescence. The classifier was trained to distinguish the GFP signal from background, and the segmented image (J) contained only GFP signal. White arrows indicate the autofluorescence puncta in images G–I. (K–M) The brain slice was stained with an anti-GFP antibody and Alexa Fluor 405 conjugated secondary antibody to convert the GFP signal from green channel to blue channel. Unlike the green (K) and red (L) channels, the converted blue channel (M) did not contain high intensity autofluorescence puncta.
Figure 1—figure supplement 4

Difference between axonal varicosities and dot-looking background.
STP images (A–D) and high-resolution confocal images (E–H) were acquired in the green channel and the red channel. Synaptic terminals (indicated by white arrows) can be specifically excited in green channel, while dot-looking background lipofuscin (indicated by yellow arrows) can be visualized both in green channel and red channel. (C and G) No colocalization was found between axonal varicosities and dot-looking background. Axonal varicosities were easily distinguished from dot-looking background in the merged image. (D and H) The dot-looking autofluorescence rather than the axonal varicosities was reduced through a machine-learning algorithm.
Figure 1—figure supplement 5
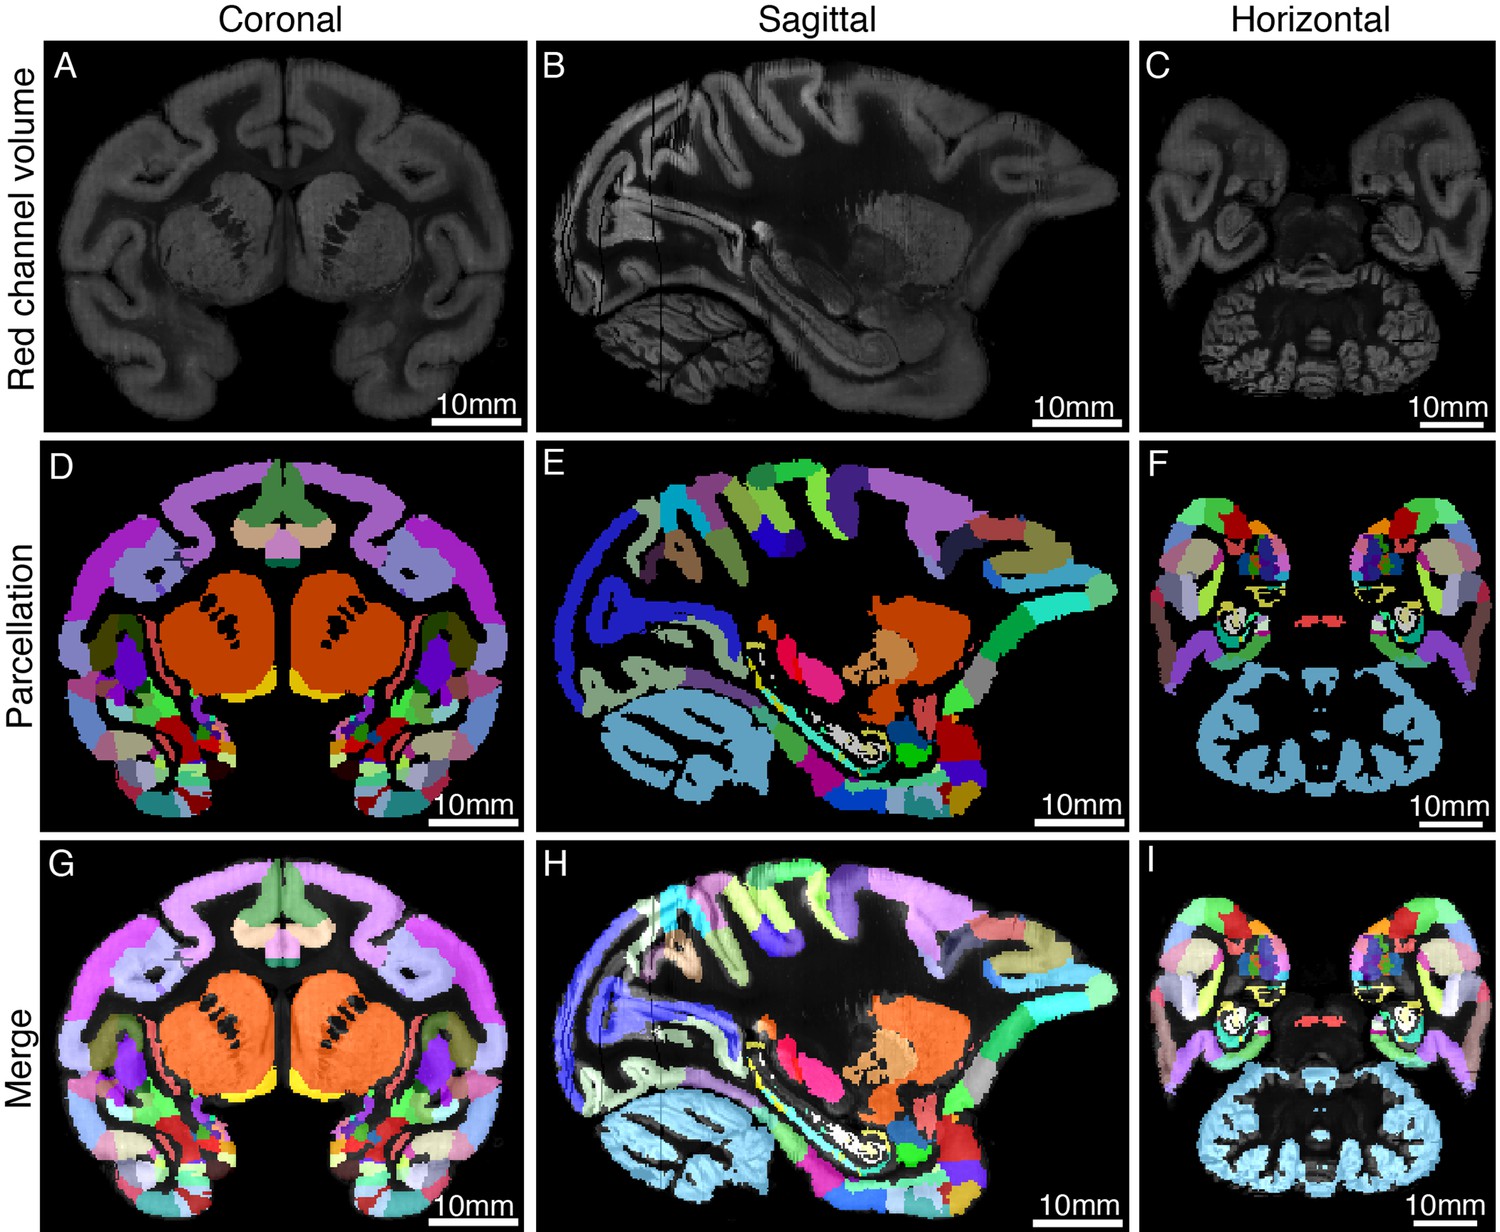
Co-registration of STP images to the MRI-based template of macaque brain.
The STP tomography volume of the monkey brain template was registered in a common 3D space. The upper panel shows the coronal (A), sagittal (B), and horizontal (C) images of the warped red channel of STP tomography. (D–F) The parcellation of Saleem and Logothetis atlas was displayed on three planes. (G–I) The fluorescence images of STP data were merged with the MRI atlas of macaque brain.
Figure 1—figure supplement 6
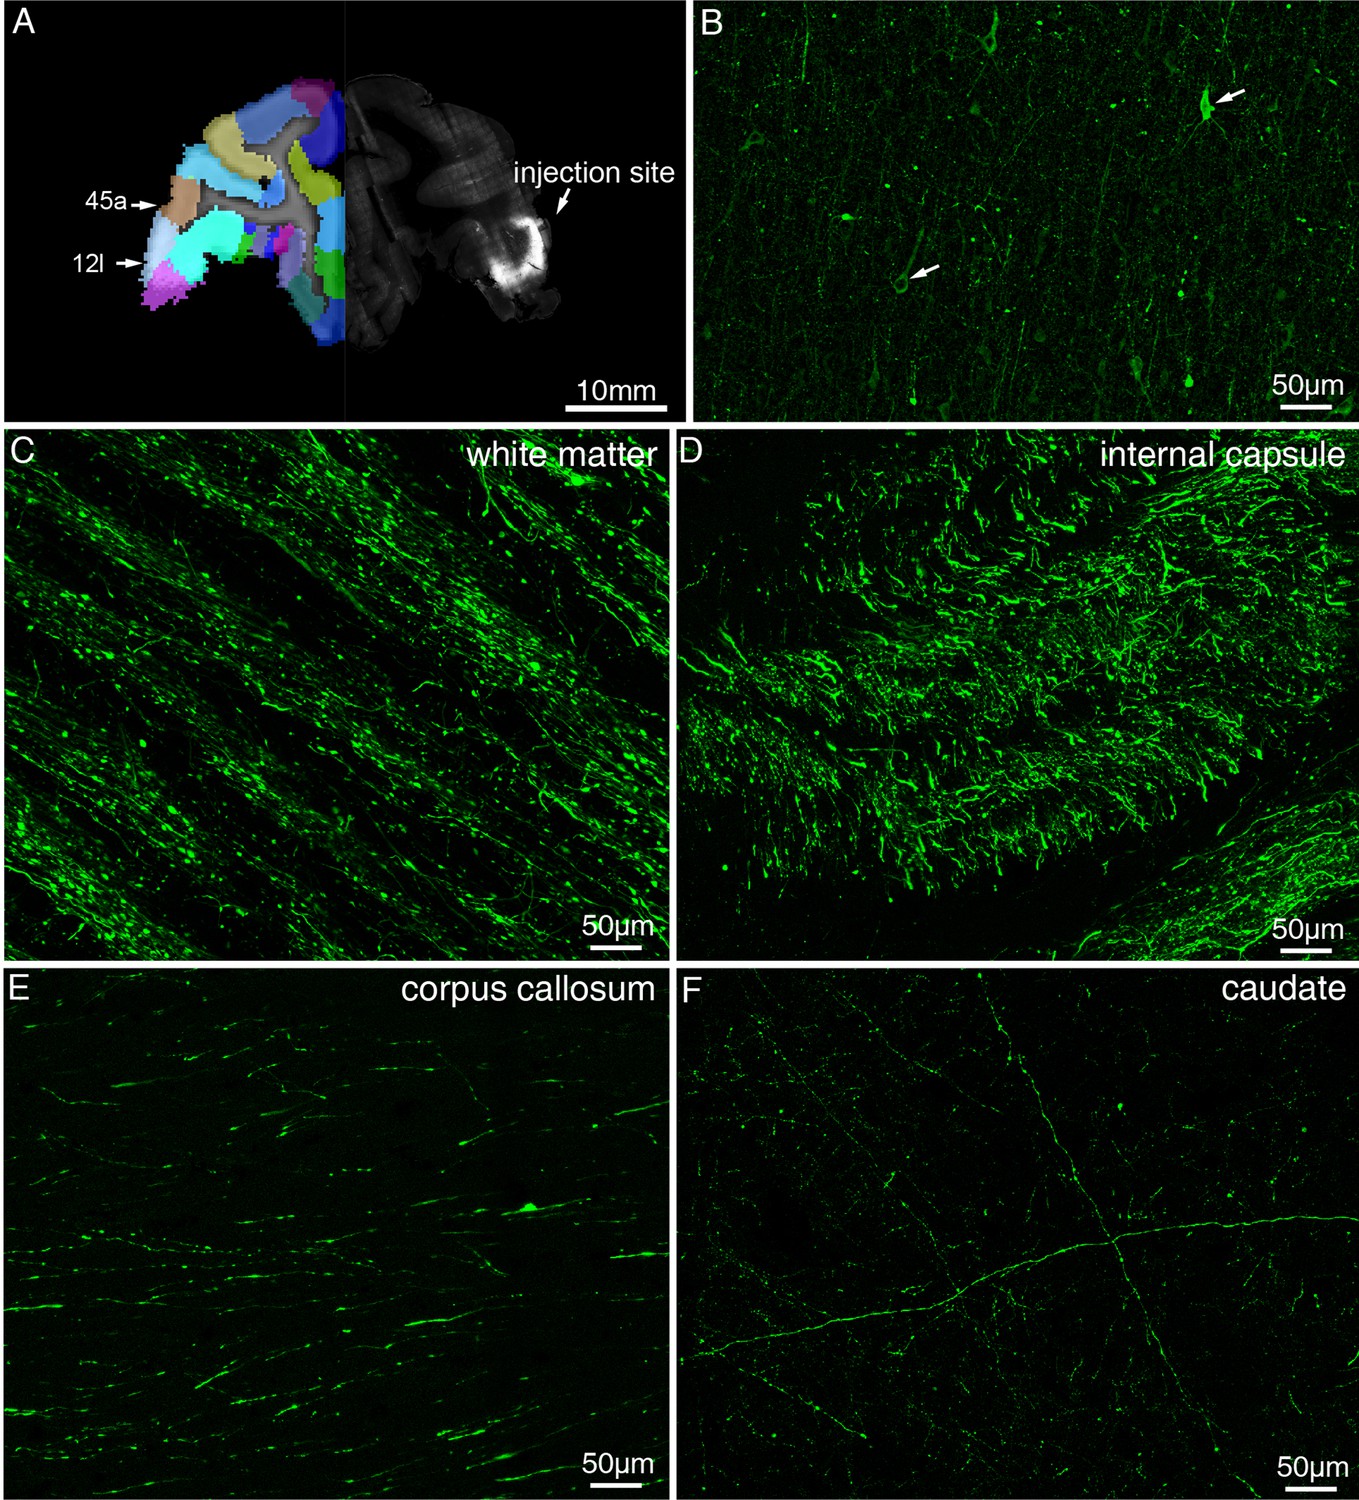
Representative fluorescent images showing injection site and major tracts of sample #7.
(A) STP image of the injection site in vlPFC are shown overlaid with the monkey brain template (left hand side), mainly spanning areas 12 l and 45 a. (B) Confocal image of the AAV infected neurons (indicated by white arrows). (C–F) Representative confocal images of major tracts originating from vlPFC.
Figure 2 with 7 supplements

Determination of viral vectors for long-range anterograde tracing in macaques.
(A) GFP-labeled neurons were found in the premotor cortex ~5 days after injection of VSV-△G encoding Tau-GFP. (B) A magnified view illustrating the morphology of GFP-labeled neurons in the area outlined with a white box in (A). (C) Lentivirus construct was injected into the macaque thalamus and examined for transgene expression after ~9 months. (D) High power views of the dotted rectangle in panel C. (E) GFP-labeled neurons and axons were observed in the premotor cortex ~45 days after injection of AAV2/9 encoding Tau-GFP. Two dashed line boxes enclose the regions of interest: frontal white matter and ALIC, whose GFP signal are magnified in (F) and (G), respectively.
Figure 2—figure supplement 1
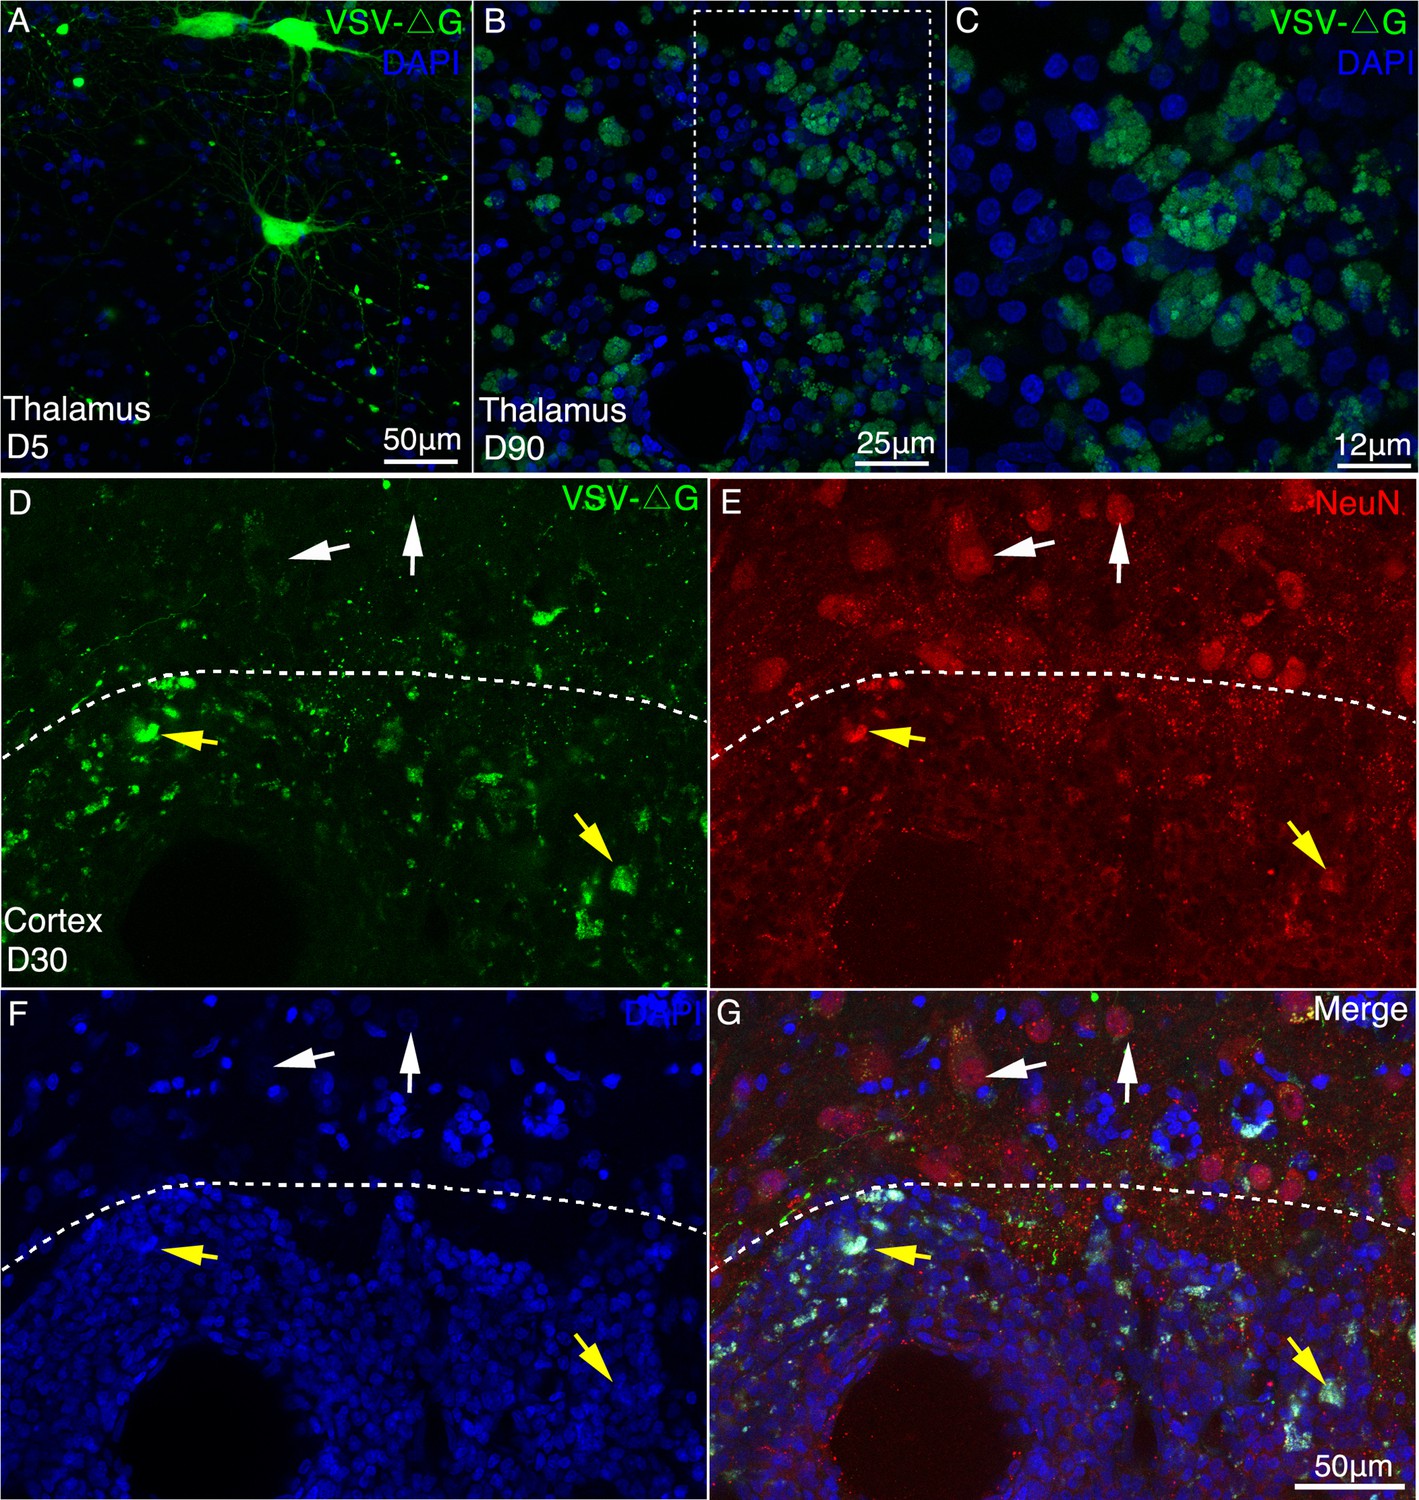
Long-term expression of VSV-△G induced neurotoxicity in macaque brain.
(A–C) Compared with the short-term expression (A, 5 days), severe morphological abnormalities such as neurites loss and membrane blebbing (C), were induced by VSV (△G) after long-term expression (90 days). (D–G) 30 days after injection of VSV, immunofluorescent staining was performed with NeuN antibody in the injection site (below the dotted line) and noninjection site (above the dotted line). The noninfected neurons were found to be GFP negative and neuronal-specific nuclear protein (NeuN) positive by immunofluorescent examination. In the injection site, VSV-infected neurons with GFP and NeuN positive exhibited apparent morphological abnormalities.
Figure 2—figure supplement 2
Expression of GFP using VSV-△G injected into the MD thalamus of macaque brain.
(A) GFP-labeled neurons were found in the MD thalamus ~5 days after injection of VSV-△G encoding Tau-GFP. (B) A magnified view illustrating the morphology of GFP-labeled neurons in the area outlined with a white box in (A). (C) Higher magnification view of GFP-positive axons.
Figure 2—figure supplement 3
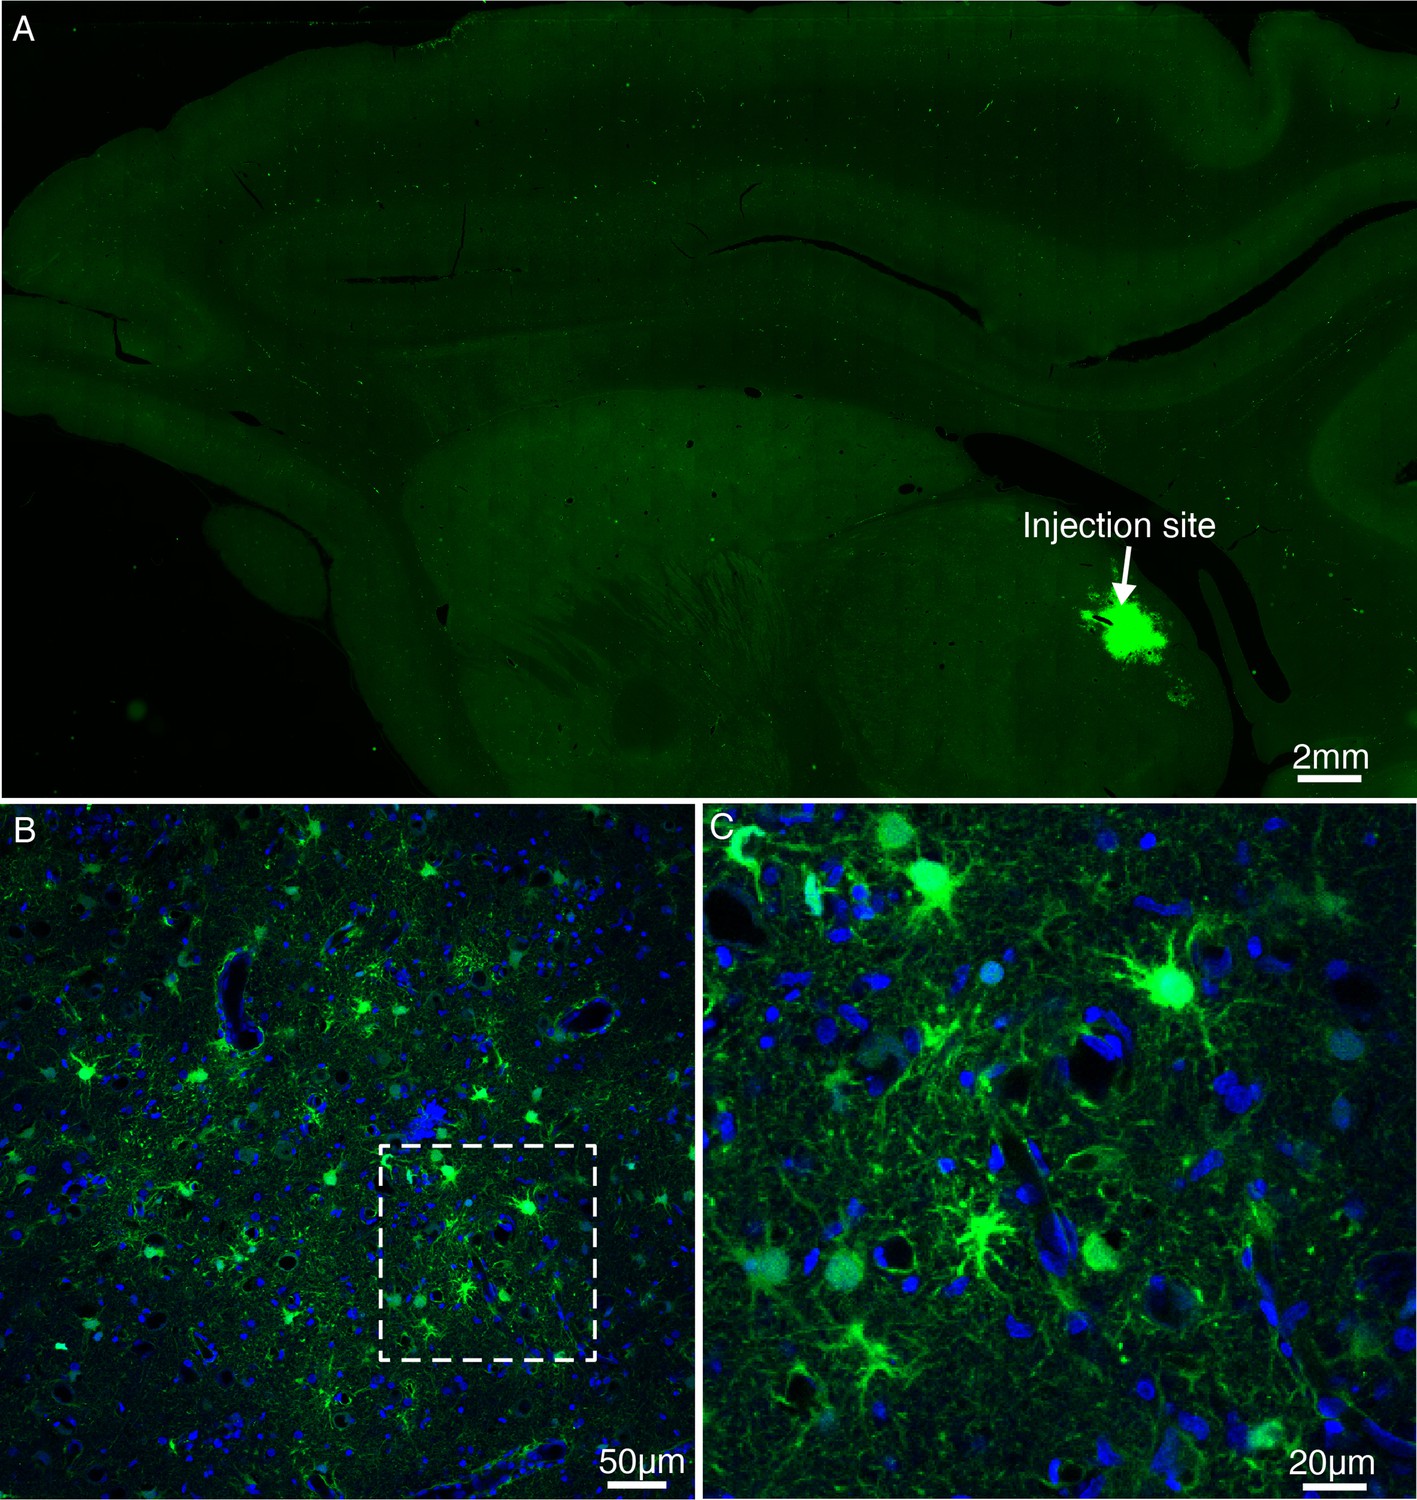
Expression of GFP using lentivirus injected into the MD thalamus of macaque brain.
(A) Lentivirus construct was injected into the macaque thalamus and examined for transgene expression after ~9 months. (B) Magnified view of panel A. (C) High power view of the dotted rectangle in panel B. Note the presence of GFP-positive cells.
Figure 2—figure supplement 4

Expression of GFP using AAV2/9 injected into the MD thalamus of macaque brain.
(A) GFP-labeled axons were observed in the subcortical regions ~ 45 days after injection of AAV2/9 encoding Tau-GFP in MD thalamus. The inset shows the injection site in MD thalamus. Two dashed line boxes enclose the region of ALIC, whose GFP signal are magnified in (B) and (C). (D) Higher magnification view of GFP-positive axons.
Figure 2—figure supplement 5
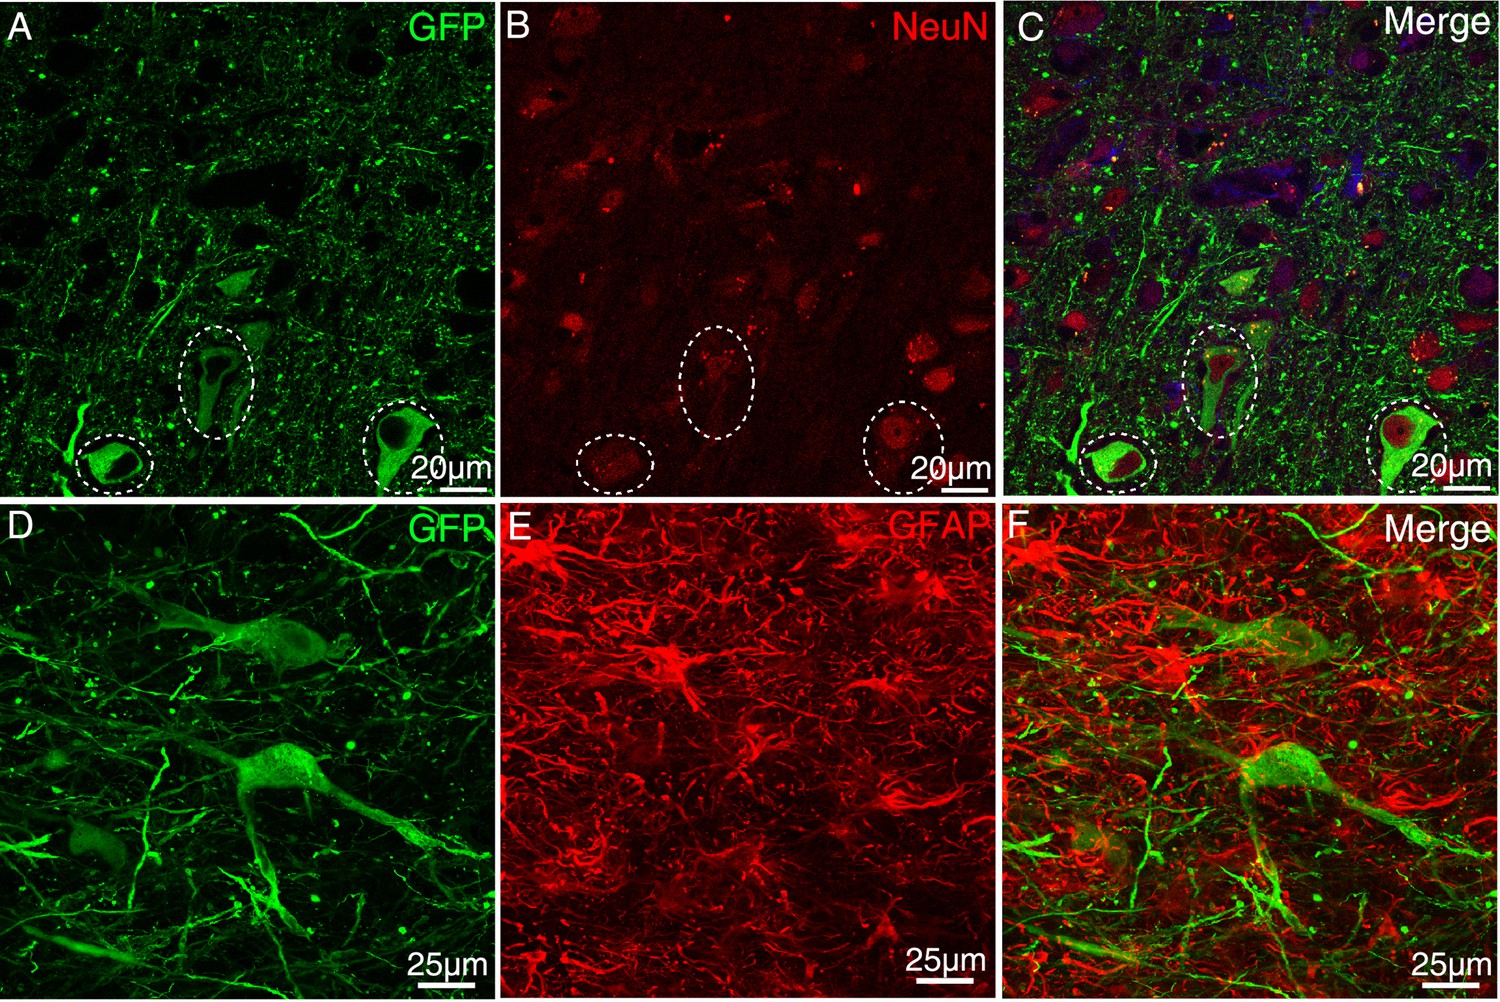
AAV-infected cells were stained for NeuN and GFAP antibodies.
After injection of AAV2/9, immunofluorescent staining was performed with NeuN (A–C) and GFAP (D–F) antibodies in the injection site. We found GFP-positive cells positive for the neuronal specific marker NeuN but negative for astrocyte specific marker GFAP.
Figure 2—figure supplement 6
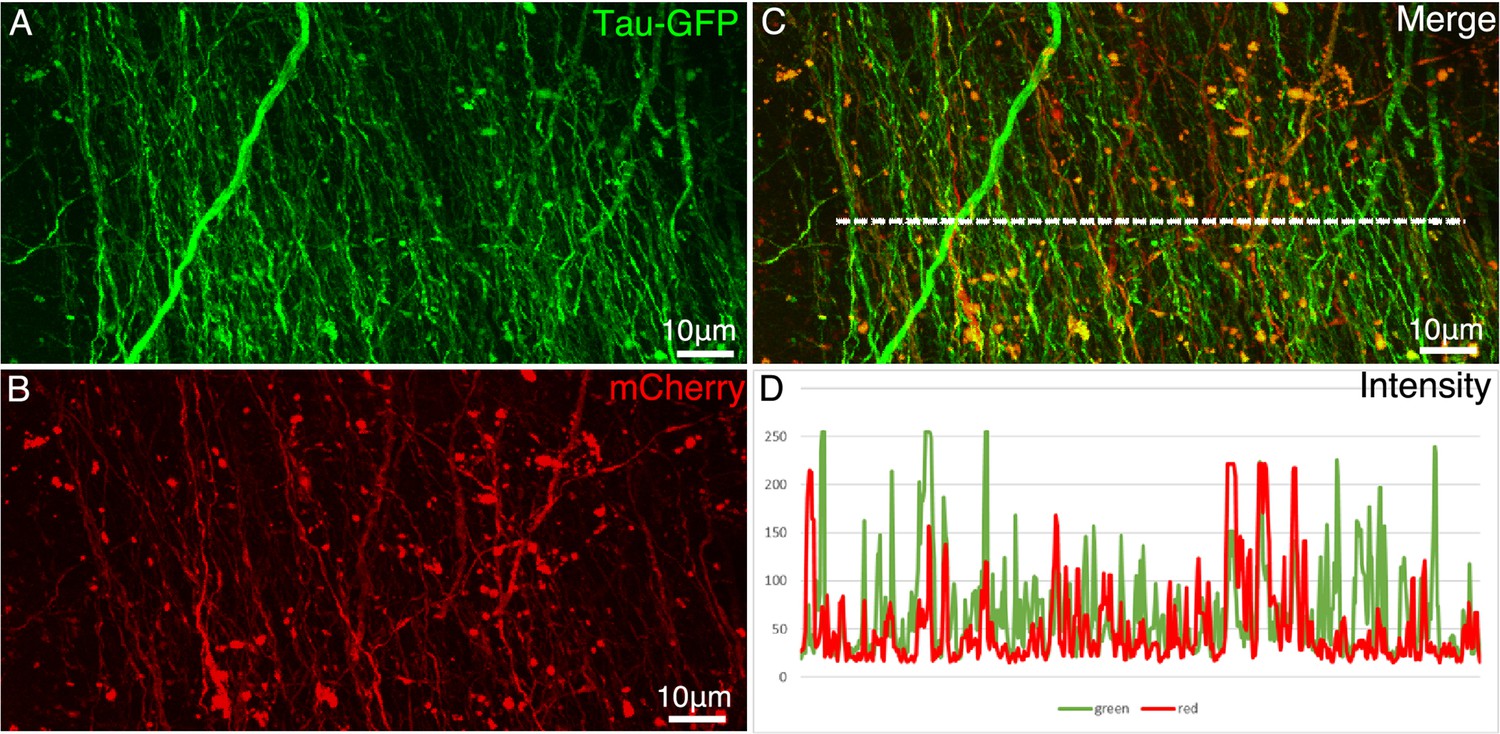
Comparison of two AAV constructs.
AAV2/9 encoding Tau-GFP and AAV2/9 encoding mCherry were co-injected in the premotor cortex. Figures (A and B) show the axon fibers labeled by Tau-GFP and mCherry, respectively. (C) Colocalization of mCherry and GFP in the axonal fibers. (D) The intensity profiles (measured using ImageJ on 8-bit TIF images) along the dashed line (in C) in red and green channels. After normalization, a direct comparison indicates that the intensity of Tau-GFP was stronger than that of mCherry.
Figure 2—figure supplement 7
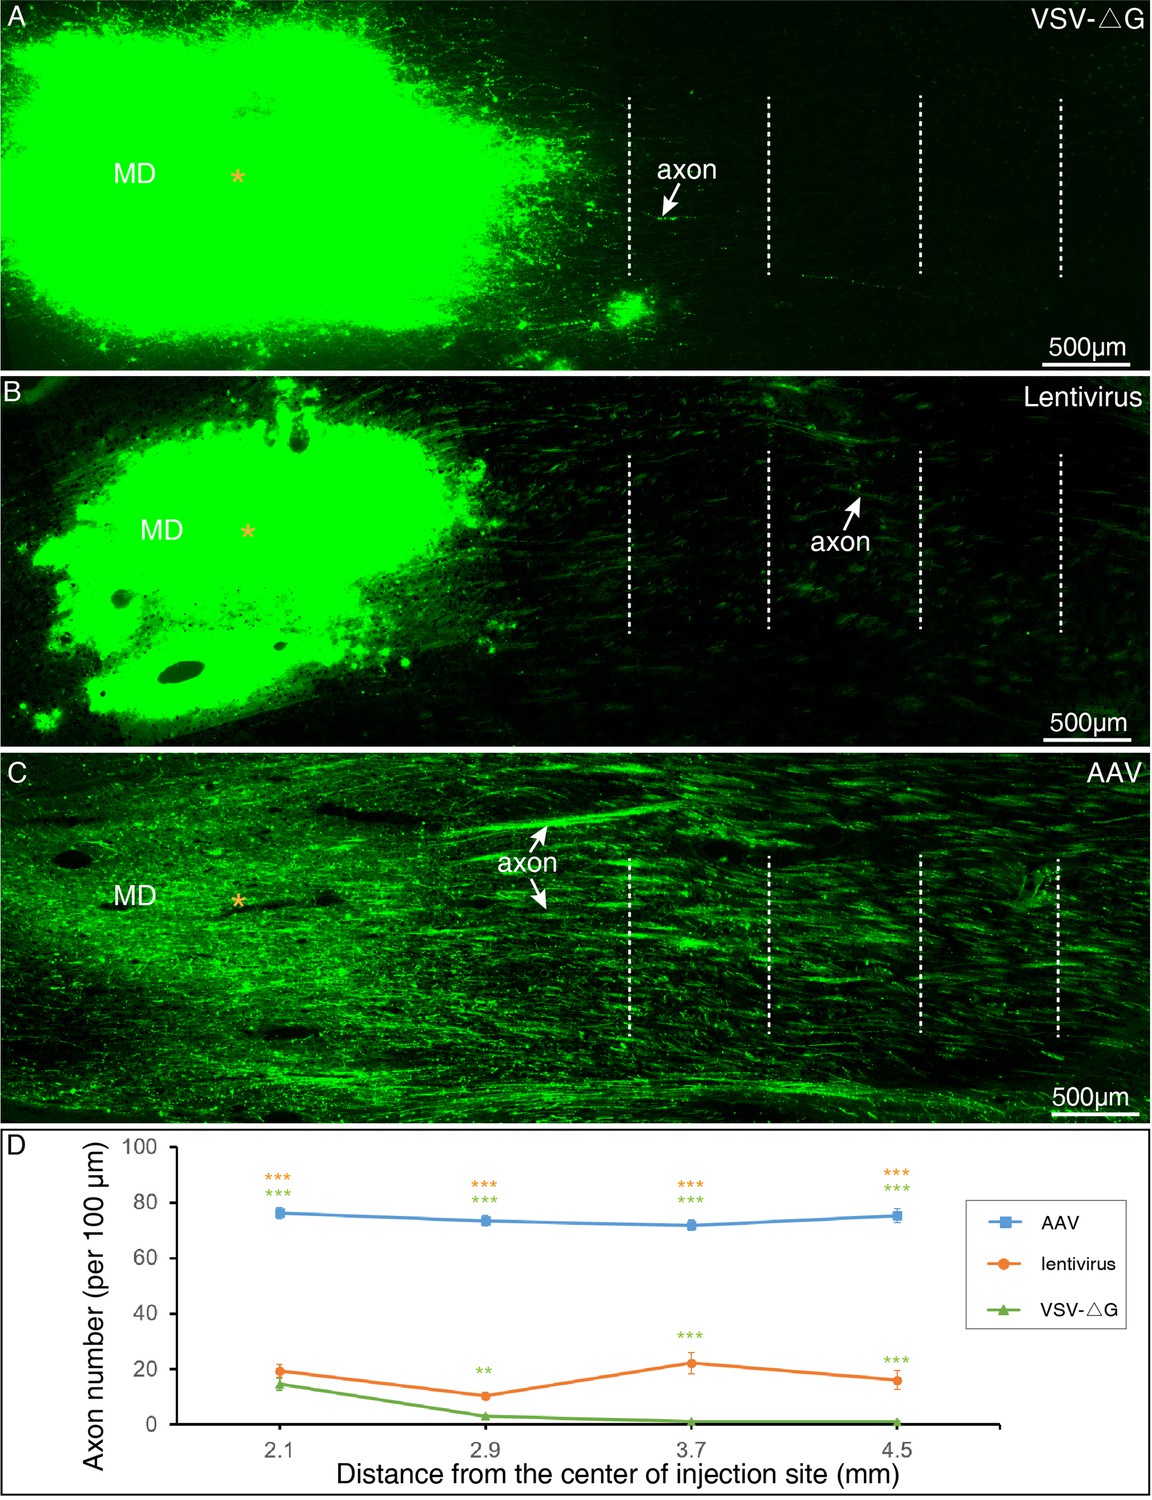
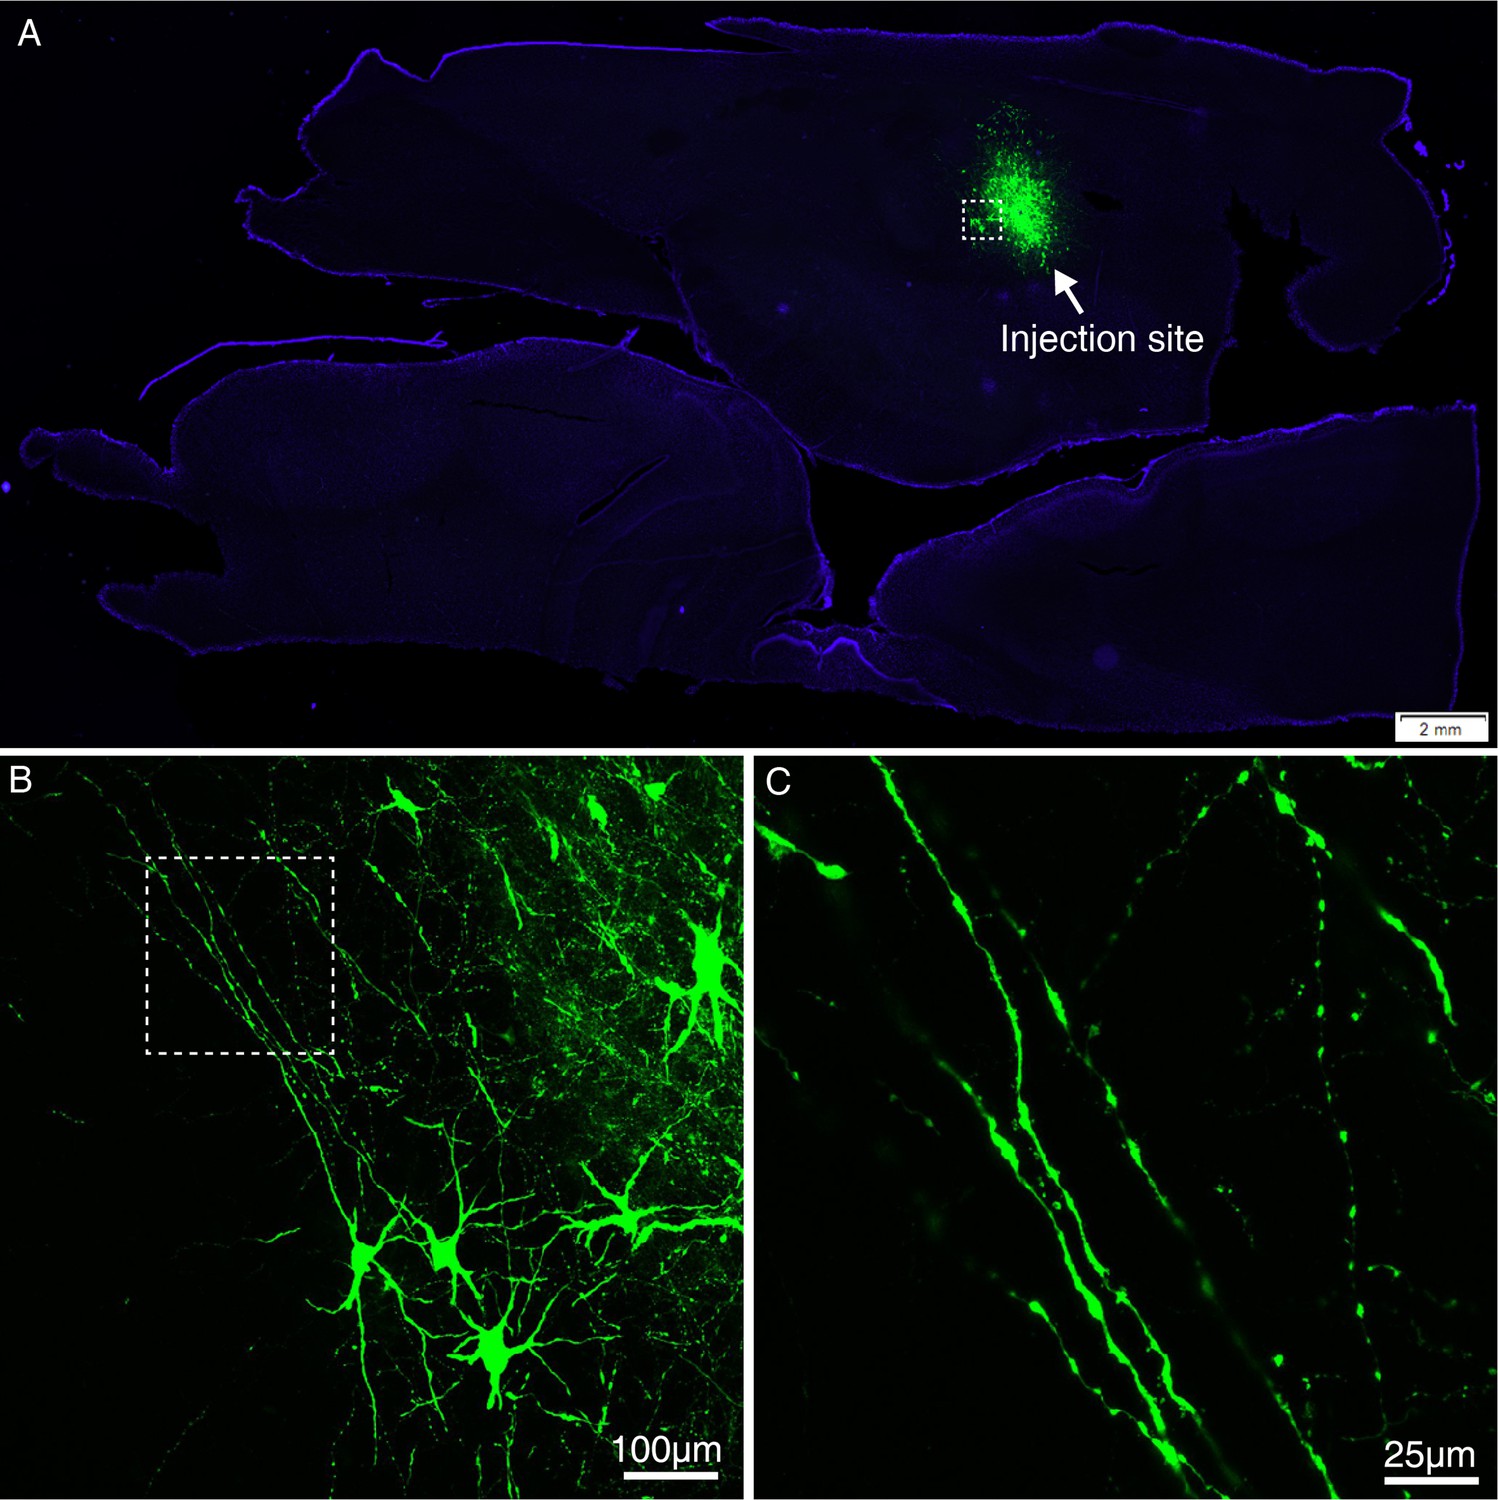
Long-range axonal tracing outcomes using AAV2/9, lentivirus,` and VSV-△G.
(A) VSV-△G rarely labeled long-range axonal fibers issued from MD thalamus. (B) Only sparse axon fibers projecting from MD thalamus were labeled with using Lentivirus. (C) Robust projecting fibers were detected distant from the MD thalamus with using AAV2/9. (D) Quantitative comparisons among three viral vectors. The number of GFP-labeled axons was counted at each dotted line in A–C, and subject to One-way ANOVA followed by Bonferroni Correction. **P < 0.01; ***P < 0.001; error bars represent SEM.
Figure 3 with 1 supplement
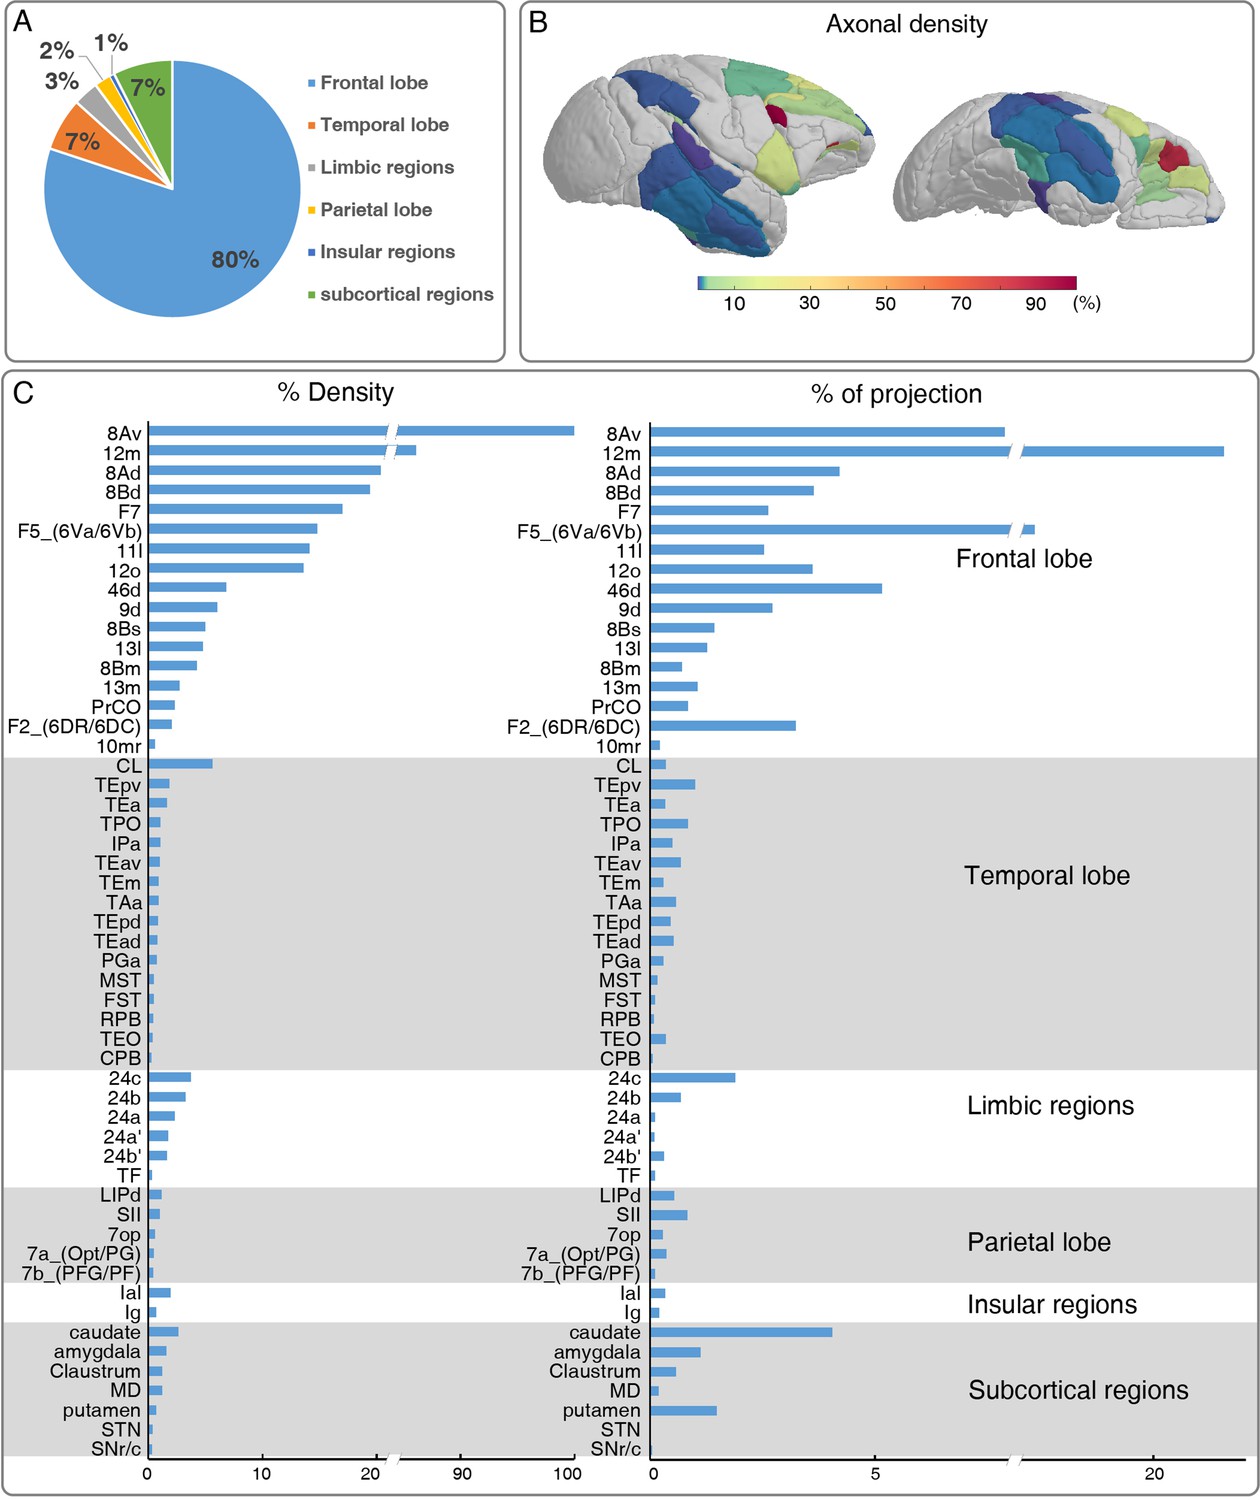
Brain-wide distribution of GFP-labeled excitatory projectome of ventrolateral prefrontal cortex (vlPFC).
(A) A pie chart shows the brain-wide distribution of vlPFC axonal projectome. (B) The normalized percentage distribution of axonal density was rendered onto a 3D brain surface. (C) The histogram plots show the vlPFC projections to other regions where the connectivity strength was quantified by the density of GFP-positive axons and proportion of total projection. We calculated the innervation density, given in percent of strongest projection.
-
Figure 3—source data 1
Entire dataset for the brain-wide distribution of vlPFC axonal projectome used in Figure 3.
- https://cdn.elifesciences.org/articles/72534/elife-72534-fig3-data1-v1.xlsx
Figure 3—figure supplement 1
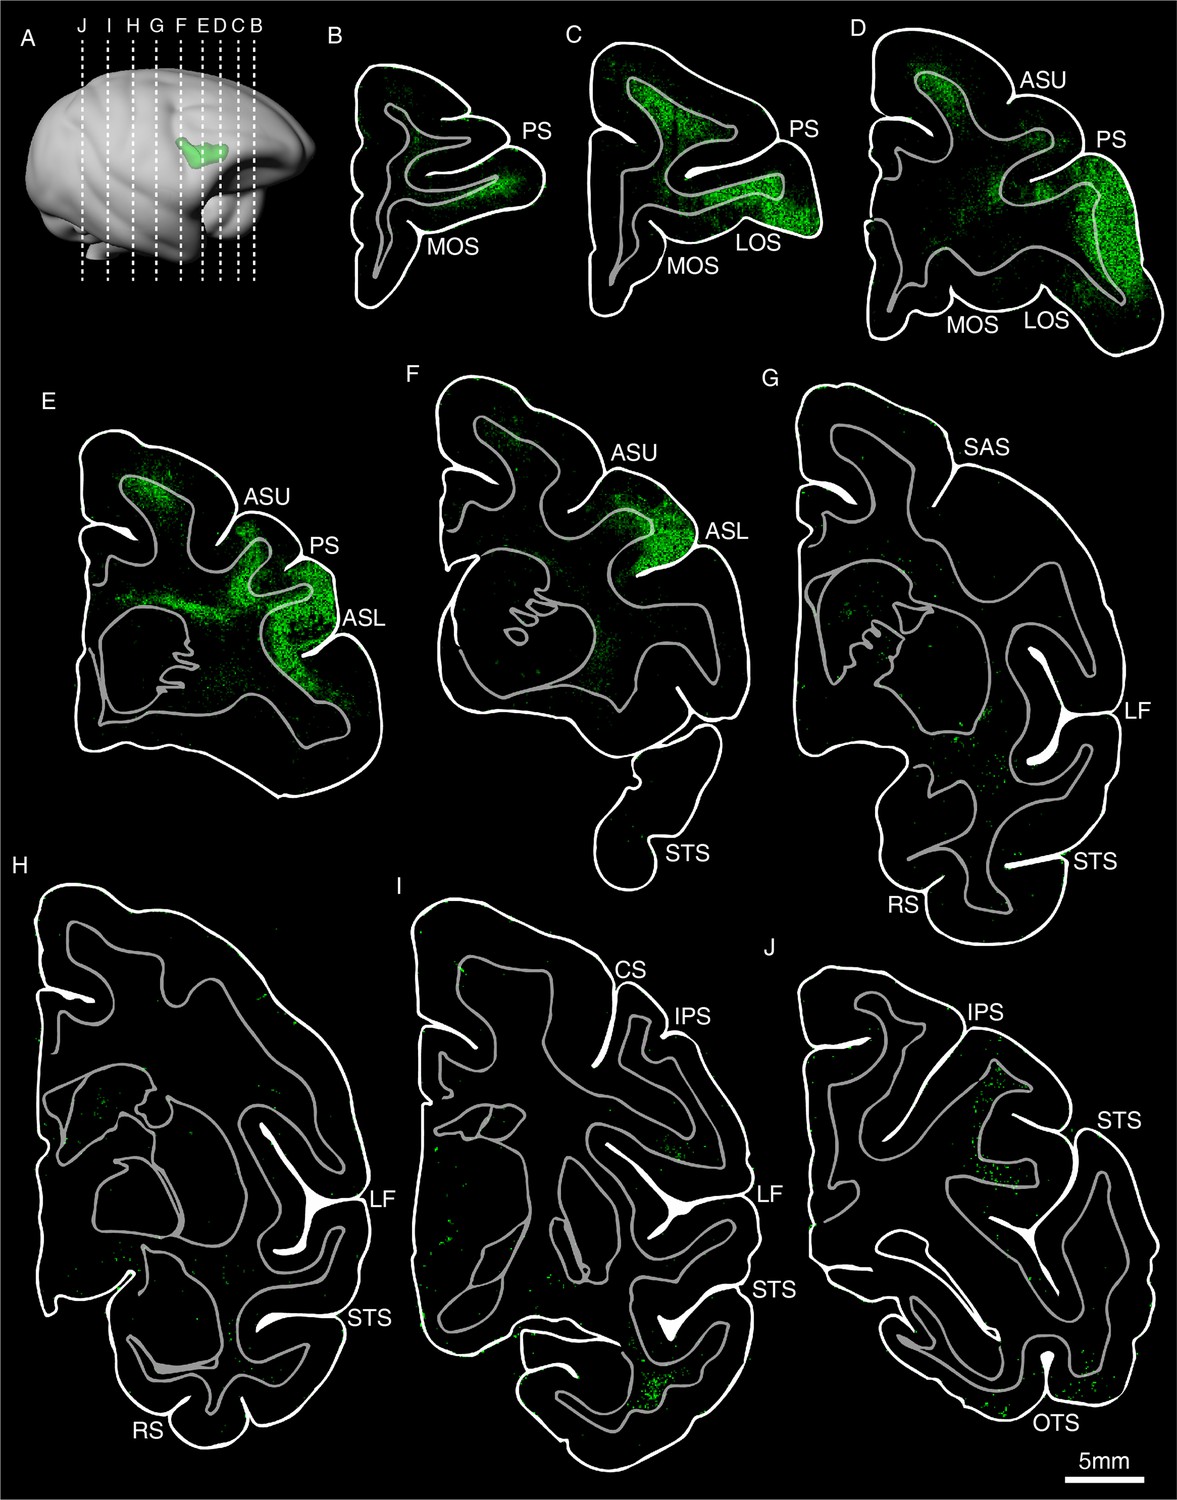
Drawings of coronal sections showing the distribution of the anterograde viral labeling after the injection in vlPFC (Case #8).
(A) 3D reconstruction of the injection site. (B–J) GFP-labeled axonal density maps are shown in a rostral to caudal order, and their AP locations are indicated in (A). Abbreviations: PS, principal sulcus; MOS, medial orbital sulcus; LOS, lateral orbital sulcus; ASU: arcuate sulcus upper limb; ASL: arcuate sulcus lower limb; STS, superior temporal sulcus; SAS: spur of the arcuate sulcus; LF, lateral fissure; RS, rhinal sulcus; CS, central sulcus; IPS, intraparietal sulcus; OTS, occipitotemporal sulcus.
Figure 4 with 4 supplements

ventrolateral prefrontal cortex (vlPFC) projectome within the prefrontal lobe.
(A–D) Representative coronal slices of the injection site in vlPFC are shown overlaid with the monkey brain template (left hand side), mainly spanning areas 45 a, 45b, 12 l, and 44. (E) Percentage of output density of vlPFC projectome along the anterior-posterior axis of the OFC. The inset shows the spatial location of individual Broadmann areas in OFC. Dotted lines indicate anterior-posterior position of the following fluorescent images. (F–I) Representative two-photon images of vlPFC axonal projections to OFC: 12 m and 11 l. Arrows indicate the axon clusters. Insets show the low power images of the section indicating the position of the higher power images.
Figure 4—figure supplement 1
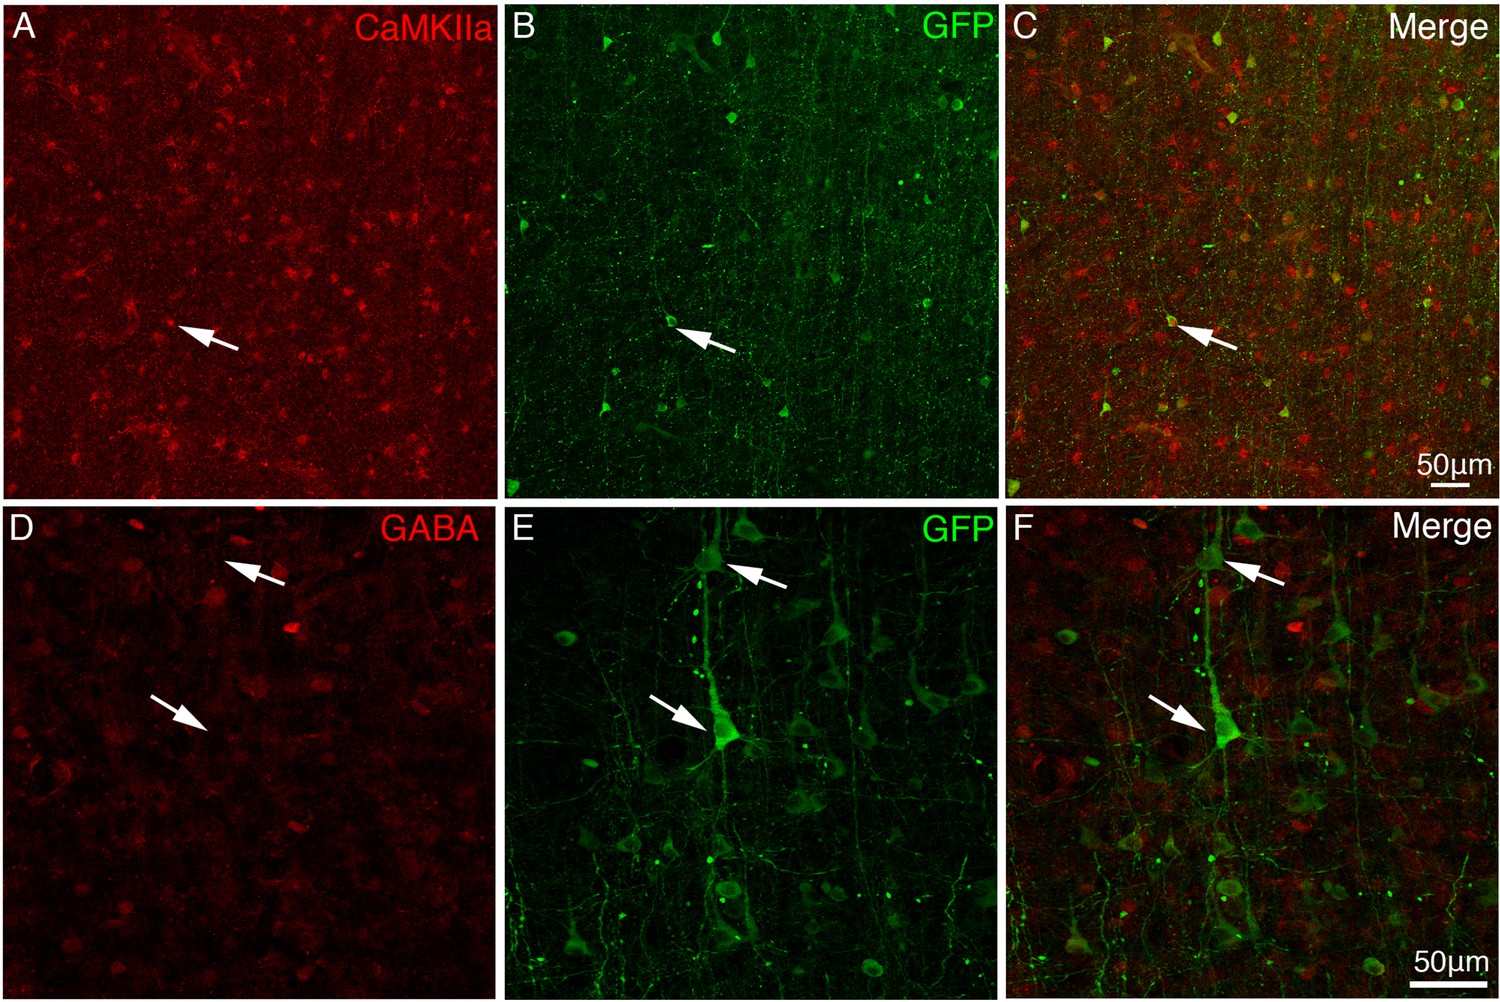
Expression of Tau-GFP in excitatory neurons in macaque brain.
To identify neuronal transduction of AAV2/9 constructed with CaMKIIα promoter, cortical sections of vlPFC were immunostained with anti-CaMKIIα (A–C) and anti-GABA (D–F) antibodies. (A–C) Tau-GFP-expressing neurons around the injection site were identified CaMKIIα positive. (D–F) Immunofluorescent staining with GABA antibody shows that the GFP-expressing neurons were negative with GABA. Arrowheads indicate Tau-GFP positive cell bodies.
Figure 4—figure supplement 2
Representative cortical projections of vlPFC.
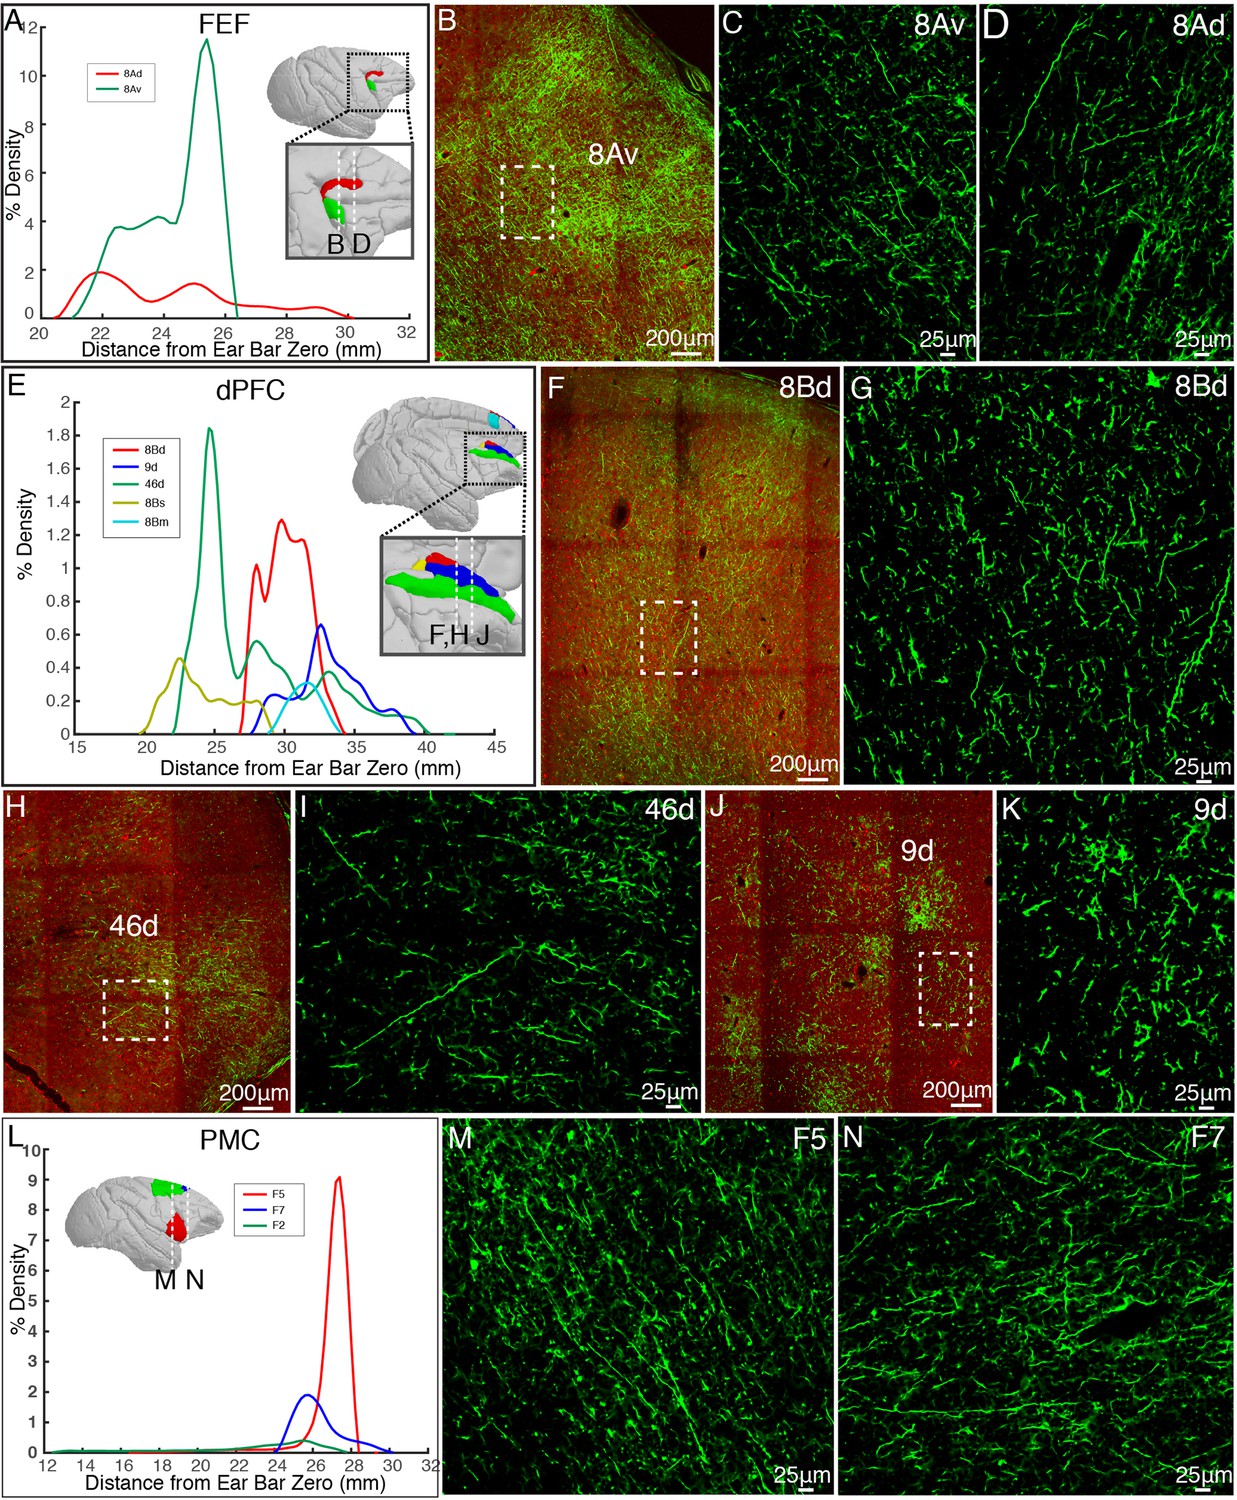
(A) Percentage of output density of vlPFC projectome along the anterior-posterior axis of the FEF. (B–D) Representative two-photon images of vlPFC axonal projections to FEF: 8Av and 8Ad. (E) Percentage of output density of vlPFC projectome along the anterior-posterior axis of the dPFC. (F–K) Representative two-photon images of vlPFC axonal projections to dPFC: 8Bd, 46d, and 9d. (L) Percentage of output density of vlPFC projectome along the anterior-posterior axis of the PMC. (M, N) Representative images of vlPFC axonal projections to PMC: F5 and F7.
Figure 4—figure supplement 3
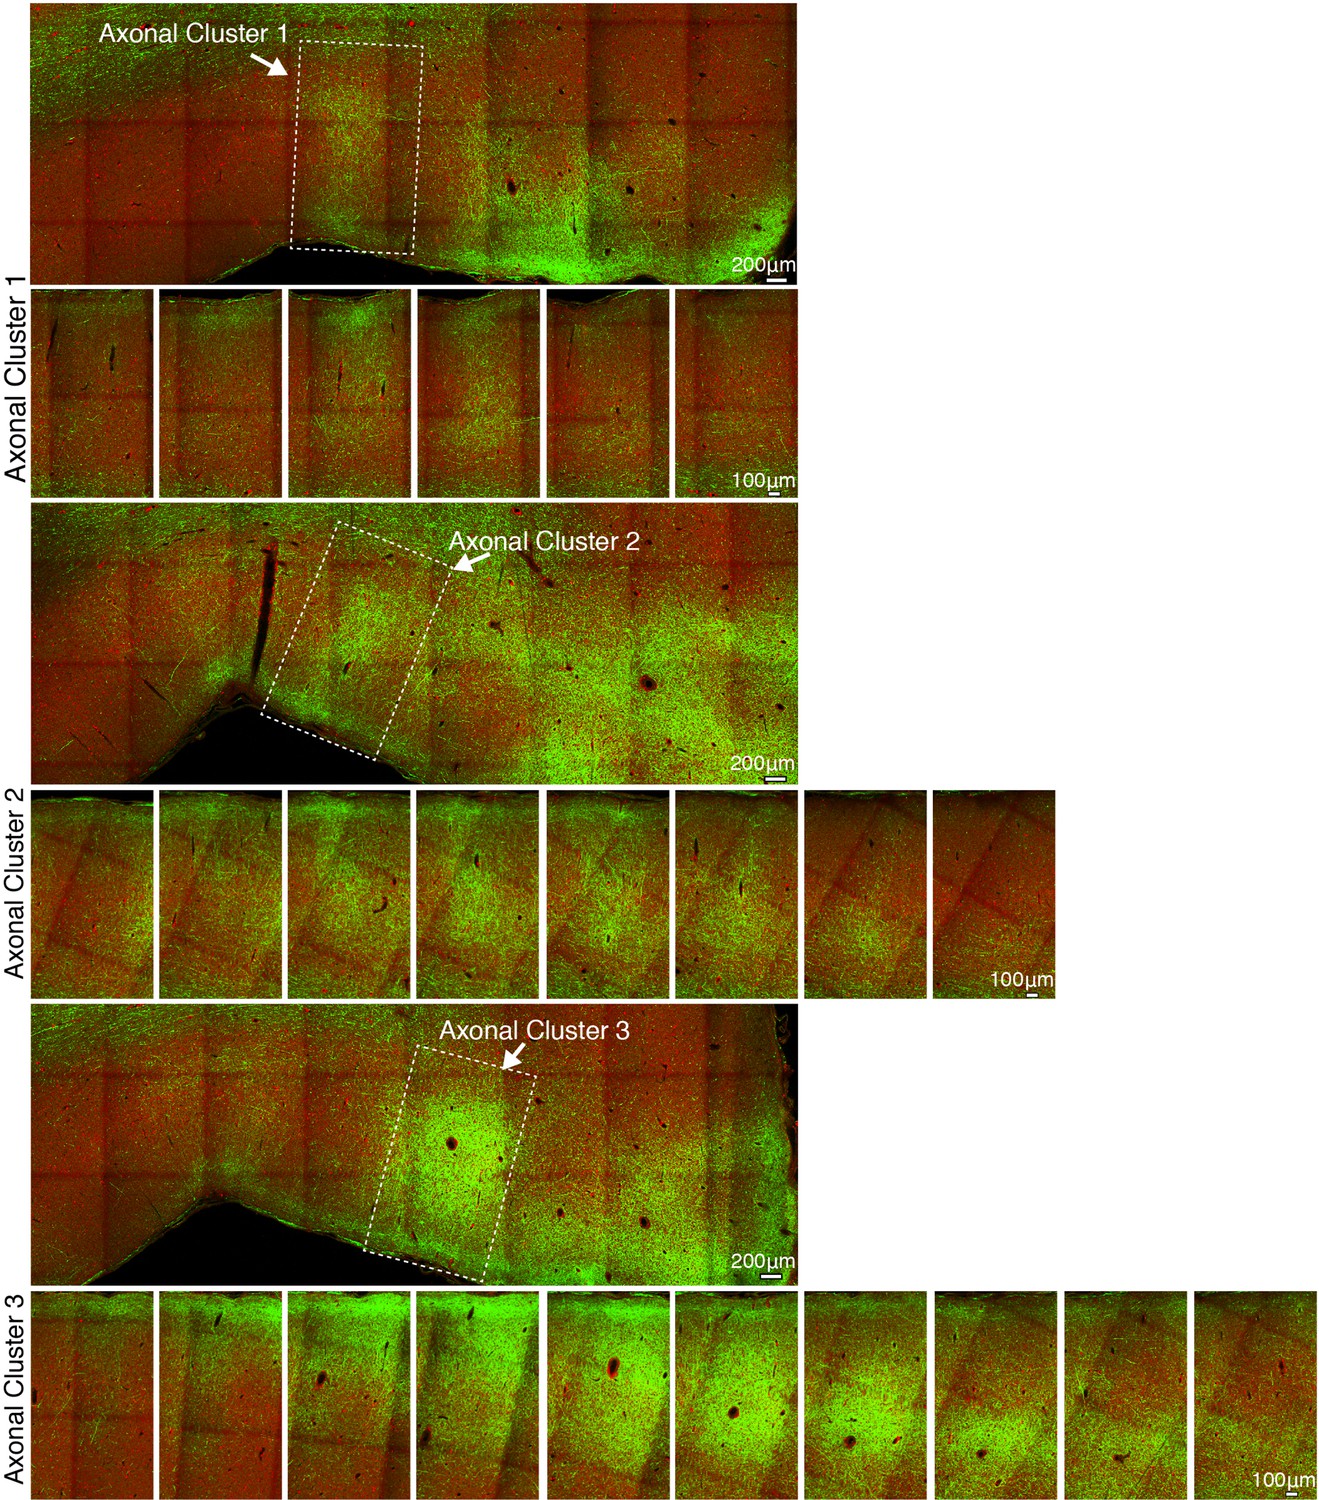
The spatial extent of axonal clusters in the frontal cortex.
GFP-labeled axonal fibers issued from vlPFC are overlaid with the autofluorescence image (acquired through the red channel) which provides anatomical landmarks of brain structures. Three representative axonal clusters are shown along the z-axis extent at 200 μm intervals between each slice.
Figure 4—figure supplement 4

Representative subcortical projections of vlPFC.
(A) GFP-labeled axonal bundles pass through the anterior limb of internal capsule (ALIC). The image of green channel was superimposed on to that of red channel for better visualization. (B) Close-up view of the boxed region in A. (C) GFP-labeled axonal fibers in the mediodorsal (MD) thalamus. (D) Close-up view of the boxed region in C. (E-H) GFP-labeled axon clusters (indicated by white arrows) were found in the medial and caudal parts of caudate. (I-J) Close-up view of the dashed box in G with two levels of magnification.
Figure 5

Representative ex-vivo MRI images of macaque brain.
(A) Typical high-resolution T2-weighted images were shown in axial, coronal, and sagittal planes. (B) Zoom-in view of the red box in panel A, shown with anatomical landmark gyri including intraparietal sulcus (IPS), lunate sulcus (LS), superior temporal sulcus (STS), and cingulate sulcus (CIS). (C) The color-coded FA map corresponding to B. Major fiber bundles including superior longitudinal fasciculus subcomponent I, II, and III (SLF-I, -II, -III), inferior fronto-occipital fasciculus (IFOF), inferior longitudinal fasciculus (ILF), middle longitudinal fasciculus (MdLF), corpus callosum (CC), cingulum bundle (CB), and fornix are clearly demonstrated. Red color codes left and right, blue color codes superior and inferior, and green color codes anterior and posterior directions. (D) Typical tractography of the main fiber bundles indicated in C are derived from the present dMRI data. The ROI locations and fiber tracks are overlaid on the color-coded FA maps.
Figure 6
Comparison of ventrolateral prefrontal cortex (vlPFC) connectivity profiles by serial two-photon (STP) tomography and diffusion tractography.
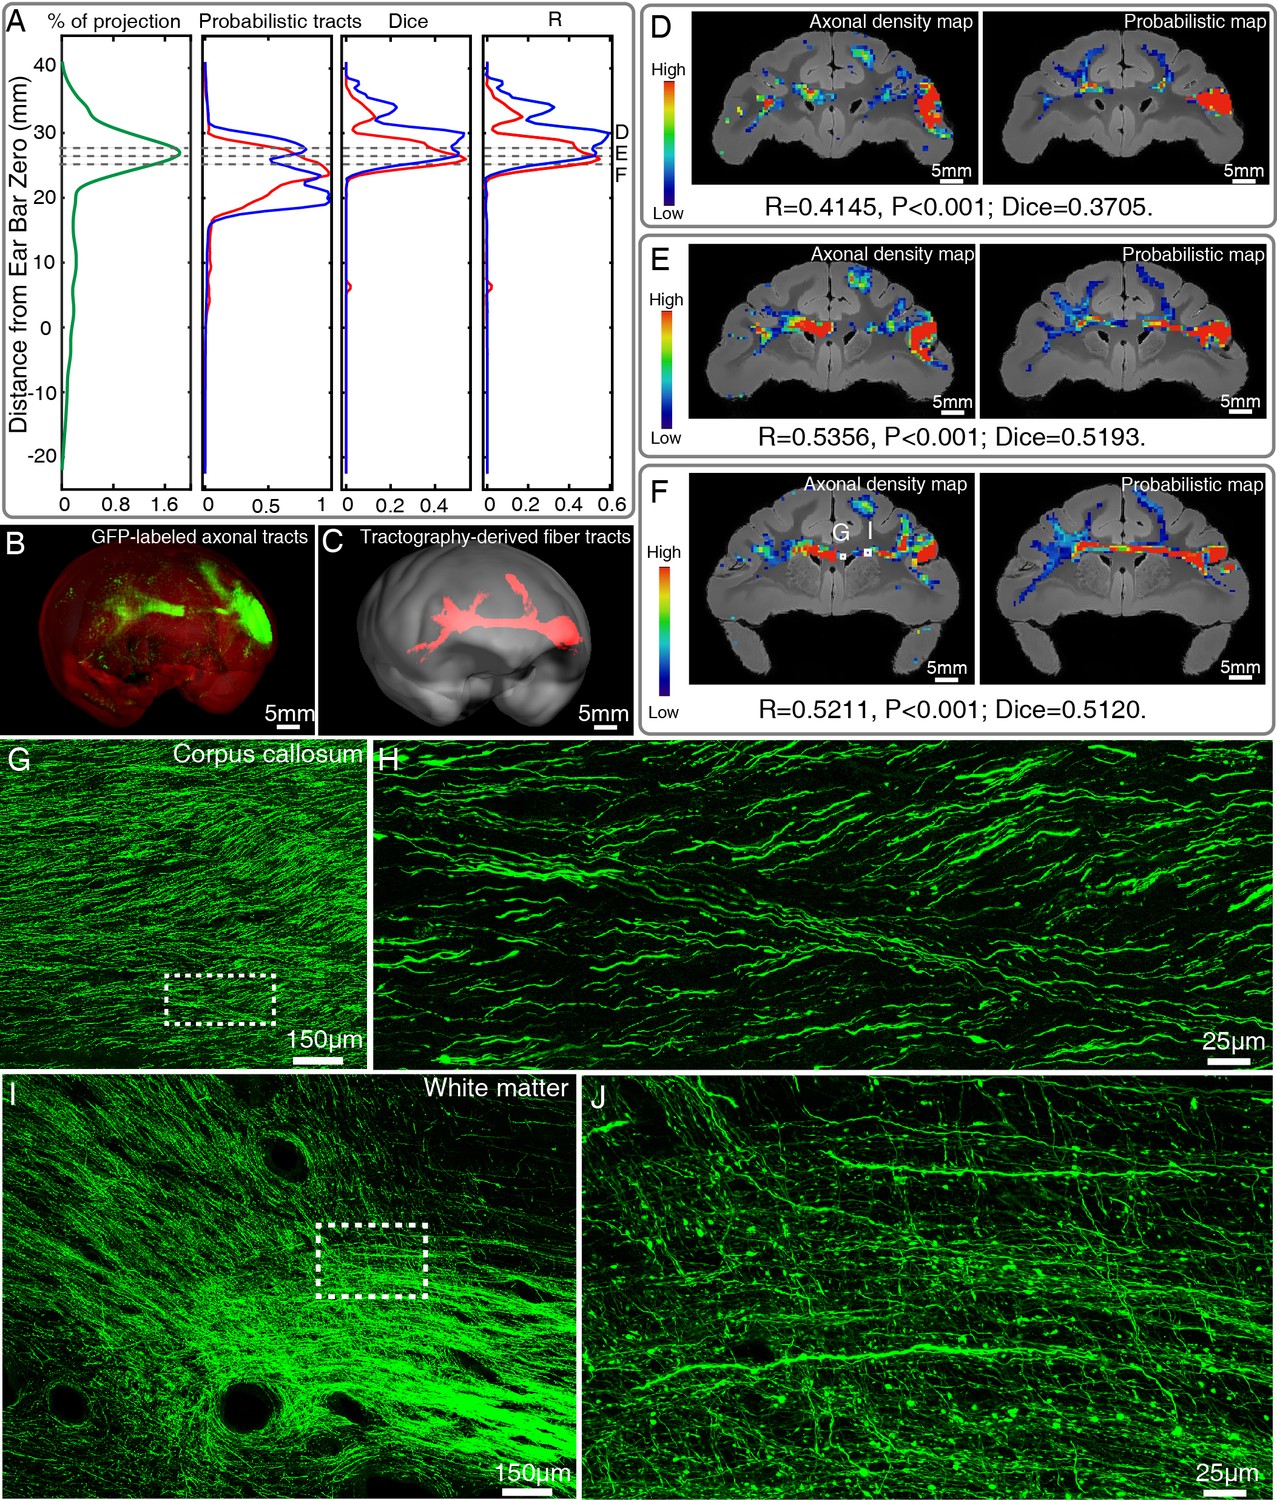
(A) Percentage of projection, Probabilistic tracts, Dice coefficients, and Pearson coefficients (R) were plotted along the anterior-posterior axis in the macaque brain. Blue and red colors indicate results of two dMRI data sets acquired from different macaque monkeys. (B, C) 3D visualization of the fiber tracts issued from the injection site in vlPFC to corpus callosum to the contralateral vlPFC by STP tomography and diffusion tractography. (D–F) Representative coronal slices of the diffusion tractography map and the axonal density map along the vlPFC-CC-contralateral tract, overlaid with the corresponding anatomical MR images. (G–J) GFP-labeled axon images as marked in (F) were shown with magnified views. (H, J) correspond to high magnification images of the white boxes indicated in G and I, both of which presented a great deal of details about axonal morphology.
Figure 7 with 1 supplement
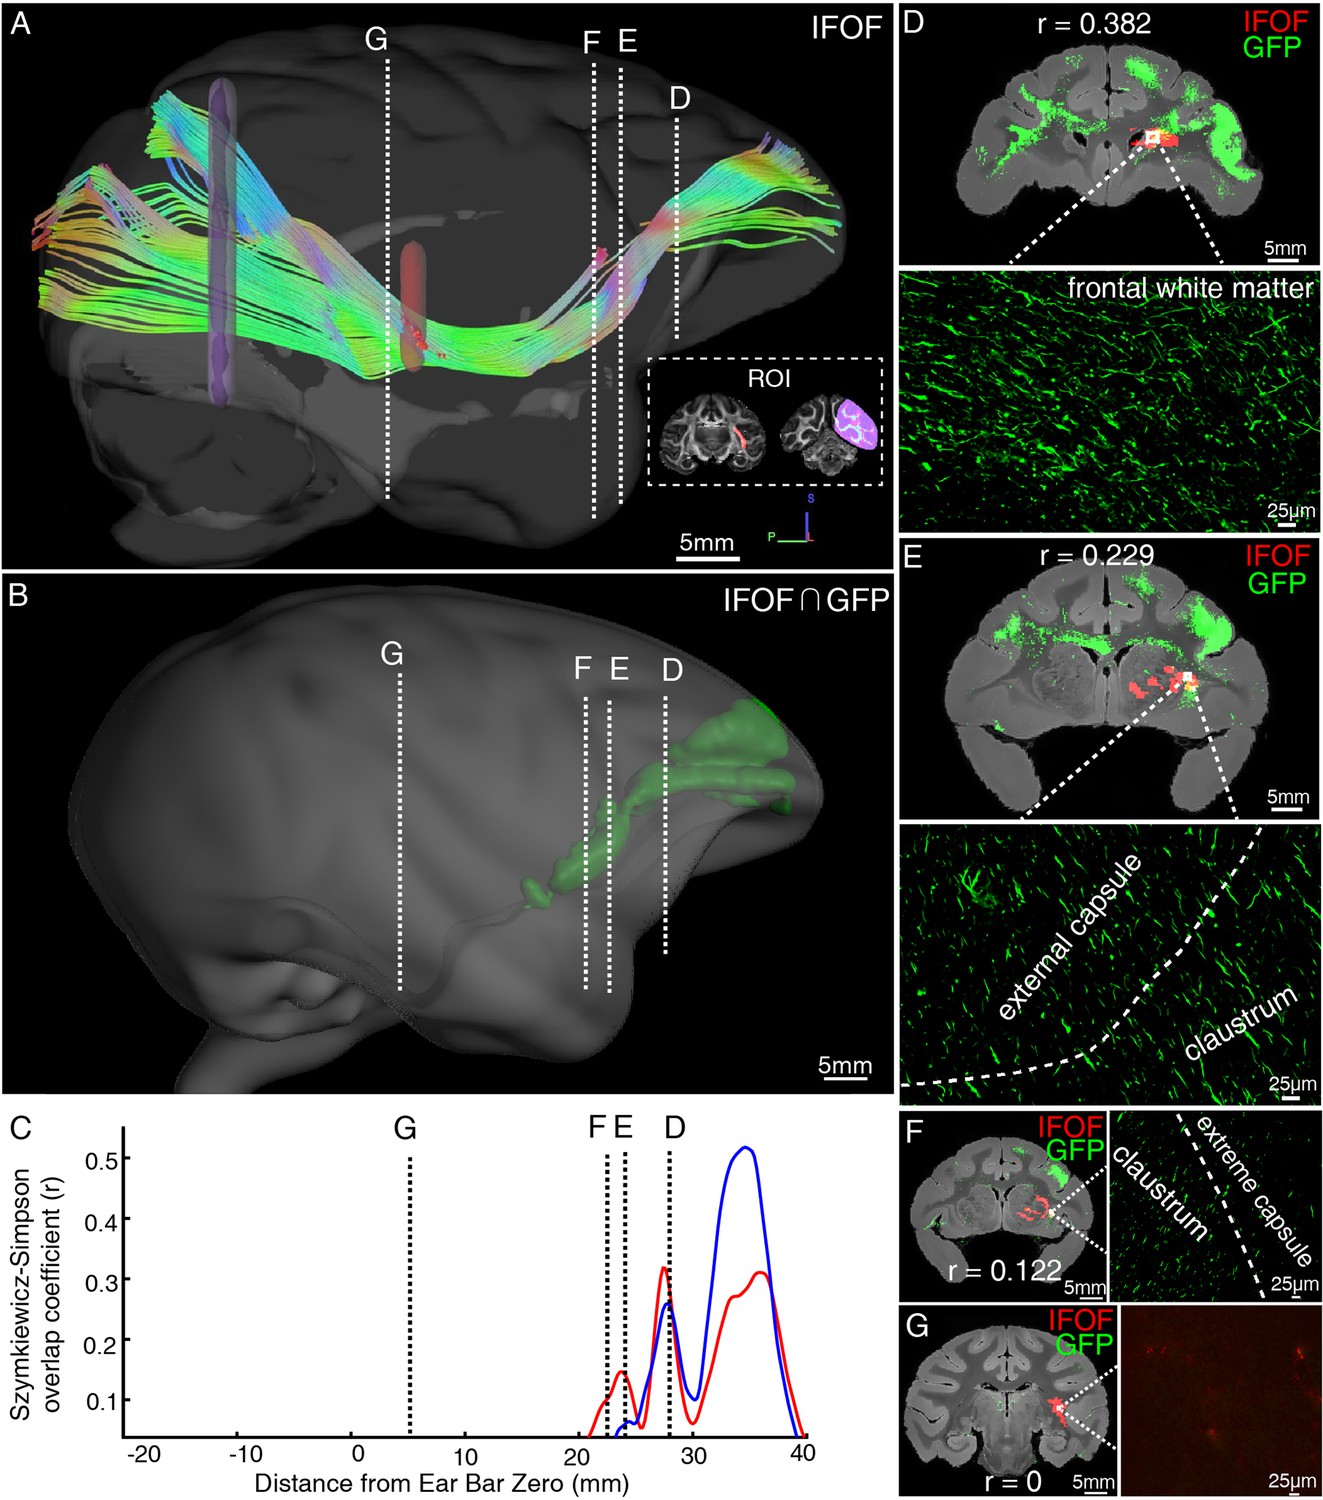
Illustration of the inferior fronto-occipital fasciculus by diffusion tractography and serial two-photon (STP) tomography.
(A) The fiber tractography of inferior fronto-occipital fasciculus (IFOF) (lateral view). Two inclusion ROIs at the external capsule (pink) and the anterior border of the occipital lobe (purple) were used and shown on the coronal plane. The IFOF stems from the frontal lobe, travels along the lateral border of the caudate nucleus and external/extreme capsule, forms a bowtie-like pattern and anchors into the occipital lobe. (B) The reconstructed traveling course of IFOF based on vlPFC projectome was shown in 3D space. (C) The Szymkiewicz-Simpson overlap coefficients between 2D coronal brain slices of the dMRI-derived IFOF tract and vlPFC projections were plotted along the anterior-posterior axis of the macaque brain. Blue and red colors indicate results of two dMRI data sets acquired from different macaque monkeys. Four cross-sectional slices (D–G) along the IFOF tracts were arbitrarily chosen to demonstrate the spatial correspondence between the diffusion tractography and axonal tracing of STP images. (D–G) The detected GFP signals (green) of vlPFC projectome and the IFOF tracts (red) obtained by diffusion tractography were overlaid on anatomical MRI images, with a magnified view of the box area. Evidently, there was no fluorescent signal detected in the superior temporal area where the dMRI-derived IFOF tract passes through (G).
Figure 7—figure supplement 1
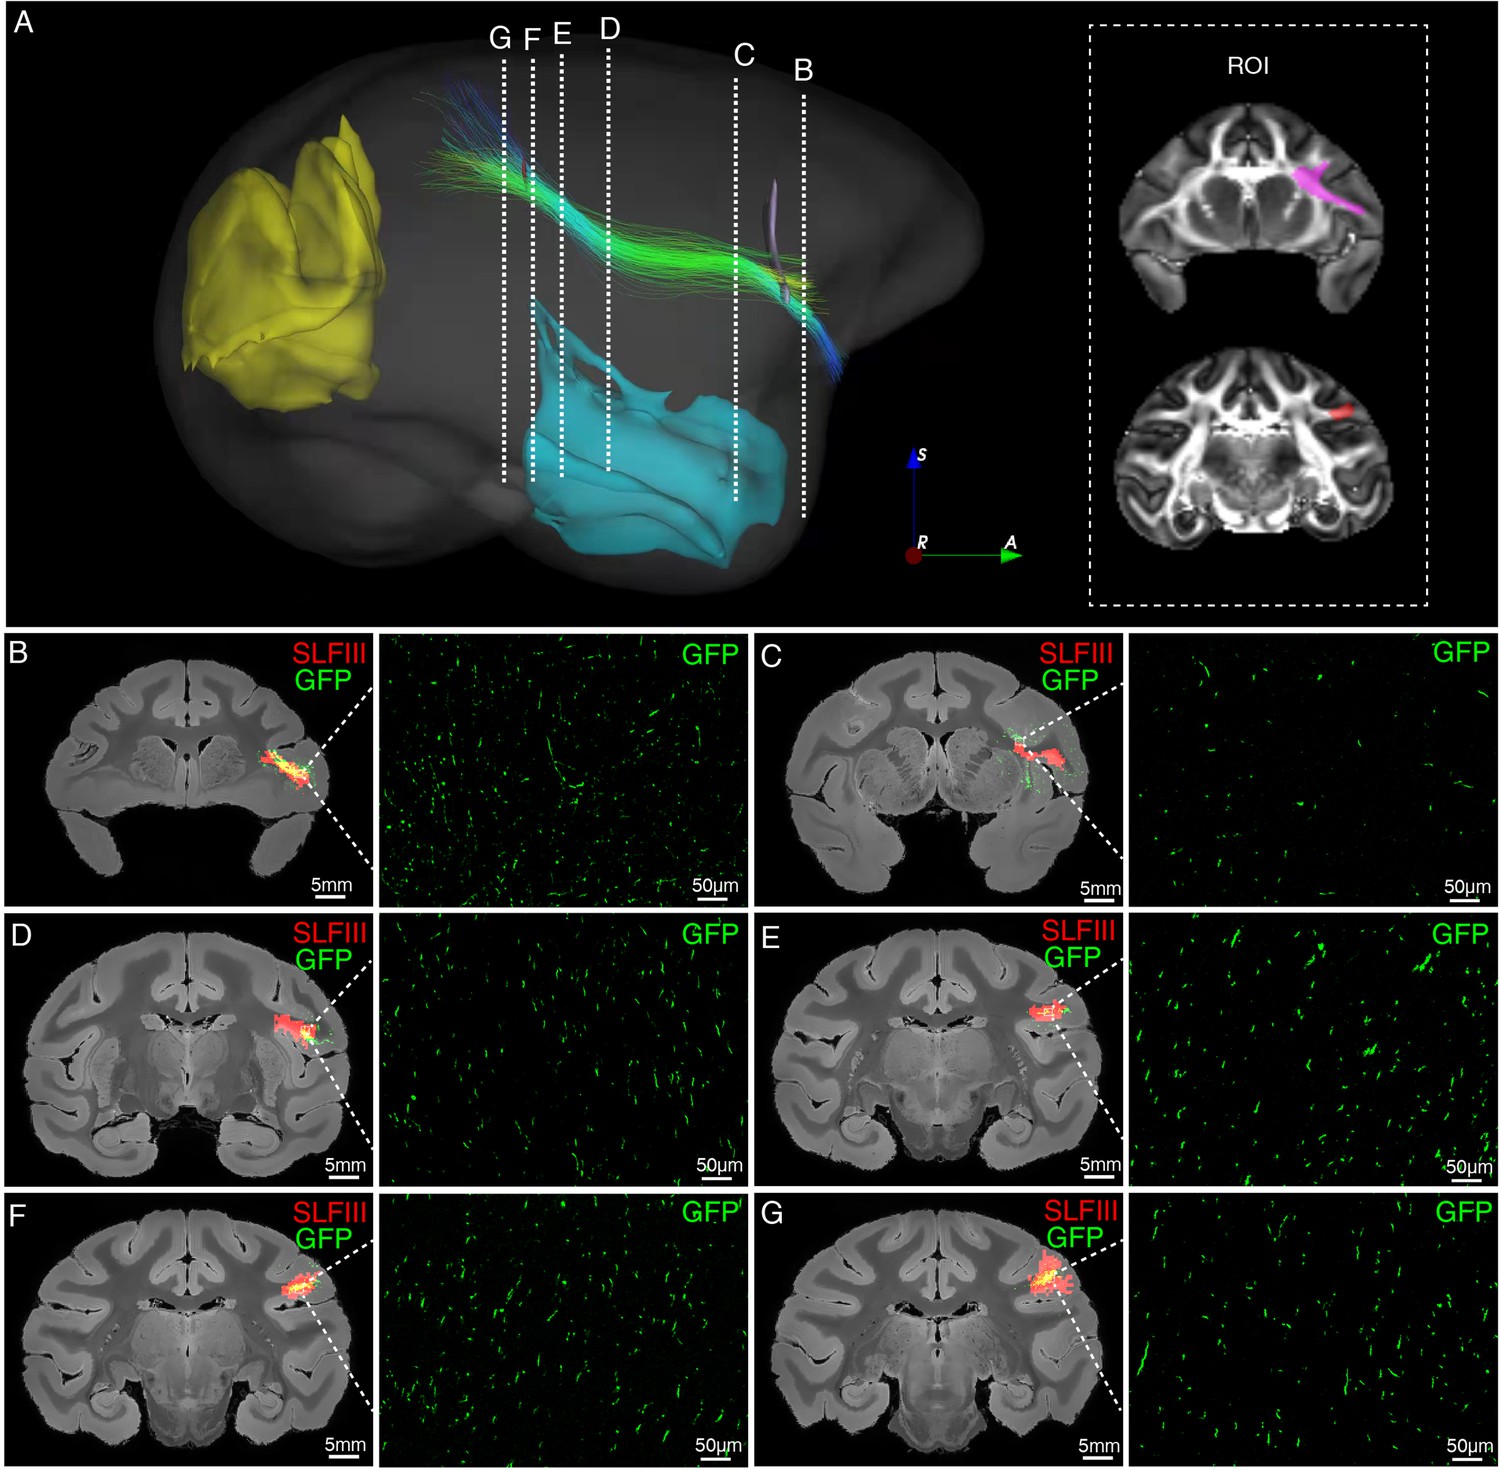
Illustration of SLFIII by diffusion tractography and STP tomography (segmented out of the vlPFC-parietal projections).
(A) The spatial trajectory of axonal fibers of SLFIII (lateral view). Two inclusion ROIs at the frontal white matter (violet) and the parietal lobe (red) were used and shown on the coronal plane. Temporal and occipital ROIs were applied as exclusion regions. Six cross-sectional slices (B–G) along the SLFIII trajectory were randomly chosen to demonstrate the spatial correspondence between the diffusion tractography and axonal tracing of STP images. (B–G) The detected GFP signals (green) of vlPFC projectome and the SLFIII tracts (red) obtained by diffusion tractography were overlaid on anatomical MRI images, with a magnified view of the box area. The dMRI-derived SLFIII tract showed good agreement with the axonal fibers identified by the viral tracing data.
Tables
Key resources table
| Reagent type (species) or resource | Designation | Source or reference | Identifiers | Additional information |
|---|---|---|---|---|
| Antibody | anti-CaMKIIa (Rabbit polyclonal) | Abcam | Cat# ab5683, RRID: AB_305050 | IF(1: 200) |
| Antibody | anti-GABA (Rabbit polyclonal) | Abcam | Cat# ab8891, RRID: AB_306844 | IF(1: 200) |
| Antibody | anti- NeuN (Mouse Monoclonal) | Millipore | Cat# MAB377, RRID: AB_2298772 | IF(1: 500) |
| Antibody | anti- GFP (Rabbit polyclonal) | Thermo Fisher Scientific | Cat# A-11122, RRID: AB_221569 | IF(1: 300) |
| Antibody | anti- GFAP (Rabbit polyclonal) | Boster (PMID:31101714) | Cat# PB0046 | IF(1: 200) |
| Antibody | Goat anti-Rabbit IgG (H + L) Alexa Fluor 405 (Goat polyclonal) | Thermo Fisher Scientific | Cat# A31556, RRID: AB_221605 | IF(1: 500) |
| Antibody | Donkey anti-Rabbit IgG (H + L) Alexa Fluor 568 (Donkey polyclonal) | Thermo Fisher Scientific | Cat# A10042, RRID: AB_2534017 | IF(1: 600) |
| Antibody | Goat anti-Mouse IgG (H + L) Alexa Fluor 568 (Goat polyclonal) | Thermo Fisher Scientific | Cat# A11031, RRID: AB_144696 | IF(1: 600) |
| Antibody | Goat anti-Mouse IgG (H + L) Alexa Fluor Plus 647 (Goat Polyclonal) | Thermo Fisher Scientific | Cat# A32728, RRID: AB_2633277 | IF(1: 500) |
| Antibody | Goat anti-Rabbit IgG (H + L) Alexa Fluor 488 (Goat Polyclonal) | Thermo Fisher Scientific | Cat# A11034, RRID: AB_2576217 | IF(1: 300) |
| Software, algorithm | Fiji (ImageJ) software | NIH | RRID:SCR_002285 | http://fiji.sc |
| Software, algorithm | MATLAB | Mathworks | RRID:SCR_001622 | https://www.mathworks.com/ |
| Software, algorithm | FSL software | University of Oxford | RRID:SCR_002823 | http://www.fmrib.ox.ac.uk/fsl |
| Software, algorithm | ANTS - Advanced Normalization ToolS | University of Pennsylvania | RRID:SCR_004757 | http://www.picsl.upenn.edu/ANTS/ |
Table 1
Injection cases and viral vectors used in this study.
| ID | Species | Injection site | Viral vector | Expression time |
|---|---|---|---|---|
| #1 | Macaca mulatta (M) | Cortex MD | VSV-△G-Tau-GFP VSV-△G-Tau-GFP | ~5 d ~5 d |
| #2 | Macaca mulatta (M) | Cortex MD | VSV-△G-Tau-GFP VSV-△G-Tau-GFP | ~30 d ~90 d |
| #3 | Macaca fascicularis (M) | Cortex Cortex Cortex MD | AAV2/9-CaMKIIα-Tau-GFP AAV2/9-hSyn- mCherry Lenti-UbC-GFP Lenti-UbC-GFP | ~45 d ~45 d ~260 d ~260 d |
| #4 | Macaca fascicularis (M) | MD | AAV2/9-CaMKIIα-Tau-GFP | ~60 d |
| #5 | Macaca fascicularis (M) | MD | AAV2/9-CaMKIIα-Tau-GFP | ~60 d |
| #6 | Macaca fascicularis (F) | MD | AAV2/9-CaMKIIα-Tau-GFP | ~60 d |
| #7 | Macaca fascicularis (M) | vlPFC | AAV2/9-CaMKIIα-Tau-GFP | ~75 d |
| #8 | Macaca fascicularis (F) | vlPFC | AAV2/9-CaMKIIα-Tau-GFP | ~75 d |
| #9 | Macaca fascicularis (F) | vlPFC | AAV2/9-CaMKIIα-Tau-GFP | ~110 d |
| #10 | Macaca fascicularis (F) | \ | \ | \ |
-
Abbreviations: M, male; F, female. MD, mediodorsal thalamus; vlPFC, ventrolateral prefrontal cortex; UbC, human ubiquitin C; hSyn, human synapsin I; CaMKII, Ca2+/calmodulin dependent protein kinase II; d, day.
Additional files
Download links
A two-part list of links to download the article, or parts of the article, in various formats.
Downloads (link to download the article as PDF)
Open citations (links to open the citations from this article in various online reference manager services)
Cite this article (links to download the citations from this article in formats compatible with various reference manager tools)
Mapping brain-wide excitatory projectome of primate prefrontal cortex at submicron resolution and comparison with diffusion tractography
eLife 11:e72534.
https://doi.org/10.7554/eLife.72534


