The chromatin-remodeling enzyme Smarca5 regulates erythrocyte aggregation via Keap1-Nrf2 signaling
- The Max-Planck Center for Tissue Stem Cell Research and Regenerative Medicine, Bioland Laboratory, China
- State Key Laboratory of Membrane Biology, Institute of Zoology, Chinese Academy of Sciences, China
- Institute for Stem Cell and Regeneration, Chinese Academy of Sciences, China
- University of Chinese Academy of Sciences, China
- MOE Key Laboratory of Bioinformatics, Beijing Advanced Innovation Center for Structural Biology & Frontier Research Center for Biological Structure, Center for Synthetic and Systems Biology, School of Life Sciences, Tsinghua University, China
- Academy for Advanced Interdisciplinary Studies, Peking University, China
- Tsinghua-Peking Center for Life Sciences, China
Figures
Figure 1 with 1 supplement

Blood clots occur in smarca5zko1049a.
(A) The bright-field of tail region in smarca5zko1049a and their siblings at 2 days post fertilization (dpf). The areas circled by red dotted line show the blood clots in the caudal vein plexus. (B) Expression of scl at 2 dpf in smarca5zko1049a and their siblings by WISH. The amplification region in the black rectangular box in CHT shows the enriched expression of scl in blood clots (indicated by arrow heads) in the caudal vein plexus. (C) The confocal imaging of transgenic line (Tg) (gata1:dsRed;kdrl:GFP) in smarca5zko1049a and their siblings at 2 dpf. The amplification region in the white rectangular box in CHT shows the coagulation of red blood cells (RBCs) (indicated by arrow heads) in the caudal vein plexus. (D) Expression of gata1, ikaros and scl at 33 hr post fertilization (hpf) in smarca5zko1049a and their siblings by WISH. (E) qPCR analysis showing the expression of gata1, ikaros, hbae1, and hbbe1 in smarca5zko1049a and their siblings at 33 hpf. The expression level of these genes in smarca5 siblings was set at 1. Data are mean ± s.d. (E). Asterisk presents statistical significance (n.s. not significant). p Values were calculated by two-tailed unpaired Student’s t-test.
Figure 1—figure supplement 1
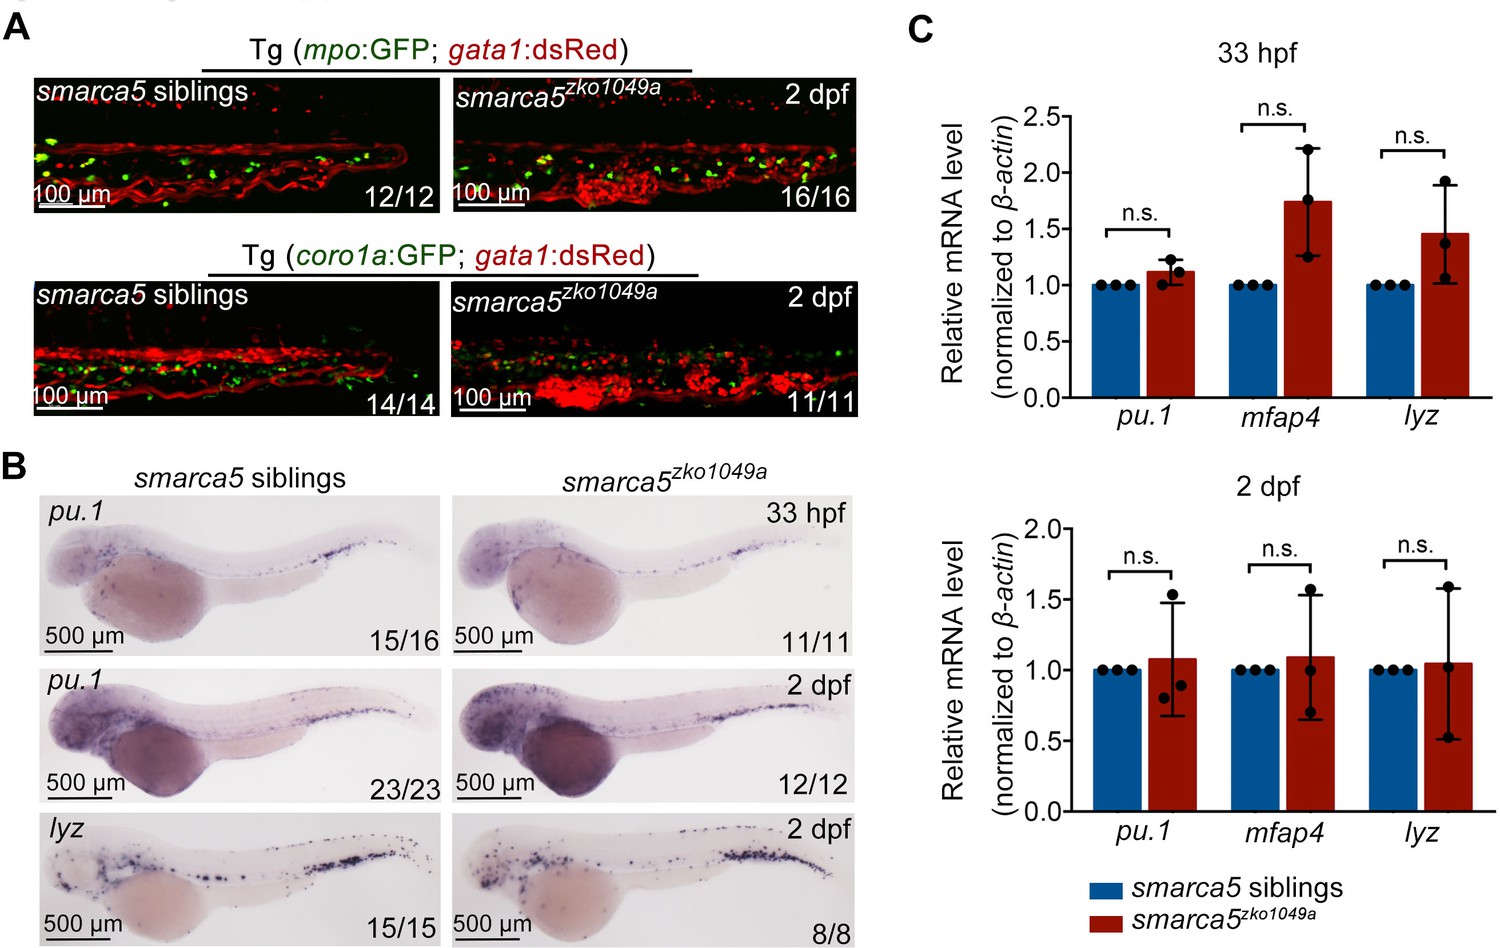
smarca5 is dispensable for the development of primitive myeloid cells.
(A) The confocal imaging of Tg (mpo:GFP; gata1:dsRed) and Tg (coro1a:GFP; gata1:dsRed) in smarca5zko1049a and their siblings at 2 dpf. (B) Expression of pu.1 and lyz at 33 hpf and/or 2 dpf in smarca5zko1049a and their siblings by WISH. (C) qPCR analysis showing the expression of pu.1, mfap4, and lyz in smarca5zko1049a and their siblings at 33 hpf and 2 dpf. The expression level of these genes in smarca5 siblings was set at 1. Data are mean ± s.d. (C). Asterisk presents statistical significance (n.s. not significant). p Values were calculated by two-tailed unpaired Student’s t-test.
Figure 2 with 1 supplement
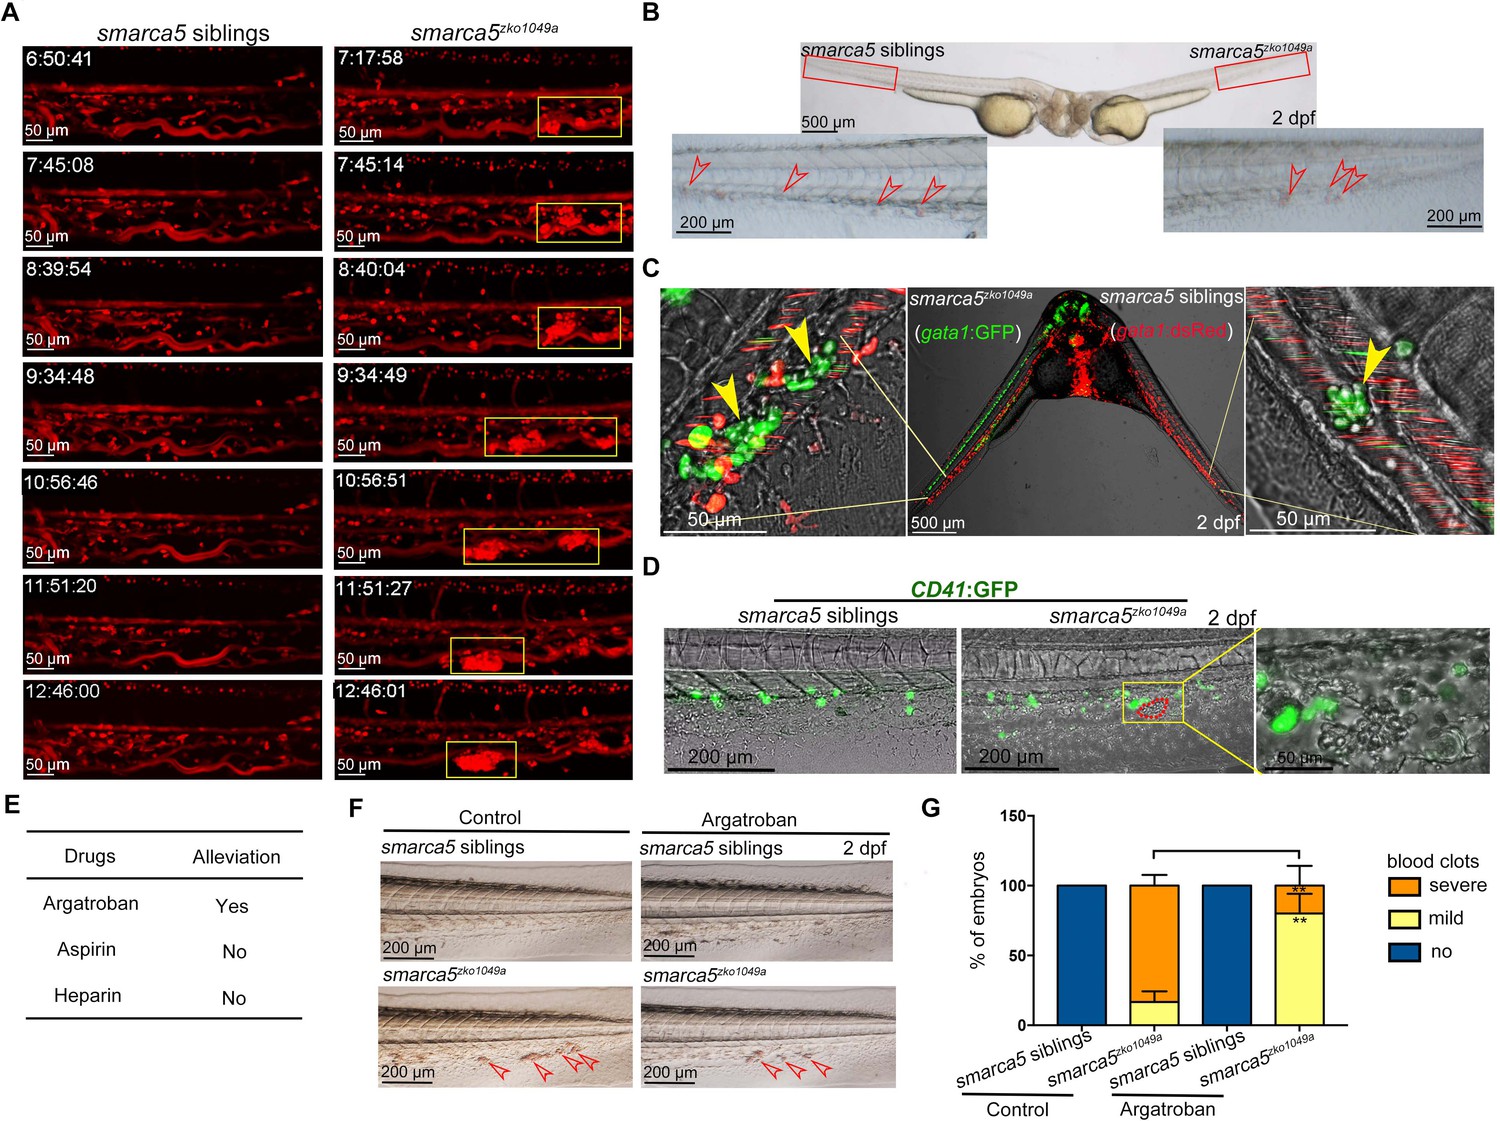
The blood clots are formed by RBC aggregation.
(A) The snapshot of Tg (gata1:dsRed) in smarca5zko1049a and their siblings from 36 hpf to 2 dpf. The yellow rectangular boxes in CHT show the formed blood clots smarca5zko1049a. (B) The bright-field of parabiosis at 2 dpf between smarca5zko1049a and their siblings. The amplification region in the red rectangular box in CHT shows the blood clots (indicated by arrow heads) in smarca5zko1049a and their siblings. (C) The confocal imaging of parabiosis generated between smarca5zko1049a and their siblings with Tg (gata1:GFP) and Tg (gata1:dsRed) background, respectively. The magnification in CHT shows the aggregation of gata1:GFP+ cells (indicated by arrow heads) in the caudal vein plexus. (D) The confocal imaging of Tg (CD41:GFP) in smarca5zko1049a and their siblings at 2 dpf. The magnification in the yellow rectangular box in CHT shows the blood clots and the distribution of CD41:GFP+ cells. (E) Drugs used to examine whether the blood clots in smarca5zko1049a can be alleviated. (F) The bright-field of tail region in smarca5zko1049a at 2 dpf in control group and with argatroban treatment. The blood clots are indicated by arrow heads. (G) The quantification of blood clots phenotype in (F). Data are mean ± s.d. (G). Asterisk presents statistical significance (**p< 0.01). p Values were calculated by two-tailed unpaired Student’s t-test.
Figure 2—figure supplement 1
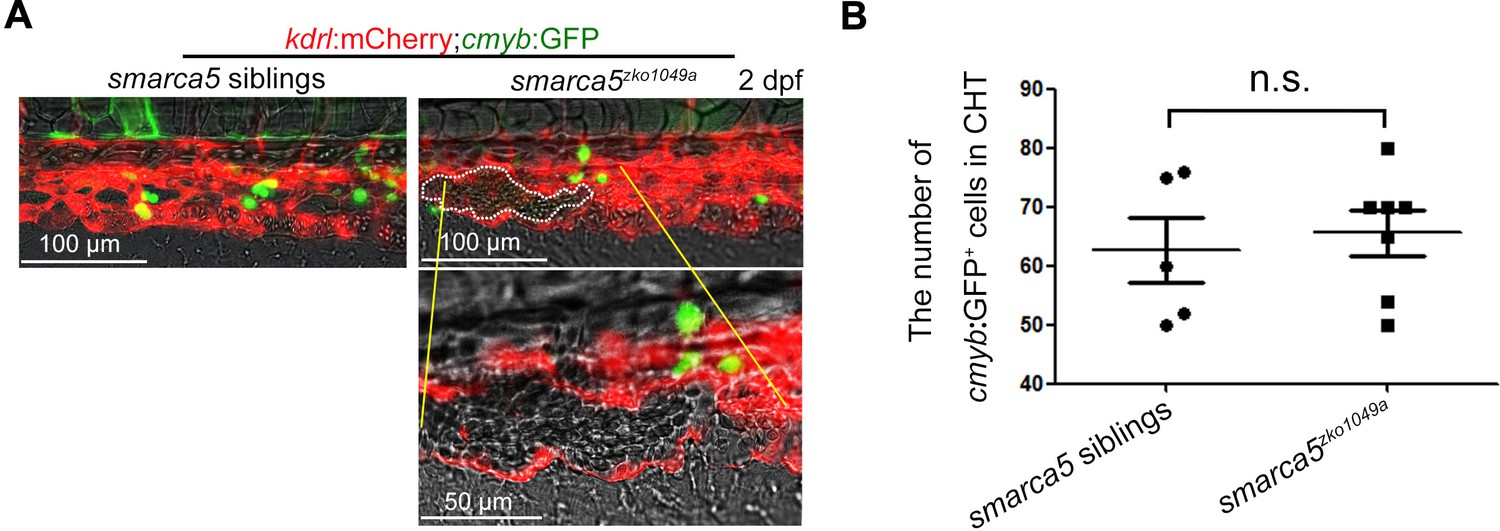
The RBC aggregation has no overt influence on the number of HSPCs in the CHT.
(A) The confocal imaging of Tg (kdrl:mCherry;cmyb:GFP) in smarca5zko1049a and their siblings at 2 dpf. (B) The statistical data shows the number of cmyb:GFP+ cells in the CHT in (A). Data are mean ± s.d. (B). Asterisk presents statistical significance (n.s. not significant). p Values were calculated by two-tailed unpaired Student’s t-test.
Figure 3 with 1 supplement
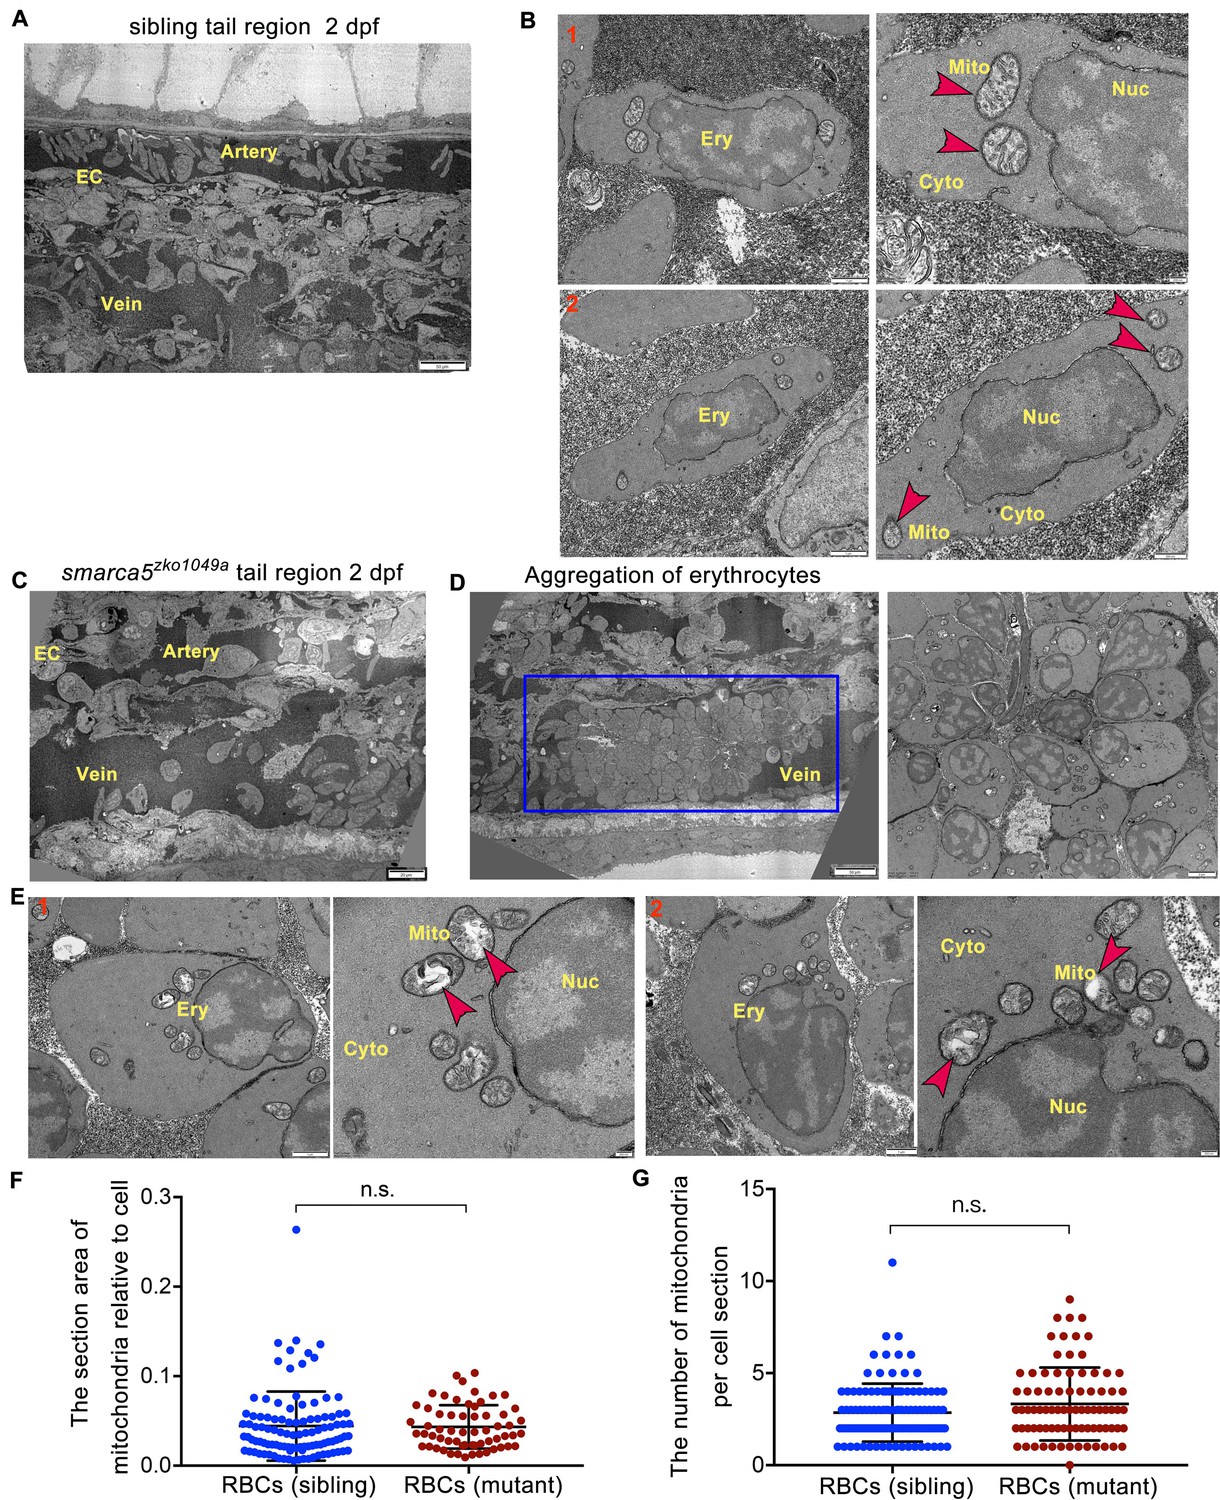
TEM shows abnormal organelle morphology in smarca5-deficient RBCs.
(A) The transmission electron microscopy (TEM) view of a longitudinal section through the artery and vein plexus in sibling tail region at 2 dpf. (B) TEM view of erythrocytes in sibling embryos. The red arrow heads indicate the characteristic pattern of organization in mitochondria. (C) TEM view of a longitudinal section through the artery and vein plexus in smarca5zko1049a tail region at 2 dpf. (D) The blue rectangular box showing blood clots in the caudal vein plexus in smarca5zko1049a. The magnification of blood clots is shown (right). (E) TEM view of erythrocytes in smarca5zko1049a. The red arrow heads indicate the characteristic pattern of organization in mitochondria. The disintegration of cristae in mitochondria is observed in smarca5-deficient RBCs. Ery, erythrocyte; EC, endothelial cell; Mito, mitochondria; Nuc, nucleus; Cyto, cytoplasm. (F) Scatter plots showing the section area of mitochondria relative to cell in RBCs from smarca5zko1049a and their siblings. (G) Scatter plots showing the number of mitochondria per cell section in RBCs from smarca5zko1049a and their siblings. Data are mean ± s.d. (F and G). Asterisk presents statistical significance (n.s. not significant). p Values were calculated by two-tailed unpaired Student’s t-test.
Figure 3—figure supplement 1
The morphology and number of RBCs has no obvious change in smarca5zko1049a.
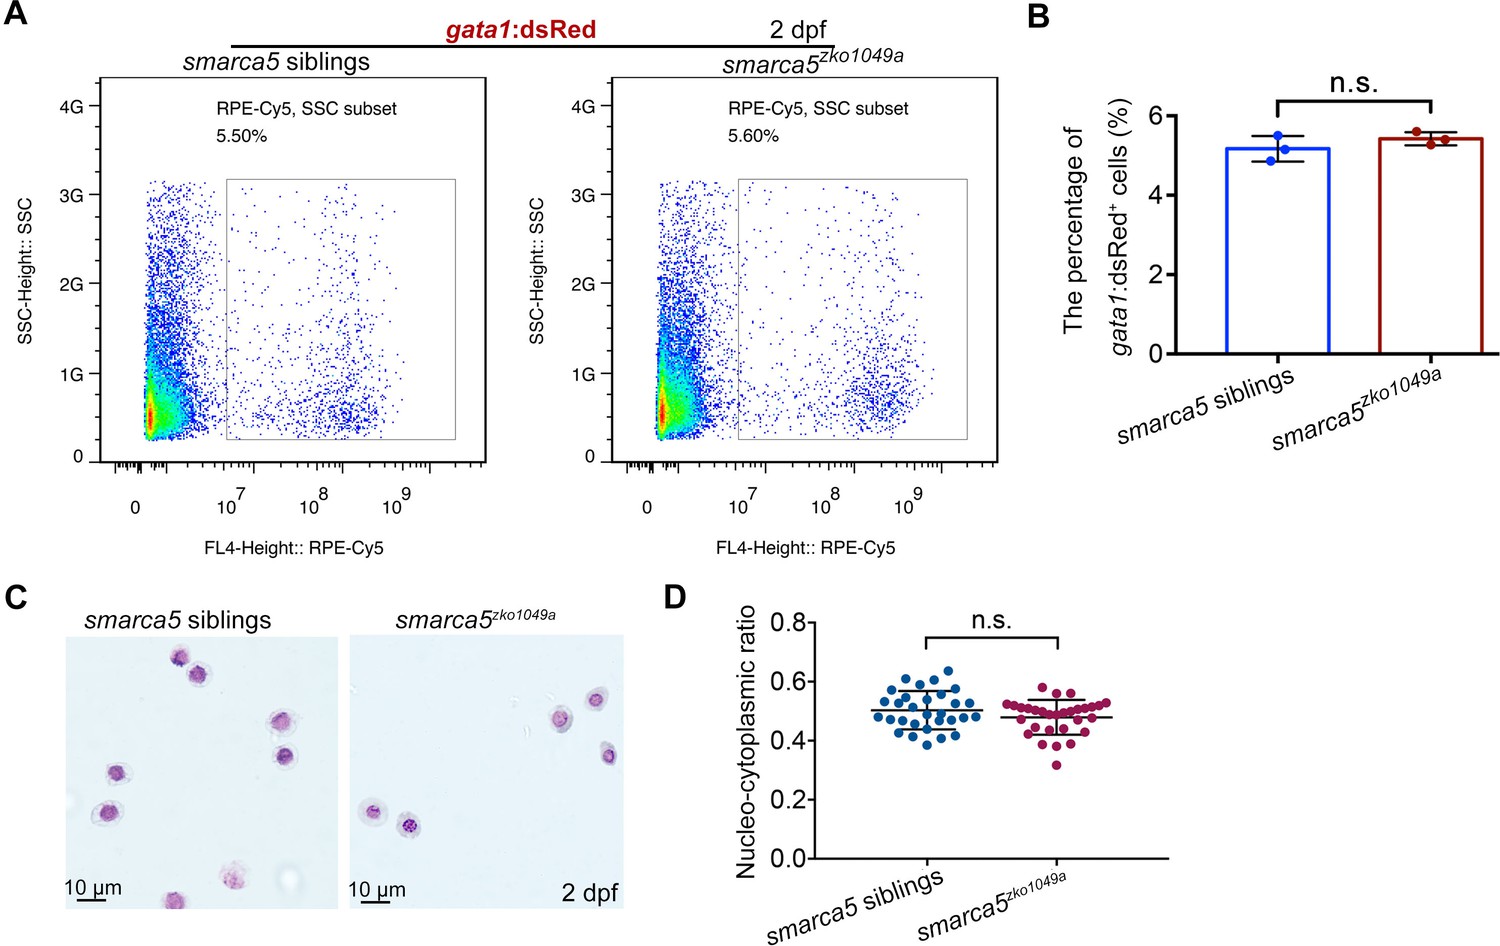
(A) FACS of gata1:dsRed+ cells in wild-type embryos and Tg (gata1: dsRed) in smarca5zko1049a and their siblings at 2 dpf. (B) The statistical data show the percentage of gata1: dsRed+ cells in smarca5zko1049a and their siblings in (A). (C) Blood-smear and Giemsa-staining analysis in smarca5zko1049a and their siblings at 2 dpf. (D) Scatter plots showing the nucleocytoplasmic ratio in RBCs from smarca5zko1049a and their siblings. Data are mean ± s.d. (B and D). Asterisk presents statistical significance (n.s. not significant). p Values were calculated by two-tailed unpaired Student’s t-test.
Figure 4 with 1 supplement
Transcriptional disruption of genes related to erythrocyte function and homeostasis after smarca5 deletion.
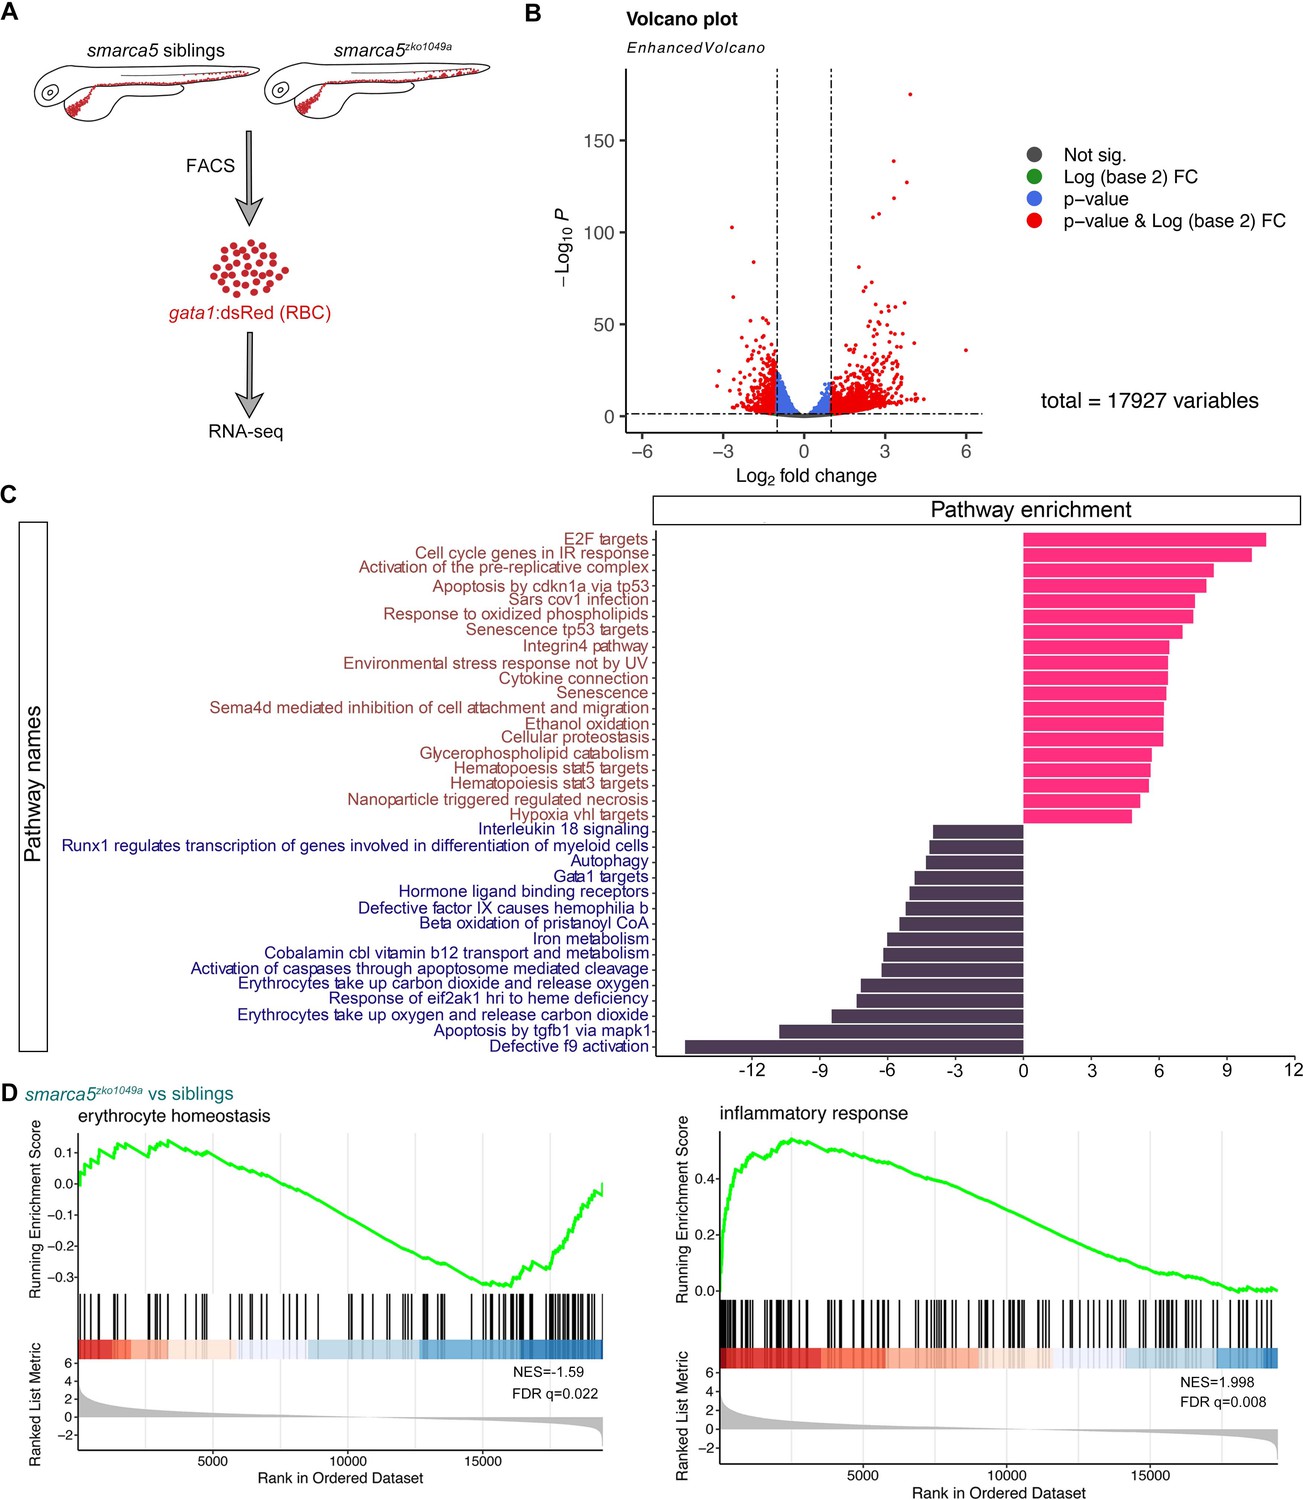
(A) Schematic representation of the RBC RNA-seq workflow in smarca5zko1049a and their siblings at 2 dpf. (B) Volcano plot showing differential expression genes between RBCs from smarca5zko1049a and their siblings by DESeq2. −Log10 P, negative log10 adjusted p-value. Adjusted p-value < 0.05, log2 fold change >1. (C) Differential pathways enriched in RBCs from smarca5zko1049a and their siblings by GSVA. The x axis represents the t values of GSVA scores. Two-sided unpaired limma-moderated t test. (D) Enrichment plots for the top pathways in the mutant RBCs by GSEA (Gene Set Enrichment Analysis).
Figure 4—figure supplement 1
RNA-seq analysis for RBCs in smarca5zko1049a and their siblings.
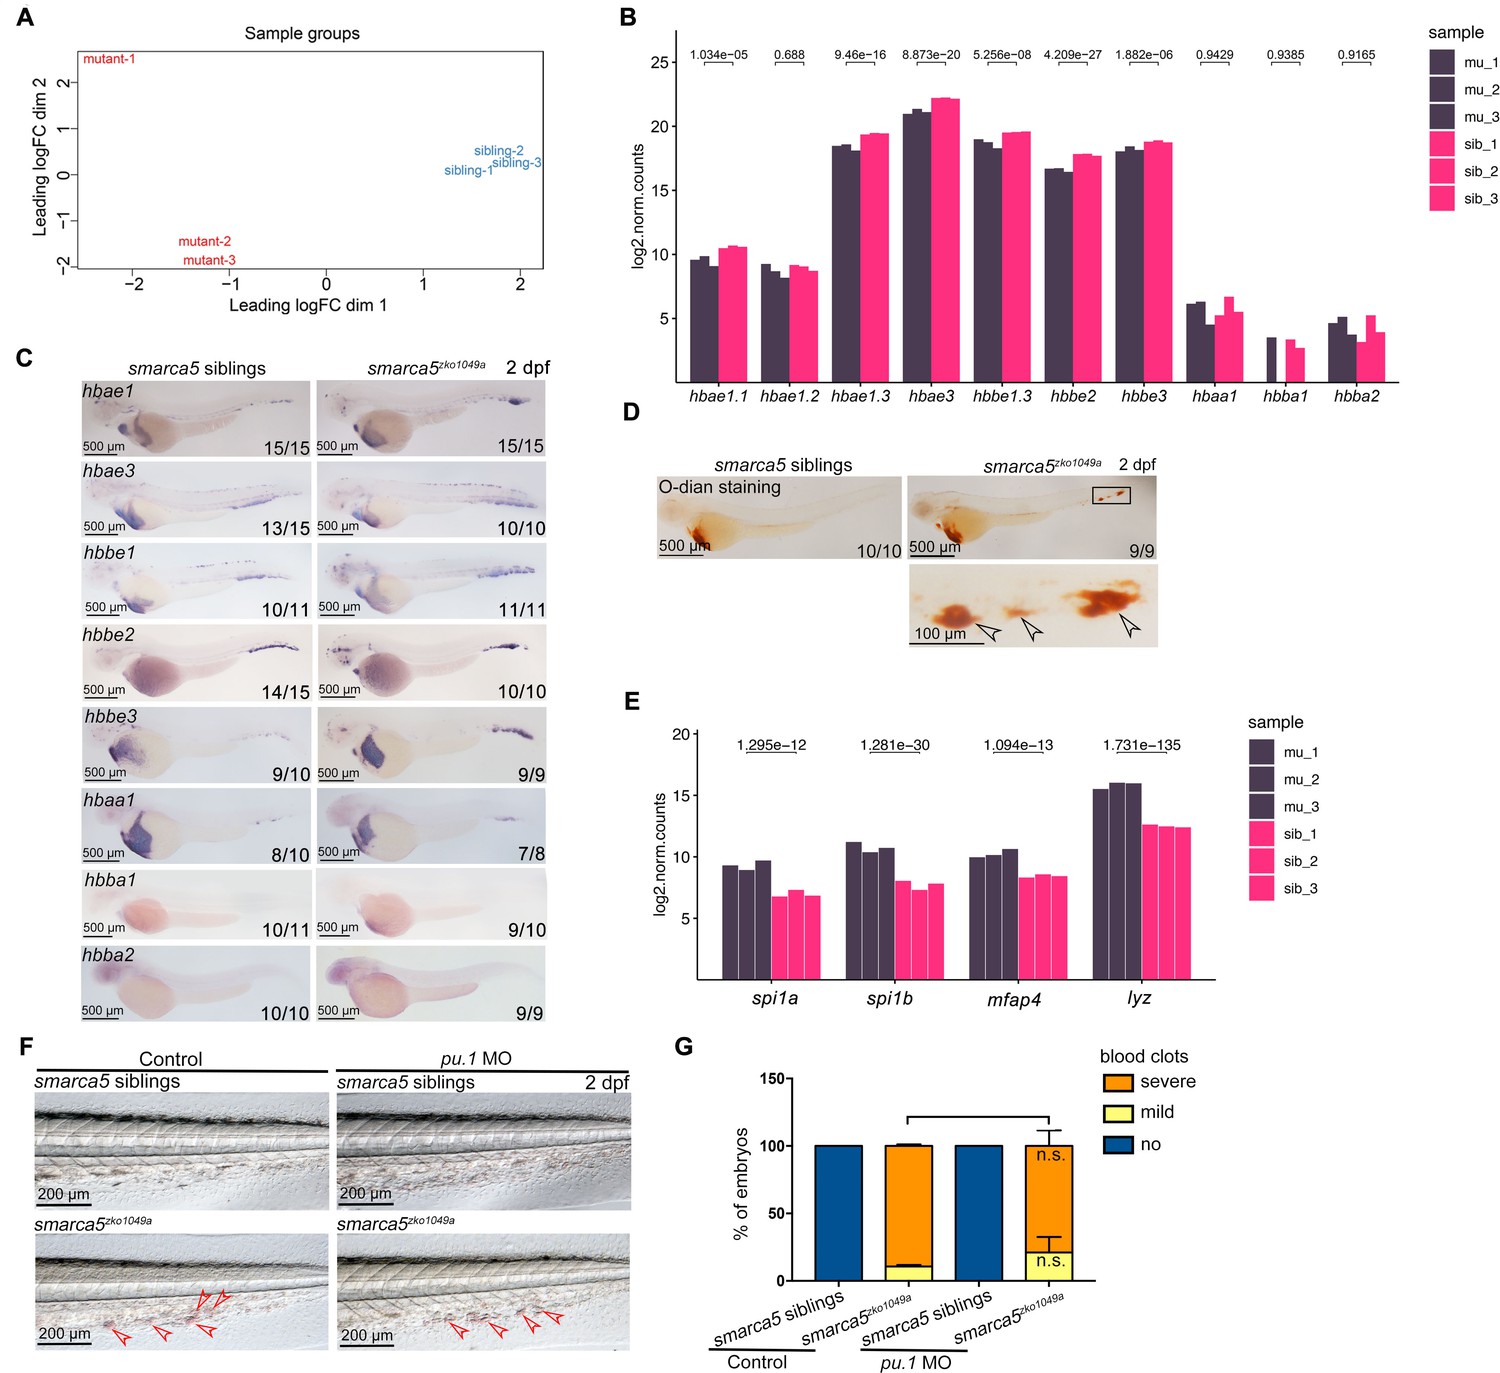
(A) Principal components analysis (PCA) plot of biological replicates by the transcriptional data. (B) Bar plot showing the gene counts of hbae1.1, hbae1.2, hbae1.3, hbae3, hbbe1.3, hbbe2, hbbe3, hbaa1, hbba1, and hbba2 in RBCs from smarca5zko1049a and siblings. (C) Expression of hbae1, hbae3, hbbe1, hbbe2, hbbe3, hbaa1, hbba1, and hbba2 at 2 dpf in smarca5zko1049a and their siblings by WISH. (D) O-dianisidine staining in smarca5zko1049a and their siblings at 2 dpf. The amplification region in the black rectangular box in CHT shows the blood clots (indicated by arrow heads) in smarca5zko1049a. (E) Bar plot showing the gene counts of spi1a, spi1b, mfap4, and lyz in RBCs from smarca5zko1049a and siblings. (F) The bright-field of tail region in smarca5zko1049a at 2 dpf in control group and with pu.1 MO injection. The blood clots are indicated by arrow heads. (G) The quantification of blood clots in (F). Data are mean ± s.d. (G). Asterisk presents statistical significance (n.s. not significant). p Values were calculated by two-tailed unpaired Student’s t-test.
Figure 5 with 1 supplement
Changes in chromatin accessibility in RBCs from smarca5zko1049a and their siblings.
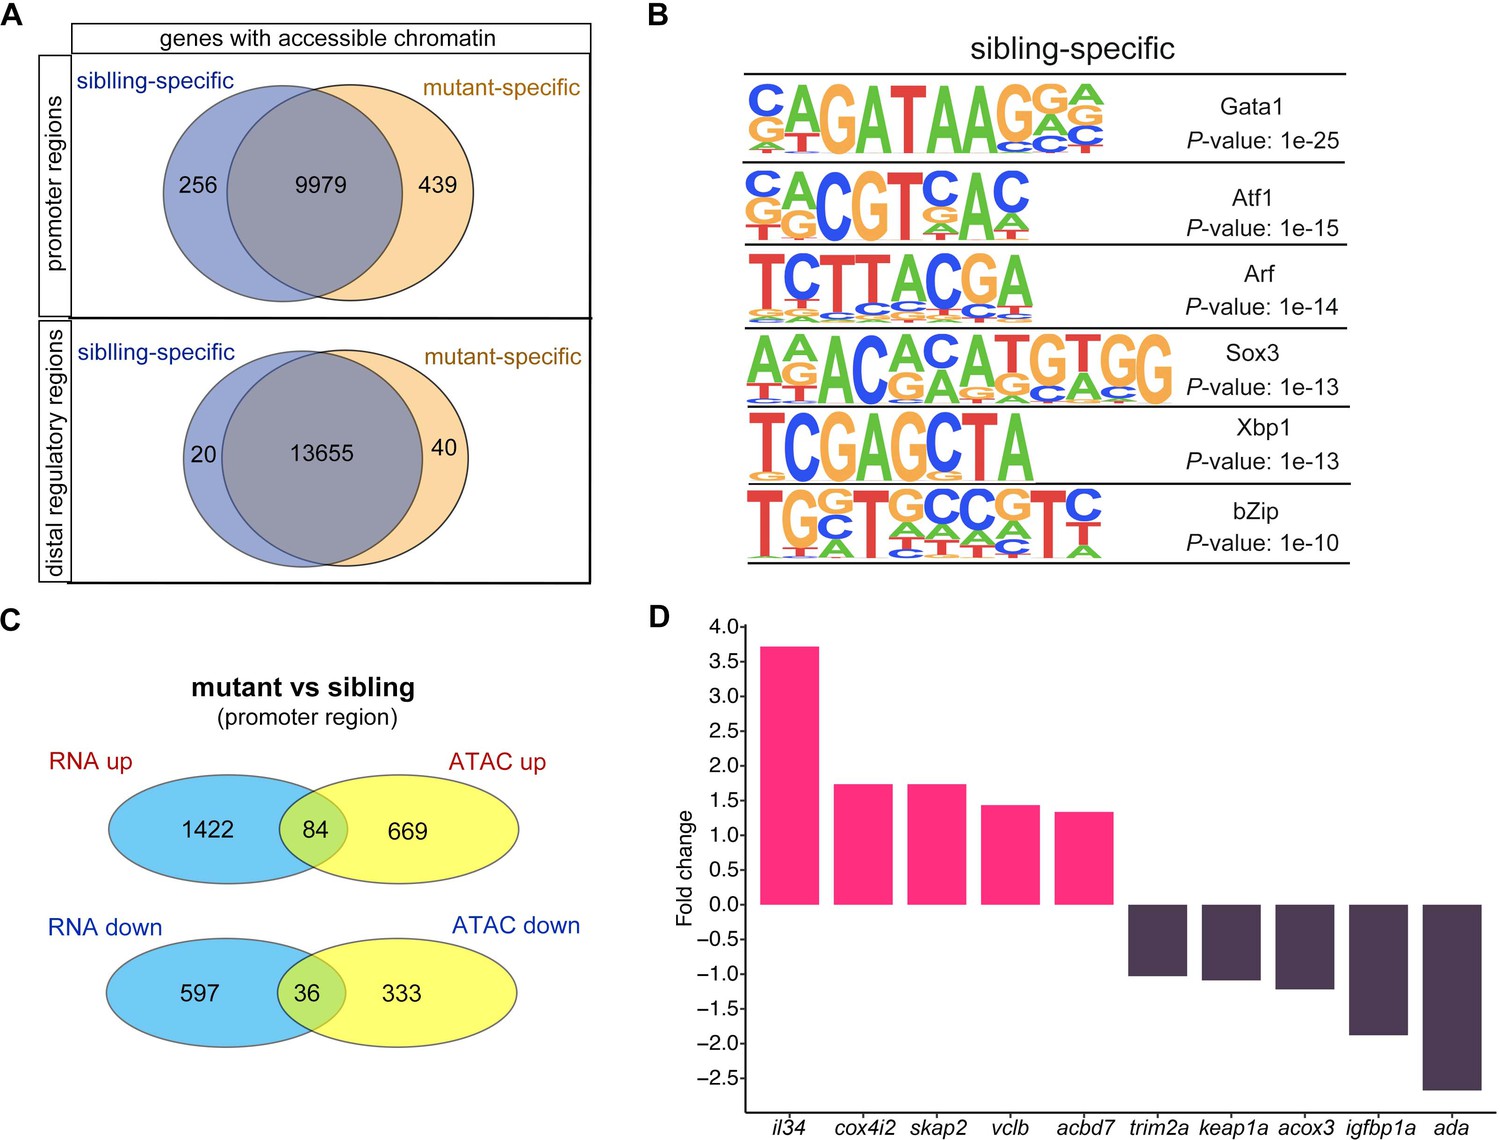
(A) Venn plot showing the genes of sibling and mutant specific accessible chromatin regions at promoter and distal regulator regions, respectively. (B) Motifs enriched in nucleosome-free regions (NFRs) with lost accessibility after smarca5 deletion. (C) Venn plot showing the overlap of genes with specific accessible chromatin at promoter regions and upregulated expression in mutant (top) and sibling (bottom) RBCs, respectively. Genes for ATAC-seq were assigned by differential accessible regions. (D) Bar plot showing the selected sibling and mutant-specific differential expression genes. Fold change, log2 fold change.
Figure 5—figure supplement 1
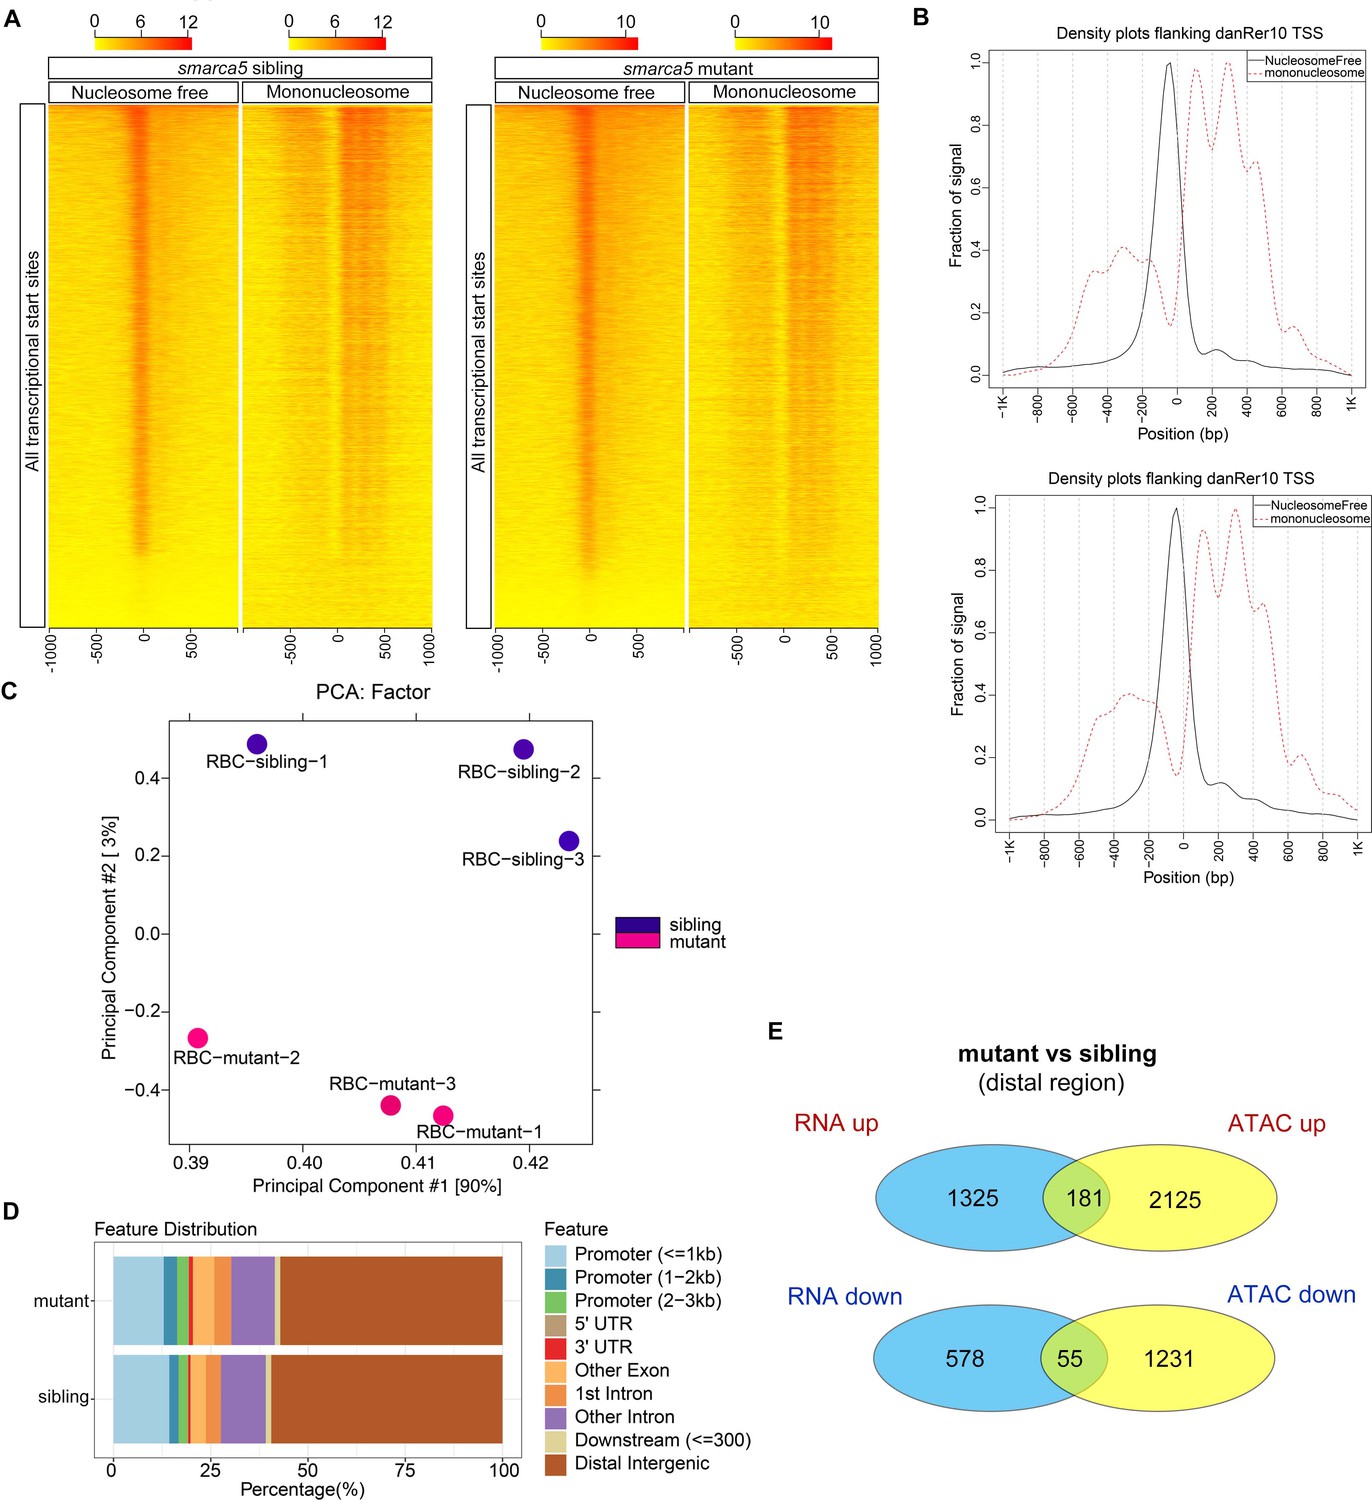
ATAC-seq analysis for RBCs in smarca5zko1049a and their siblings.
(A) Heatmaps showing density of mapped ATAC-seq reads from single biological replicates 1 kb up and downstream of transcriptional start sites (TSS) in danRer10. Separate heatmaps for fragments of nucleosome free (less than 100 bp) and mononucleosome (between 180 and 247 bp) are shown. (B) Density plots flanking danRer10 TSS from sibling and mutant RBCs for mapped reads shown in (A). (C) PCA plot of biological replicates using all ATAC-seq peaks. (D) Bar plot drew by ChIPseeker showing the feature distributions of mutant-ATAC-seq peaks and sibling-ATAC-seq peaks across the genome. (E) Venn plot showing the overlap of genes with specific accessible chromatin at distal regions and up-regulated expression in mutant (top) and sibling (bottom) RBCs, respectively. Genes for ATAC-seq were assigned by differential accessible regions.
Figure 6 with 2 supplements
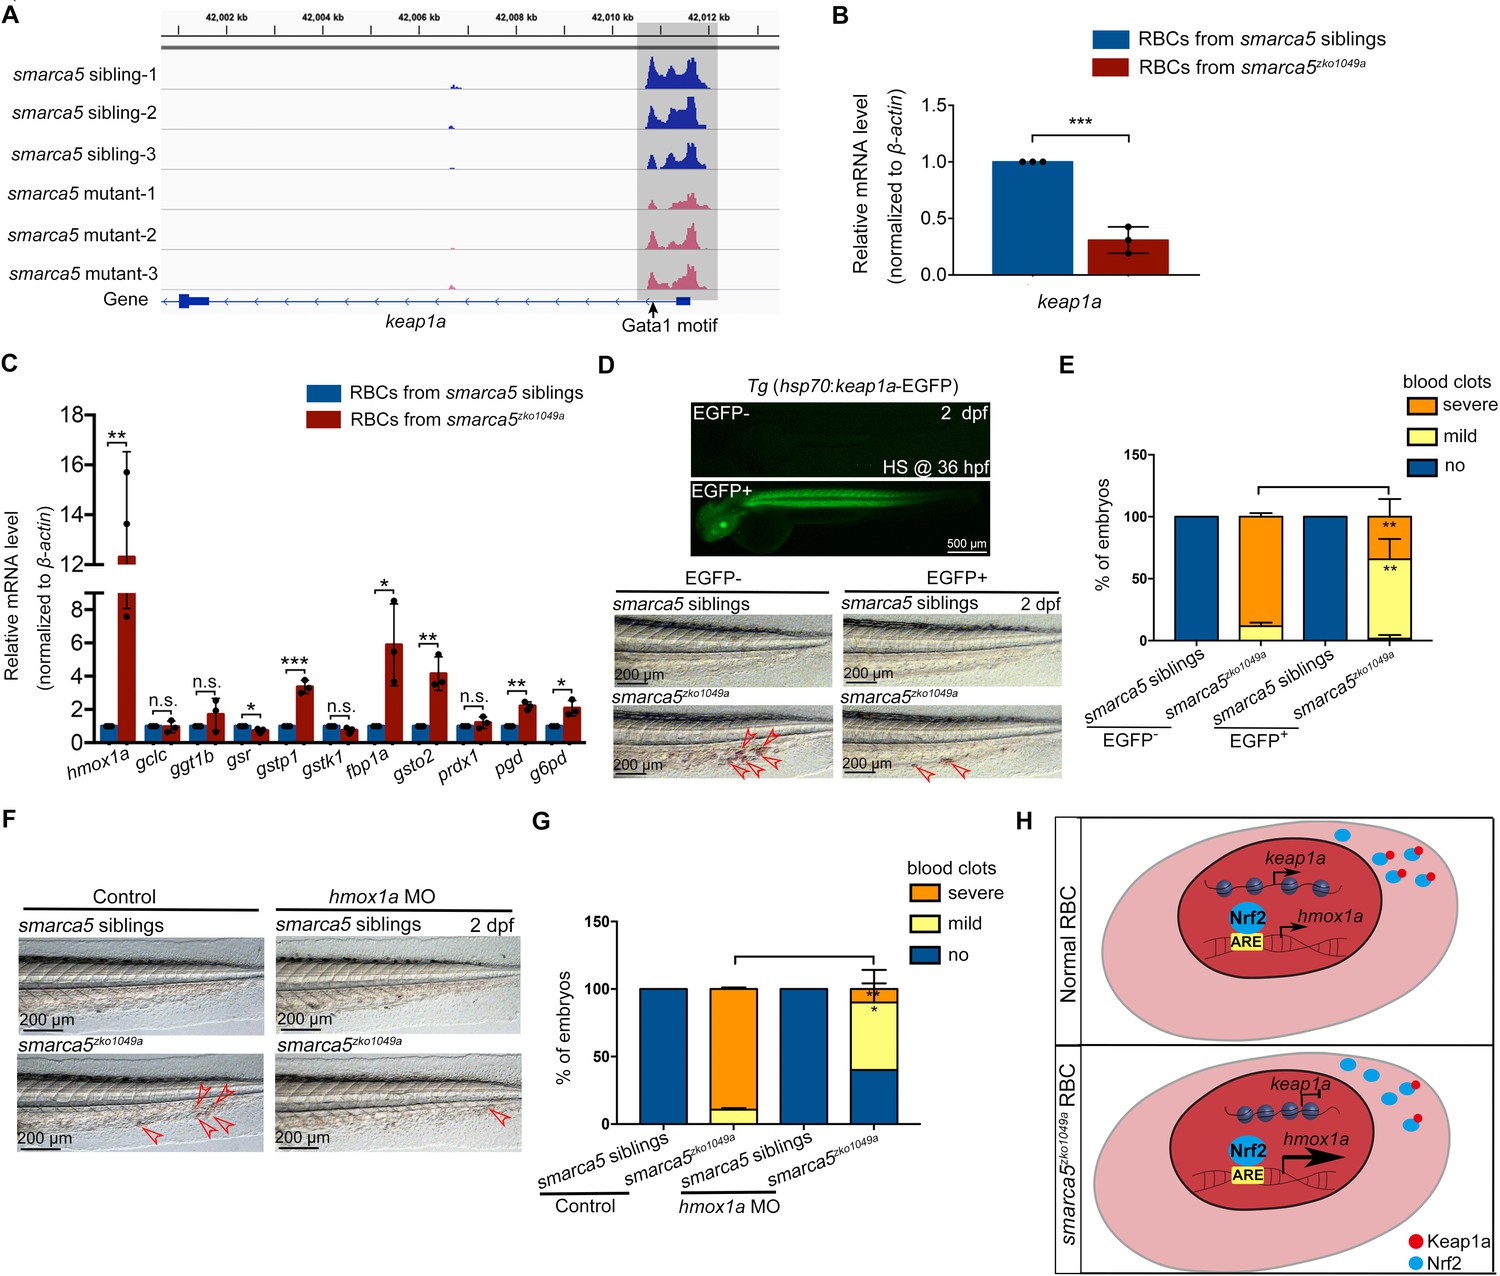
Keap1-Nrf2 signaling pathway acts at downstream of Smarca5 in regulating RBC aggregation.
(A) The browser views showing the ATAC-seq peaks in keap1a promoter with in smarca5zko1049a and their siblings. Gray box indicates the change of ATAC-seq peaks after smarca5 deletion. The location of Gata1 motif at keap1a promoter is indicated by arrow. (B) qPCR analysis showing the expression of keap1a in RBCs from smarca5zko1049a and their siblings at 2 dpf. (C) qPCR analysis showing the expression of hmox1a, gclc, ggt1b, gsr, gstp1, gstk1, fbp1a, gsto2, prdx1, pgd and g6pd in RBCs from smarca5zko1049a and their siblings at 2 dpf. (D) The imaging of EGFP fluorescence in Tg (hsp70:keap1a-EGFP) embryos at 2 dpf. Heat shock was performed at 36 hpf. The bright-field of tail region in smarca5zko1049a and their siblings, with or without Smarca5 overexpression at 2 dpf. (E) The quantification of blood clots phenotype in (D). (F) The bright-field of tail region in smarca5zko1049a and their siblings, in control group and with hmox1a MO injection. The blood clots are indicated by arrow heads. (G) The quantification of blood clots phenotype in (F). (H) Schematic representation of Smarca5 in regulating erythrocyte aggregation via Keap1-Nrf2 signaling. In cytoplasm, Keap1 could anchor to Nrf2 to facilitate the Nrf2 degradation, while the release of Nrf2 to the nucleus could activate the expression of oxidation defense factors. In smarca5-deficient RBCs, the chromatin accessibility at keap1a promoters and the transcription of keap1a were decreased, which led to the excessive activation of hmox1a. Data are mean ± s.d. (B, C, E, G). Asterisk presents statistical significance (*p < 0.05, **p < 0.01, ***p < 0.001, n.s. not significant). p Values were calculated by two-tailed unpaired Student’s t-test.
Figure 6—figure supplement 1
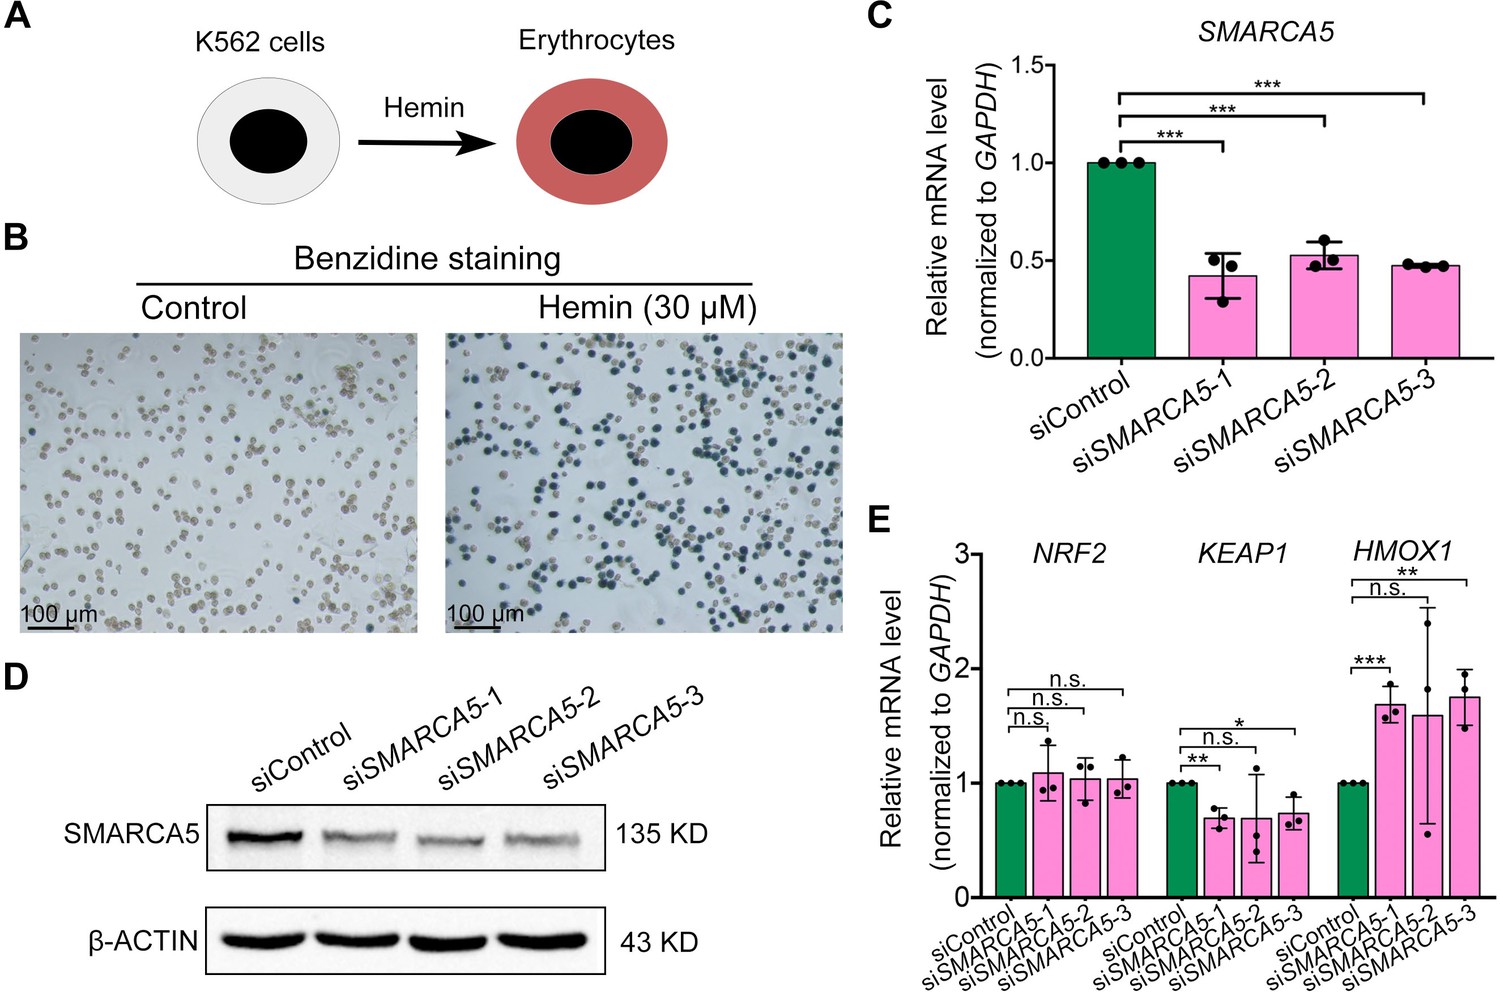
The upregulation of HMOX1 in hemin-induced K562 cells after knockdown of SMARCA5.
(A) Schematic representation the induction of erythroid differentiation of K562 cells using hemin. (B) Benzidine staining of K562 cells in control group and with hemin treatment. (C) qPCR analysis showing the expression of SMARCA5 in control (siControl) and after SMARCA5 knockdown (siSMARCA5-1, siSMARCA5-2, siSMARCA5-3). The expression level of SMARCA5 was normalized to Gapdh. (D) Western blot showing the protein level of SMARCA5 in control and after SMARCA5 knockdown. (E) qPCR analysis showing the expression of NRF2, KEAP1, and HMOX1 in control and after SMARCA5 knockdown. Data are mean ± s.d. (C and E). Asterisk presents statistical significance (*p < 0.05, **p < 0.01, ***p < 0.001, n.s. not significant). p Values were calculated by two-tailed unpaired Student’s t-test.
-
Figure 6—figure supplement 1—source data 1
Full raw unedited blots from Figure 6—figure supplement 1D.
- https://cdn.elifesciences.org/articles/72557/elife-72557-fig6-figsupp1-data1-v2.zip
-
Figure 6—figure supplement 1—source data 2
Uncropped blots from Figure 6—figure supplement 1D with the relevant bands clearly labelled.
- https://cdn.elifesciences.org/articles/72557/elife-72557-fig6-figsupp1-data2-v2.zip
Figure 6—figure supplement 2
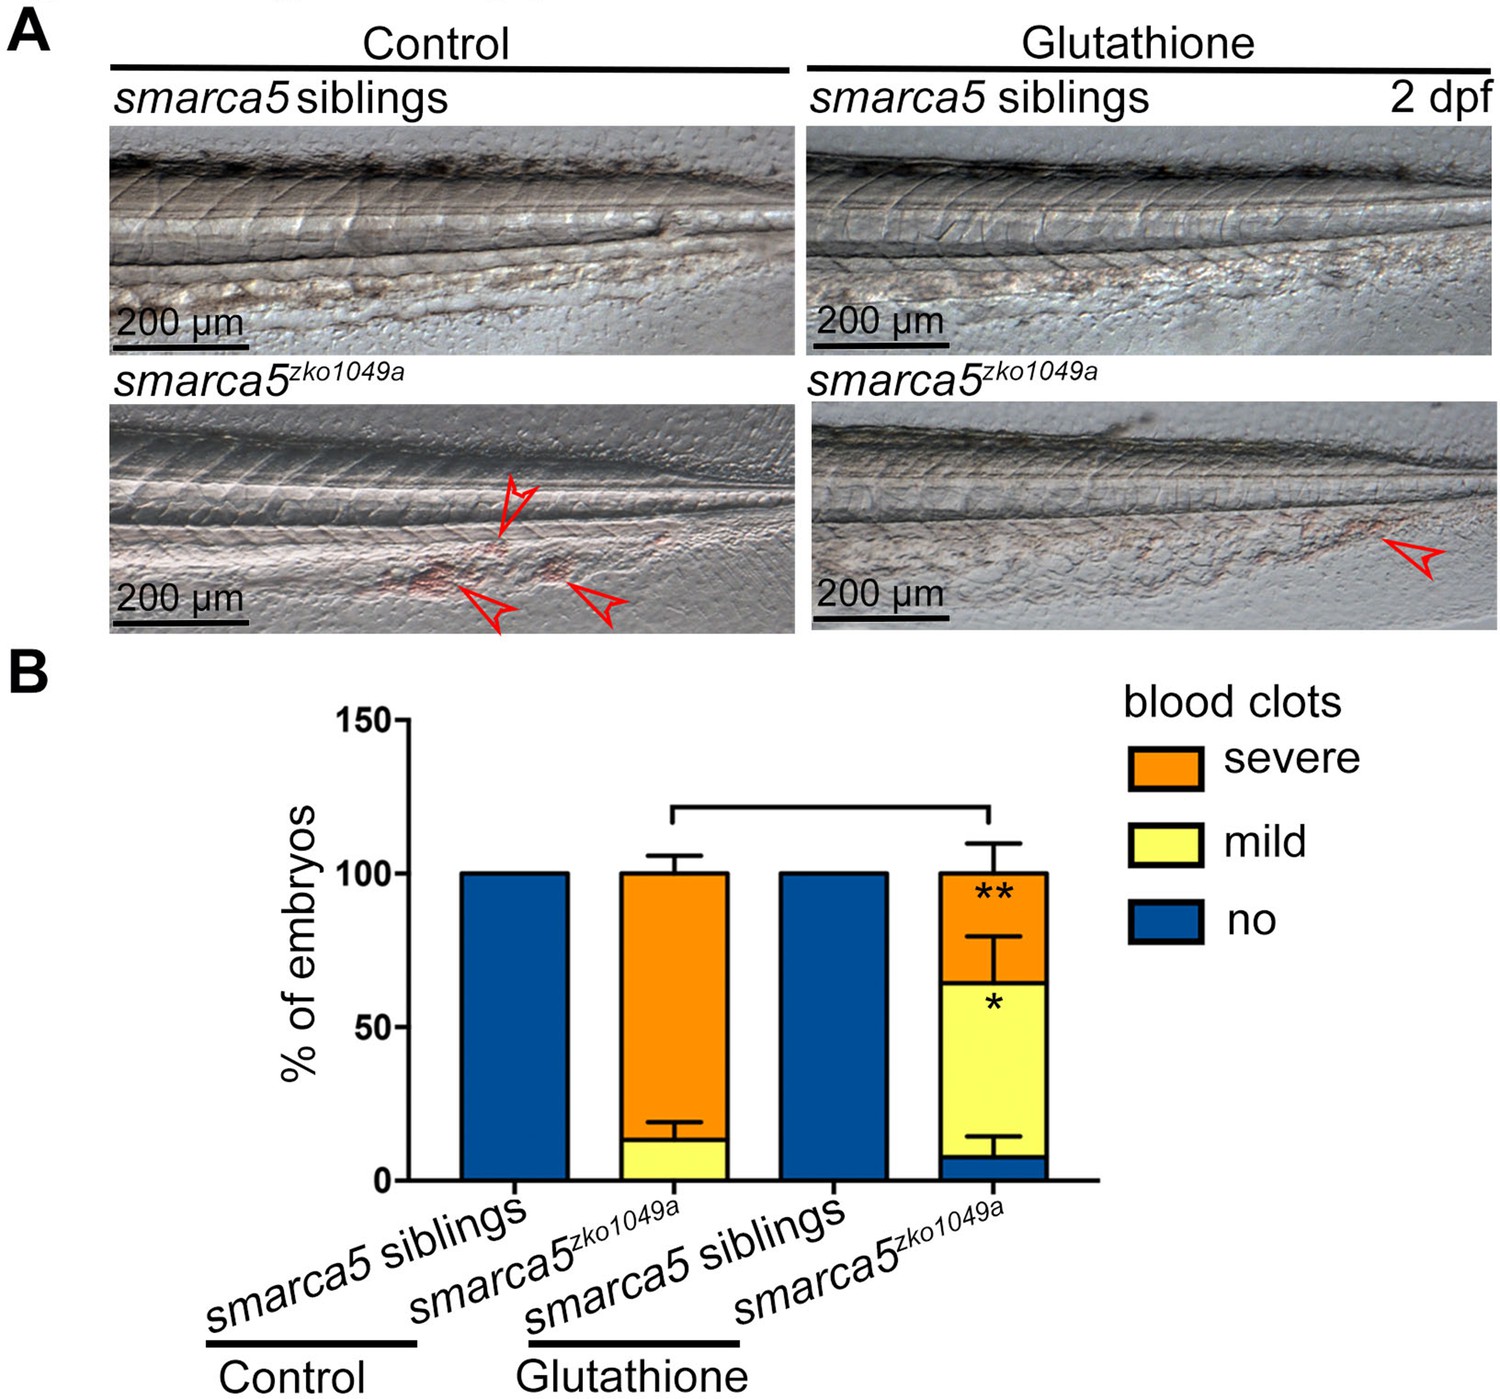
The free radical generation may play a major role in RBC aggregation in smarca5zko1049a.
(A) The bright-field of tail region in smarca5zko1049a at 2 dpf in control group and with glutathione treatment. The blood clots are indicated by arrow heads. (B) The quantification of blood clots phenotype in (A). Data are mean ± s.d. (B). Asterisk presents statistical significance (*p < 0.05, **p < 0.01). p Values were calculated by two-tailed unpaired Student’s t-test.
Videos
Video 1
The behavior of circulating RBCs in the tail region of sibling embryos.
The time lapse imaging of sibling embryos with Tg (gata1:dsRed) background from 36 hpf to 2 dpf.
Video 2
The behavior of circulating RBCs in the tail region of smarca5zko1049a.
The time lapse imaging of smarca5zko1049a with Tg (gata1:dsRed) background from 36 hpf to 2 dpf.
Additional files
-
Supplementary file 1
The detailed information of qPCR primers, MOs and siRNAs used in this work.
(A) The detailed primers used for qPCR. (B) The detailed sequence and dosage of MOs used in this work. (C) The detailed sequences of siRNAs used in this work.
- https://cdn.elifesciences.org/articles/72557/elife-72557-supp1-v2.docx
-
Transparent reporting form
- https://cdn.elifesciences.org/articles/72557/elife-72557-transrepform1-v2.docx
Download links
A two-part list of links to download the article, or parts of the article, in various formats.
Downloads (link to download the article as PDF)
Open citations (links to open the citations from this article in various online reference manager services)
Cite this article (links to download the citations from this article in formats compatible with various reference manager tools)
The chromatin-remodeling enzyme Smarca5 regulates erythrocyte aggregation via Keap1-Nrf2 signaling
eLife 10:e72557.
https://doi.org/10.7554/eLife.72557


