Biallelic mutations in calcium release activated channel regulator 2A (CRACR2A) cause a primary immunodeficiency disorder
- Department of Physiology, David Geffen School of Medicine, UCLA, United States
- Leeds Institute of Medical Research, University of Leeds, United Kingdom
- Division of Haematology and Immunology, Leeds Institute of Medical Research, University of Leeds, United Kingdom
- Global Health Institute, School of Life Sciences, École Polytechnique Fédérale de Lausanne, Switzerland
- Department of Clinical Immunology and Allergy, St James's University Hospital, United Kingdom
- Leeds Institute of Cardiovascular and Metabolic Medicine, University of Leeds, United Kingdom
- National Institute for Health Research-Leeds Biomedical Research Centre and Leeds Institute of Rheumatic and Musculoskeletal Medicine, Wellcome Trust Brenner Building, St James's University Hospital, United Kingdom
Figures
Figure 1 with 1 supplement
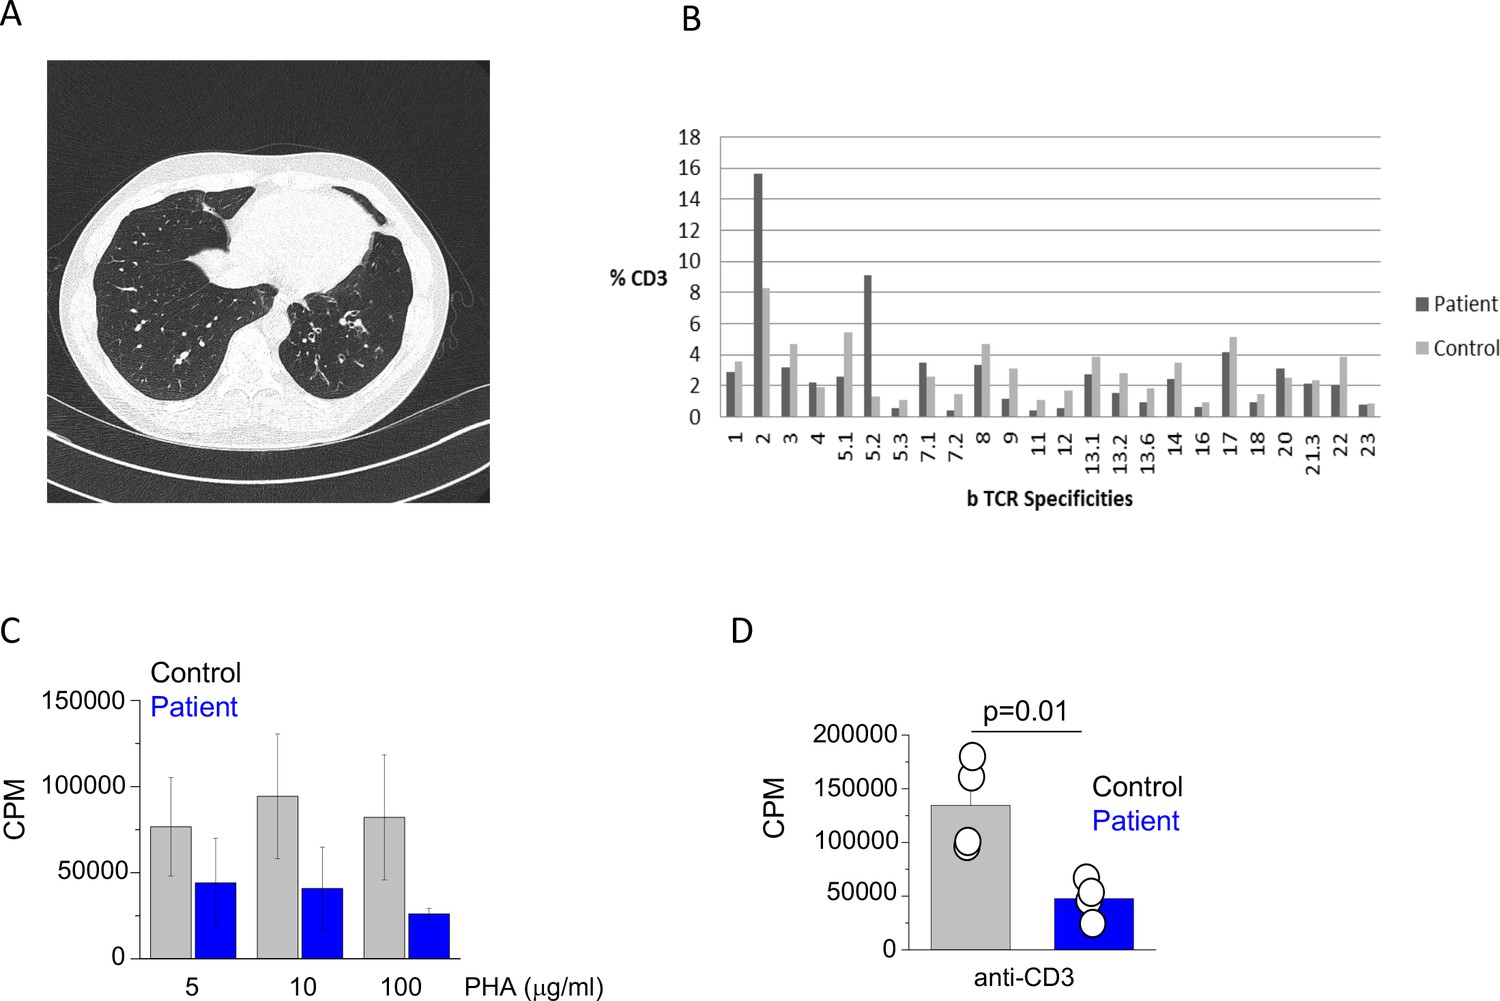
Clinical and immunological features of index patient.
(A) A computerized tomography scan of the chest showing area of cylindrical bronchiectasis at the basal segment of the left lower lobe. (B) TCR repertoire as assessed by T receptor spectraphenotyping. Data are representative of one independent assay. (C) Phytohaemagglutinin (PHA) and (D) anti-CD3 T cell proliferation. CPM (counts per minute). Data are representative of three independent assays.
Figure 1—figure supplement 1

T helper (TH) TH1, TH2, and TH17 peripheral blood phenotyping.
(A) T-helper (Th) 1, Th2 and Th17 cell distribution among CD4+ T cells in the peripheral blood. Grey bars healthy controls (N = 6), blue bars patient (two separate evaluations). (B) Representative dot plot shows the gating strategy. Whole EDTA blood was stained with a combination of CD3-V500, CD4-BV421, CCR6-Pe, and CXCR3-Alexa-Fluoro 647.
Figure 2
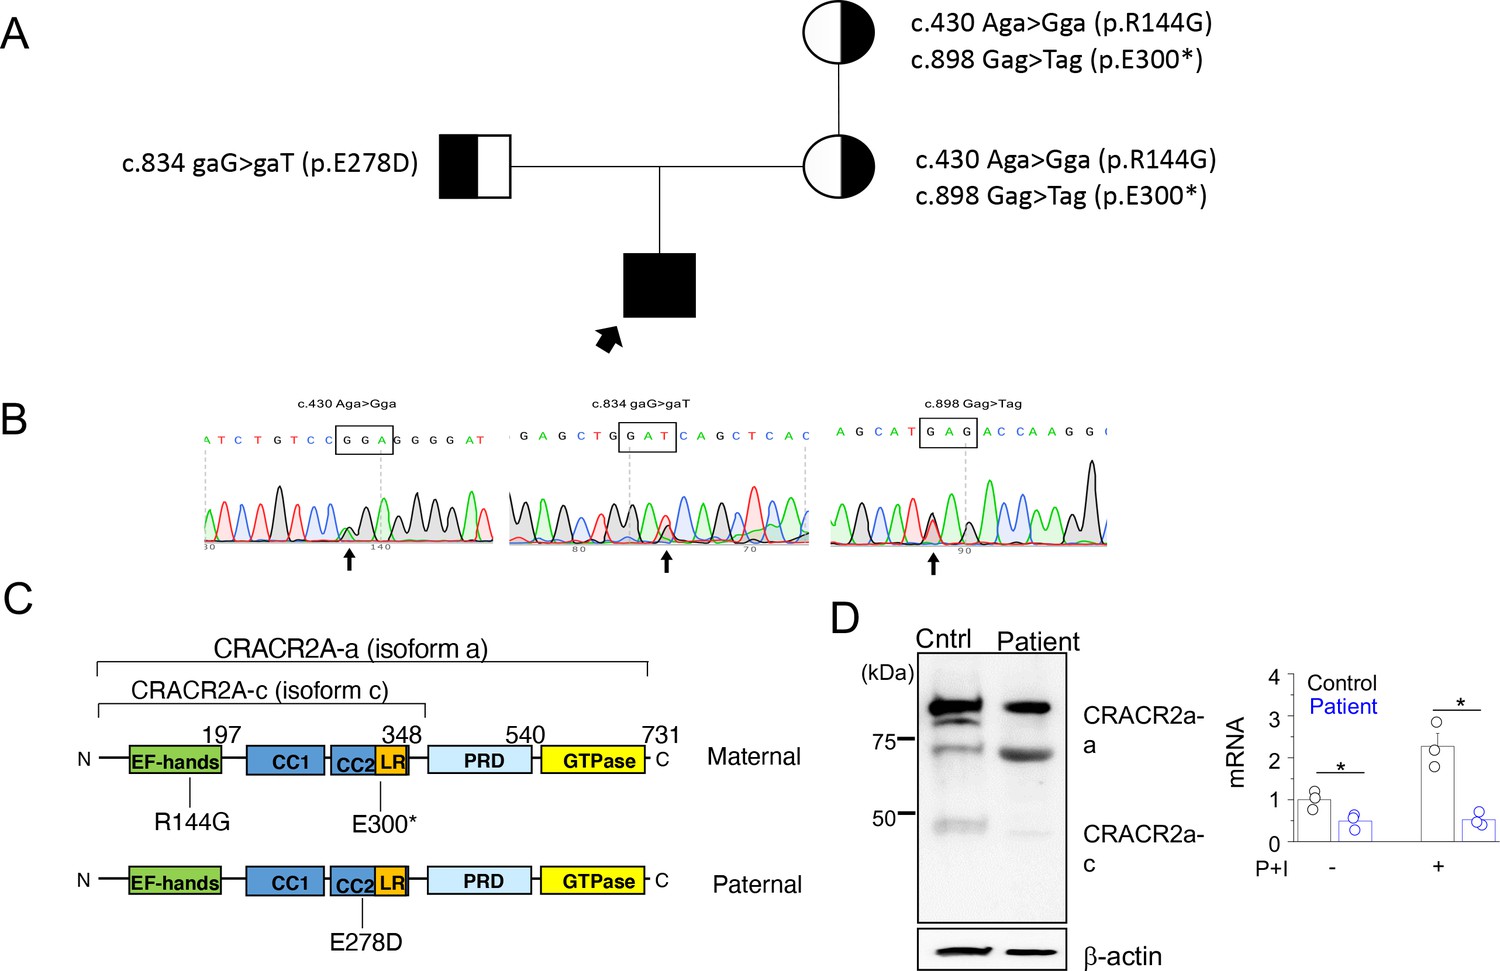
A rare biallelic mutation in CRACR2A segregates with the disease.
(A) Pedigree showing the index case and p.[R144G/E300*] and p.E278D CRACR2A variant carriers. The circles and squares represent female and male members, respectively. Black shading shows affected individuals, either heterozygous (partial black) or homozygous (completely black). (B) Sanger sequencing data of the proband showing the indicated mutations. (C) Schematic of human CRACR2A showing the location of compound heterozygous mutations from the patient’s alleles. The maternal allele comprised of an p.R144G variant that was located in the EF-hand motif and an p.E300* truncation variant within the leucine-rich region (LR). The paternal allele contained the p.E278D variant that was located in the coiled-coil domain 2 (CC1 and CC2). CRACR2A also contains a proline-rich domain (PRD) and a C-terminal Rab GTPase domain. (D) Detection of CRACR2A in human PBMCs harvested from healthy control and patient by immunoblotting (left) and real-time quantitative RT-PCR (right). For qRT-PCR, cells were left unstimulated or re-stimulated with PMA plus ionomycin for 5 hr. β-actin was used as a loading control for immunoblotting. Immunoblot is representative of two independent experiments and mRNA analysis shows representative triplicate from two independent experiments. * p < 0.05.
Figure 3

Patient B cell responses to T cell-dependent (TD) stimulation.
(A) Schematic representation of the culture conditions used to assess plasma cell differentiation in vitro. PBs – Plasmablasts, PCs – Plasma cells (B) Representative flow plots showing CD38 and CD138 expression profile following TD stimulation with F(ab’)two anti-IgG/M and CD40L. Percentages are indicated within individual quadrants. Data are representative of 2 independent assays. (C) Secreted levels of IgM (left) and IgG (right) from the cells in (B) at indicated time points. HC1-5 (Healthy control) represents data from five independent healthy donor cells.
Figure 4 with 1 supplement
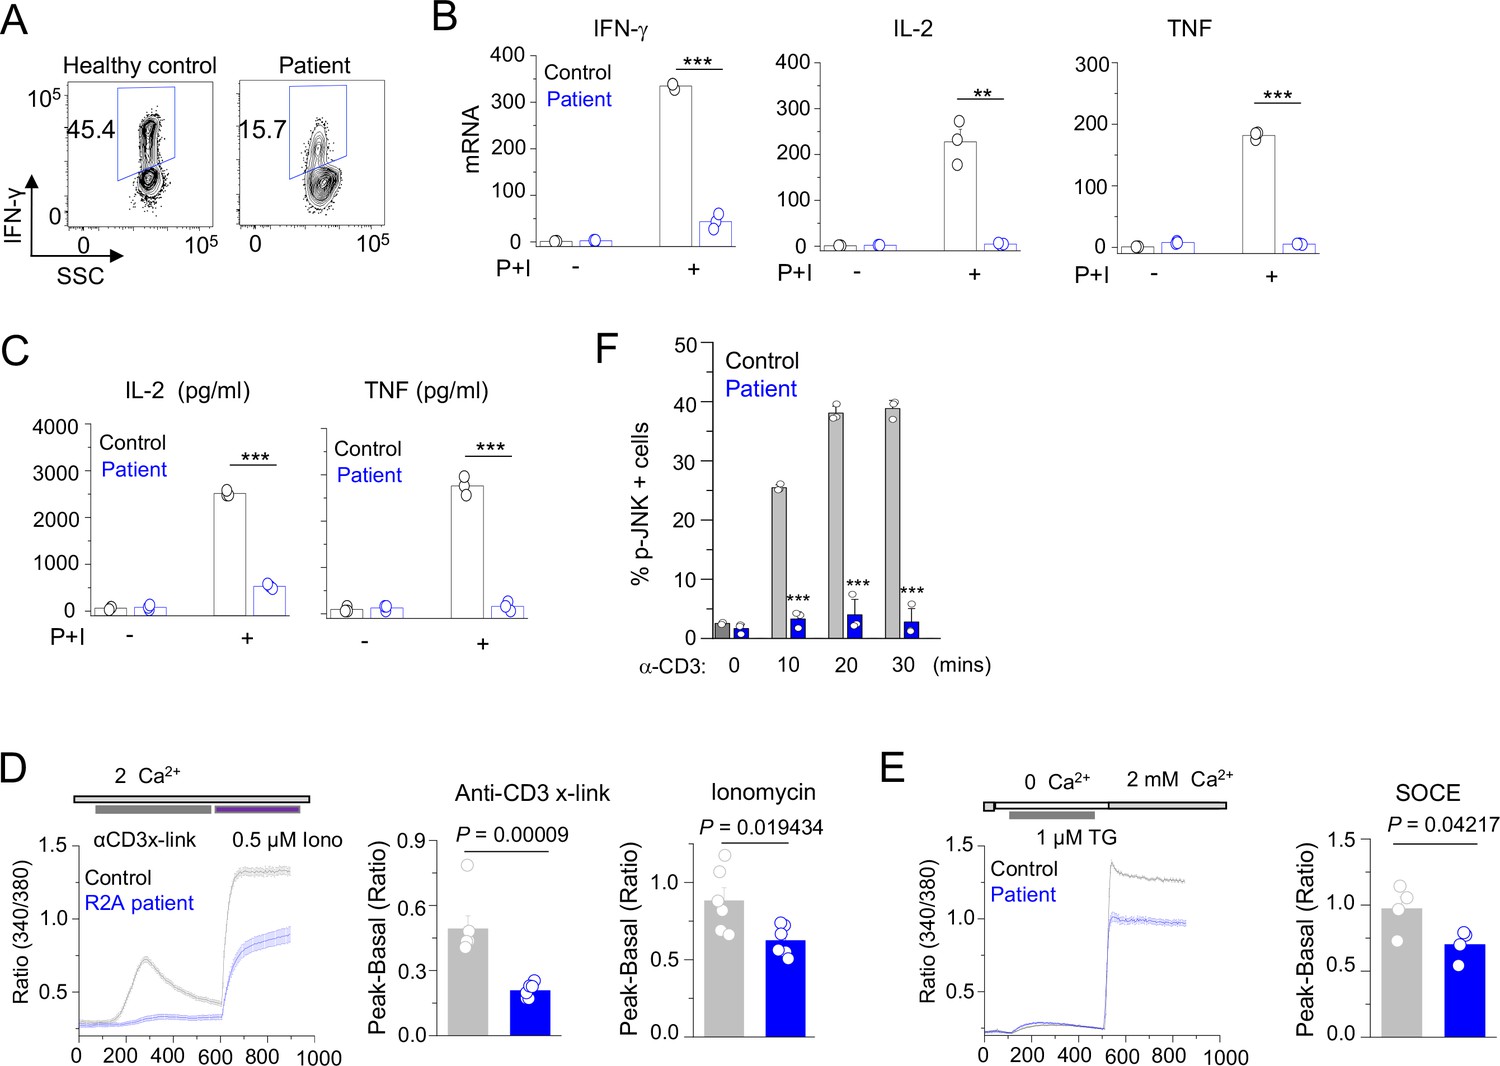
Patient T cell responses to T cell receptor stimulation.
(A) Representative flow plots showing expression of IFN-γ in human PBMCs from a healthy donor and the patient. PBMCs were stimulated with anti-CD3 and anti-CD28 antibodies for 48 hr and cultured for further 4 days in the presence of IL-2 before re-stimulation with PMA plus ionomycin for 5 hr for cytokine analysis. Cells were gated for CD4+ T cells. (B) Quantitative mRNA expression analysis (± s.d.m.) of indicated cytokines from human PBMCs (cultured as mentioned above) with or without stimulation with PMA plus ionomycin for 5 hr. (C) Levels of IL-2 and TNF in human PBMCs from culture supernatants of cells stimulated as described above (B) were determined by ELISA. (D) Representative traces showing averaged (± SEM) SOCE responses from healthy control and patient PBMCs (cultured as indicated in A), after transient stimulation with anti-CD3 antibody cross-linking, or ionomycin (0.5 µM) in the presence of external solution containing 2 mM Ca2+ (left) as indicated. Bar graphs show baseline subtracted ratio values for anti-CD3 antibody cross-linking or ionomycin (average± SEM) from six independent experiments (right). (E) Representative traces showing averaged (± SEM) SOCE responses from healthy control and patient PBMCs (cultured as indicated in A), after store-depletion with thapsigargin (1 µM) stimulation in Ca2+-free Ringer’s solution. SOCE was measured by addition of 2 mM Ca2+-containing Ringer’s solution as indicated (left). Bar graph shows baseline subtracted ratio values at the peak of SOCE (average± SEM) from four independent experiments (right). (F) Phosphorylated JNK levels in CD4+ T cells from healthy control and patient PBMCs (cultured as indicated in A), stimulated with anti-CD3 antibody for indicated times. Bar graphs show average± SEM from three independent experiments. ** p < 0.005, *** p < 0.0001.
Figure 4—figure supplement 1
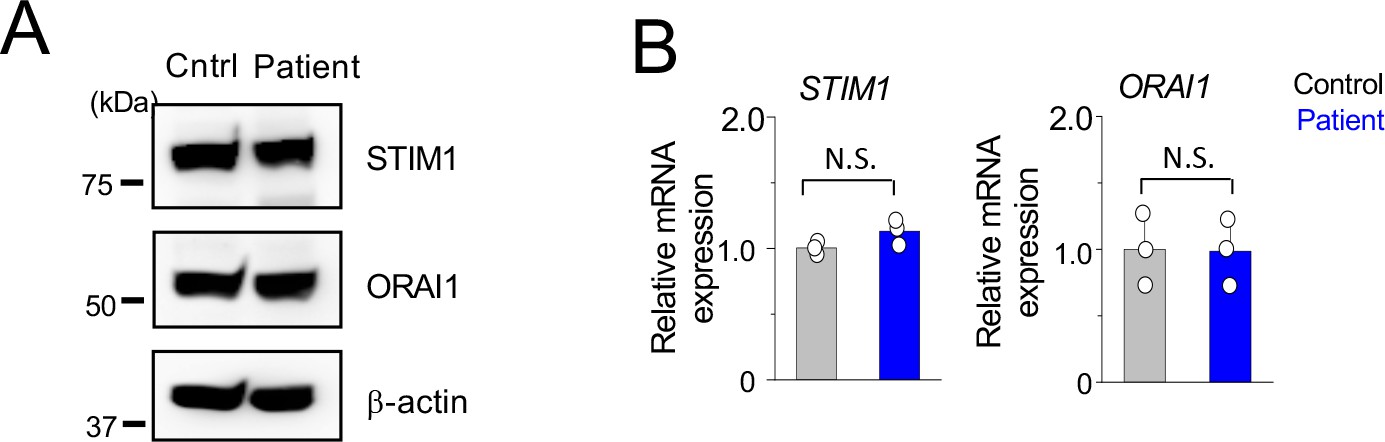
Expression of ORAI1 and STIM1 in PBMCs from healthy control and patient.
(A) Representative immunoblot showing expression of indicated proteins in PBMC lysates from control and patient. (B) Relative transcript expression of indicated genes from PBMCs of healthy control and patient using real-time quantitative RT-PCR measurements.
Figure 5 with 1 supplement

Cytokine expression profiles in T cells expressing individual allelic mutations in CRACR2A.
(A) Representative flow plots showing expression of IL-2 in control or CRACR2A KO Jurkat T cells stably expressing FLAG-tagged WT CRACR2A, CRACR2AE278D (E278D), or CRACR2AR144G/E300* (DM) after stimulation with PMA plus ionomycin for 16 hr (left). Bar graph shows means ± s.e.m. of pooled technical replicates from two independent experiments (right). (B) Representative flow plots showing expression of IFN-γ in primary human CD4+ T cells transduced with lentiviruses encoding CRACR2A-targeting sgRNA and those encoding cDNAs of WT or indicated mutants of CRACR2A after stimulation with anti-CD3 and anti-CD28 antibodies for 5 hr (left). Bar graph (right) shows means ± s.e.m. of pooled technical replicates from three independent experiments. (C) Representative flow plots showing expression of IFN-γ in primary human CD4+ T cells purified from healthy donors and transduced with lentiviruses encoding cDNAs for WT or indicated mutant of CRACR2A after stimulation with anti-CD3 and anti-CD28 antibodies for 5 hr (left). Bar graph (right) shows means ± s.e.m. of pooled technical replicates from three independent experiments. * p < 0.05, *** p < 0.0001.
Figure 5—figure supplement 1
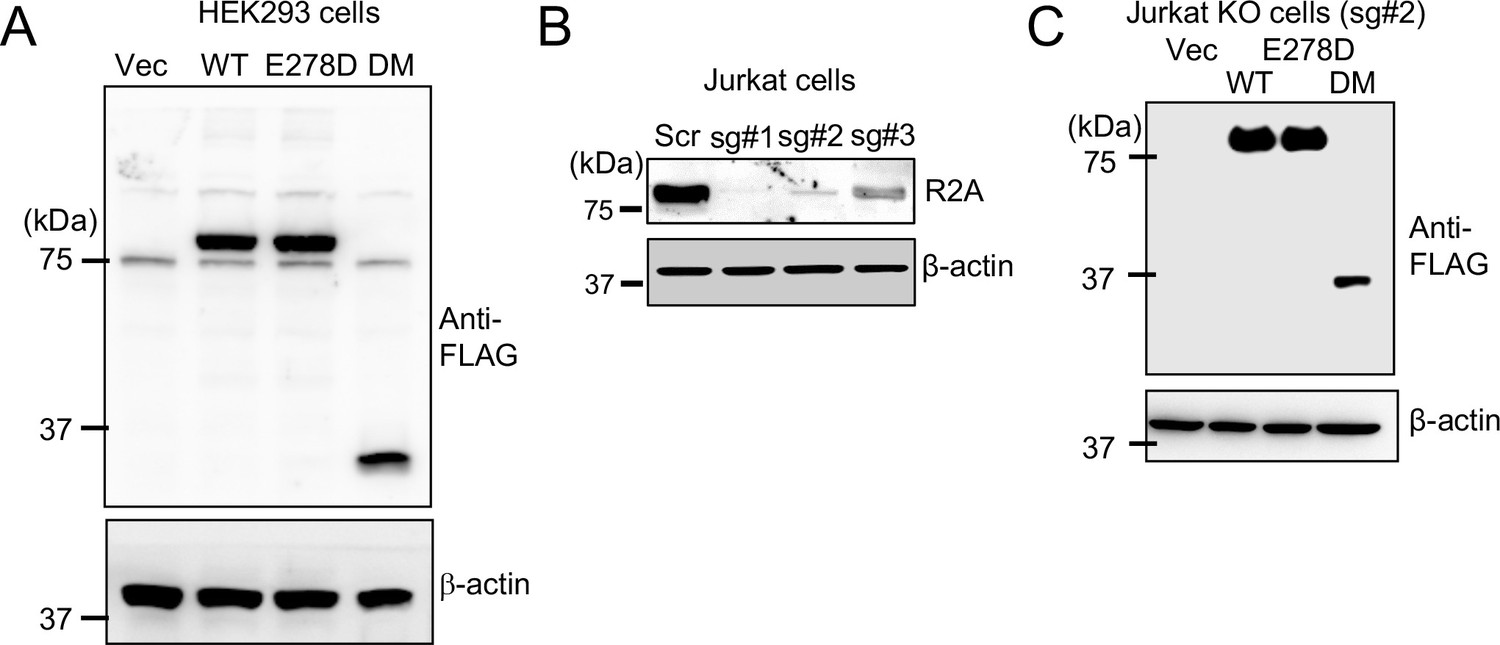
Expression profile of individual allelic mutants of CRACR2A in different cell types.
(A) Lysates of HEK293 cells stably expressing N-terminally FLAG-tagged WT or indicated mutants of CRACR2A were immunoblotted with anti-FLAG antibody. (B) Representative immunoblot showing endogenous CRACR2A expression in lysates of Jurkat T cells expressing control sgRNA or three different CRACR2A-targeting sgRNAs (# 1, #2, and #3). (C) Lysates of CRACR2A KO Jurkat T cells (sgRNA#2) stably expressing N-terminally FLAG-tagged WT or mutant CRACR2A were immunoblotted for detection of indicated proteins. β-actin – loading control.
Figure 6
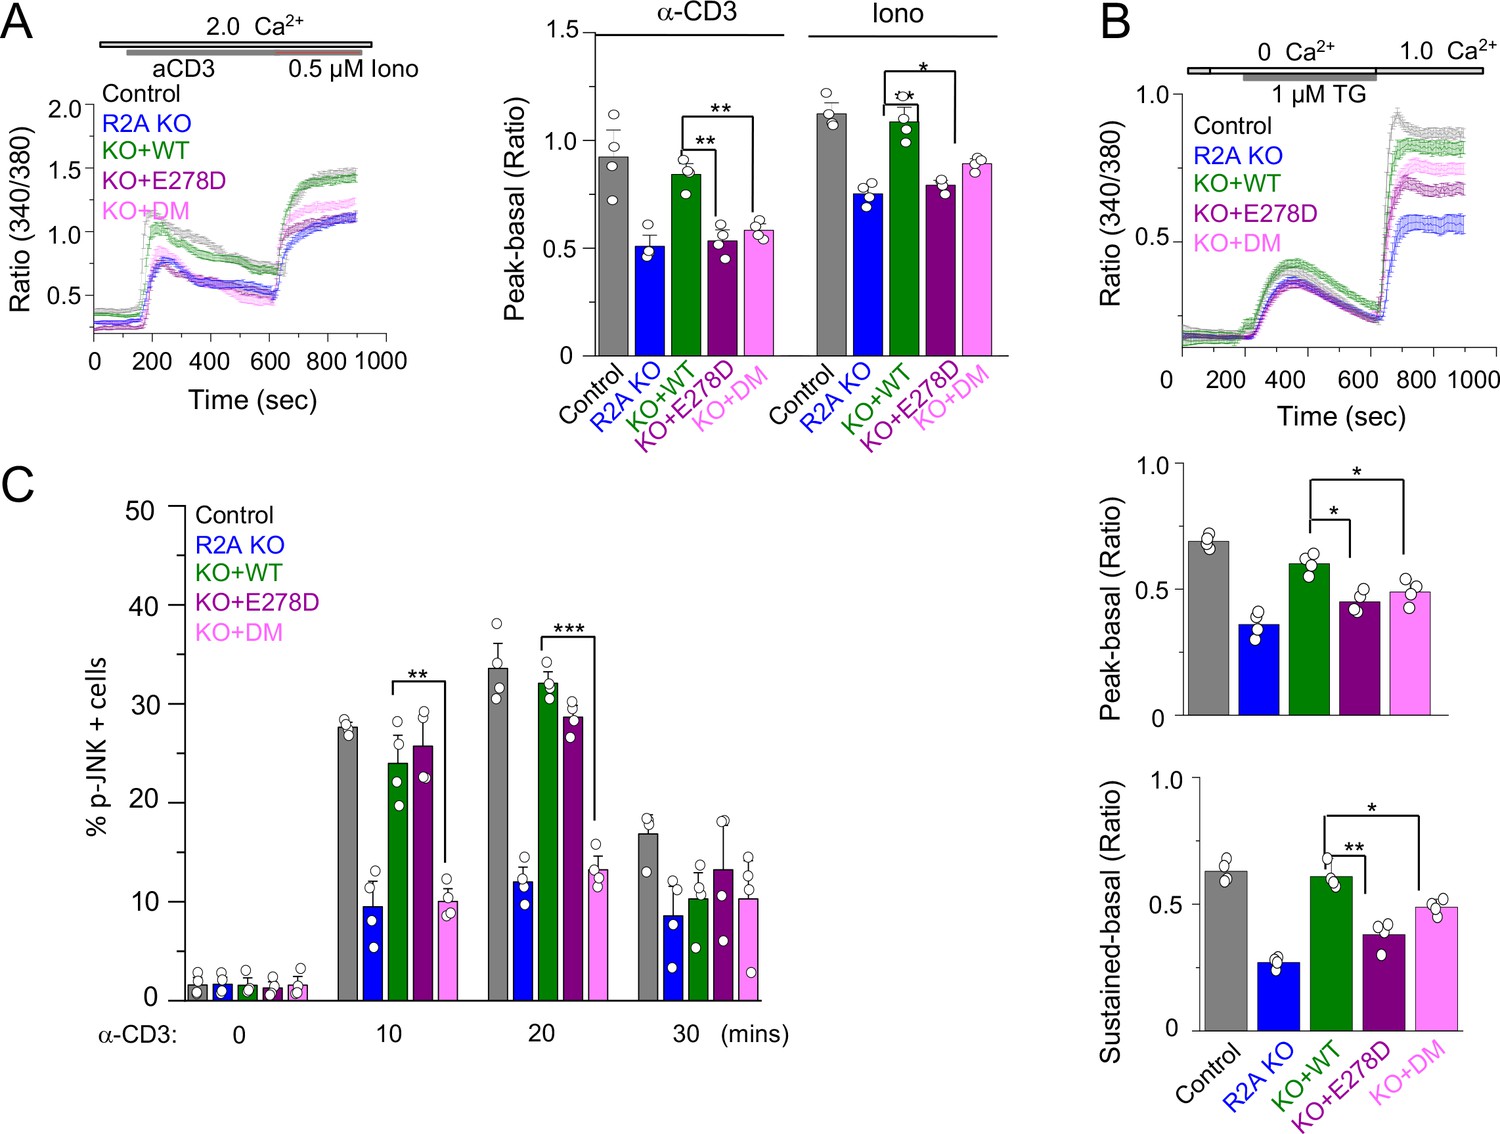
SOCE and JNK phosphorylation in T cells expressing individual allelic mutations in CRACR2A.
(A) Representative traces showing averaged SOCE from control (48 cells) or CRACR2A-KO Jurkat T cells (KO) transduced with an empty vector (55 cells) or those encoding FLAG-tagged WT CRACR2A (45 cells), CRACR2AE278D (E278D, 40 cells), or CRACR2AR144G/E300* (DM, 50 cells) mutants (left). Cells were stimulated with anti-CD3 antibodies, followed by ionomycin treatment in the presence of external solution containing 2 mM Ca2+. Bar graphs show averaged baseline subtracted peak SOCE (± s.e.m.) from anti-CD3 antibody and ionomycin treatments, from three independent experiments (right). (B) Representative traces showing averaged SOCE induced by thapsigargin (TG) treatment from control (52 cells) or CRACR2A-KO Jurkat T cells (KO) transduced with empty vector (46 cells) or those encoding FLAG-tagged WT CRACR2A (49 cells), CRACR2AE278D (E278D, 51 cells), or CRACR2AR144G/E300* (DM, 50 cells) mutants (top). Cells were stimulated with thapsigargin in Ca2+-free solution to deplete the intracellular stores and exposed to external solution containing 2.0 mM Ca2+. Bar graphs below show averaged baseline subtracted SOCE levels (± s.e.m.) at the peak (center) or later time point (sustained – 900 s, bottom) from three independent experiments. (C) Phosphorylated JNK levels in control or CRACR2A KO Jurkat T cells stably expressing WT and indicated mutants of CRACR2A, stimulated with anti-CD3 antibody for indicated times. Graphs show average± SDM from three independent experiments. * p < 0.05, ** p < 0.005, *** p < 0.0001.
Figure 7
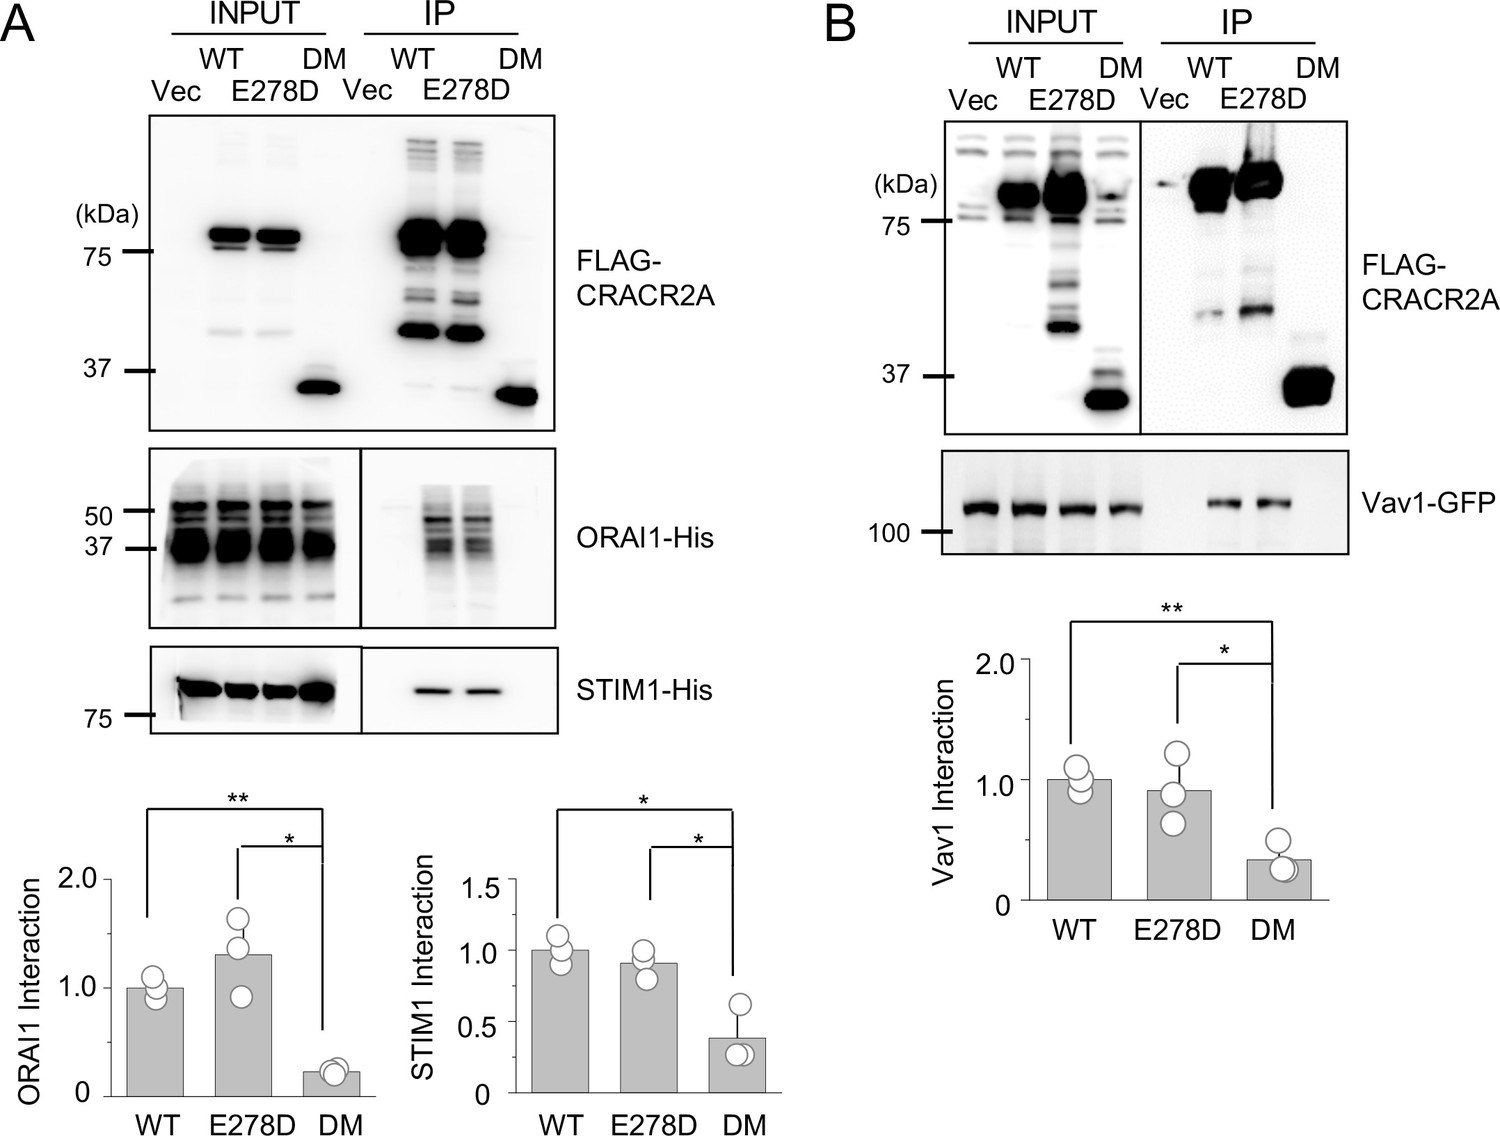
Biochemical interactions and localization profiles of individual allelic mutations in CRACR2A.
(A) Immunoprecipitation for detection of binding between WT and indicated mutants of CRACR2A (E278D, or DM) with ORAI1/STIM1. Lysates of HEK293T cells expressing FLAG-tagged CRACR2A in the presence of 6 X His-tagged ORAI1 and STIM1, were subjected to immunoprecipitation with anti-FLAG antibodies and analyzed by immunoblotting for detection of the indicated proteins. Bar graphs below show densitometry analysis of binding of CRACR2A to ORAI1 (left) and STIM1 (right), normalized to that of WT CRACR2A, from three independent experiments. (B) Immunoprecipitation for detection of binding between CRACR2A and VAV1. Lysates of HEK293T cells expressing FLAG-tagged WT or indicated mutants of CRACR2A in the presence of GFP-tagged VAV1, were subjected to immunoprecipitation with anti-FLAG antibodies and analyzed by immunoblotting for detection of indicated proteins. Bar graph below shows densitometry analysis of binding of CRACR2A to VAV1, normalized to that of WT CRACR2A, from three independent experiments. (C) Representative confocal images of CRACR2A KO Jurkat cells stably expressing N-terminally FLAG-tagged WT or indicated mutants of CRACR2A under resting conditions (top panels) or 20 min after dropping on stimulatory anti-CD3 antibody-coated coverslips (middle and bottom panels). The top panels showed images from the center of the cell. The middle panels show images from the bottom of the cell, which was in contact with the coverslip and the bottom panels showed images from the center of the anti-CD3 antibody-stimulated cell. F-Actin staining – green, anti-FLAG antibody staining – red. Images are representative of at least 10 cells in each condition. * p < 0.05, ** p < 0.005.
Author response image 1
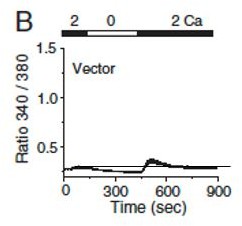
Levels of intracellular Ca2+ are measured in primary T cells by exchanging Ca2+-free solution with that containing 2 mM CaCl2.
Copied from PMID: 22586105.
Tables
Table 1
Immunological characteristics of patient with variants in EFCAB4B.
| Date/year | 2005 | 2011 | 2017 | 2019 | 2021 (Feb) | 2021 (Nov) | Ref | |
|---|---|---|---|---|---|---|---|---|
| Total lymphocyte count | 2,880 | 990 | 1,201 | 1,572 | 1,472 | 1,268 | 1000–2800 cells/µl | |
| CD3+ T cells | 2,505 | 733 | 891 | 990 | 952 | 846 | 700–1200 cells/µl | |
| CD4+ T cell | Total | 216 | 235 | 148 | 165 | 122 | 112 | 300–1400 cells/µl |
| CD27+ CD45RA+ (naïve)% | 20.92 | 12.65 | 25.5 | 14–65% | ||||
| CD27+ CD45RA- (memory)% | 42.34 | 47.04 | 42.9 | 15–52% | ||||
| CD27-CD45RA- (memory effector) % | 36.01 | 37.67 | 20.5 | 8–35% | ||||
| CD27+ CD45RA- | 2.64 | 11.1 | 0–22% | |||||
| CD25+ CD127- (Treg)% | 0.73 | 1.6 | 2.9 | 3.5 | 3–10% | |||
| CD8+ T cells | Total | 2080 | 475 | 738 | 840 | 772 | 689 | 200–900 cells/µl |
| CD27+ CD45RA+ (naïve) | 17.69 | 31.3 | 1.5–65.5% | |||||
| CD27+ CD45RA- (memory) | 25.16 | 19.1 | 3.5–28.6% | |||||
| CD27- CD45RA- (memory effector) | 16.09 | 11.1 | 0.7–72.6% | |||||
| CD27- CD45RA+ (effector) | 41.07 | 38.6 | 1.6–53% | |||||
| CD19+ (B cells) | Total | 245 | 102 | 73 | 77 | 87 | 71 | 100–500 cells/µl |
| CD27- IgM+ IgD + (naïve) % | 63.1 | 89.18 | 67.7 | 78 | 44–84% | |||
| CD24hi CD38hi (Transitional) % | 6.7 | 10.3 | 8.2 | 11 | 2–14% | |||
| CD27+ IgM + IgD+ (non-switched) % | 15.4 | 3.69 | 22.5 | 11 | 5–32% | |||
| CD27+ IgM- IgD- (switched memory) % | 14.7 | 7.15 | 5.7 | 5 | 5–33% | |||
| Plasmablasts % | 0.2 | 0.4 | 1.1 | 1 | 0.2–5% | |||
| CD56+ CD16+ (NK cells) | 144 | 139 | 290 | 486 | 429 | 340 | 90–600 cells/µl | |
| Immunoglobulin profile | ||||||||
| IgG | 1.4 | 8.4 | 10.3 | 8.3 | 9.9 | 6–16 g/l | ||
| IgA | < 0.06 | < 0.06 | < 0.06 | < 0.06 | < 0.06 | 0.8–4 g/l | ||
| IgM | < 0.05 | < 0.05 | < 0.05 | < 0.05 | < 0.05 | 0.5–2 g/l | ||
| IgE | < 0.2 | 1–120 ku/l | ||||||
Key resources table
| Reagent type (species) or resource | Designation | Source or reference | Identifiers | Additional information |
|---|---|---|---|---|
| Gene (Homo sapiens) | CRACR2A | NCBI | Gene ID: 84,766 | |
| Strain, strain background (Escherichia coli) | DH5α | Thermo fisher Scientific | Cat# 18265017 | |
| Cell line (Homo sapiens) | Jurkat E6-1 T cells | ATCC | Not tested for mycoplasma | Cat# TIB-152 |
| Cell line (Homo sapiens) | HEK293T | ATCC | Not tested for mycoplasma | Cat# CRL-3216 |
| Cell line (Mus musculus) | CD40L-expressing L cell fibroblasts | Diehl et al., 2008 | Irradiated at 50 Gy for 50 minutes prior to use | |
| Cell line (Mus musculus) | M2-10B4 bone marrow stromal cells | Lemoine et al., 1988 | Irradiated at 57 Gy for 57 minutes prior to use | |
| Transfected construct (Homo sapiens) | Primers for plasmid construction | This paper | Supplementary file 1 | |
| Biological sample (Homo-sapiens) | Primary human peripheral blood mononuclear cells | This paper | Isolated from the patient and healthy controls | |
| Antibody | Anti-human Phospho JNK (mouse monoclonal) | Cell Signaling Technologies | Cat# 9,255 | Flow cytometry (1:100) |
| Antibody | Anti-Human STIM1(rabbit) | Cell Signaling Technologies | Cat# 5,668 S | WB (1:5000) |
| Antibody | Anti-His-tag(rabbit) | Cell Signaling Technologies | Cat# 12,698 S | WB (1:5000) |
| Antibody | Anti-FLAG tag(mouse monoclonal) | Millipore Sigma | Cat# F3040 | WB (1:5000) |
| Antibody | Anti-human ORAI1(rabbit polyclonal) | Millipore Sigma | Cat# AB9868 | WB (1:5000) |
| Antibody | Anti-Vav1(rabbit) | Cell Signaling Technologies | Cat# 2,502 | WB (1:2000) |
| Antibody | Anti-β-actin(mouse monoclonal) | Santa Cruz Biotechnology | Cat# sc-47778 | WB (1:2500) |
| Antibody | anti-human CD3 antibody (mouse monoclonal) | Bio X Cell | Clone OKT-3 | 1 μg/ml |
| Antibody | Anti-human CD28 antibody (mouse monoclonal) | Bio X Cell | Cat. #: BE0921Clone CD28.2 | 1 μg/ml |
| Antibody | Anti-CD4-FITC(mouse monoclonal) | eBioscience | Clone OKT-4 | FACS5 μl/test |
| Antibody | Anti-IFN- gama-PE-Cy7 | eBioscience | Clone 45.B3 | FACS5 μl/test |
| Antibody | Ant-IL2-PE | eBioscience | Cat# MQ1-17H12 | FACS5 μl/test |
| Antibody | Anti-human,CD19-BV421(mouse monoclonal) | BD | Cat. #: 562,440Clone HIB19 | FACS5 μl/test |
| Antibody | Anti-human, CD27-PE (mouse monoclonal) | BD | Cat. #: No:555,441Clone: M-T271 | FACS20 μl/test |
| Antibody | Anti-human,IgD-FITC(mouse monoclonal) | BD | Cat. #: 561,490Clone IA6-2 | FACS5 μl/test |
| Antibody | Anti-human,IgM-Perc-cy5.5(mouse monoclonal) | BD | Cat. #: 561,285Clone G20-R7 | FACS5 μl/test |
| Antibody | Anti-human, CD24-FITC (mouse monoclonal) | BD | Cat. #: 555,427Clone ML-5 | FACS20 μl/test |
| Antibody | Anti-human,CD38-Pecy7(mouse monoclonal) | BD | Cat. #: 335,825CloneHB-7 | FACS5 μl/test |
| Antibody | Anti-human,CD3-V500(mouse monoclonal) | BD | Cat. #: 561,416Clone UCHT-1 | FACS5 μl/test |
| Antibody | Anti-human, CD4-BV421(mouse monoclonal) | BD | Cat. #: 562,424Clone RPA-T4 | FACS5 μl/test |
| Antibody | Anti-human, CD25-Pecy7monoclonal | BD | Cat. #: 335,824Clone 2A3 | FACS5 μl/test |
| Antibody | Anti-human, CD127-PrcP Cy5.5(mouse monoclonal) | BD | Cat. #: 560,551Clone HIL-7R-M21 | FACS5 μl/test |
| Antibody | Anti-human, FoxP3- Alexa 488(mouse monoclonal) | BD | Cat. #: 566,526Clone 2632/E7 | FACS5 μl/test |
| Antibody | Anti-human, CD196-PE(mouse monoclonal) | BD | Cat. #: 559 562Clone 11A9 | FACS10 μl/test |
| Antibody | Anti-human,CD-183-APC(mouse monoclonal) | BD | Cat. #: 550,967 | FACS20 μl/test |
| Antibody | Polyclonal F(ab′)two goat anti-human IgM/IgG/IgA | Jackson ImmunoResearch | Cat. #: 109-006-129 | 10 μg/ml |
| Antibody | Anti-human CD138-APC(mouse monoclonal) | Miltenyi Biotech | Cat. #: 130-117-395 | FACS2 μl/test |
| Recombinant DNA reagent | FGllF | This paper | N/A | |
| Recombinant DNA reagent | pmCherry-N1 | Clontech | Clontech plasmid#632,523 | |
| Recombinant DNA reagent | pMD2.G | Addgene | Addgene plasmid #12,259 | |
| Recombinant DNA reagent | psPAX2 | Addgene | Addgene plasmid #12,260 | |
| Recombinant DNA reagent | pLentiCas9- blasticidin | Addgene | Addgene plasmid #52,962 | |
| Recombinant DNA reagent | pLentiguide-puro_ hCRACR2Asg#1 | This paper | Details in Supplementary file 1 | |
| Recombinant DNA reagent | pLentiguide-puro_ hCRACR2Asg#2 | This paper | Details in Supplementary file 1 | |
| Recombinant DNA reagent | pLentiguide-puro_ hCRACR2Asg#3 | This paper | Details in Supplementary file 1 | |
| Recombinant DNA reagent | pLentiguide-puro_ hORAI1sg | This paper | Details in Supplementary file 1 | |
| Recombinant DNA reagent | FG11F CRACR2A WT | This paper | Details in Supplementary file 1 | |
| Recombinant DNA reagent | FG11F CRACR2AE278D | This paper | Details in Supplementary file 1 | |
| Recombinant DNA reagent | FG11F CRACR2AR144G | This paper | Details in Supplementary file 1 | |
| Recombinant DNA reagent | FG11F CRAC R2AR144G,E300* | This paper | Details in Supplementary file 1 | |
| Sequence- based reagent | SureSelect XT Human All Exon V5 | Agilent | ||
| Sequence- based reagent | CRACR2AExon 6_F | This paper | ATGATTCCT GGCAGGTGAGA | |
| Sequence- based reagent | CRACR2AExon 6_R | This paper | ATTCCAGTG CAGGGACCAG | |
| Sequence- based reagent | CRACR2AExon 9_F | This paper | GGCCCTGATG TTGAGTAGGT | |
| Sequence- based reagent | CRACR2AExon 9_R | This paper | GTGAATGGC AGGGAAAGTGG | |
| Sequence- based reagent | CRACR2AExon 10_F | This paper | AAACAAGGT GAGGCCAGGG | |
| Sequence- based reagent | CRACR2AExon 10_R | This paper | AGCCCAAAT CCTCTT TTCACAG | |
| Peptide, recombinant protein | IL-2 | Roche | Cat. #: HIL2-RO | |
| Peptide, recombinant protein | IL-21 | Peprotech | Cat. #: 200–21 | 50 ng/ml |
| Peptide, recombinant protein | IL-2 | Peprotech | Cat# 200–02 | 20 units/ml |
| Commercial assay or kit | aCD3 plates | Corning | Cat. #:354,725 | 10 ng/ml |
| Commercial assay or kit | B cell isolation kit | Miltenyi Biotech, | Cat. #:130-091-151 | 100 U/ml |
| Commercial assay or kit | QIAamp DNA Blood kit | Qiagen | Cat. #:61,104 | |
| Commercial assay or kit | Human IgG ELISA Quantitation Set | Bethyl Laboratories Inc, | Cat. #: E80-104 | |
| Commercial assay or kit | Human IgM ELISA Quantitation Set | Bethyl Laboratories Inc, | Cat. #: E80-100 | |
| Commercial assay or kit | MagniSort human naïve CD4+ T cell enrichment kit | Thermofisher Scientific | Cat. #: 8804-6814-74 | |
| Commercial assay or kit | FOXP3/ Transcription Factor staining Buffer set | Thermofisher Scientific | Cat. #: 2229155 | |
| Chemical compound, drug | PHA-L | Sigma | Cat. #:L-4144 | |
| Chemical compound, drug | 3HThymidine | Perkin Elmer | Cat. #: 027001 | |
| Chemical compound, drug | LymphoPrep | Axis Shield | Cat. #:1114547 | |
| Chemical compound, drug | 7-AAD-PerCP-Cy5 | BD | Cat. #: 559,925 | FACS5 μl/test |
| Chemical compound, drug | Fura 2-AM | Thermofisher Scientific | Cat# F1221 | |
| Chemical compound, drug | Brefeldin A | Thermofisher Scientific | Cat# 00-4506-51 | |
| Chemical compound, drug | Thapsigargin | EMD Millipore | Cat# 80055–474 | |
| Chemical compound, drug | Phorbol 12- myristate 13- acetate (PMA) | EMD Millipore | Cat# 5.00582.0001 | |
| Chemical compound, drug | Ionomycin | EMD Millipore | Cat# 407,951 | |
| Chemical compound, drug | Polybrene | Millipore Sigma | Cat# TR-1003 | |
| Chemical compound, drug | Puromycin | Invivogen | Cat# ant-pr-1 | |
| Chemical compound, drug | Blasticidin | Invivogen | Cat# ant-bl-05 | |
| Chemical compound, drug | Poly-D-Lysine | Thermo Fisher Scientific | Cat# A003E | |
| Chemical compound, drug | Fixable Viability Dye eFluor 780 | eBioscience | Cat# 65-0865-14 | 1 μl/ml of cells |
| Software, algorithm | FlowJo v10 | TreeStar | ||
| Software, algorithm | Slidebook software | Intelligent Imaging Innovations, Inc | ||
| Software, algorithm | OriginPro | Originlab | ||
| Software, algorithm | Image J | NIH | ||
| Software, algorithm | Fluoview FV10i Confocal Microscope | Olympus | ||
| Software, algorithm | Fluoview software | FlowJo, LLC | ||
| Software, algorithm | Exome sequence analysis (various) | Please see methods section | ||
| Other | LAS-3000 LCD camera | FujiFilm | ||
| Other | ECM 830 electroporator | BTX | ||
| Other | BD Fortessa flow cytometer | BD Biosciences | ||
| Other | Cytoflex LX flow cytometer | Beckman Coulter | ||
| Other | HiSeq 3,000 | Illumina |
Additional files
-
Supplementary file 1
List of all the sgRNAs, and primers used for cDNA sub cloning and qRT-PCR in this study.
- https://cdn.elifesciences.org/articles/72559/elife-72559-supp1-v1.docx
-
Transparent reporting form
- https://cdn.elifesciences.org/articles/72559/elife-72559-transrepform1-v1.docx
-
Source data 1
Source data for all figures.
Zip folder containing raw and uncropped images for Western blots and Excel spreadsheets of quantitation.
- https://cdn.elifesciences.org/articles/72559/elife-72559-supp2-v1.zip
Download links
A two-part list of links to download the article, or parts of the article, in various formats.
Downloads (link to download the article as PDF)
Open citations (links to open the citations from this article in various online reference manager services)
Cite this article (links to download the citations from this article in formats compatible with various reference manager tools)
Biallelic mutations in calcium release activated channel regulator 2A (CRACR2A) cause a primary immunodeficiency disorder
eLife 10:e72559.
https://doi.org/10.7554/eLife.72559


