ANTH domains within CALM, HIP1R, and Sla2 recognize ubiquitin internalization signals
- Department of Molecular Physiology and Biophysics, University of Iowa, United States
- Carver College of Medicine Protein Crystallography Core, University of Iowa, United States
- Department of Biochemistry and Molecular Biology, University of Iowa, United States
- Carver College of Medicine NMR Core, University of Iowa, United States
Figures
Figure 1 with 1 supplement

ANTH domains bind Ubiquitin.
(A) Domain organization of proteins containing an N-terminal ANTH domain. Other domains indicated are: actin-binding I/LWEQ/THATCH (talin-HIP1/R/Slap2p actin-tethering C-terminal homology) domains; AD∆C (C-terminal Assembly Domain lacking the central clathrin and adaptor protein binding) domains (Moshkanbaryans et al., 2014); and CC (coiled-coil) domains that drives homodimerization (Wilbur et al., 2008). (B) SDS-PAGE and Coomassie stain of purified recombinant ANTH domains from proteins cartooned in A. (C) Binding of ANTH domain from mouse HIP1 using pulldown assays with GST alone (ø) or fused to the N-terminus of five linear tandem copies of Ub (GST-5xUb) or to the C-terminus of mono-Ub (Ub-GST). (D) Binding of 15N-labeled Ub monitored by NMR HSQC experiments with the indicated corresponding ANTH domains in A. Titration of 30 µM 15N-Ub in the absence (green) or presence of increasing levels of unlabeled ANTH domain. Left shows portion of HSQC spectra. Middle shows binding curves calculated from the difference in the peak intensity in absence and presence of various indicated concentrations of the ANTH domains (Kds indicated). The concentration of ANTH domains used in titration experiments are color coded to match that used in HSQC spectra. Right shows the largest chemical shift perturbations in detectable backbone resonances caused by ANTH domain binding mapped onto the molecular surface of Ub (red).
Figure 1—figure supplement 1
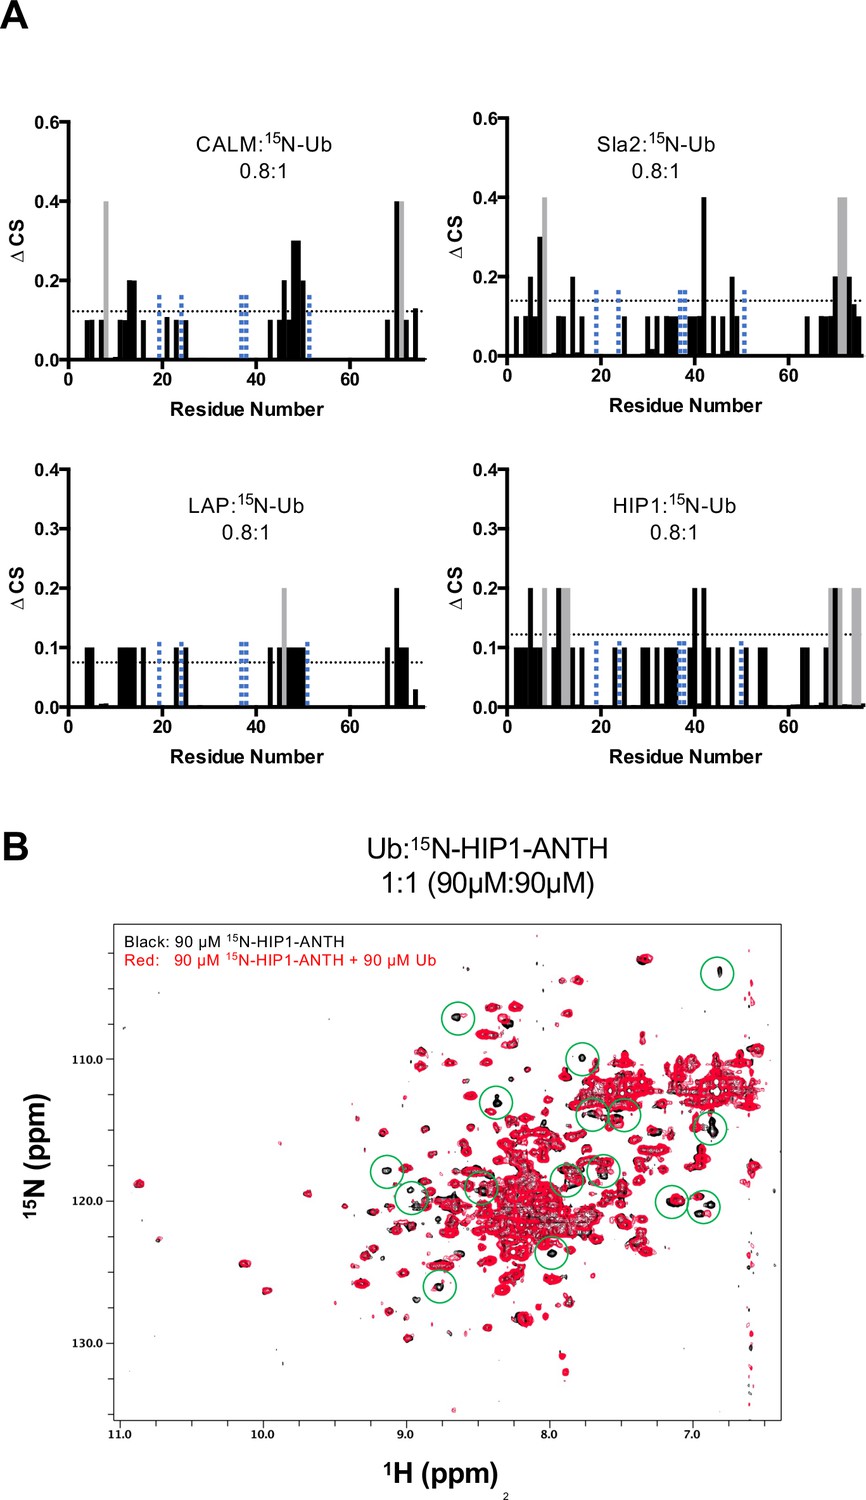
NMR data of ANTH binding Ub.
(A) The magnitude of chemical shift perturbations ((0.2∆N2 + ∆H2)1/2) of 30 µM Ub in the presence of the indicated proportion of various ANTH domains are plotted for each detectable backbone amides of Ub. Horizontal dashed line indicates the level chemical shift perturbation 1 StDev above the mean. Peaks that disappeared upon ANTH binding are colored grey and were assigned the equivalent maximum CSP value for quantitation. Residues absent in the HSQC spectra are designated by vertical blue dashed line. (B) HSQC spectra of 90 µM 15N-labeled ANTH domain of HIP1 in the presence and absence of 90 µM mono-Ub. Some of the Ub-dependent chemical shift perturbations are circled in green.
Figure 2 with 1 supplement
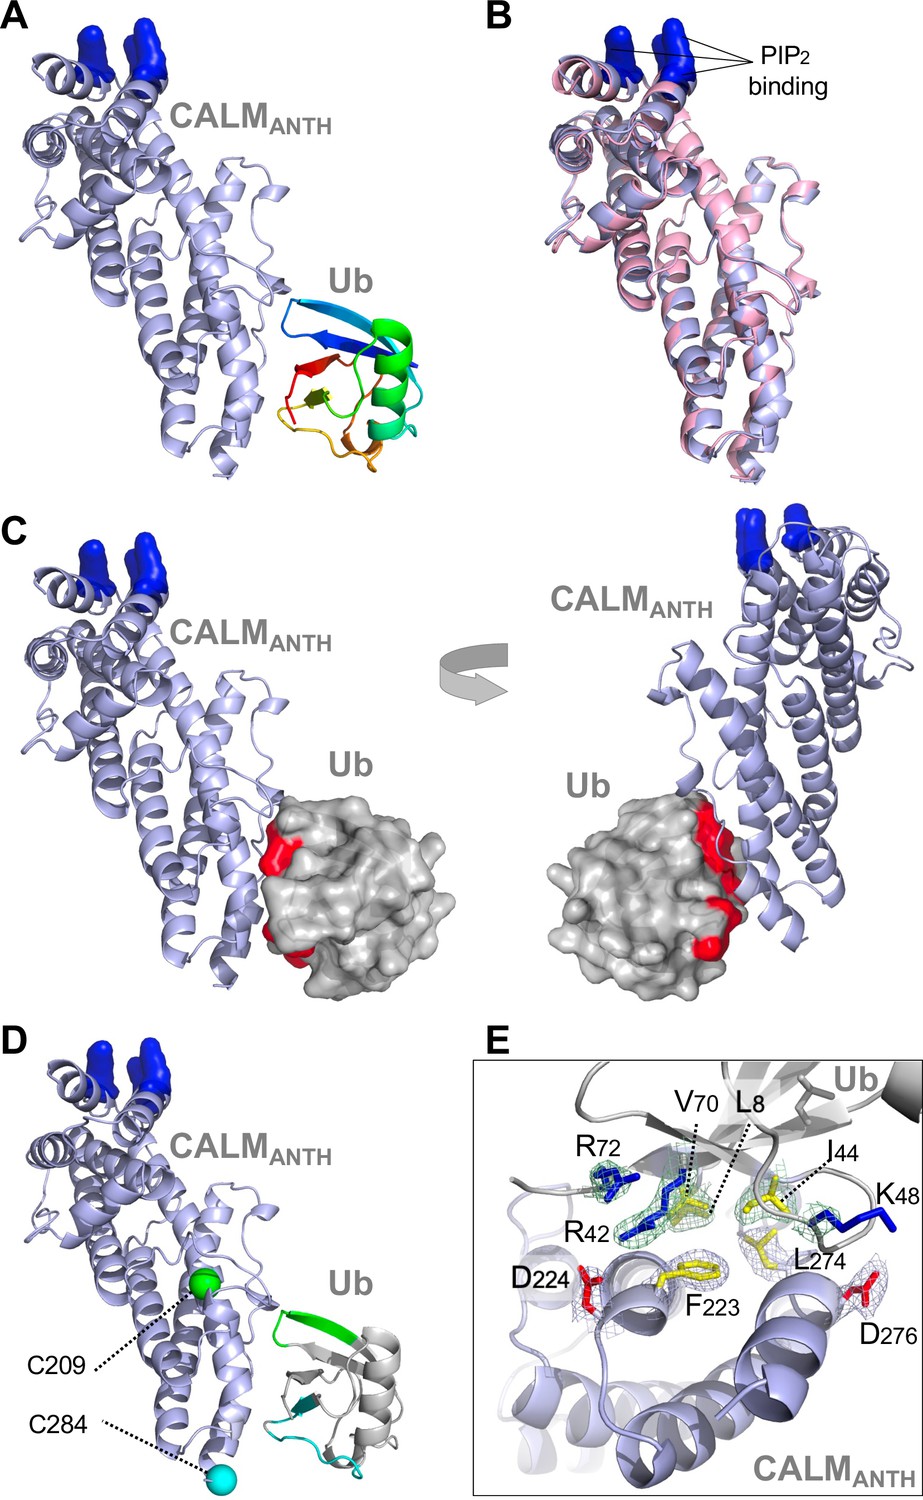
Structure of CALM ANTH domain bound to Ub.
(A) Ribbon cartoon of the crystal structure of CALM ANTH domain (light blue) in a complex with Ub (colored from N to C terminus as blue to red (PDB:7JXV)). Basic residues in CALM that interact with PtdIns(4,5)P2 (K28, K38, K40) are highlighted in blue. (B) Overlay of CALM ANTH domain PDB:7JXV with CALM (residues 20–286) in the previously determined crystal structure of CALM alone (PDB:3ZYK, pink). (C) Rotated views of the CALM:Ub complex with the Ub residues undergoing strongest chemical shift perturbations in HSQC experiments when binding CALM ANTH shown in red (residues L8, R42, I44, K48, Q49, V70, R72). (D) Summary of paramagnetic relaxation enhancement (PRE) experiments using spin labels at either residue 209 (green sphere) or 284 (blue sphere) in CALM ANTH domain. Positions of spin labels are mapped onto the CALM:Ub structure. Residues of (30 µM) 15N-Ub undergoing the strongest PRE effect from binding (30 µM) CALM ANTH spin-labeled at 209 or 284 are colored green or blue on the ribbon cartoon. (E) Close-up view of residues in the ANTH:Ub interface. Electron density maps contoured to 1σ in mesh are shown for some residues (basic: blue; acidic: red; hydrophobic: yellow).
Figure 2—figure supplement 1
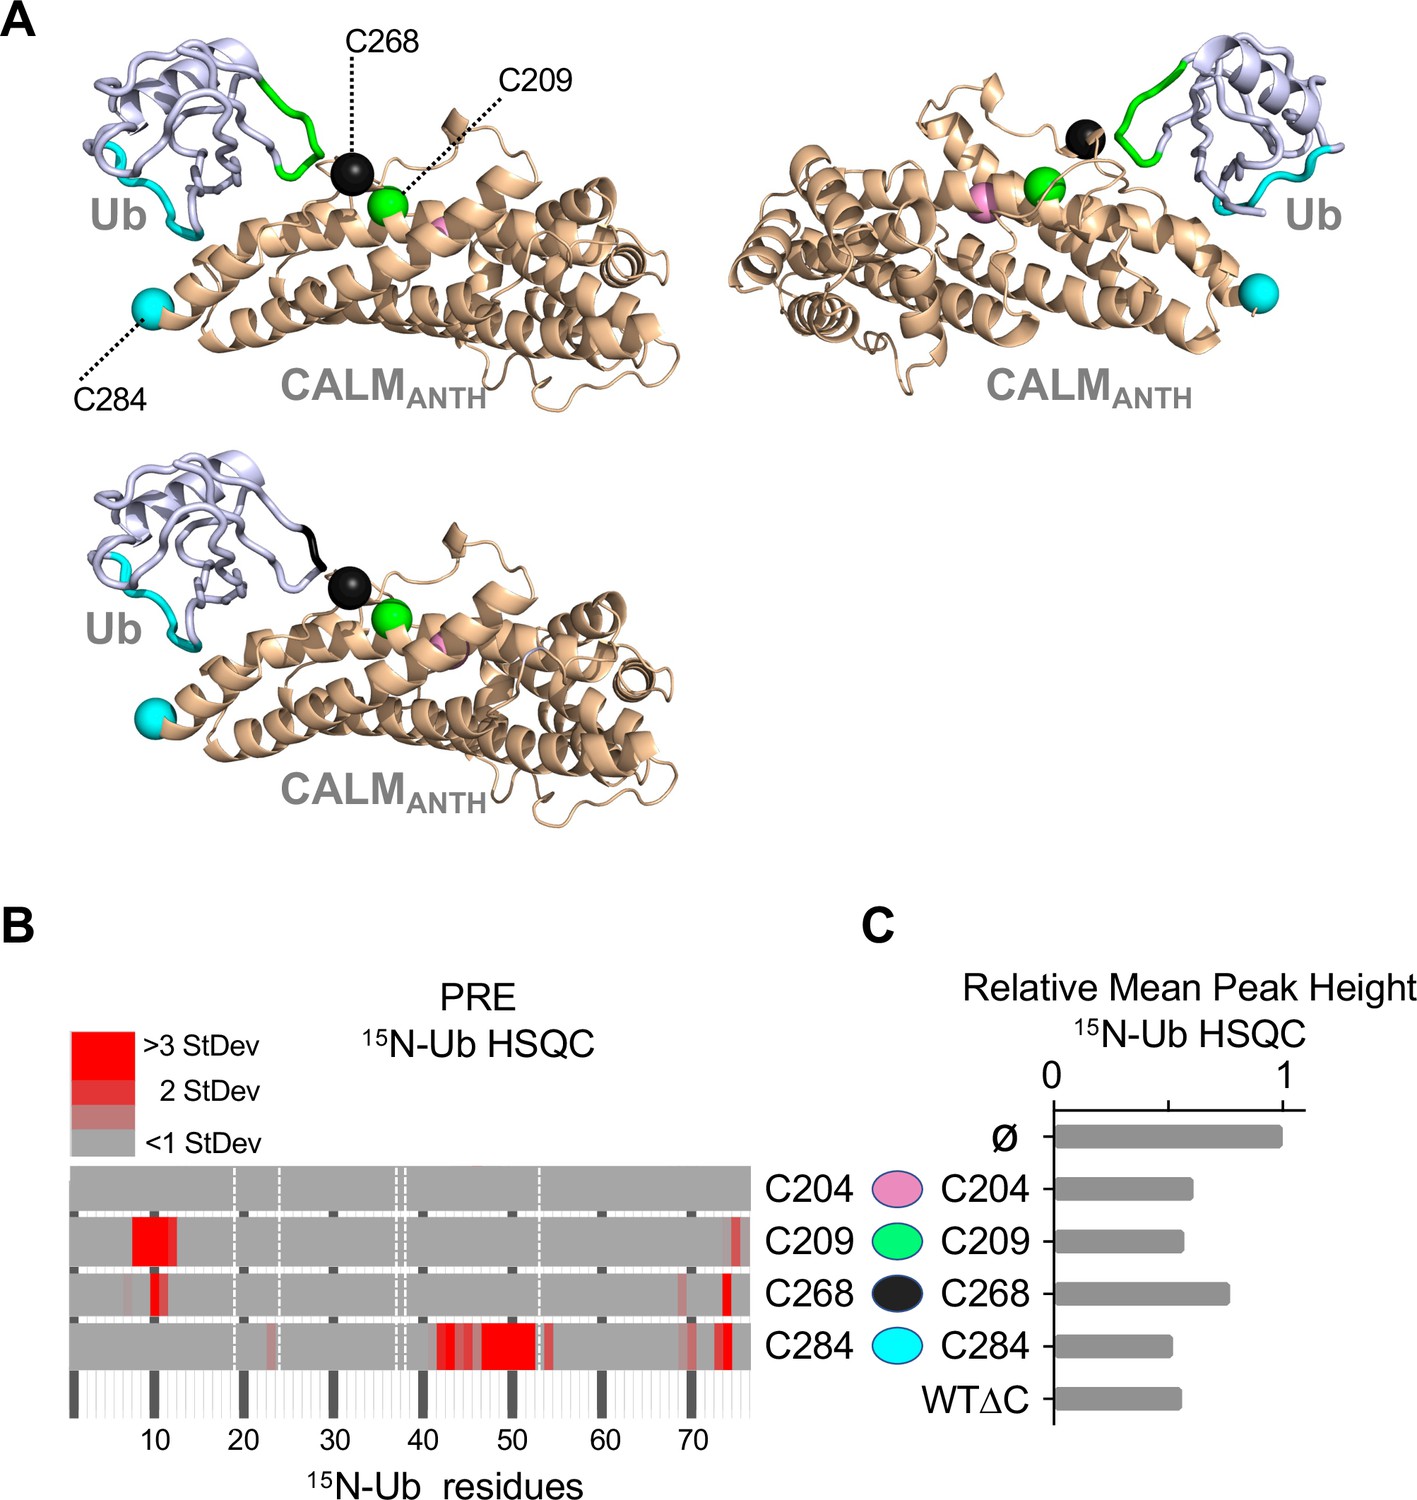
Expanded dataset of PRE experiments confirming location of Ub when bound to CALM ANTH domain.
(A) Views of the CALM:Ub structure with positions of different spin-labeled cysteine residues (209, 268, and 284) labeled as green, black, and blue spheres, respectively. The backbone amides undergoing the largest PRE effects from spin-labels placed at 209 (green) and 284 (blue) are mapped onto the structure of Ub shown in the upper cartoons, whereas the Ub residues undergoing the largest PRE effects from ANTH spin-labeled at 268 (black) and 284 (blue) are in the lower cartoon. No PRE effects were observed from spin-label at 204 (pink). (B) Summary of PRE data. Residues undergoing detectable PRE are plotted by residue number. PRE was calculated as the difference in peak intensity in HSQC spectra of 30 µM 15N-Ub in the presence of MTSL-labelled ANTH domain without (oxidized state) or with 5 mM ascorbate (reduced state), then divided by the peak intensity in the reduced state. PRE effects over 1 StDev of the mean for the dataset are color coded as increasing levels of red. Residues that had PRE effects lower than 1 StDev are plotted in gray. Residues absent in the HSQC spectra are designated by a white dashed line. (C) Relative average peak heights of all HSQC backbone amide peaks of (30 µM) 15N-Ub in the absence (ø) or presence of indicated ascorbate-reduced MTSL-labeled ANTH domains (30 µM). Decrease in relative peak height in the presence of ANTH domains correlates to the extent of binding as shown in Figure 1D. The wildtype CALM ANTH domain lacking cysteines (WT∆C) into which individual cysteine residues were introduce is also shown.
Figure 3 with 1 supplement
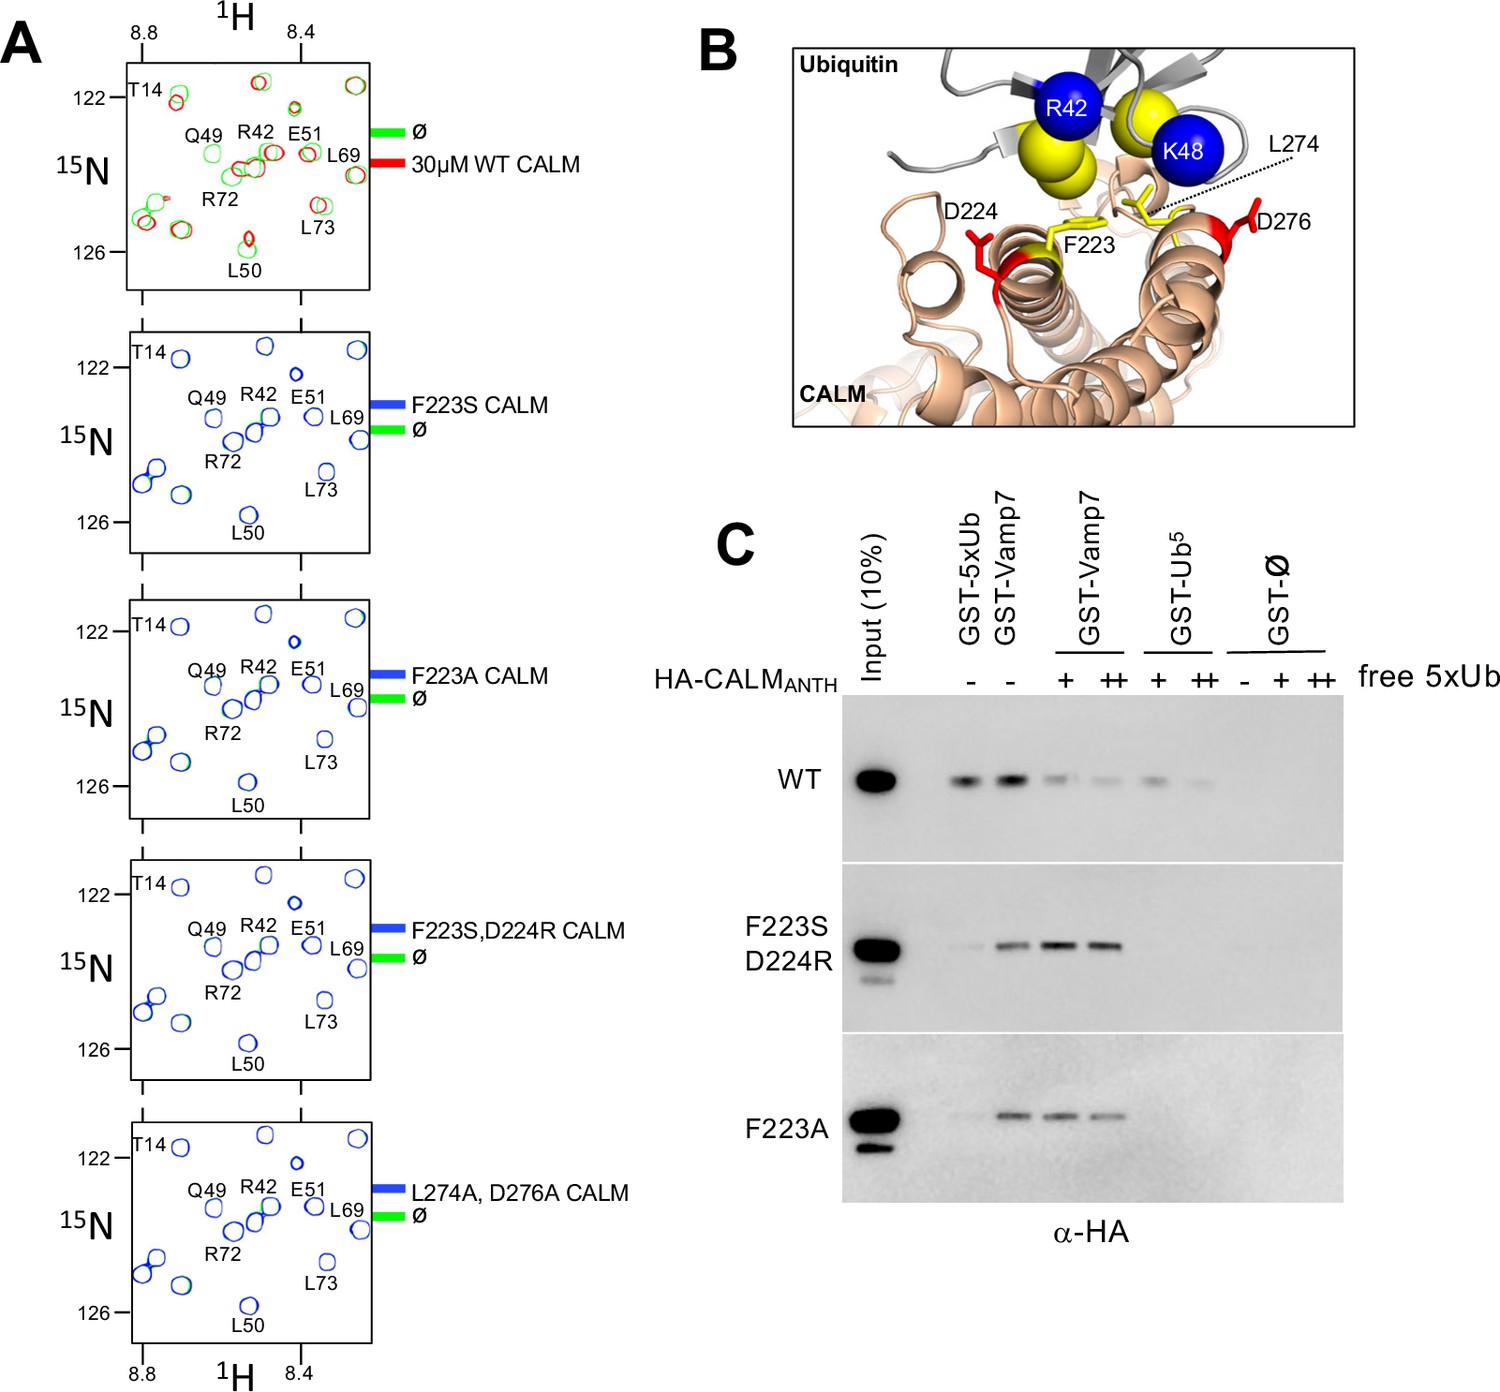
Generation of CALM lacking Ub-binding.
(A) Region of HSQC spectra of (30 µM) 15N-Ub in the absence (green) or presence of wild type CALM ANTH domain (red) or indicated mutants (blue). Clear chemical shift perturbations of 15N-Ub are observed only in the presence of wild type CALM ANTH domain. (B) Cartoon of the CALM:Ub interface that when mutated abolishes Ub-binding. (C) GST pulldown assays of HA-epitope tagged wildtype CALM ANTH domain and the indicated mutant HA-tagged ANTH domains. ANTH domains were allowed to bind GST alone (ø), or GST fused to five linear copies of Ub or fused to Vamp7 (residues 1–188). Pulldowns were performed in the absence or presence (+:1 mg/ml; ++:5 mg/ml) of purified linear Ub (five tandem copies). Samples of Input and GSH-bead bound complexes were resolved by SDS-PAGE and immunoblotted withe α-HA antibodies.
Figure 3—figure supplement 1
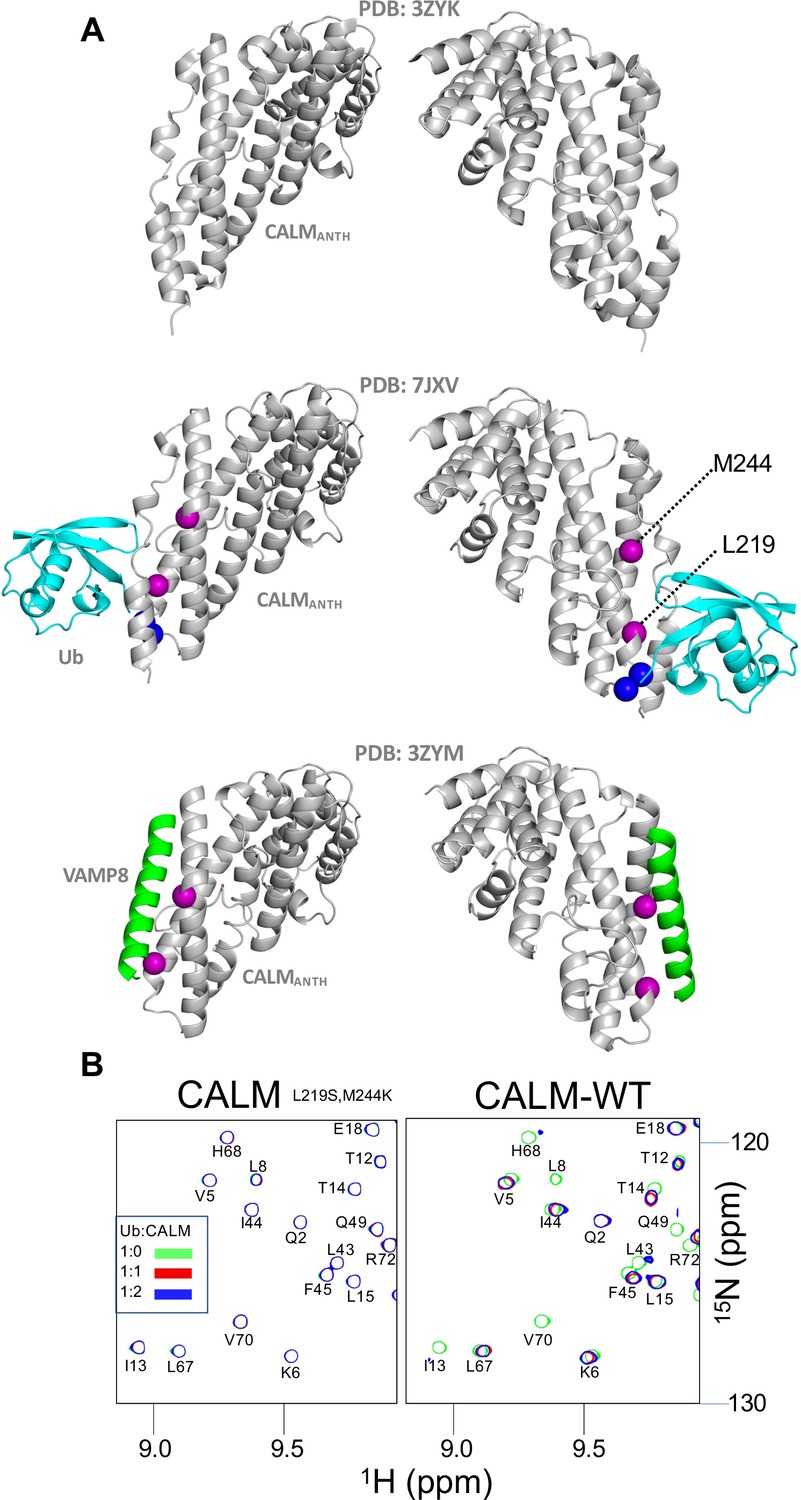
Overlap of Ub and Vamp binding sites on CALM ANTH domain.
(A) Structures of CALM alone (PDB:3ZYK; residues 20–286), the CALM:Ub complex PDB:7JXV (middle), and the crystal structure of the CALM ANTH domain in which the C-terminal helical residues are replaced by a portion of VAMP8 to illustrate potential binding site for VAMP8. Position of L219 and M244 are shown in violet spheres that when changed to Ser and Lys, respectively, inhibit binding to VAMP8. (B) Portion of HSQC spectra of 30 µM 15N-Ub in the absence (green) or presence of either wildtype or mutant ANTH (L219S, M244K) domain at 30 µM (red) or 60 µM (blue). No binding of mutant ANTH domain (L219S, M244K) to 15N-Ub was observed.
Figure 4 with 2 supplements
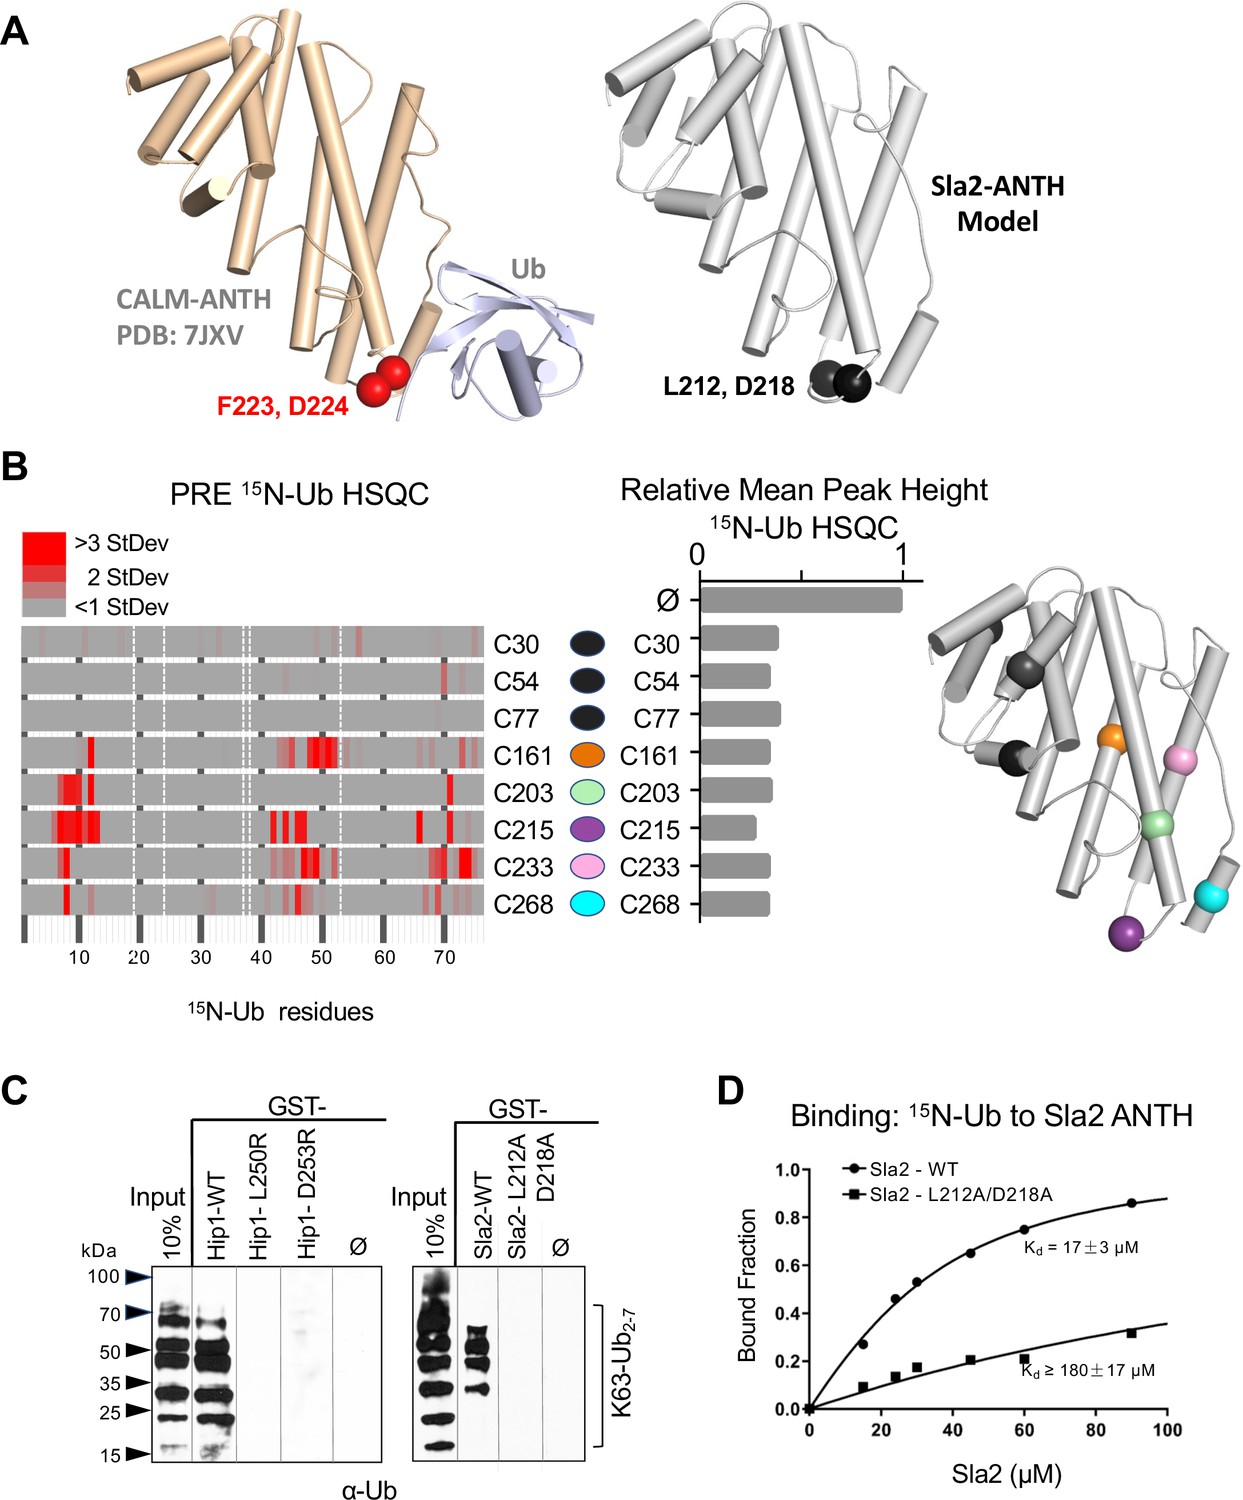
Basis of HIP1/HIP1R/Sla2 ANTH domain binding to Ub.
(A) Cartoon representation of the CALM ANTH:Ub crystal structure (PDB: 7JXV) with helices as cylinders highlighting F223 and D224 residues required for Ub-binding (left) compared to model of S. cerevisiae Sla2 ANTH domain (right) generated by threading through the crystal structure of the C. thermophilum homolog of Sla2 (PDB:5OO7). Structurally analogous residues (L212 and D218) are shown in black spheres. (B) PRE effect on Ub by Sla2 binding. Residues undergoing detectable PRE are plotted by residue number. A set of Sla2 ANTH domains with single residues that were spin-labeled with MTSL and used in a series of PRE experiments with 15N-Ub. Left shows detected PRE effects over 1 StDev for the dataset color coded by residue number. Residues absent in the HSQC spectra are designated by white dashed lines. Middle shows relative average peak heights of all HSQC backbone amide peaks of (30 µM) 15N-Ub in the absence (ø) or presence of reduced MTSL-labeled Sla2 ANTH (in reduced state) at the indicated positions (30 µM). Right, positions of the MTSL-labels mapped onto the model of Sla2 ANTH domain. (C) GST pulldown assays using GST alone (ø) or fused to wildtype mouse HIP1 or S. cerevisiae Sla2 ANTH domains or the indicated mutants. A mixture of polyubiquitin chains (K63-linked) of different lengths were allowed to bind. Samples of input and GSH-bead-bound complexes were resolved by SDS-PAGE and immunoblotted with α-Ub antibodies. (D) NMR titrations using 30 µM 15N-Ub in the presence of increasing concentrations of mutant (L212A, D218A) or wildtype Sla2 ANTH domain. Binding data were analyzed using selective amides detected in the HSQC spectra.
Figure 4—figure supplement 1
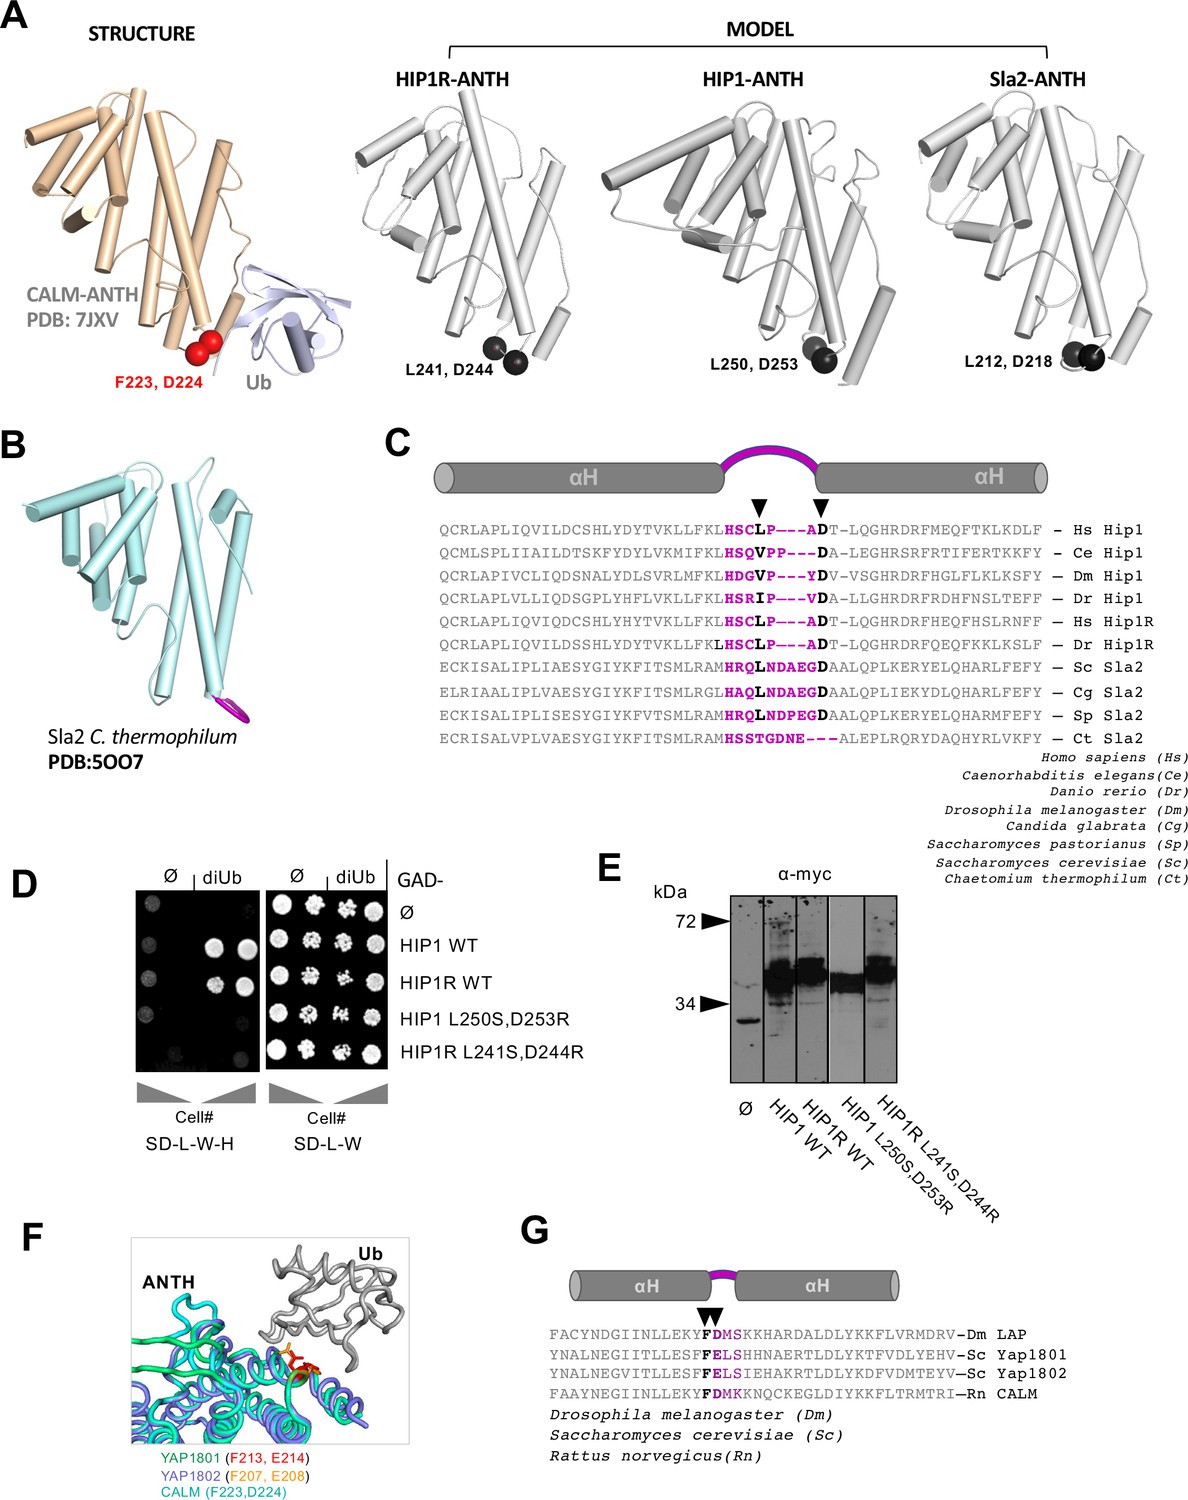
Analysis of HIP1/Sla2/HIP1R Ub-binding.
(A) Analysis of Ub-binding by HIP1/Sla2 subfamily of ANTH domains. Left shows structure of the CALM-ANTH:Ub complex marking F223 and D224 responsible for Ub-binding. Right shows human HIP1 (1–309 NCBI: NP_005329.3), human HIP1R (residues 28–296 of NCBI: NP_003950.1), and S. cerevisiae Sla2 ANTH (residues 5–272 of SGD:S000005187) domains modeled on C. thermophilum Sla2 with hydrophobic and acidic residues highlighted that are predicted to be located similarly to F223 and D224 in the CALM ANTH domain. (B) Cartoon representation of C. thermophilum ANTH domain with loop region proposed for the Ub-binding site in HIP1, HIP1R, and Sc Sla2, in violet. (C) Sequence alignment of helix-loop-helix region of the indicated orthologs of HIP1 ANTH domains with a predicted loop and the hydrophobic and acidic residues that are in analogous position in the Ub-binding site of CALM ANTH domain in violet. Residues that were targeted for mutation are shown in black. (D) Yeast 2-hybrid assay of wildtype and indicated mutant HIP1 and HIP1R binding to Ub. Gal4 (DBD) DNA-binding domains (bait) fused to nothing (ø) or the indicated ANTH domains were tested for Y2H interaction with Gal4-transcription activation domain (prey) fused to either nothing (ø) or 2 copies of Ub translationally fused with a 3-spacer linker (diUb). Dilutions of cells were grown on plates that only select for the presence of Gal4-DBD and Gal4(AD) encoding plasmids (SD-L-W) or plates that also select for a positive Y2H interaction that results in production of His3 (SD-L-W-H). (E) Anti-myc immunoblots showing Gal4 (DBD) fusion proteins in strains in (D). HIP1R-ANTH (residues 32–300 of NCBI: NP_003950.1), HIP1 (41–309 of NCBI: NP_005329.3) (F) Predicted structure of YAP1801 and YAP1802 ANTH domains bound to Ub made by threading through the CALM:Ub structure. The residues in Yap1801 and Yap1802 that are analagous to those in CALM required for Ub-binding are indicated. (G) Sequence alignment of highly homologous CALM and YAP1801/2 ANTH domains. Violet region indicates position of loop between helices and bold residues indicate positions of CALM residues responsible for Ub-binding. Arrows point to residues targeted for mutation to ablate Ub-binding in YAP1801 (F213, E214), YAP1802 (F207, E208), and CALM (F223,D224).
Figure 4—figure supplement 2
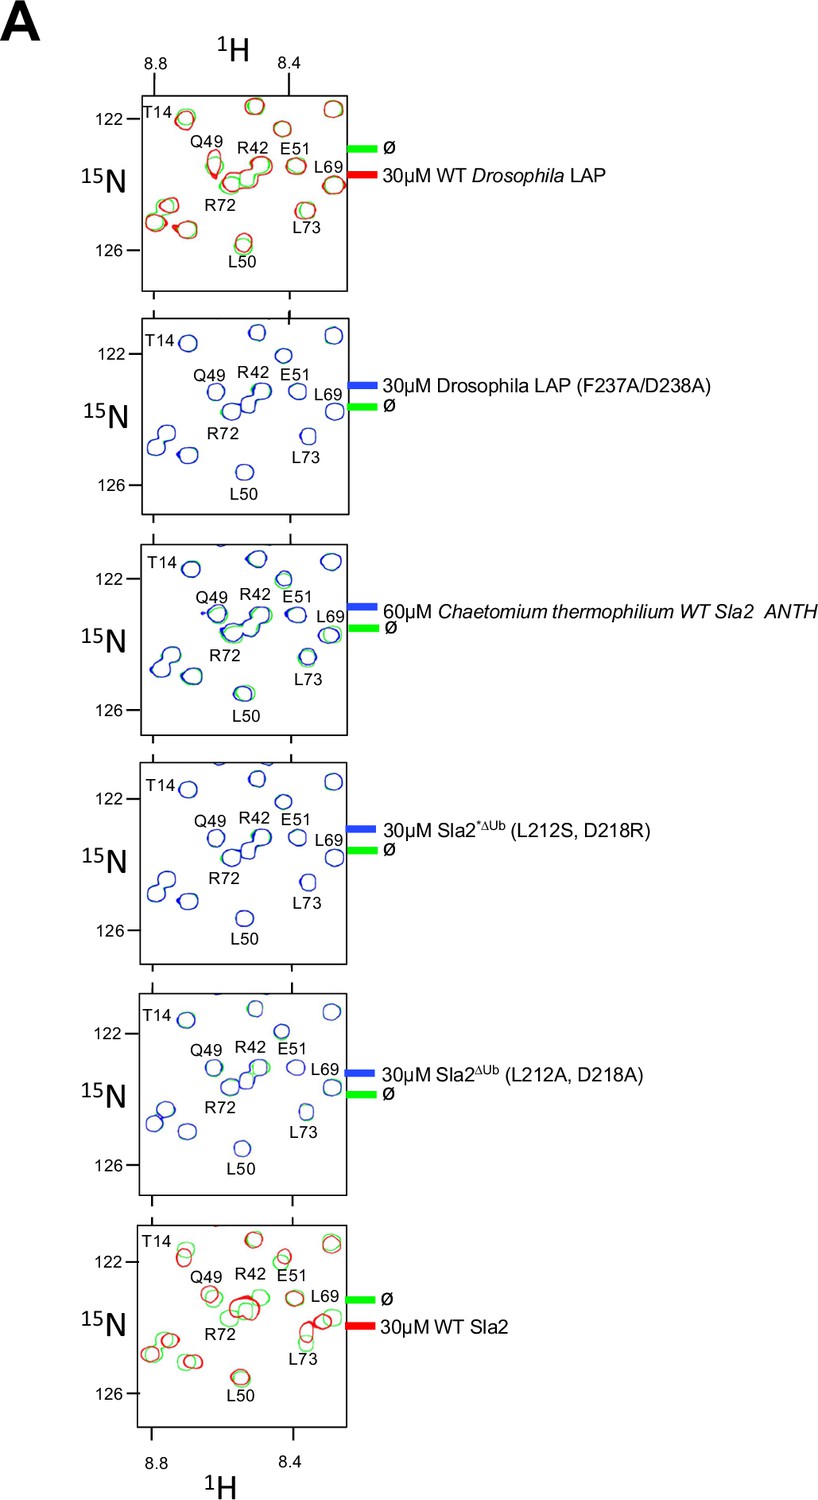
Impact of mutations in Sla2 and LAP on Ub-binding.
(A) Region of HSQC spectra of (30 µM) 15N-Ub in the absence (green) or presence of wild type LAP ANTH domain (red) from Drosophila (Top); in the presence of 30 µM LAP ANTH mutant (F237A,D238A); 60 µM Sla2 ANTH domain from Chaetomium Thermophilium; or mutant Saccharomyces cerevisiae Sla2 ANTH domain (Sla2*∆UbL212S, D281R; Sla2∆UbL212A, D281A). Clear chemical shift perturbations of 15N-Ub are observed only in the presence of wild type LAP ANTH domain and wild type Sla2 ANTH domain.
Figure 5 with 2 supplements
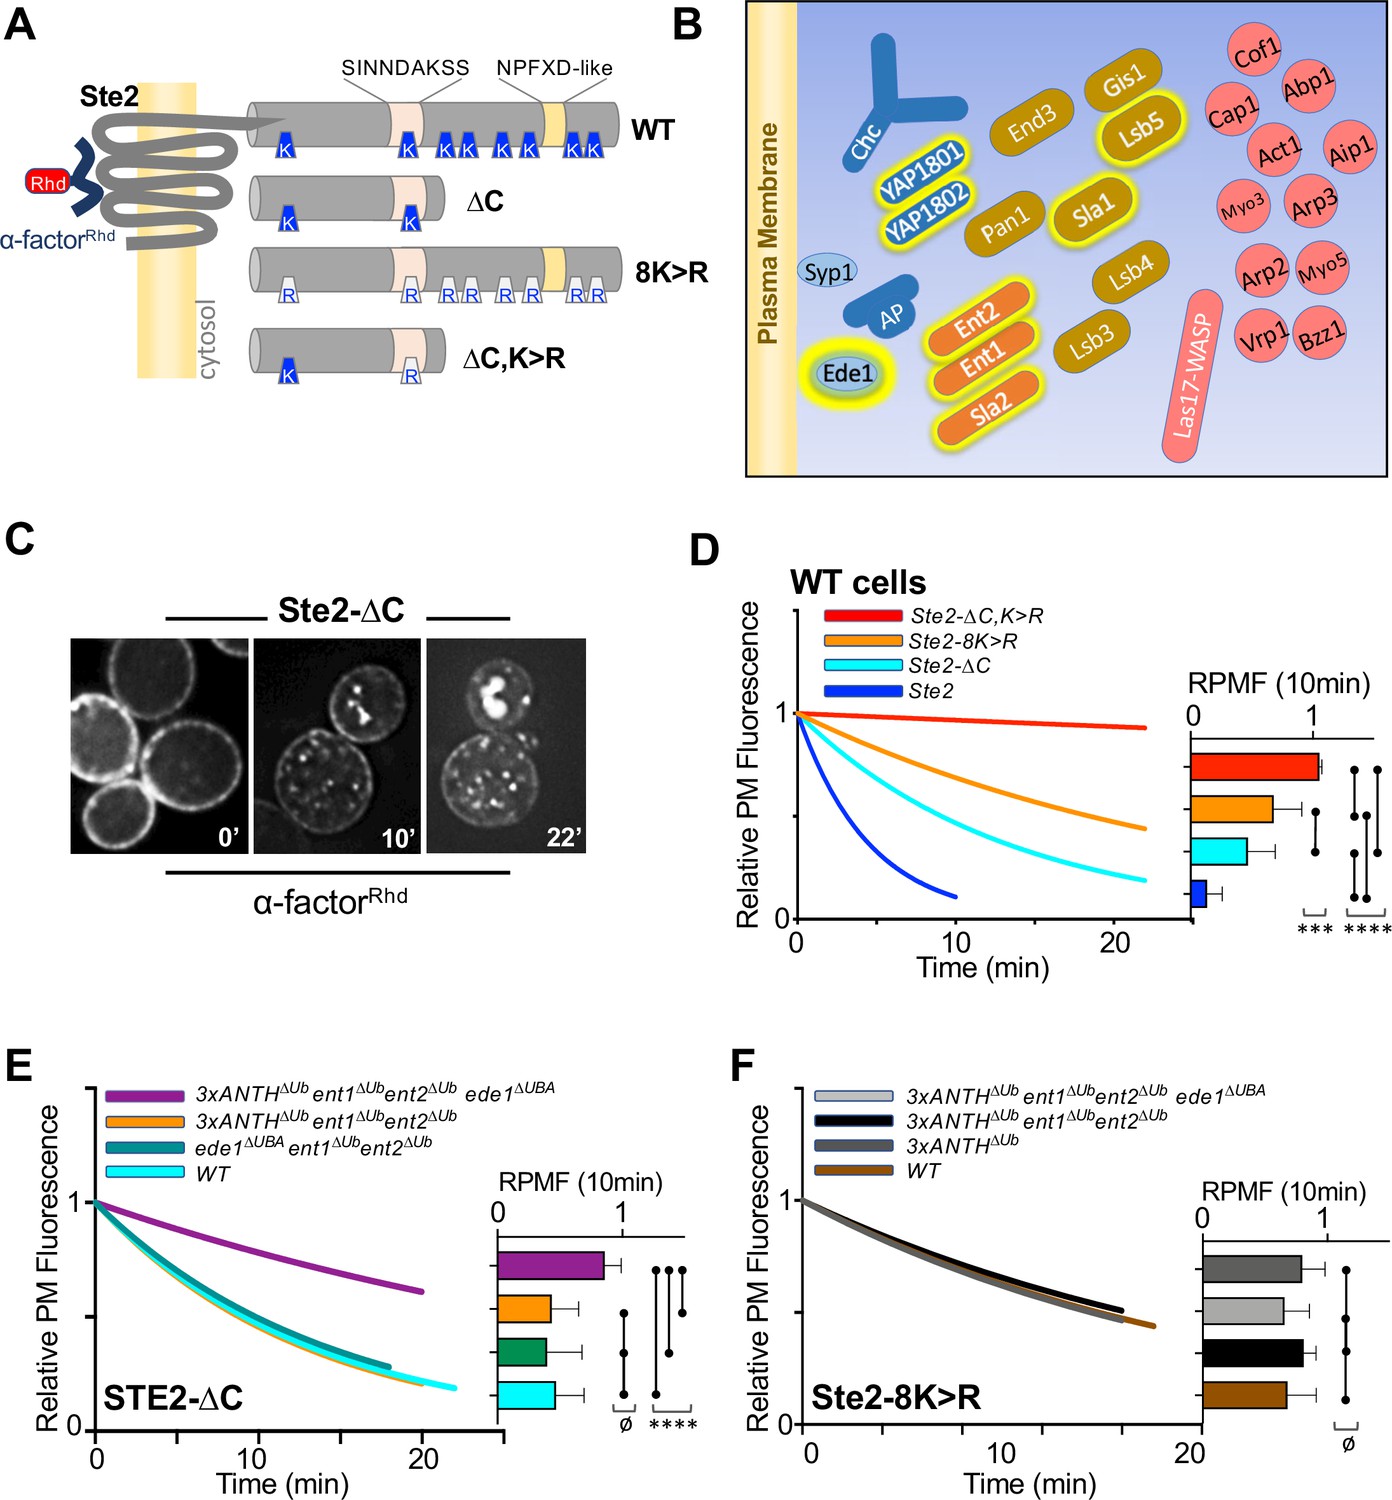
Role of ANTH domains on Ub-dependent internalization.
(A) Schematic of Ste2. Full-length Ste2 (upper) has redundant internalization signals: lysine (K) residues serve as acceptors for ubiquitination and an NPFXD-like motif (residues 392–396) that allows for Ub-independent internalization. Also shown is the serine-containing region (residues S-331-INNDAKSS) that undergoes ligand dependent phosphorylation that is required for ligand-stimulated internalization. (B) Schematic of cellular machinery that catalyzes clathrin-associated internalization in yeast, with proteins arriving earliest to the site of internalization placed closer to the plasma membrane. Proteins highlighted with a yellow border are those identified in this and previous studies as harboring Ub-binding domains. (C) Internalization assays following localization of Rhodamine(RhD)-labeled α-factor bound to the surface of cells at 0 °C for 1h, washed and then allowed to warm to 20 °C during imaging. Sample micrographs of deconvoluted images of yeast expressing Ste2-∆C allowed to endocytose α-factorRhd for 0, 10, and 22 min at 20 °C. (D) Quantitative assays were performed in wildtype yeast strains expressing the indicated forms of Ste2. Image stacks of cells throughout the time course were collected, deconvolved, and quantified for the percentage of fluorescence at the cell surface. Data were fit to a one-phase exponential decay and normalized to the 0 time point. Insert at right shows the mean ± StDev level of normalized α-factorRhd at the plasma membrane 10 min after warming. Statistical significance of indicated pairs were calculated using one-way ANOVA for all conditions (p: ≥ 0.05 = ø, ≤ 0.05 = *, ≤ 0.01 = **, ≤ 0.001 = ***, ≤ 0.0001 = ****) (E) Internalization of α-factorRhd by Ste2-∆C in yeast strains carrying the indicated mutations. Fitted lines to data normalized to the 0 time point. The proportion of surface-localized α-factorRhd at 10 min (mean ± StDev) is also shown. (F) Internalization of α-factorRhd by Ste2-8K > R in yeast strains carrying the indicated mutations.
Figure 5—figure supplement 1
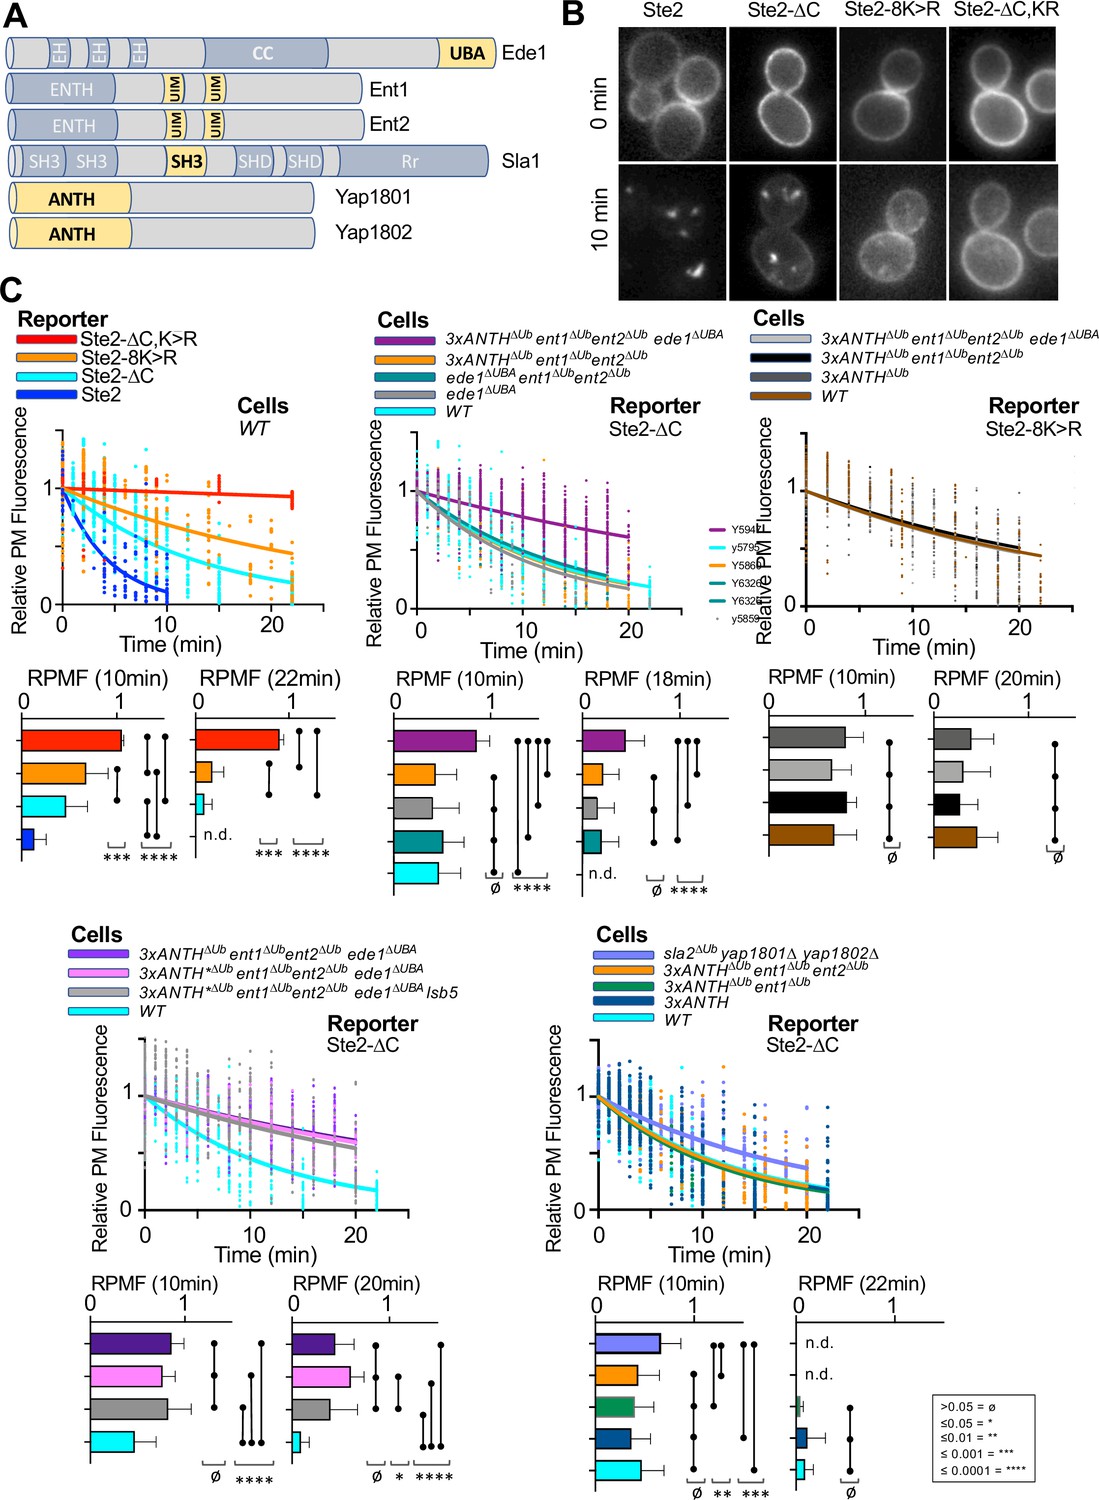
Expanded dataset for Ub-dependent internalization of α-factor.
(A) Schematic of yeast proteins involved in internalization that have Ub-binding domains (yellow). (B) Micrographs of α-factorRhd bound to cells expressing the indicated forms of Ste2 that were labeled with α-factorRhd at 0 °C and allowed to internalize for 0 min or 10 min at room temperature. (C) Kinetics of internalization of α-factorRhd using the indicated Ste2 reporter proteins in strains carrying the indicated mutations. Shown are the rate of cell surface loss fitted to a one-phase decay that is co-plotted with individual data values from different cells analyzed through multiple time courses. Mean ± StDev of the level of α-factorRhd at the cell surface after 10 min or >18 min along with comparisons after one-way ANOVA are shown (p: ≥ 0.05 = ø, ≤ 0.05 = *, ≤ 0.01 = **, ≤ 0.001 = ***, ≤ 0.0001 = ****).
Figure 5—figure supplement 2
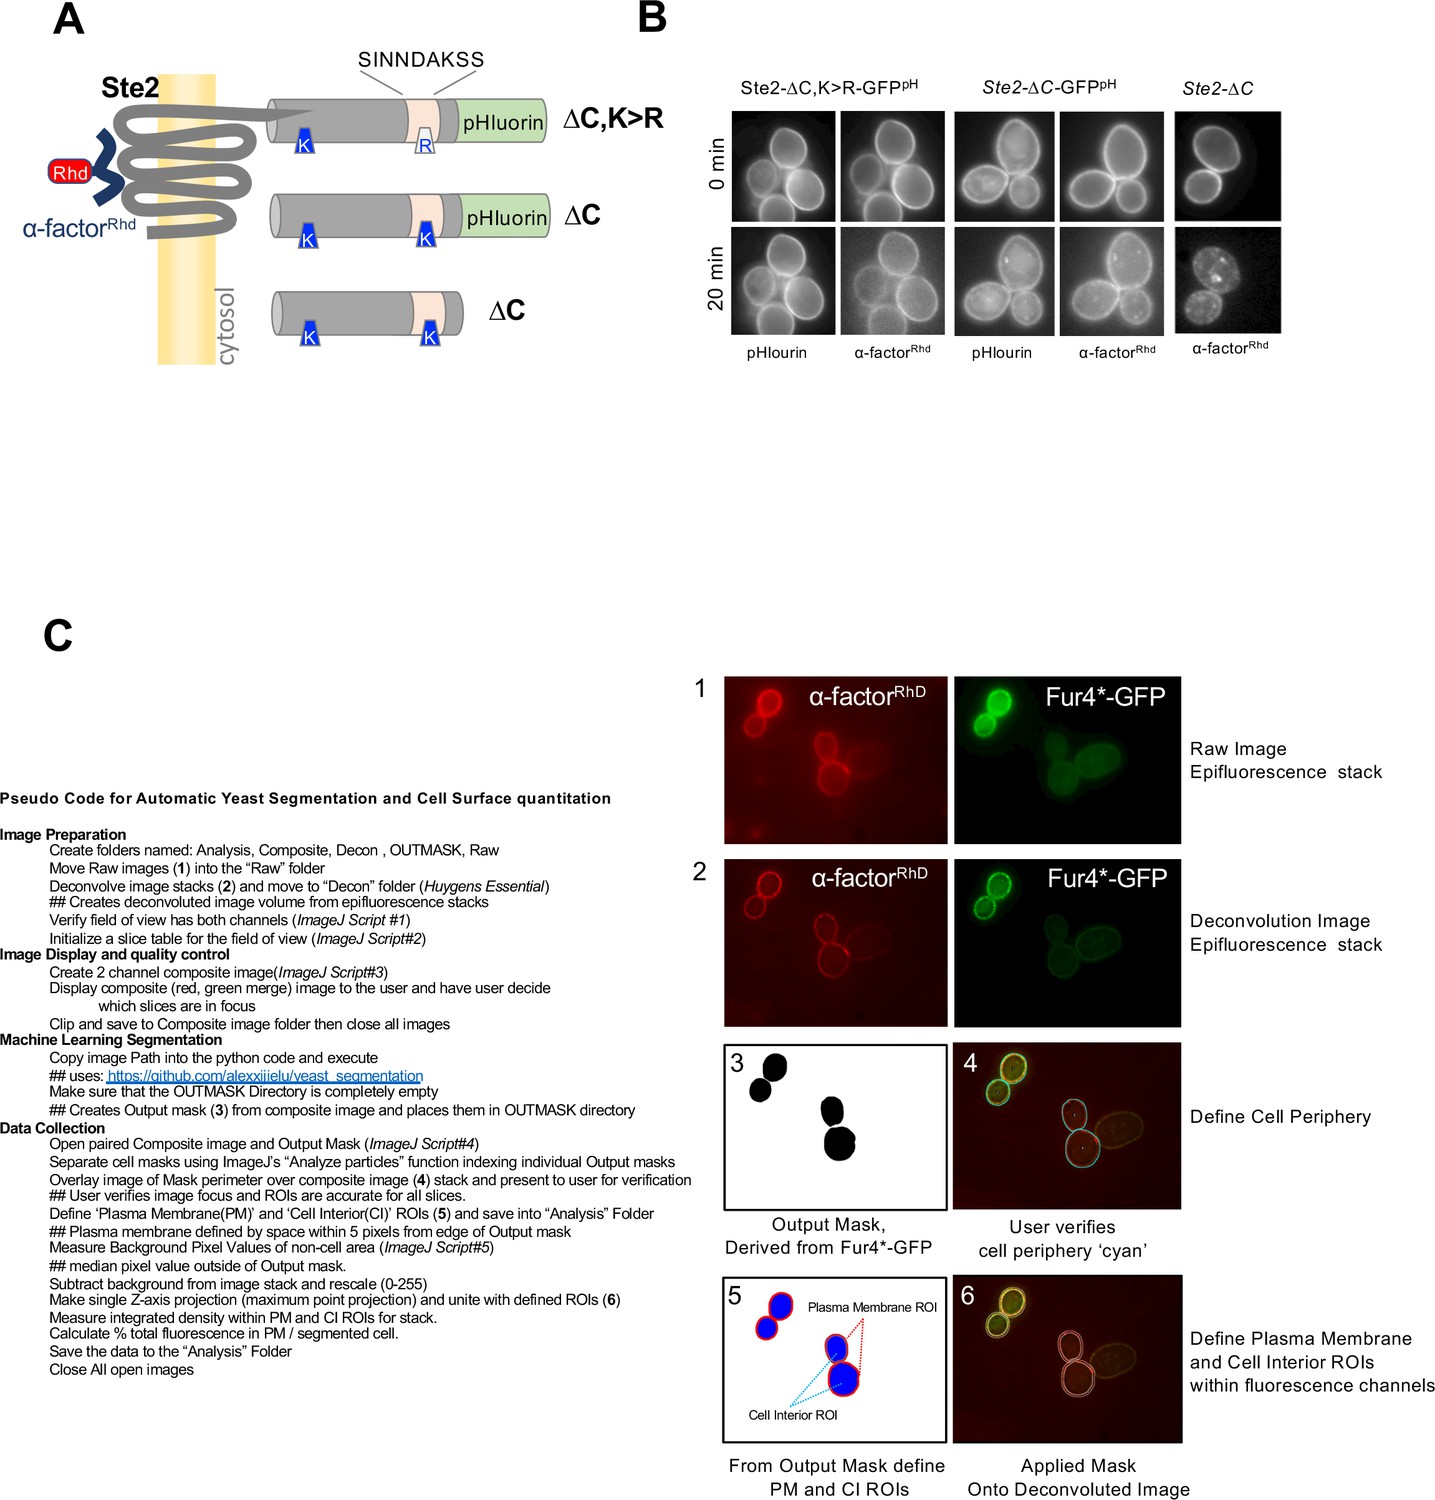
Method for quantifying images of α-factorRhd distribution.
(A) Schematic of Ste2 with designated mutations in the cytosolic tail and depicting placement of GFP pHluorin (GFPpH). (B) Micrographs of α-factorRhd bound to cells expressing the indicated forms of Ste2 that were labeled with α-factorRhd at 0 °C and allowed to internalize for 0 min or 10 min at room temperature. Images show localization of α-factorRhd and GFP fluorescence for those cells expressing pHluorin-tagged Ste2. (C) Explanation of steps to quantify cell surface and intracellular amount of α-factorRhd from image stacks collected by epifluorescence that are subsequently deconvolved, split into regions of interest, and quantified.
Tables
Table 1
Crystallographic data.
Data Collection and Refinement Statistics for the complex of CALM (UniProt: O55012, PICAL_RAT) and Ubiquitin (UniProt: P0CG47.1, UBB_HUMAN). Values in parathesis are for the outer shell.
| CALM-Ub | |
|---|---|
| Data Collection | |
| Space Group | P 41 21 2 |
| Unit Cell Dimensions | |
| a b c (Å) | 94.06 94.06 91.39 |
| α β γ (deg) | 90 90 90 |
| Wavelength (Å) | 1.5418 |
| Resolution Range (Å) | 18.83–2.35 (2.44–2.35) |
| Observations | 238,917 (24333) |
| Unique Reflections | 17,581 (1749) |
| Redundancy | 13.6 (13.9) |
| Completeness (%) | 99.4 (96.5) |
| I/σ (I) | 22.1 (3.2) |
| Rmerge (%) | 9.3 (90.8) |
| Rpim (%) | 3.7 (35.9) |
| CC1/2 | 0.999 (0.918) |
| Wilson B-Factor (Å2) | 40.1 |
| Refinement | |
| Rwork/Rfree (%) | 20.6/26.4 |
| Number of Atoms: | |
| Protein | 2,748 |
| Water | 97 |
| Average B-Factor (Å2) | 48.9 |
| RMSD Bond Lengths (Å) | 0.01 |
| RMSD Bond Angles (deg) | 1.6 |
| Ramachandran favored (%) | 95.9 |
| Ramachandran allowed (%) | 4.1 |
| Clash score | 4.1 |
Additional files
-
Transparent reporting form
- https://cdn.elifesciences.org/articles/72583/elife-72583-transrepform1-v2.docx
-
Supplementary file 1
Plasmids used.
- https://cdn.elifesciences.org/articles/72583/elife-72583-supp1-v2.xlsx
-
Supplementary file 2
Yeast strains used.
- https://cdn.elifesciences.org/articles/72583/elife-72583-supp2-v2.xlsx
-
Source data 1
Gel Scans and Catalog.
Raw images of gels and yeast plates along with a catalog of the images included.
- https://cdn.elifesciences.org/articles/72583/elife-72583-supp3-v2.zip
-
Source data 2
Internalization Time-course Data used for Figure 5.
- https://cdn.elifesciences.org/articles/72583/elife-72583-supp4-v2.xlsx
-
Source code 1
Scripts for quantifying microscopy data.
- https://cdn.elifesciences.org/articles/72583/elife-72583-supp5-v2.zip
Download links
A two-part list of links to download the article, or parts of the article, in various formats.
Downloads (link to download the article as PDF)
Open citations (links to open the citations from this article in various online reference manager services)
Cite this article (links to download the citations from this article in formats compatible with various reference manager tools)
ANTH domains within CALM, HIP1R, and Sla2 recognize ubiquitin internalization signals
eLife 10:e72583.
https://doi.org/10.7554/eLife.72583


