A novel lineage-tracing mouse model for studying early MmuPV1 infections
- Department of Biological Sciences, University of Cyprus, Cyprus
- Department of Cancer Genetics, Therapeutics & Ultrastructural Pathology, The Cyprus Institute of Neurology & Genetics, Cyprus
Figures
Figure 1
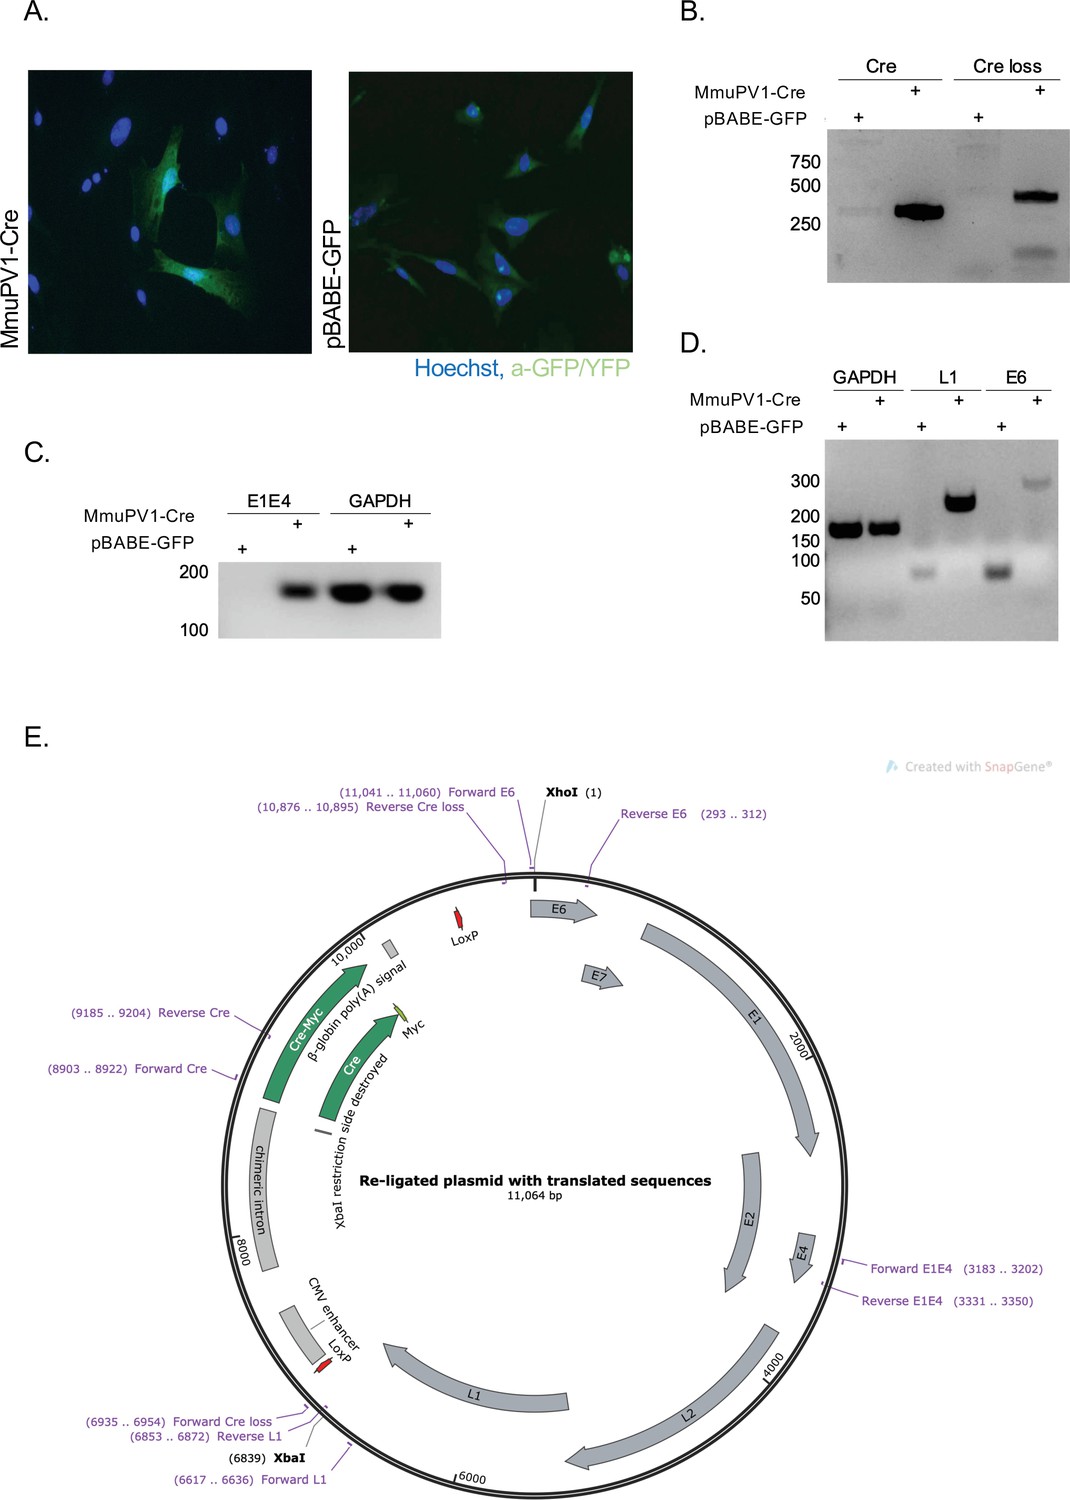
Cre expression from MmuPV1-lox-Cre-lox leads to plasmid recombination in vitro.
(A) Immunofluorescence of mouse embryonic fibroblasts (MEFs) (isolated from R26R-EYFP mice) transfected with pBABE-GFP or MmuPV1-lox-Cre-lox (MmuPV1-Cre) plasmids 48 hr post-transfection (green: a-GFP/YFP, blue: Hoechst). (B) DNA isolated from transfected cells was used for PCR amplification of the Cre sequence and sequence flanking the Cre cassette to determine recombination of the MmuPV1-lox-Cre-lox plasmid after Cre expression. (C–D) RT-PCR analysis for the presence of the viral transcripts E1E4 (C) L1 and E6 (D) in GFP and MmuPV1-lox-Cre-lox transfected MEFs. (E) Map of the MmuPV1-lox-Cre-lox plasmid after re-ligation and translated sequences. Created with SnapGene software (from Insightful Science; available at snapgene.com).
Figure 2

Cells which taken up MmuPV1-lox-Cre-lox plasmid can be detected and traced over time in vivo.
(A) Experimental design; the MmuPV1-lox-Cre-lox plasmid is delivered to the tail skin of R26R-lox-STOP-lox-eYFP mice (of pure C57BL/6 genetic background) after a UV-B irradiation and a superficial scarification. The expected observation is an almost ‘V’ shaped YFP expressing cell population where a single or a couple of basal cells have taken up the plasmid at the bottom and went through cell division where progenies move upward in the skin layers toward the surface. (B) Immunofluorescence (IF) of MmuPV1-lox-Cre-lox plasmid delivered tail skin section at the indicated time points (red: K14, green: a-GFP/YFP). (C) IF of CAG-Cre plasmid delivered tail skin section at the indicated time points (red: K14, green: a-GFP/YFP). White lines indicate the approximate ‘V’ shaped YFP expressing cell populations on day 3 and day 5 only.
Figure 3 with 1 supplement
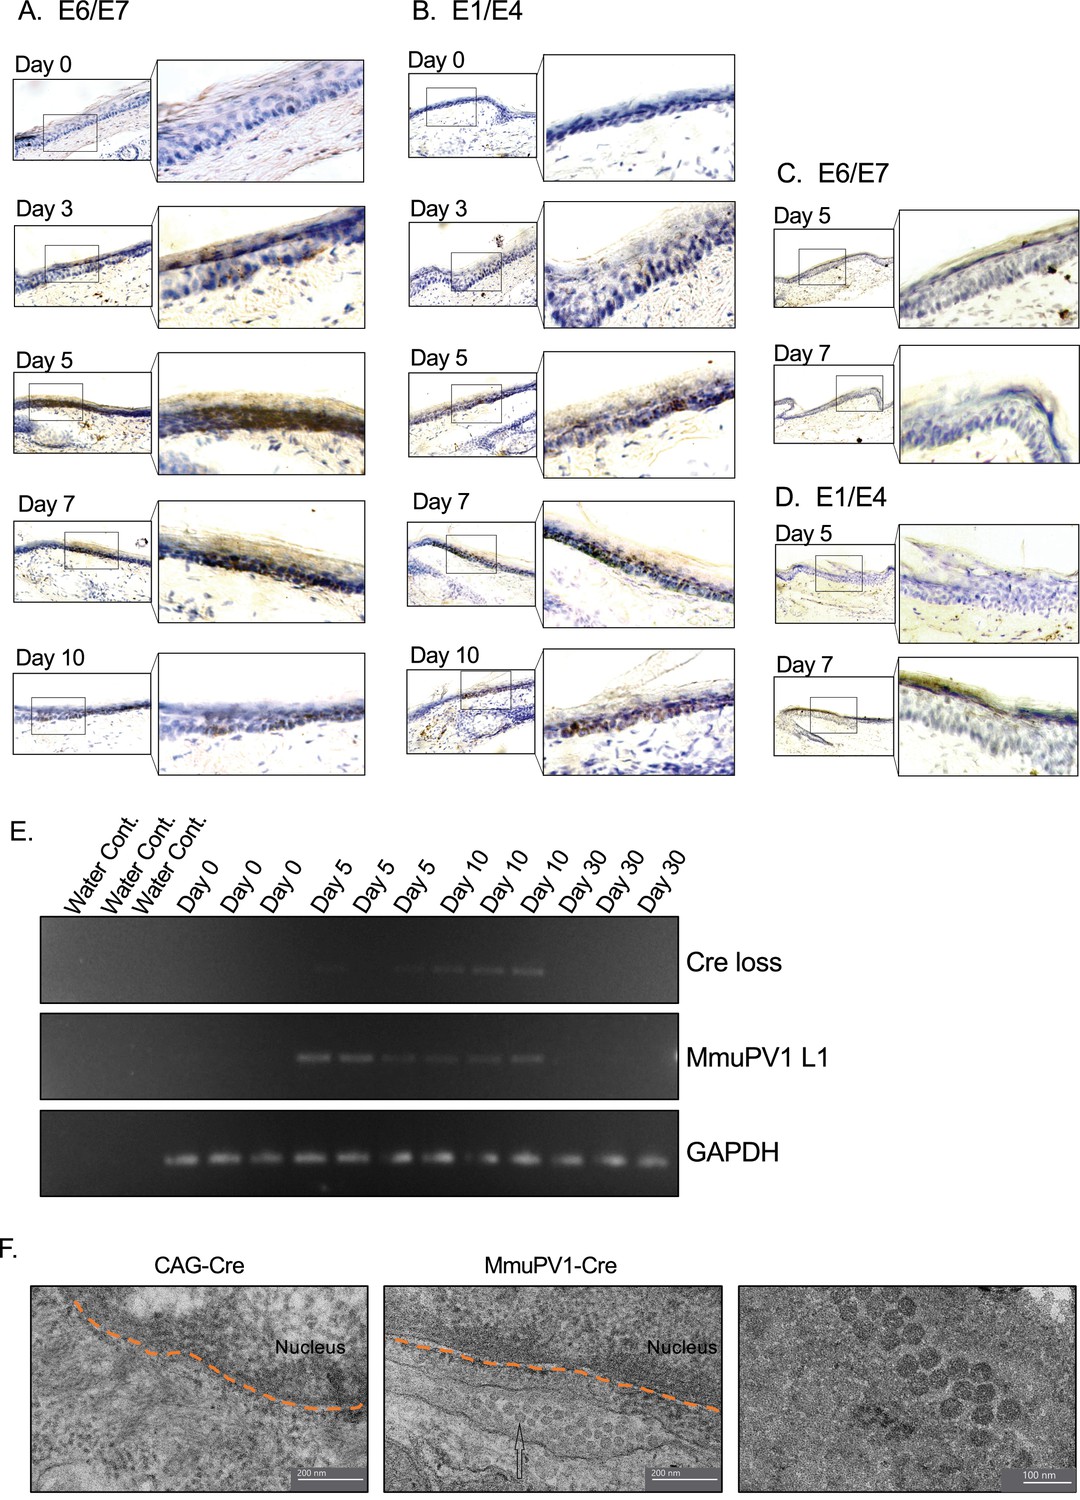
Tissues with MmuPV1-lox-Cre-lox plasmid express viral transcripts in vivo.
(A–B) RNAscope of the MmuPV1-lox-Cre-lox plasmid delivered tail sections of the R26R-lox-STOP-lox-eYFP mice at the indicated time points to assess the presence of viral transcripts E6/E7 and E1/E4, respectively. (C–D) RNAscope of the CAG-Cre plasmid delivered tail sections of the R26R-lox-STOP-lox-eYFP mice at the indicated time points to assess the presence of viral transcripts E6/E7 and E1/E4, respectively. The presence of the transcripts appears as brown dots. (E) DNA isolated from the swap samples of the MmuPV1-lox-Cre-lox plasmid delivered tail sections of the R26R-lox-STOP-lox-eYFP mice and was used for PCR amplification of the sequence flanking the Cre cassette (Cre loss) and L1 of MmuPV1 to determine the presence and the recombination of the MmuPV1_Cre plasmid after Cre expression. (F) Representative electron micrographs showing the control (CAG-Cre) (left panel) and infected (MmuPV1-Cre) (middle and right panel) tail tissue samples, respectively. Arrow shows the formed virion-like structures in the MmuPV1-Cre samples which are absent in all the control samples. The dotted orange line highlights the border of the nucleus. Thin sections (0.1 μm) were examined under a transmission electron microscopy (TEM) at 120 kV (TALOS L120C).
Figure 3—figure supplement 1
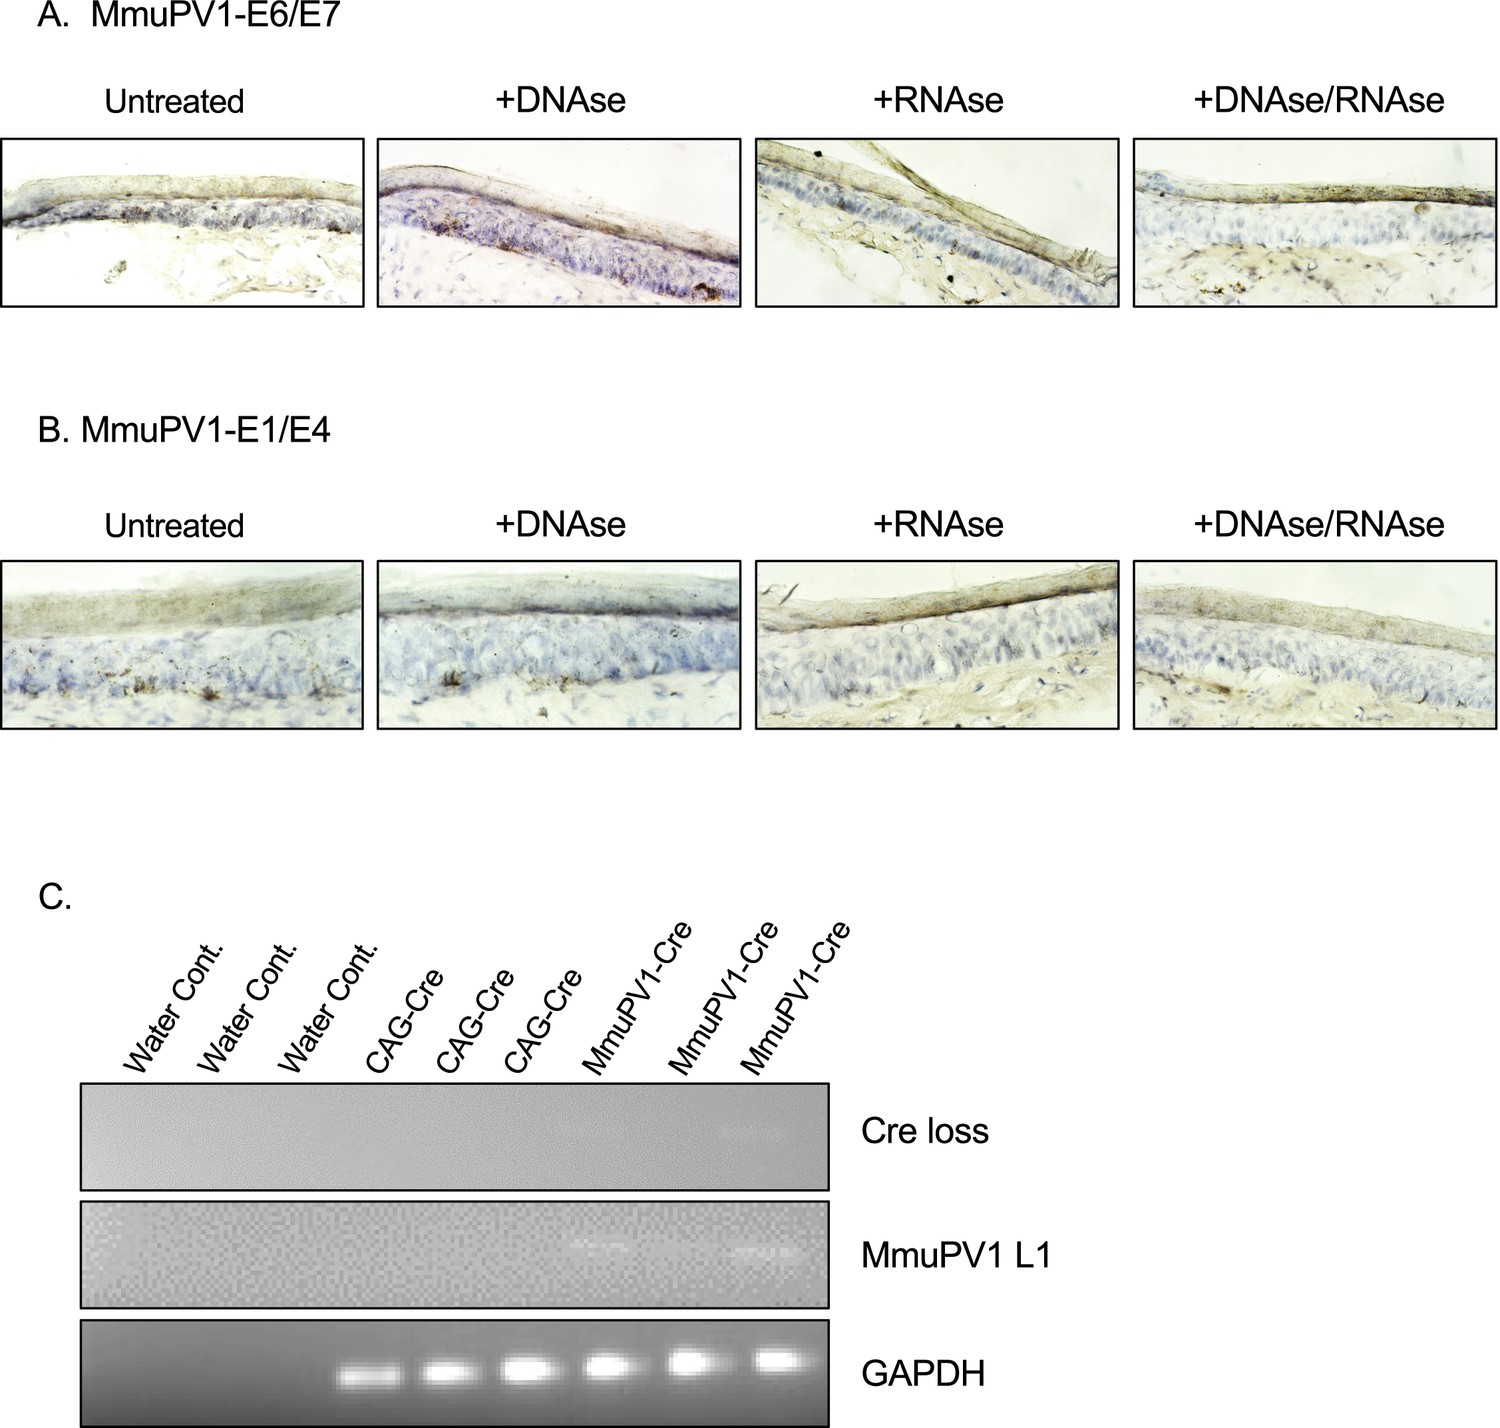
RNAscope controls with DNAse and/or RNAse and CAG-Cre controls for the detection of MmuPV1-L1 and Cre loss sequences.
(A–B) RNAscope of the MmuPV1-Cre plasmid delivered tail sections of the Rosa26-lox-stop-lox-YFP mice at 5 days post-delivery to assess the presence of viral transcripts E6/E7 (A) and E1/E4 (B), respectively. Tissue sections were either previously untreated or treated with DNAse alone, RNAse alone, or with both to differentiate the viral RNA signal from the viral genomic DNA signal. The presence of the transcripts appears as brown dots. (C) DNA isolated from the swab samples of the MmuPV1-Cre or CAG-Cre control plasmid delivered tail sections of the Rosa26-lox-stop-lox-YFP mice and was used for PCR amplification of the sequence flanking the Cre cassette (Cre loss) and L1 of MmuPV1 to determine the presence and the recombination of the MmuPV1-Cre plasmid after Cre expression.
Figure 4 with 2 supplements
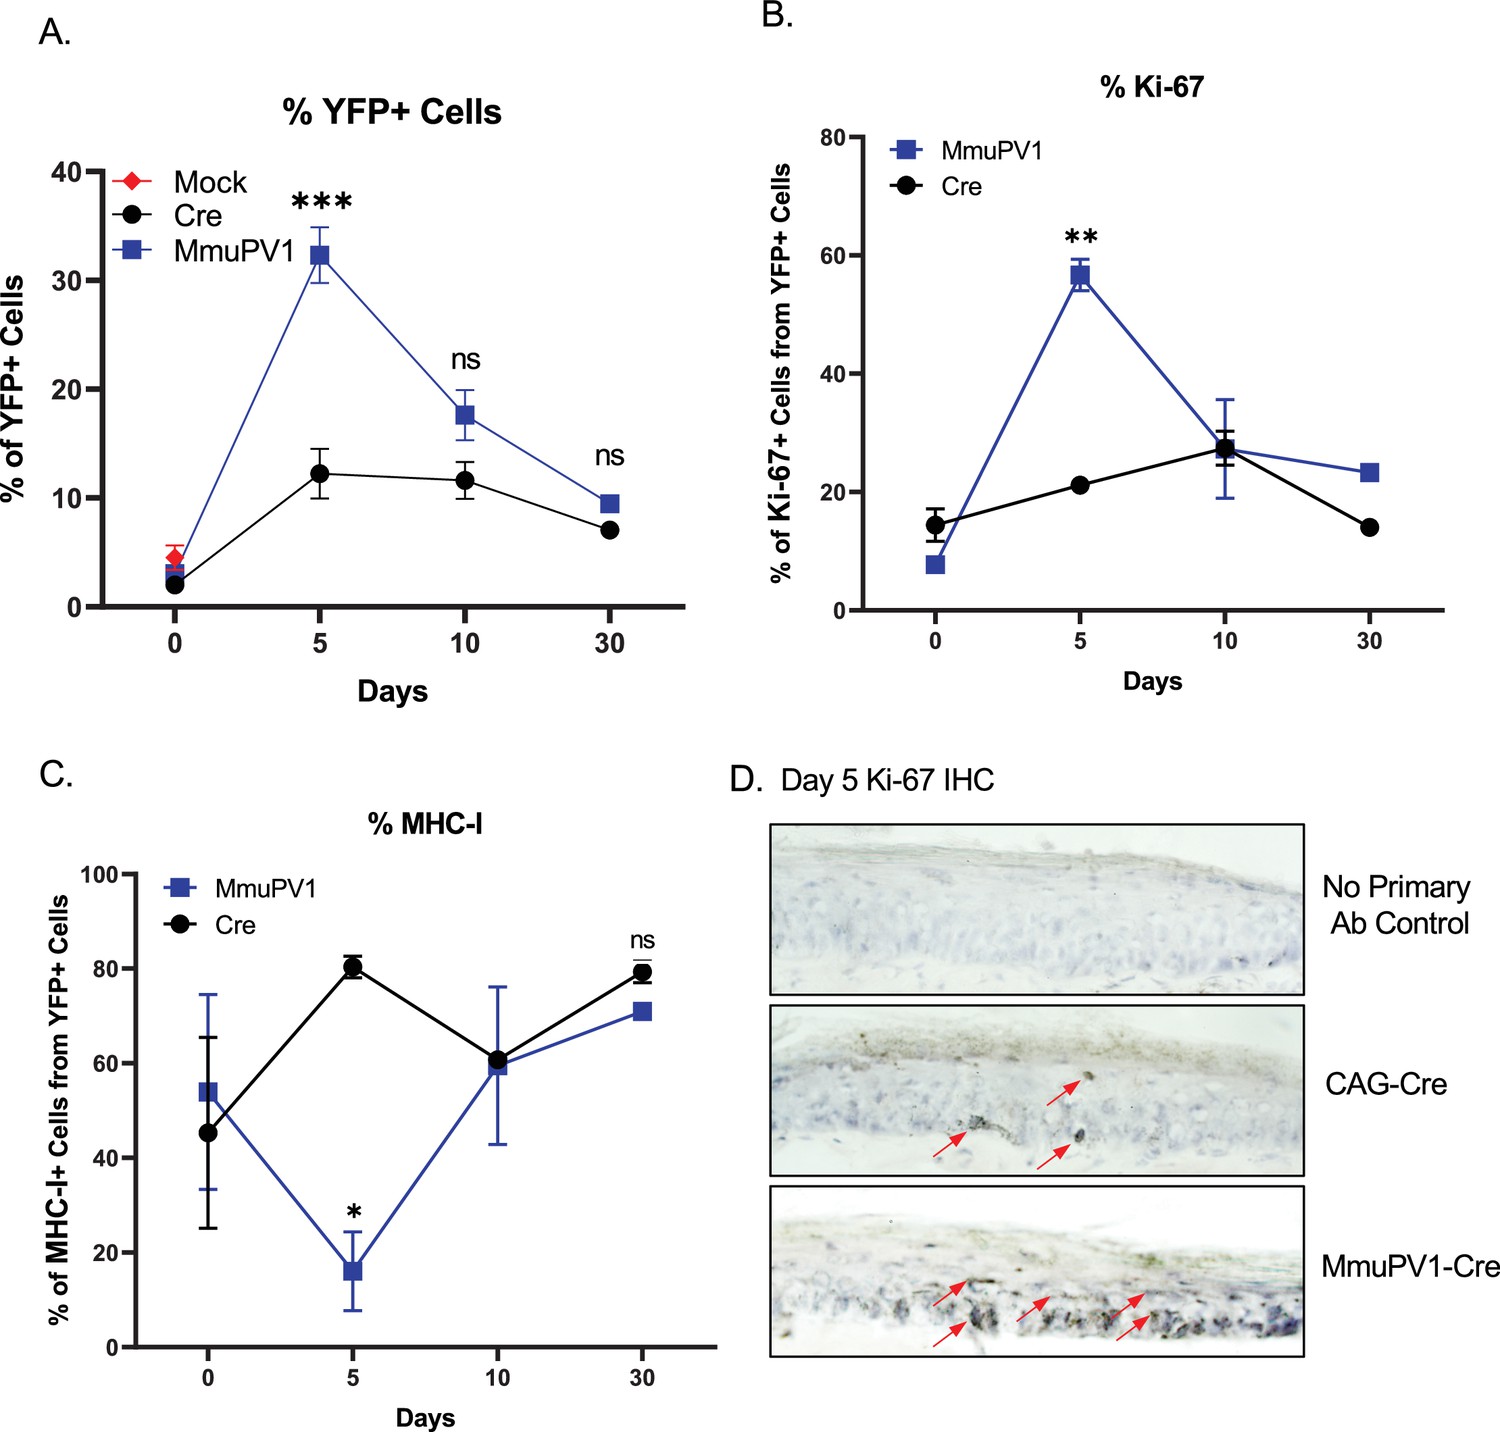
Cells with MmuPV1-lox-Cre-lox plasmid have increased proliferation rate and decreased MHC-I expression on the cell surface.
(A) Percentages of YFP+ cells. (B) Percentages of Ki-67+ cells out of only YFP+ cells. (C) Percentages of MHC-I+ cells out of only YFP+ cells. Mock infection with PBS (red square) was only performed for day 0 time point. (D) Representative immunohistochemistry images for Ki-67 staining (indicated by red arrows) on tail tissue sections at day 5 of post-delivery of CAG-Cre control or MmuPV1-Cre plasmid. Data representative of two independent experiments with n = 3 mice per group. The results are presented as mean ± SEM. Not significant (ns), * p < 0.05, ** p < 0.01 and *** p < 0.001 by nonparametric 2-way ANOVA test.
-
Figure 4—source data 1
The source data of FACS for Figure 4 and its supplements is included in a Microsoft Excel spreadsheet called “Source data - FACS”.
- https://cdn.elifesciences.org/articles/72638/elife-72638-fig4-data1-v1.xlsx
Figure 4—figure supplement 1
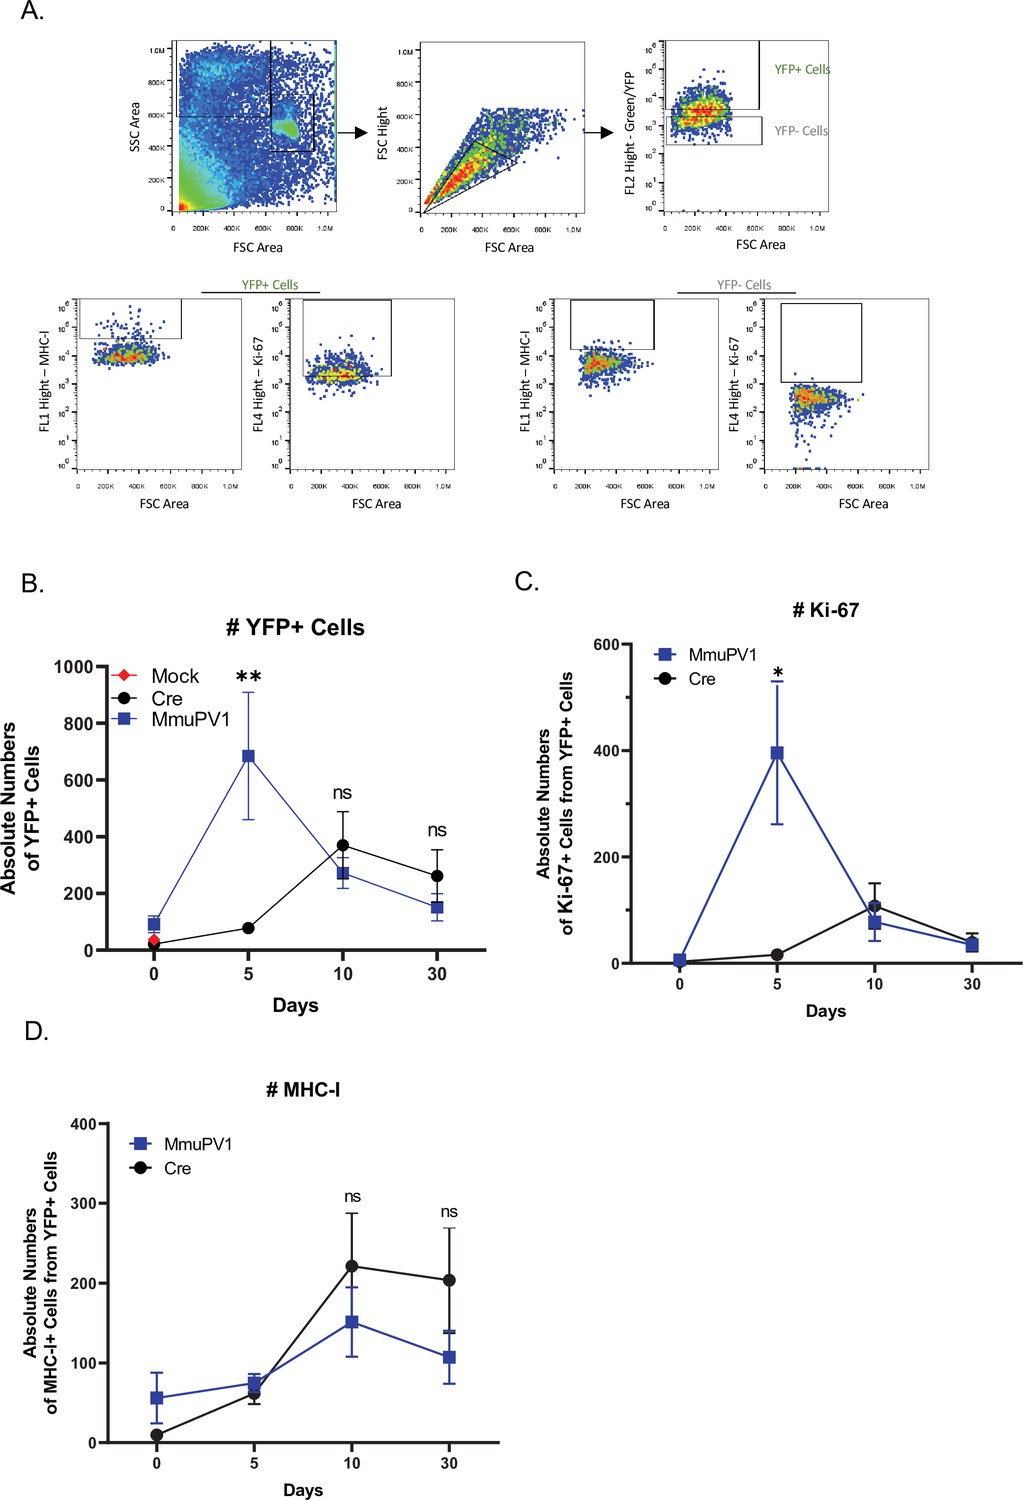
Cells with either MmuPV1-Cre or CAG-Cre control plasmid can be detected and analyzed by flow cytometry.
(A) The population of cells was detected depending on their size and complexity, omitting the dead cells (forward scatter (FSC)-side scatter (SSC) gate) and later excluding the doublets (FSC-height/FSC-area gate). (B) Absolute numbers of YFP+ cells. (C) Absolute numbers of Ki-67+ cells out of only YFP+ cells. (D) Absolute numbers of MHC-I+ cells out of only YFP+ cells. Data representative of two independent experiments with n = 3 mice per group. The results are presented as mean ± SEM. Not significant (ns), * p<0.05, ** p<0.01 and *** p<0.001 by nonparametric 2-way ANOVA test.
Figure 4—figure supplement 2
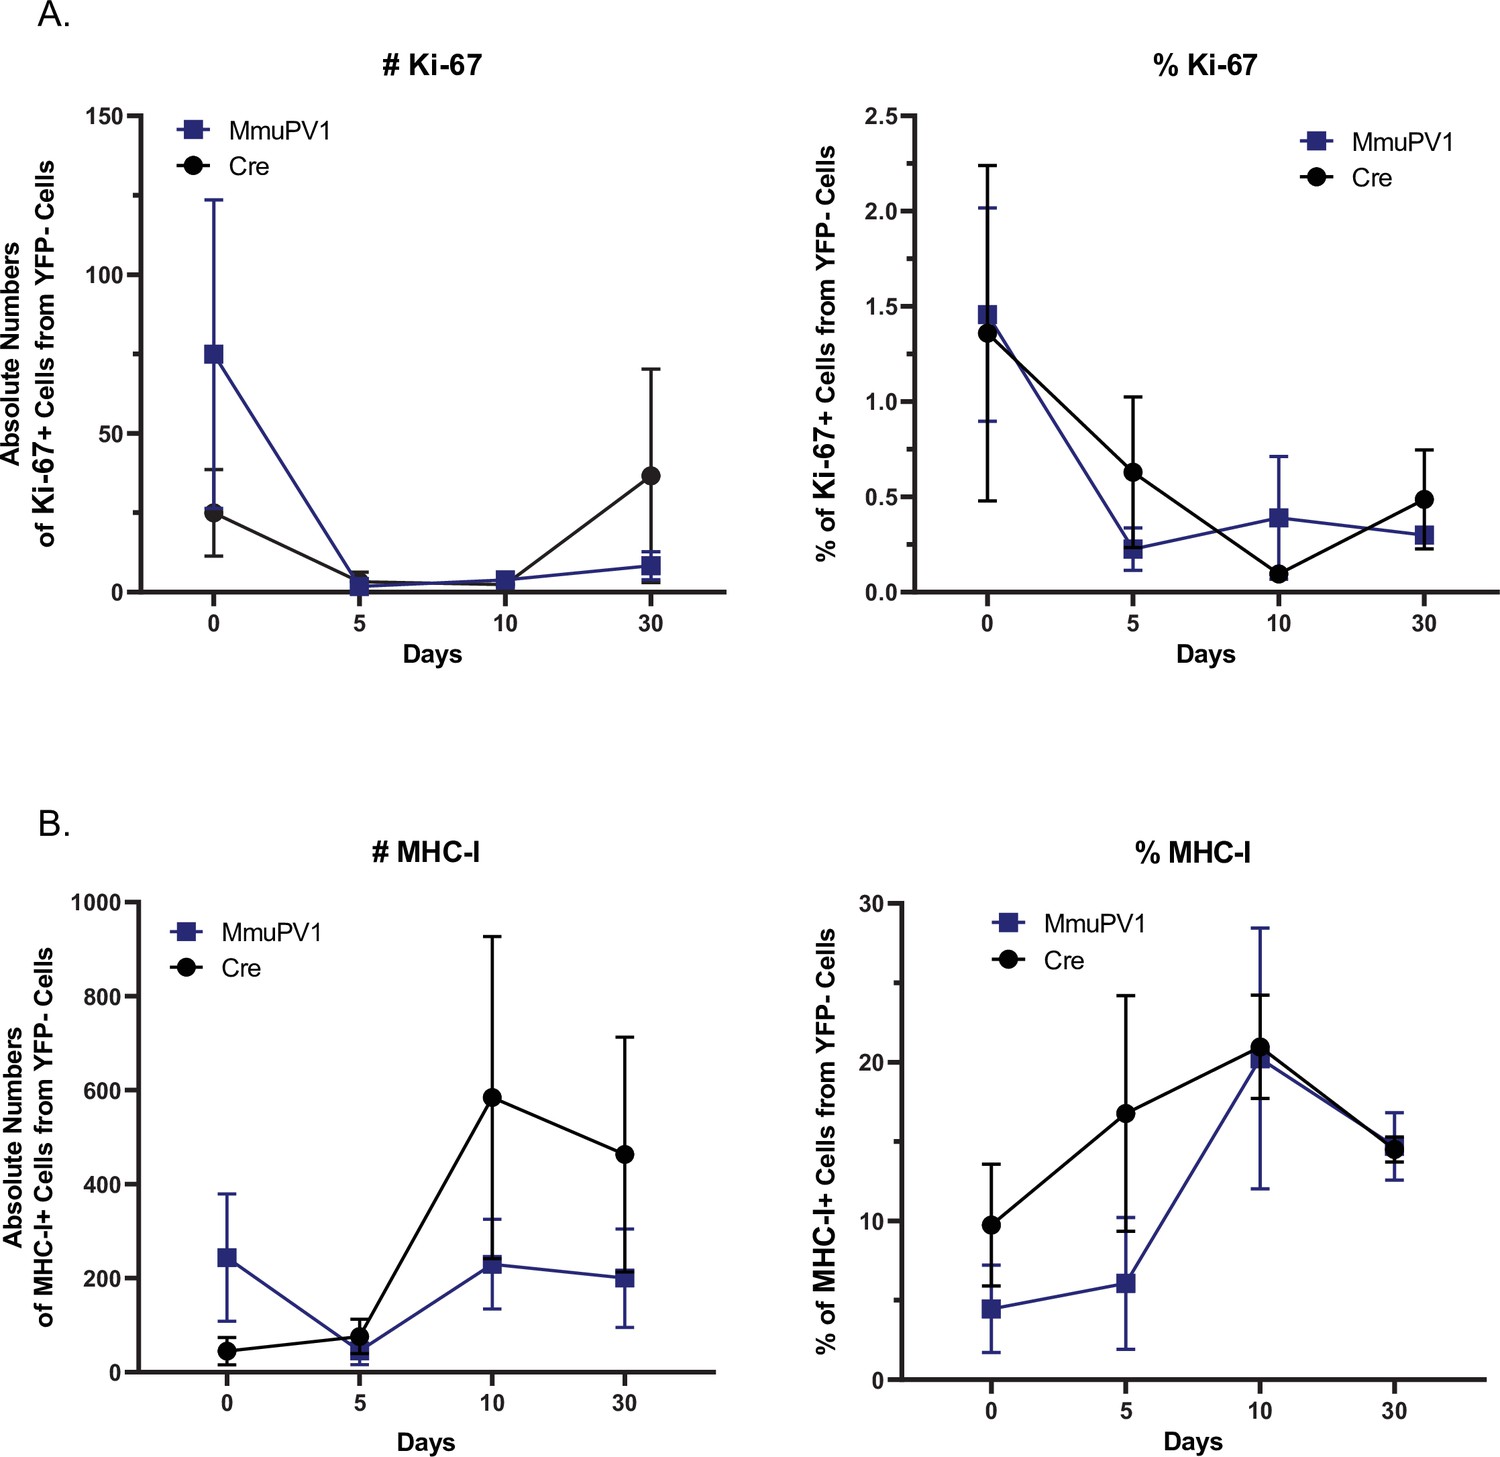
YFP- cells in the tissues treated with MmuPV1-Cre and CAG-Cre control plasmid have similar Ki-67 and MHC-I expression.
(A) Absolute numbers (left panel) and percentages (right panel) of Ki-67+ cells out of only YFP- cells. (B) Absolute numbers (left panel) and percentages (right panel) of MHC-I+ cells out of only YFP- cells. Data representative of two independent experiments with n = 3 mice per group. The results are presented as mean ± SEM. Not significant (ns), * p<0.05, ** p<0.01 and *** p< 0.001 by nonparametric 2-way ANOVA test (Figure 4).
Additional files
-
Source data 1
Source data for gels in Figures 1 and 3, Figure 3—figure supplement 1 are provided in a ZIP file called “Source data Gels”.
Source data for sequences and plasmid creation in detail are provided in a ZIP file called “Source data Sequences and Plasmid creation”. The source data of FACS for Figure 4 and its supplements is included in a Microsoft Excel spreadsheet called “Source data - FACS”.
- https://cdn.elifesciences.org/articles/72638/elife-72638-data1-v1.zip
-
Source data 2
Source data for sequences and plasmid creation in detail are provided in a ZIP file called “Source data Sequences and Plasmid creation”.
- https://cdn.elifesciences.org/articles/72638/elife-72638-data2-v1.zip
-
Transparent reporting form
- https://cdn.elifesciences.org/articles/72638/elife-72638-transrepform1-v1.pdf
Download links
A two-part list of links to download the article, or parts of the article, in various formats.
Downloads (link to download the article as PDF)
Open citations (links to open the citations from this article in various online reference manager services)
Cite this article (links to download the citations from this article in formats compatible with various reference manager tools)
A novel lineage-tracing mouse model for studying early MmuPV1 infections
eLife 11:e72638.
https://doi.org/10.7554/eLife.72638


