Structures of topoisomerase V in complex with DNA reveal unusual DNA-binding mode and novel relaxation mechanism
- Department of Molecular Biosciences, Northwestern University, United States
Figures
Figure 1 with 1 supplement
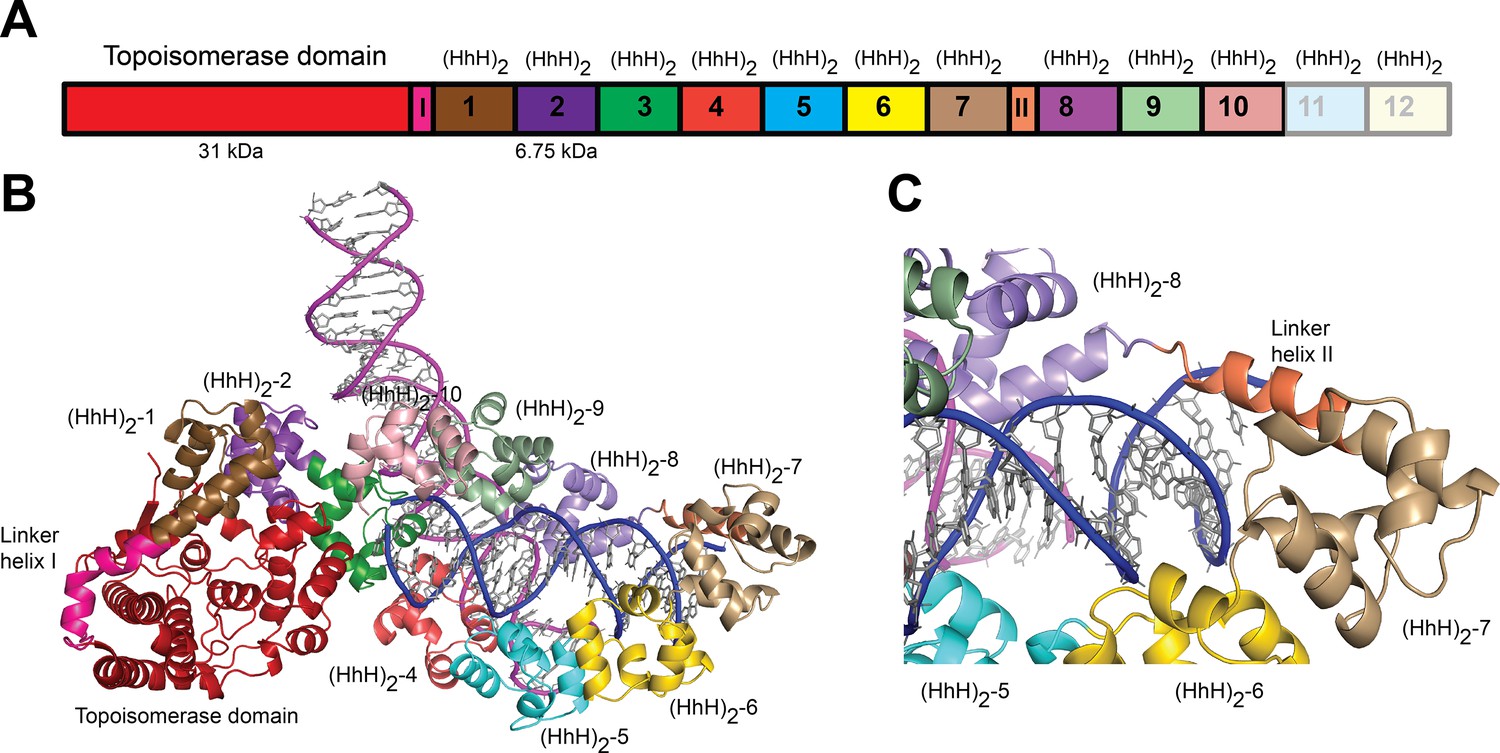
Structure of topoisomerase V in complex with asymmetric DNA.
(A) Schematic diagram of the domain organization of topoisomerase V. The protein contains a small, 31-kDa topoisomerase domain followed by twelve (HhH)2 domains each formed by two (HhH) repeats. There are linker helices between the topoisomerase and the first (HhH)2 domain (LI) as well as between repeats 7 and 8 (LII). Repeats 11 and 12 are not part of the structure. (B) Cartoon showing the structure of topoisomerase V in complex with asymmetric DNA. Each protein monomer binds two different half DNA molecules. The two different DNA molecules are shown colored in pink and blue. The topoisomerase domain remains blocked by the (HhH)2 domains preventing access to the active site. (C) Closeup view of the region around repeats 7 and 8, which are connected by Linker helix II. The linker helix serves to connect two sets of domains and sits above the major groove of the DNA. In this structure, one DNA is surrounded by the (HhH)2 domains while the other sits between (HhH)2 domains. The domains are colored using the same scheme as in the (A) diagram.
Figure 1—figure supplement 1
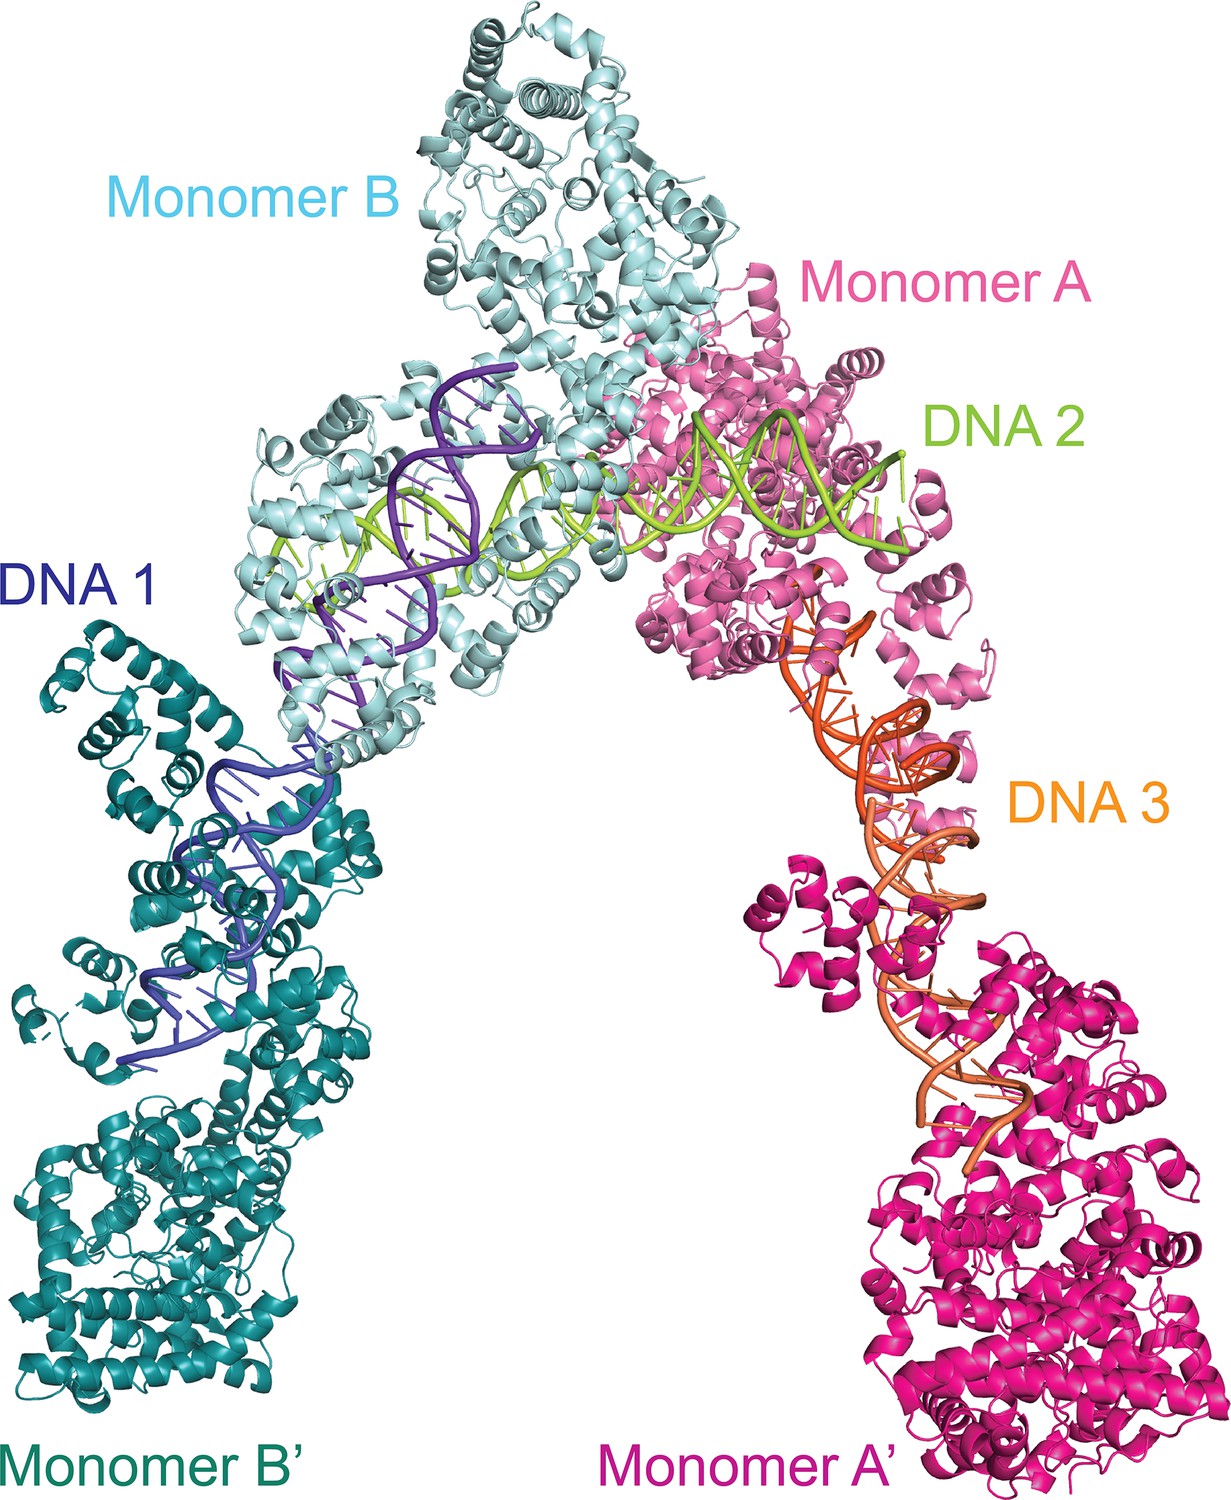
Dimers in the crystal of the topoisomerase V with asymmetric DNA complex.
The diagram shows the way the molecules are arranged in the crystal. Two of the DNA molecules, DNA 1 and DNA 3, each bind two protein monomers (A, A’ and B, B’) each surrounding one half of the DNA. The center of the DNA in these two molecules sits on crystallographic twofold axes. The third DNA molecule, DNA 2, binds two protein monomers (A, B), but in this case the DNA is not surrounded by the protein.
Figure 2 with 4 supplements
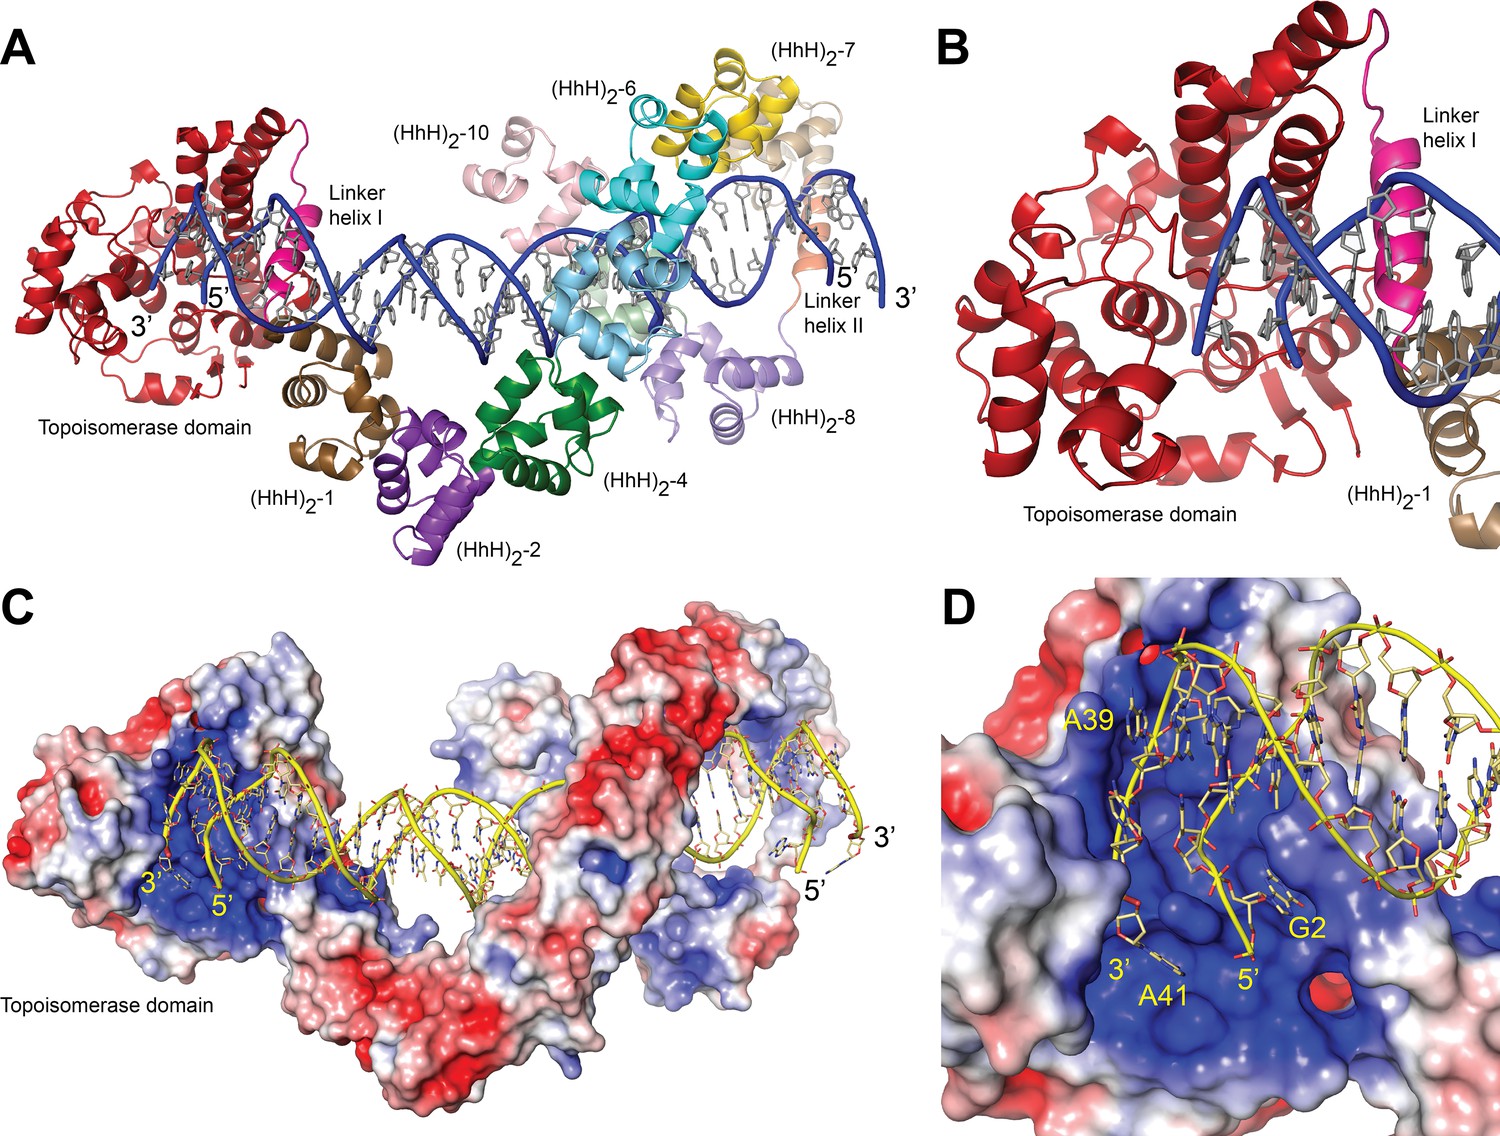
Structure of topoisomerase V in complex with symmetric DNA.
(A) Cartoon showing the structure of topoisomerase V in complex with symmetric 40 bp DNA. Each DNA molecule is bound by two protein molecules in a symmetric manner; only one protein molecule is shown. In the structure, the topoisomerase domain moves away from the (HhH)2 domains allowing access to the active site. The (HhH)2 domains wrap around the DNA. (B) Closeup view of the topoisomerase domain (red). Linker helix I (pink) changes conformation to allow movement of the domains and expose the active site. (C) Electrostatic surface of topoisomerase V in the bound conformation. The interior of the cavity formed by the (HhH)2 domains is slightly positively charged, forming a region where the DNA can bind. The end of the DNA molecule enters the topoisomerase active site. (D) Closeup view of the topoisomerase domain active site. The DNA enters a highly positively charged groove where the active site residues are located. To enter the active site, the DNA bends and the base pairing between bases is broken. The protein domains are colored as in Figure 1. The surface is colored with a blue to red gradient from +5 to −5 KbT/ec.
Figure 2—figure supplement 1
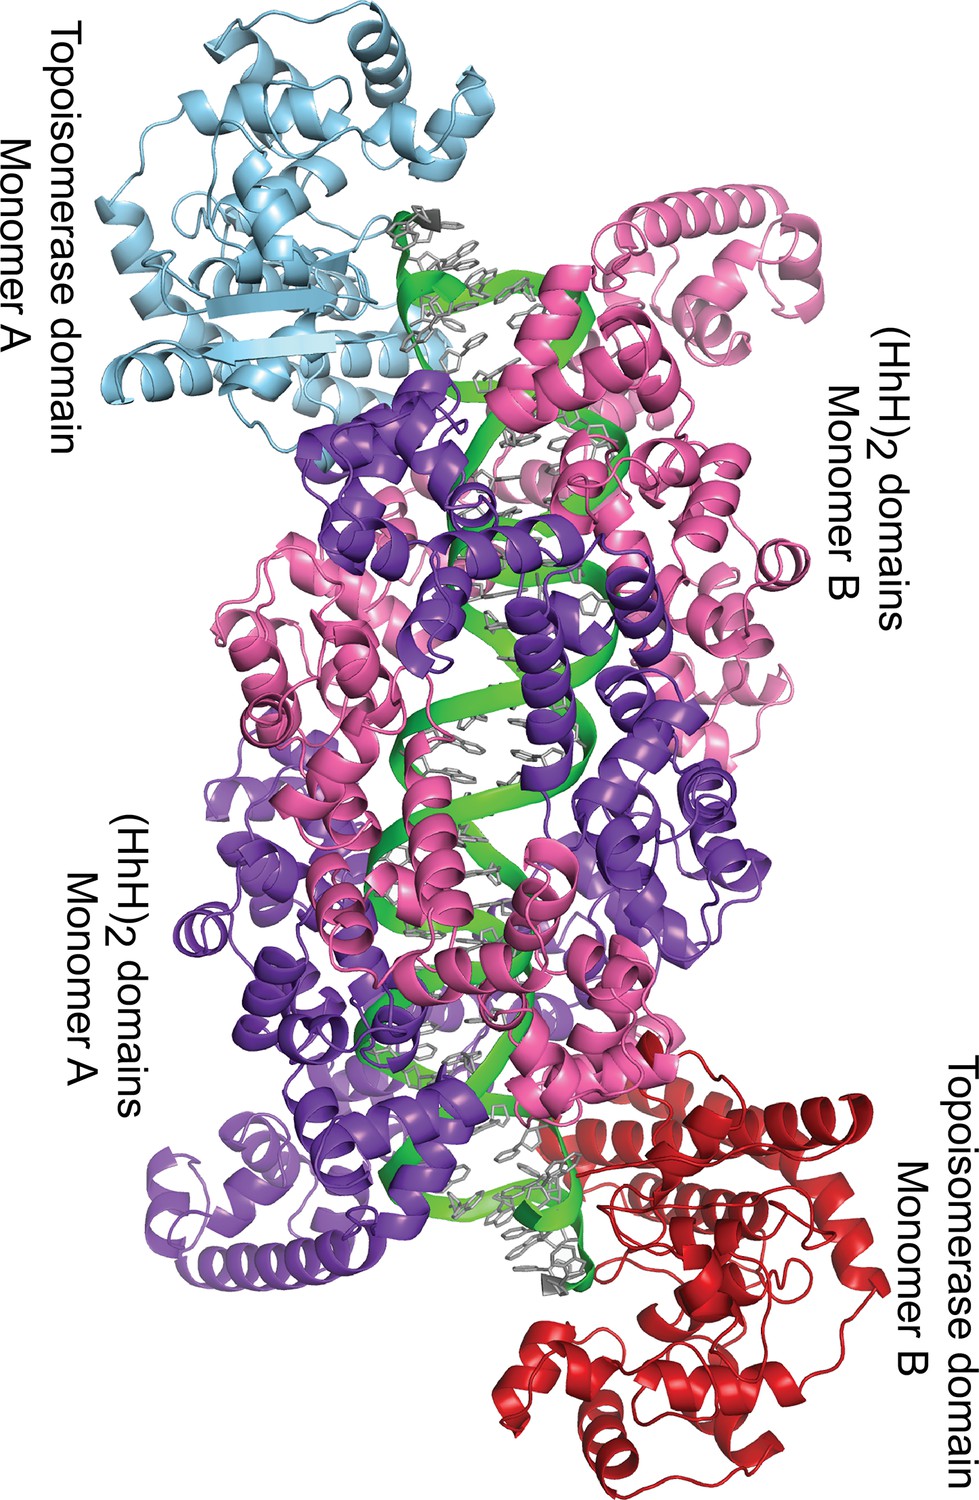
Dimer in the crystal of topoisomerase V with symmetric 39 bp DNA.
The diagram shows the way the molecules are arranged in the crystal. Each dimer in the crystal is formed by one DNA molecule (green), and two protein monomers (blue and purple, and red and pink). For the 39 bp DNA, the dimer is almost perfectly symmetric with the two halves of the DNA identical. This is not the case in the 38 and 40 bp symmetric DNA complexes, where the DNA is different around the abasic site in each half. Despite the small differences in the DNA, the protein is identical in all complexes.
Figure 2—figure supplement 2
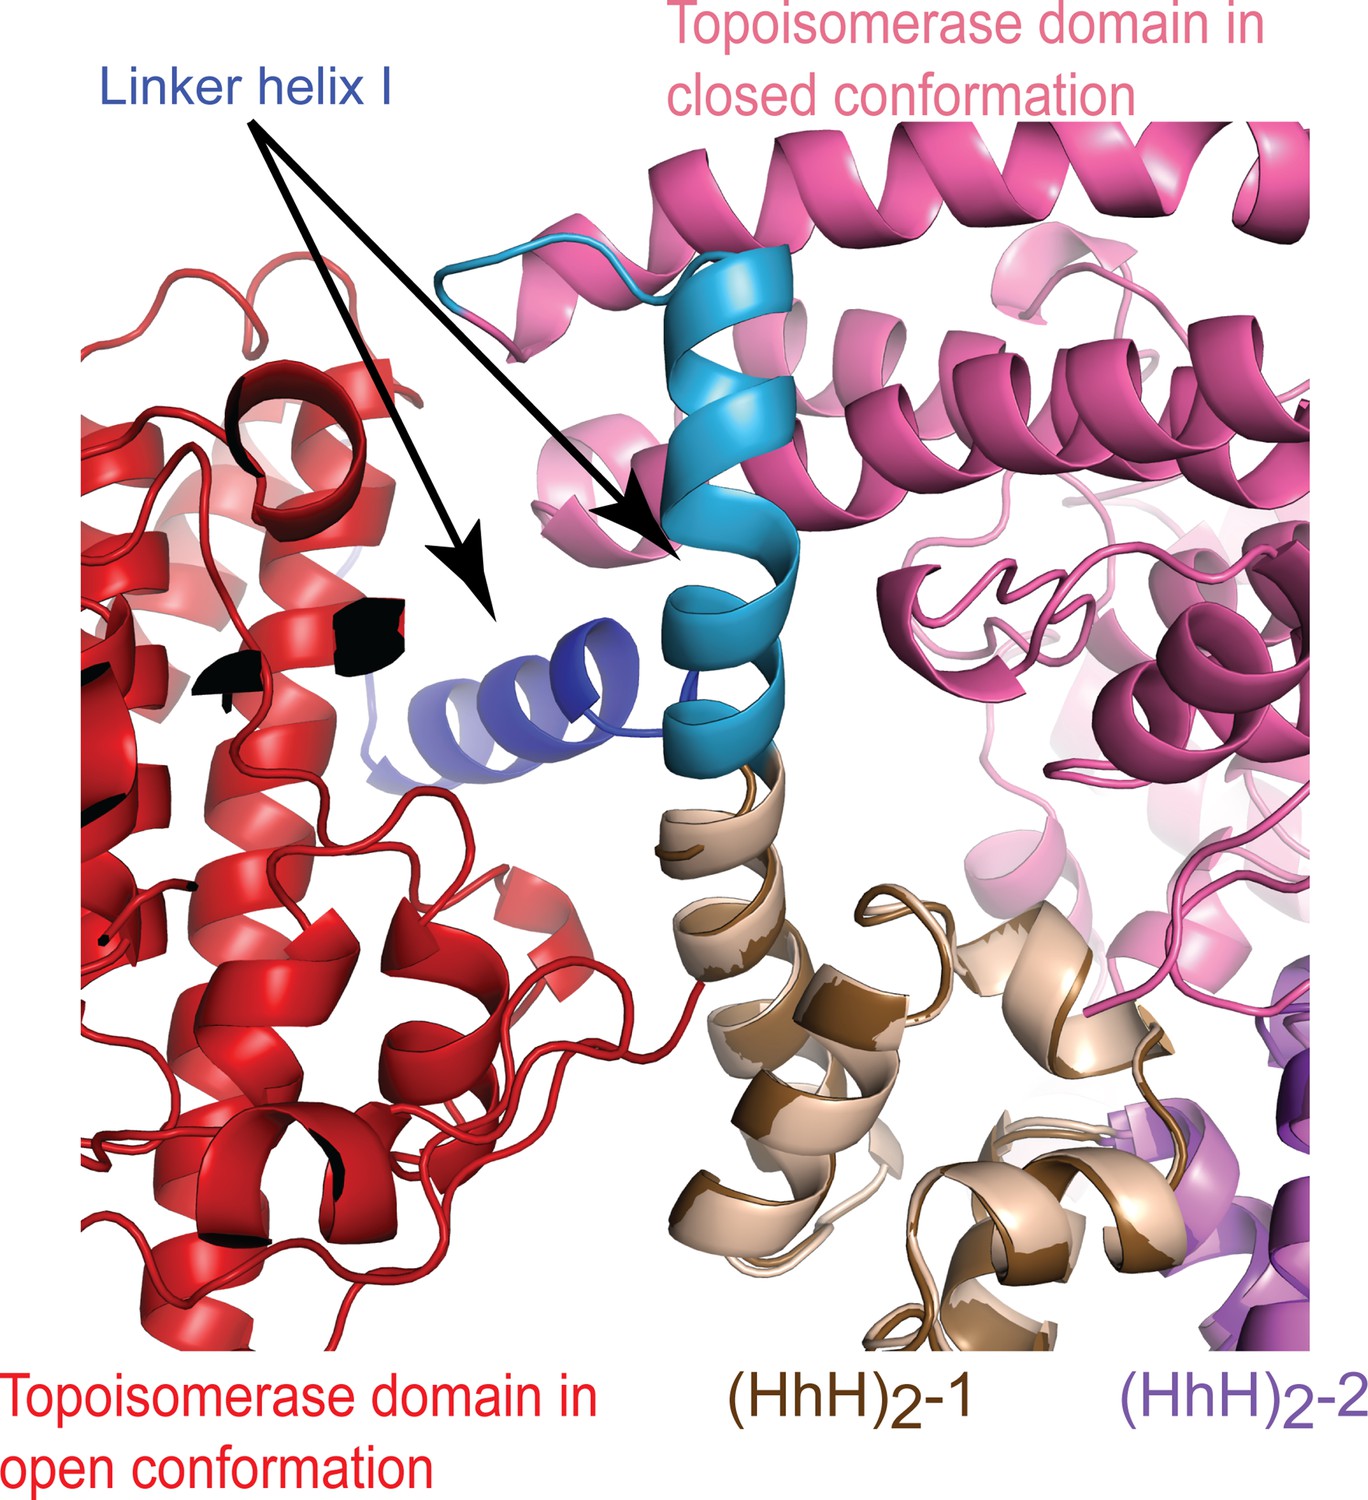
A conformational change in Linker helix I exposes the topoisomerase active site.
Superposition of the closed and open conformations of topoisomerase V in complex with DNA. For the figure, (HhH)2 domains 1 and 2 (brown and purple, respectively) were superposed in the asymmetric DNA (closed) and symmetric DNA (open) complexes. In the open complex, the topoisomerase domain is colored red, whereas it is colored pink in the closed complex. The only major change is the breaking of the linker helix (blue/brown). This conformational change causes the topoisomerase domain to move away from the (HhH)2 domains and expose the active site.
Figure 2—figure supplement 3
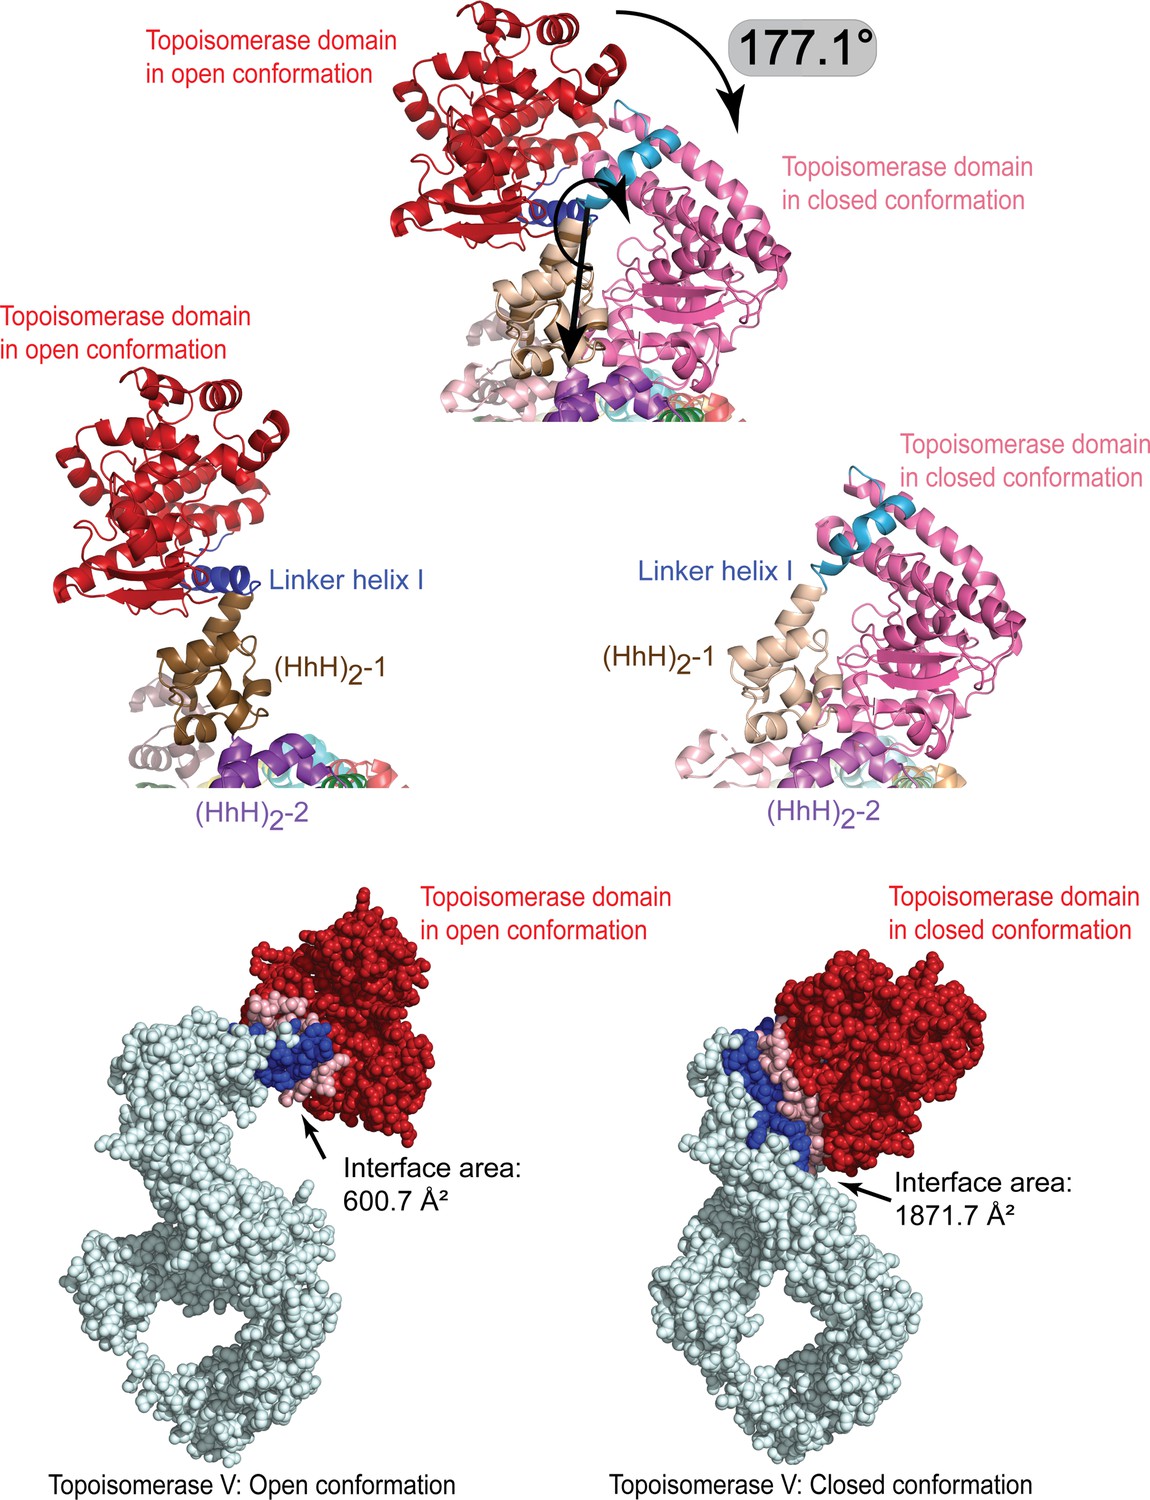
Breaking of the linker helix separates the topoisomerase V domains.
(Top) The topoisomerase domain separates from the (HhH)2 domains by rotating by close to 180° around the break in the linker helix. The topoisomerase domain (red/pink) moves as a rigid body with no major conformational changes observed. (Middle) Side-by-side comparison of the protein in the open and closed conformation to illustrate the change in the linker helix (blue). The linker helix breaks and changes conformation promoting the movement of the topoisomerase domain. (Bottom) Surface representation of the open and close conformations with the residues at the interface colored in blue. The interface surface area is much larger in the close conformation than in the open conformation, suggesting that the closed conformation is more stable in the absence of DNA. For the figures, the (HhH)2 domains 1 and 2 (brown and purple, respectively) in the closed and open conformations were superposed. The interface area was calculated using the PISA server (Krissinel and Henrick, 2007).
Figure 2—figure supplement 4

Model of the full-length topoisomerase V based on the structure of the 97 kDa fragment in complex with symmetric 39 bp DNA.
(A) A model for the missing last two (HhH)2 domains was calculated using AlphaFold2 (Jumper et al., 2021) and built into the Topo-97(ΔRS2) dimer structure. The panel of the left shows the model with the added (HhH)2 domains in brighter colors. The center panel shows a surface representation of the crystal structure. These panels serve to illustrate that the dimer cannot be formed from the full-length protein as there would be significant steric clashes. (B) Model of the full-length topoisomerase V bound to DNA. The model shows that the additional (HhH)2 domains (repeats 11 and 12) would continue wrapping around the DNA to almost encircle it. This model suggests that the full-length protein could easily bind in a similar manner as the Topo-97 fragment but can only do so as a monomer.
Figure 3 with 1 supplement
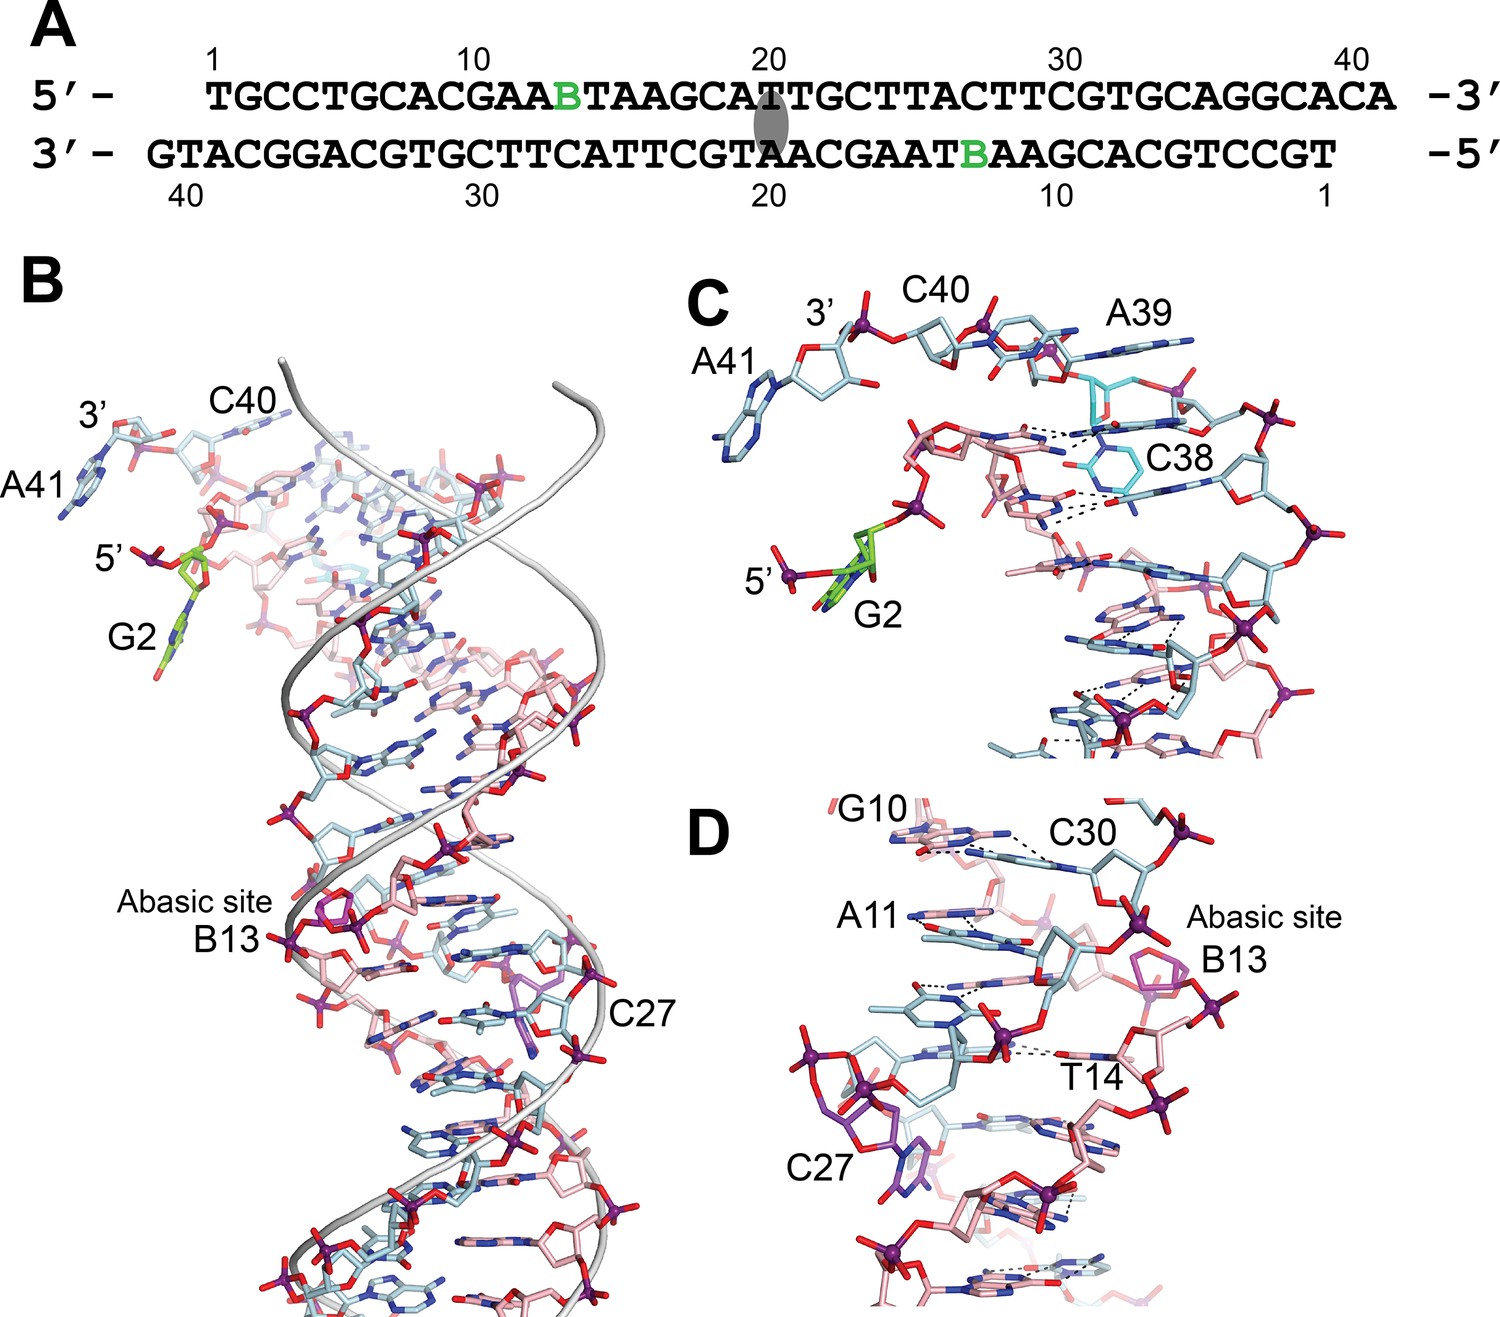
DNA in the structure of topoisomerase V with 39 bp DNA.
(A) Sequence of the 39 bp DNA in the structure. The DNA is symmetric, with the twofold axis passing through the central base pair. The abasic sites are shown with a green B. (B) Stick diagram of one half of the 39 bp DNA in the complex. The DNA molecule is bent due to the presence of the abasic sites. For comparison, the phosphate backbone path of a B DNA molecule is shown as a grey tube. Note that the bending occurs around position B13, the abasic site. For clarity, the carbon atoms in one strand are colored in light blue and on the complementary strand in pink. (C) Closeup view of the end of the molecule. The DNA is bent where it enters the active site and the bending causes the base paring to break. The second nucleotide, G2 (green), is not base paired to its corresponding base pair, C38 (cyan). The latter unstacks from the helix to allow the next nucleotide A39, to interact with the protein. The first nucleotide, T1, is disordered in the structure. (D) Closeup view of the region around the abasic site. The abasic site (B13, magenta) causes the DNA to bend. The corresponding base pair, C27 (purple), completely unstacks from the helix and the base enters the minor groove. The unstacking of C27 plus the movement of the sugar in the abasic site allows the stacking of bases to continue without any gaps, despite the presence of the abasic site.
Figure 3—figure supplement 1
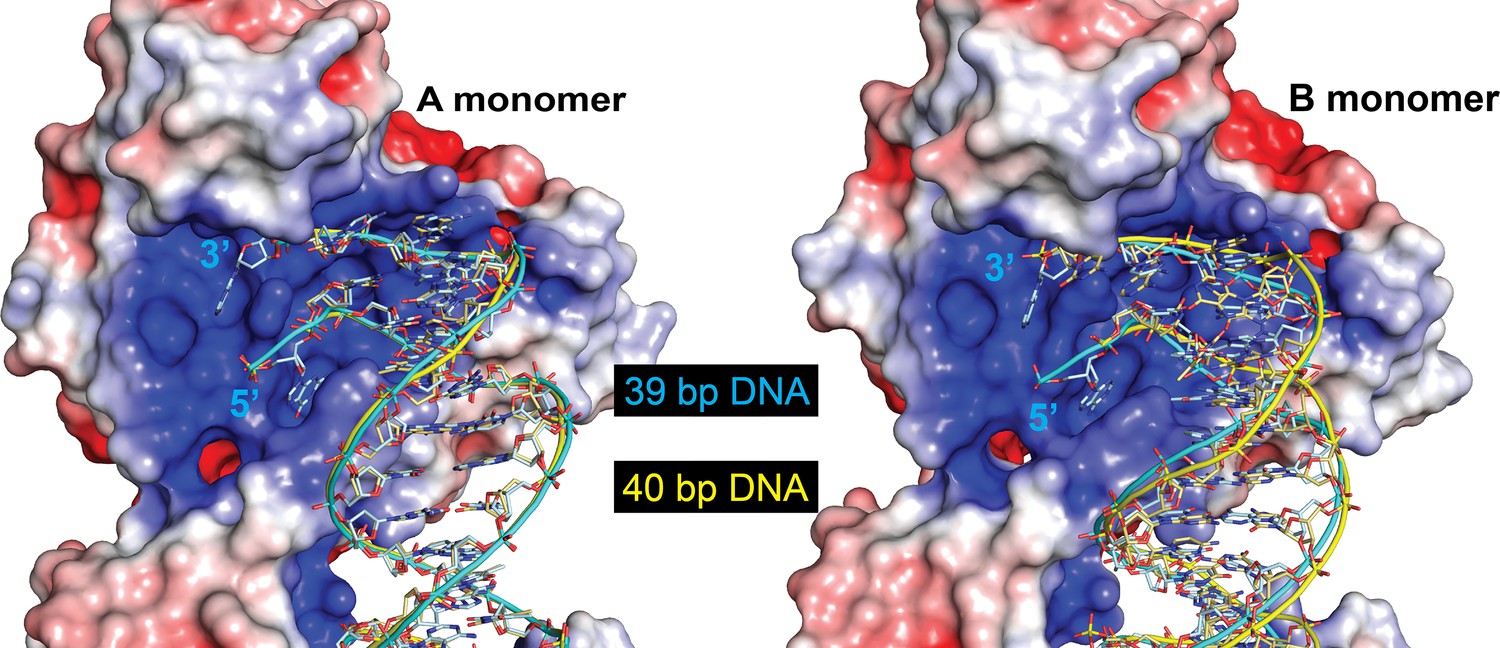
The protein can accommodate different length DNA entering the active site.
The figure shows the DNA in the 39-bp symmetric DNA complex (cyan) with the DNA from the 40-bp DNA symmetric complex (yellow) superposed. The electrostatic surface corresponds to the 39-bp symmetric complex. The path of the DNA is identical in the A monomer (left), but follows a slightly different path in the B monomer (right). The change in path is needed to accommodate the different lengths of the two halves of the DNA. Even though the path is slightly different in the B monomer, the ends of the DNA are in the same position and the DNA enters the active site identically.
Figure 4 with 1 supplement

Mutagenesis supports the role of different topoisomerase V residues in DNA binding and conformational changes.
Site-directed mutagenesis of the protein (Table 5) was used to probe the role of various residues around three regions (delineated by ellipses). The figure shows the mutated residues colored by results (green: wild-type level of activity, blue: reduced activity, orange: minimal activity, and pink: no activity). In many instances single mutants have a modest effect, but combination of them have more dramatic results. Arg108 is essential for activity and Arg83, Ala132, and Leu290 show very reduced activity. Arg108 is near the active site and may participate in catalysis, whereas Leu290 is part of the linker region that changes conformation upon DNA binding. Single mutations of positively charged residues facing DNA tend to be benign, but combinations or charge reversal led to reduced activity.
Figure 4—figure supplement 1
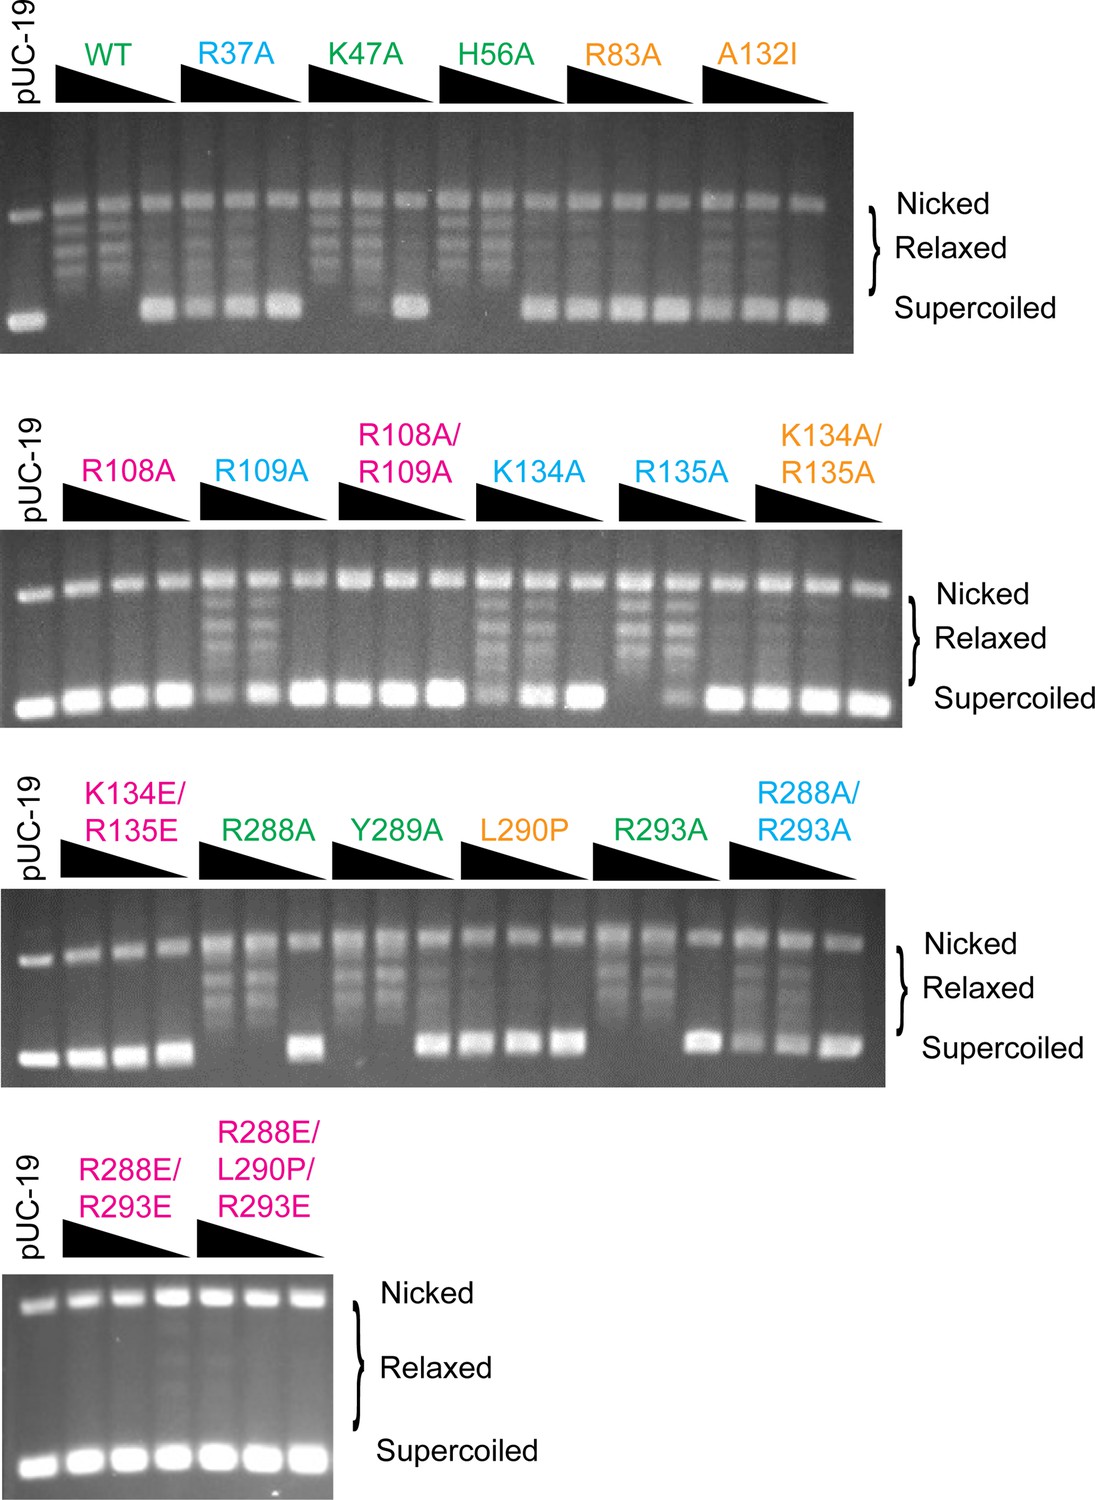
DNA relaxation assay for the topoisomerase V mutants analyzed.
The figure shows typical DNA relaxation assays for all mutants studied. For each mutant DNA relaxation assays 0.15, 1.5, and 3.5 µg of the enzyme and 306 ng of negatively supercoiled pUC19 plasmid were used as described in Methods. Each experiment was done at least in triplicate with very consistent results. Mutants are labeled and colored to reflect the assessed level of activity (green: wild-type level of activity, blue: reduced activity, orange: minimal activity, and pink: no activity). The location of supercoiled, relaxed, and nicked plasmid DNA is marked.
-
Figure 4—figure supplement 1—source data 1
DNA relaxation assay for topoisomerase V mutants analyzed.
The figure shows typical DNA relaxation assays for the wild-type protein and the Arg37Ala, Lys47Ala, His56Ala, Arg83Ala, and Ala132Ile mutants. For each relaxation assay, 0.15, 1.5, and 3.5 µg of the enzyme were used together with 306 ng of negatively supercoiled pUC19 plasmid (Materials and methods). Mutants are labeled and colored to reflect the assessed level of activity (green: wild-type level of activity, blue: reduced activity, orange: minimal activity, and pink: no activity). The location of supercoiled, relaxed, and nicked plasmid DNA is marked.
- https://cdn.elifesciences.org/articles/72702/elife-72702-fig4-figsupp1-data1-v2.zip
-
Figure 4—figure supplement 1—source data 2
DNA relaxation assay for topoisomerase V mutants analyzed.
The figure shows typical DNA relaxation assays for the Arg108Ala, Arg109Ala, Arg108Ala/Arg109Ala, Lys134Ala, Arg135Ala, and Lys134Ala/Arg135Ala mutants. For each relaxation assay, 0.15, 1.5, and 3.5 µg of the enzyme were used together with 306 ng of negatively supercoiled pUC19 plasmid (Materials and methods). Mutants are labeled and colored to reflect the assessed level of activity (green: wild-type level of activity, blue: reduced activity, orange: minimal activity, and pink: no activity). The location of supercoiled, relaxed, and nicked plasmid DNA is marked.
- https://cdn.elifesciences.org/articles/72702/elife-72702-fig4-figsupp1-data2-v2.zip
-
Figure 4—figure supplement 1—source data 3
DNA relaxation assay for topoisomerase V mutants analyzed.
The figure shows typical DNA relaxation assays for the Lys134Glu/Arg135Glu, Arg228Ala, Tyr289Ala, Leu290Pro, Arg293Ala, and Arg288Ala/Arg293Ala mutants. For each relaxation assay, 0.15, 1.5, and 3.5 µg of the enzyme were used together with 306 ng of negatively supercoiled pUC19 plasmid (Materials and methods). Mutants are labeled and colored to reflect the assessed level of activity (green: wild-type level of activity, blue: reduced activity, orange: minimal activity, and pink: no activity). The location of supercoiled, relaxed, and nicked plasmid DNA is marked.
- https://cdn.elifesciences.org/articles/72702/elife-72702-fig4-figsupp1-data3-v2.zip
-
Figure 4—figure supplement 1—source data 4
DNA relaxation assay for topoisomerase V mutants analyzed.
The figure shows typical DNA relaxation assays for Arg288Glu/Arg293Glu and Arg288Glu/Leu290Pro/Arg293Glu mutants. For each relaxation assay, 0.15, 1.5, and 3.5 µg of the enzyme were used together with 306 ng of negatively supercoiled pUC19 plasmid (Materials and methods). Mutants are labeled and colored to reflect the assessed level of activity (green: wild-type level of activity, blue: reduced activity, orange: minimal activity, and pink: no activity). The location of supercoiled, relaxed, and nicked plasmid DNA is marked.
- https://cdn.elifesciences.org/articles/72702/elife-72702-fig4-figsupp1-data4-v2.zip
Figure 5 with 1 supplement
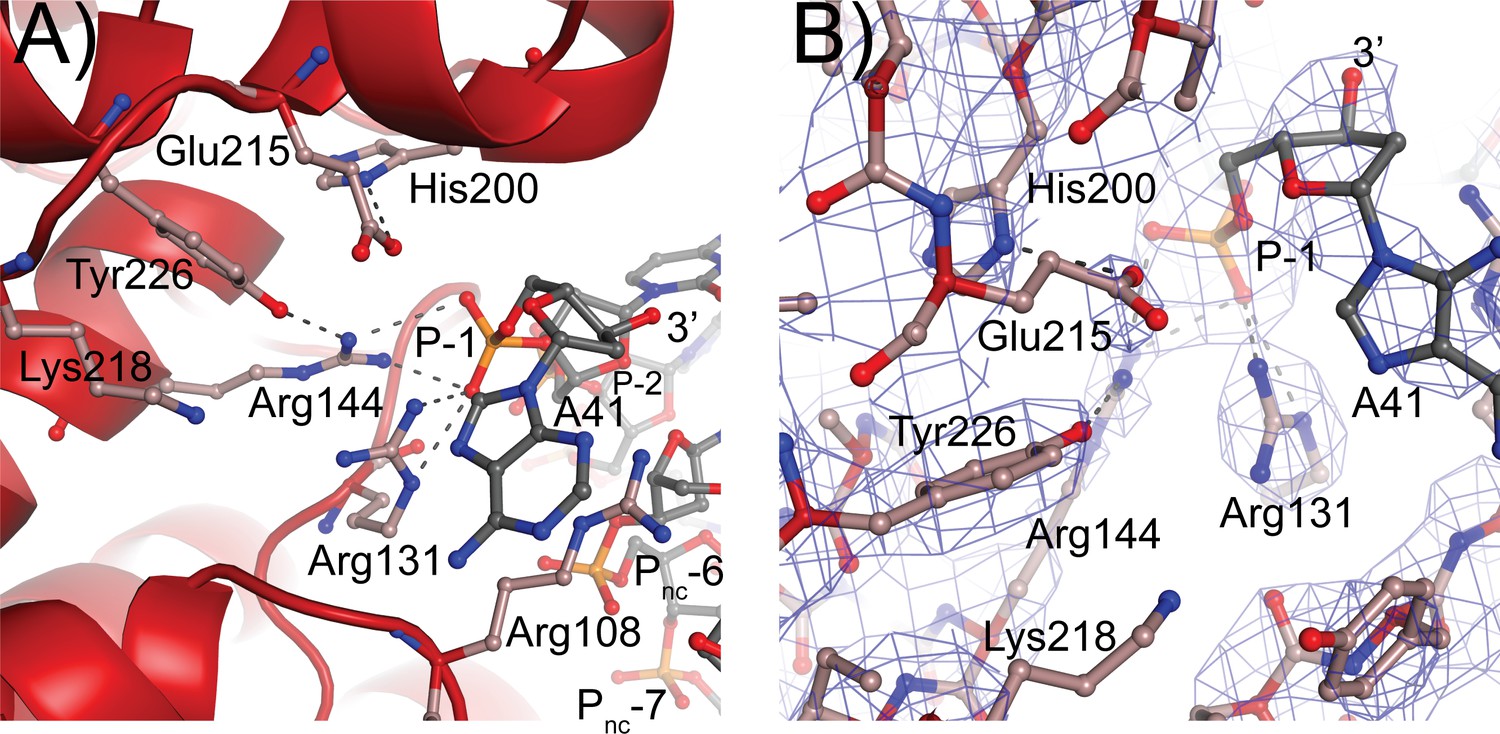
Topoisomerase V active site.
(A) Diagram of the active site in the topoisomerase V with 40-bp symmetric DNA complex. The diagram shows the side chains that have been implicated in the cleavage/religation reaction. The DNA approaches the active site and comes close to the active site tyrosine (Tyr226). The preceding phosphate (P-1) is contacted by three arginines, Arg108, Arg131, and Arg144. His200 is too far away from the phosphate backbone, but is hydrogen bonded to Glu215. The latter is in a suitable position to contact the DNA phosphate backbone. Lys218 is in a position where it could contact the phosphate backbone during cleavage/religation. Arg108, which was identified as essential, lies between the two DNA strands and contacts both the P-1 phosphate on the cleaved strand and the Pnc-6 phosphate on the noncleaved strand. Due to the melting of the DNA the cleaved and noncleaved strands follow different paths resulting in the phosphate five bases away in the noncleaved strand (Pnc-6) facing the P-1 phosphate in the cleaved strand. (B) Simulated annealing omit map of the topoisomerase V with 40-bp symmetric DNA complex structure. The diagram presents another view of the active site as well as the omit electron density around that region at the 1 σ level.
Figure 5—figure supplement 1
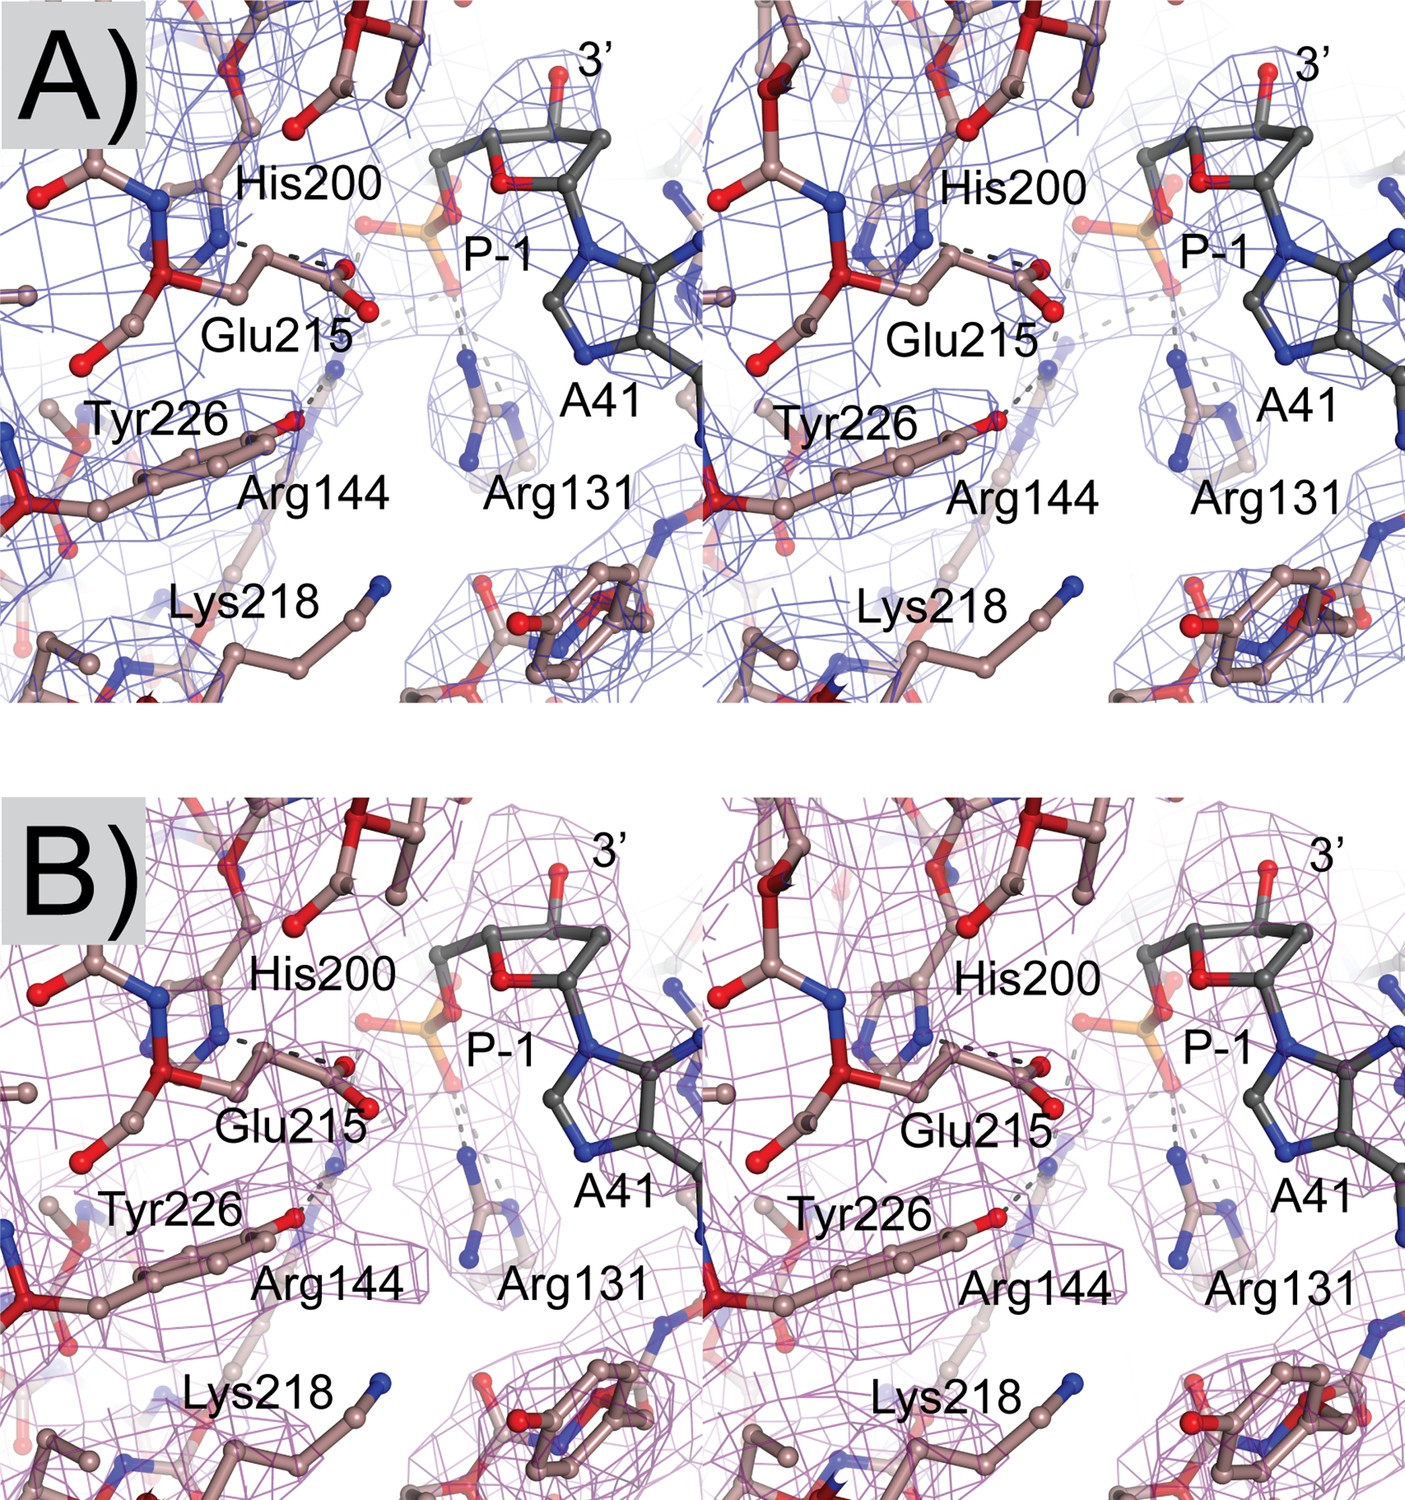
Electron density maps of the topoisomerase V in complex with 39-bp symmetric DNA.
(A) Stereo diagram of the active site region showing a 2mFo-DFc map. The map is contoured at the 1.4 σ level. (B) Stereo diagram of the same region as in (A) but showing a simulated annealing omit map contoured at the 1.0 σ level. Both maps were calculated with Phenix (Adams et al., 2010).
Figure 6
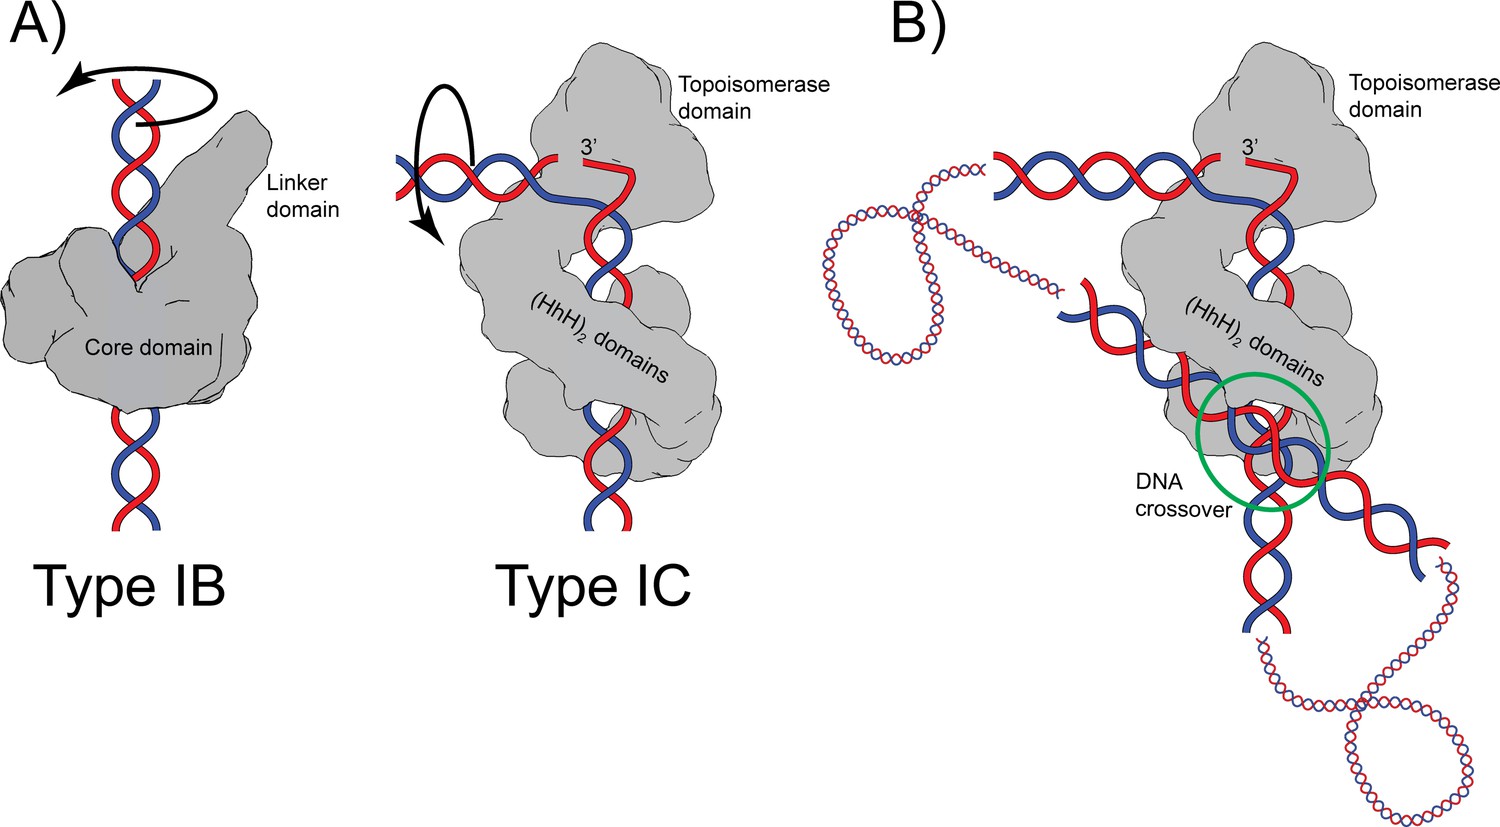
Proposed mechanism of relaxation for type IB and IC topoisomerases.
(A) Cartoons of the proposed relaxation mechanism for type IB and IC enzymes, illustrated by a human topoisomerase complex and topoisomerase V, respectively. The proteins are shown as a surface based on their structure whereas the DNA is shown in cartoon form. (Left) Type IB enzymes relax DNA by enclosing it and cleaving one strand, allowing for strand rotation or swiveling. The DNA is not bent or distorted. (Right) Type IC topoisomerases do not surround the DNA around the active site region. They surround the DNA using tandem (HhH)2 domains, which appear to serve as a processivity factor. The DNA is highly bent around the active site region and this bending melts the two strands, allowing one of them to enter the active site. The way the two proteins interact with DNA is very different in both types. In addition, their DNA cleavage and religation mechanism appear to be different. In both cases, interactions between the protein and DNA create friction, which modulates the rate of the reaction (Koster et al., 2005; Taneja et al., 2007). Supercoiling of the DNA creates torque, which drives the reaction. The type IB diagram was drawn based on the structure of human topoisomerase I in complex with DNA (PDB 1K4T) (Staker et al., 2002). (B) Cartoon depicting the possible binding of topoisomerase V to two DNA strands at a DNA crossover point (green circle). Binding at a DNA crossover point would serve as a way to sense overall DNA topology. Two different binding sites are required, which in this case would correspond to the two sites observed in the complex structures. It has been suggested that type IB enzymes sense overall DNA topology by binding to crossover points (Madden et al., 1995; Zechiedrich and Osheroff, 1990), which would represent another possible commonality between the mechanism of type IB and IC topoisomerases.
Tables
Table 1
Crystallization conditions.
| Dataset | Topo V:DNA concentration | Crystal growth conditions | Native or derivative with soak length | Cryoprotectant |
|---|---|---|---|---|
| Topo-97(ΔRS2) with 38 bp asymmetric DNA | 32:40 µM | 30°C, 1:1 µl (reaction:well solution), 9–10% PEG 600, 50 mM sodium succinate pH 5.5, 200 mM potassium chloride, 10 mM magnesium chloride, 1 mM spermine | Native Derivative: 1 mM phosphotungstic acid, 2 min | 25–30% PEG 400 |
| Topo-97(ΔRS2) with 38 bp asymmetric DNA and no abasic site | 48:60 µM | 30°C, 2:1 µl (reaction:well solution), 10% PEG 400, 50 mM MES pH 5.6, 200 mM potassium chloride, 10 mM magnesium chloride, 1 mM spermine | Native | 35% PEG 400 |
| Topo-97(ΔRS2) with 38, 39 or 40 bp symmetric DNA | 48:60 µM | 30°C, 2:1 µl (40 bp) or 2:2 µl (38, 39 bp) (reaction:well solution), 2% PEG 8K, 24 mM sodium acetate pH 5.1, 26 mM sodium acetate pH 5.6, 12.5 µM phosphotungstic acid | Native: 38 bp (high resolution), 40 bp, 39 bp. Native*: 38 bp with 2.5 mM KAuCl4 (low resolution native) Derivative: 38 bp with 350–400 µM undecagold, 6–8 min | 35% PEG 400 |
-
*
Crystal was soaked in KAuCl4, but derivative was not detected and was treated as native.
Table 2
Data collection and phasing statistics for asymmetric complex.
| Data collection | Refinement | SIRAS phasing | |
|---|---|---|---|
| High-resolution native | Native | Phosphotungstic acid | |
| Detector type/source | RayonixCCD/APS | RayonixCCD/APS | RayonixCCD/APS |
| Wavelength (Å) | 0.97856 | 0.97856 | 0.97872 |
| Resolution range* (Å) | 39.3–3.24 (3.1–3.24) | 29.97–6.0 (6.71–6.0) | 39.7–6.0 (6.71–6.0) |
| Space group | P41212 | P41212 | P41212 |
| a = b, c (Å) | 193.75, 245.9 | 196.17, 246.21 | 198.67, 245.98 |
| Measured reflections* | 428,733 (24,791) | 86,099 (25,413) | 70,747 (20,431) |
| Unique reflections* | 52,587 (2629) | 12,420 (3489) | 12,721 (3557) |
| Spherical completeness* (%) | 70.4 (13.2) | 99.1 (100.0) | 99.2 (99.9) |
| Ellipsoidal completeness* (%) | 96.3 (76.9) | – | – |
| Anomalous completeness* | – | 99.5 (100.0) | 97.8 (99.0) |
| Mean [I/σ(I)]* | 13.5 (1.7) | 20.4 (4.5) | 17.0 (2.9) |
| Multiplicity* | 8.2 (9.4) | 6.9 (7.3) | 5.6 (5.7) |
| Anomalous multiplicity* | – | 3.8 (3.8) | 3.0 (3.0) |
| Rmeasure* | 0.1 (1.567) | 0.067 (0.543) | 0.072 (0.791) |
| Rmerge* | 0.093 (1.48) | 0.057 (0.468) | 0.059 (0.654) |
| CC (1/2) | 0.999 (0.58) | 0.998 (0.812) | 0.998 (0.812) |
| MFID† | – | – | 0.336 |
| Phasing | |||
| Number of sites | – | 10 | |
| Phasing power | |||
| Dispersive (centric/acentric) | – | 1345/1.612 | |
| Anomalous (acentric) | – | 1.612 | |
| FOM (centric/acentric) | 0.3486/0.4463 | ||
-
*
All numbers in parenthesis are for highest resolution shell.
-
†
Mean fractional isomorphous difference against Native.
Table 3
Data collection and phasing statistics for symmetric complexes.
| Data collection | Refinement datasets | Phasing data | |||
|---|---|---|---|---|---|
| Dataset | 40-bp symmetric DNA | 39-bp symmetric DNA | 38-bp symmetric DNA | 38-bp symmetric DNA | |
| Native | Native | Native | Native | Undecagold | |
| Detector type/source | RayonixCCD/APS | RayonixCCD/APS | RayonixCCD/APS | Eiger 9 M/APS | Eiger 9 M/APS |
| Wavelength (Å) | 0.97872 | 0.978720 | 0.97872 | 1.0331 | 1.0357 |
| Resolution range* (Å) | 108.8–2.92 (3.24–2.92) | 86.9–3.17 (3.36–3.17) | 59.1–3.52 (3.73–3.52) | 49.7–3.38 (3.67–3.38) | 40.0–3.45 (3.64–3.45) |
| Space group | P43212 | P43212 | P43212 | P43212 | P43212 |
| a = b, c (Å) | 120.94, 497.57 | 121.56, 497.19 | 121,67, 498.82 | 121.17, 488.14 | 120.97, 497.69 |
| Number of crystals | 1 | 1 | 7 | 1 | 5 |
| Measured reflections* | 782.879 (51,701) | 470,215 (26,431) | 398,382 (13,495) | 928,796 (56,880) | 5,726,189 (273,394) |
| Unique reflections* | 56,144 (2768) | 53,311 (2667) | 41,745 (2087) | 40,840 (2042) | 44,699 (2236) |
| Spherical completeness* (%) | 69.0 (12.9) | 82.4 (25.7) | 87.5 (28.2) | 78.0 (17.8) | 89.2 (29.8) |
| Ellipsoidal completeness* (%) | 94.7 (69.6) | 92.0 (68.6) | 94.7 (54.4) | 94.5 (68.5) | 95.4 (51.9) |
| Anomalous completeness* | – | – | – | 94.3 (67.0) | 95.1 (50.5) |
| Mean [I/σ(I)]* | 21.0 (1.7) | 18.1 (1.5) | 12.0 (1.7) | 8.0 (2.1) | 12.3 (1.8) |
| Multiplicity* | 13.9 (18.7) | 8.8 (9.9) | 9.5 (6.5) | 22.7 (27.9) | 128.1 (122.3) |
| Anomalous multiplicity* | – | – | – | 12.3 (15.2) | 69.4 (65.8) |
| Rmeasure* | 0.084 (1.65) | 0.084 (1.41) | 0.128 (1.289) | 0.278 (1.84) | 0.752 (17.66) |
| Rmerge* | 0.081 (1.605) | 0.079 (1.33) | 0.121 (1.183) | 0.272 (1.80) | 0.749 (17.59) |
| CC (1/2) | 1.0 (0.744) | 1.0 (0.646) | 0.997 (0.633) | 0.994 (0.741) | 0.999 (0.749) |
| MFID† | – | – | 0.36 | ||
| Phasing | |||||
| Number of sites | – | 1 | |||
| Phasing power | |||||
| Dispersive (centric/acentric) | – | 3.122/2.755 | |||
| Anomalous (acentric) | – | 0.758 | |||
| FOM (centric/acentric) | 0.133/0.111 | ||||
-
*
All numbers in parenthesis are for highest resolution shell.
-
†
Mean fractional isomorphous difference against Native.
Table 4
Refinement statistics for all complexes.
| Refinement | 40-bp symmetric DNA | 39-bp symmetric DNA | 38-bp symmetric DNA | 38-bp asymmetric DNA (no abasic site) |
|---|---|---|---|---|
| Resolution (Å) | 58.76–2.92 | 59.04–3.17 | 59.10–3.52 | 39.28–3.24 |
| Number of reflections working/test* | 56,123/2845 | 53,291/2690 | 41,720/2217 | 52,466/2599 |
| R (working set; %)† | 25.71 (43.55) | 21.84 (34.04) | 22.29 (33.41) | 23.35 (39.48) |
| Rfree (test set; %)‡ | 28.77 (26.08) | 25.11 (69.52) | 27.00 (38.76) | 26.38 (25.78) |
| Structure quality | ||||
| Protein atoms | 13,614 | 13,604 | 13,604 | 13,014 |
| DNA atoms | 1606 | 1619 | 1561 | 2868 |
| Other atoms | 32 | 4 | 5 | 44 |
| RMS deviations in bond lengths (Å) | 0.002 | 0.002 | 0.002 | 0.004 |
| RMS deviations in bond angles (°) | 0.489 | 0.442 | 0.421 | 0.540 |
| Average B factor (Å2) (DNA) | 110.87 | 117.99 | 138.26 | 191.74 |
| Average B factor (Å2) (protein) | 97.13 | 104.43 | 129.73 | 135.94 |
| Ramachandran plot§ | ||||
| Favored regions (%) | 97.52 | 95.81 | 95.99 | 97.22 |
| Outliers (%) | 0.24 | 0.41 | 0.41 | 0 |
| Distribution Z-score | –1.99 | –1.90 | –1.27 | –1.51 |
| Clashscore | 5.93 | 4.76 | 4.94 | 4.86 |
| Molprobity score | 1.42 | 1.53 | 1.53 | 1.4 |
-
*
Numbers in parenthesis correspond to highest resolution shell.
-
†
Rwork = ∑ ||Fo| – |Fc||/ ∑|Fo|, where |Fo| is the observed structure factor amplitude and |Fc| the calculated structure factor amplitude.
-
‡
Rfree = Rfactor based on 5% of the data excluded from refinement.
-
§
As reported by Molprobity (Davis et al., 2004).
Table 5
Mutants to probe different regions in the protein*.
| Mutant | Region | Activity† | Source‡ |
|---|---|---|---|
| Arg37Ala | Positively charged region leading to active site | Reduced | Synthesized |
| Lys47Ala | Positively charged region leading to active site | Wild type | Synthesized |
| His56Ala | Positively charged region leading to active site | Wild type | Synthesized |
| Ala132Ile | Positively charged region leading to active site | Minimal | Synthesized |
| Lys134Ala | Positively charged region leading to active site | Reduced | Synthesized |
| Arg135Ala | Positively charged region leading to active site | Wild type | Synthesized |
| Lys134Ala, Arg135Ala | Positively charged region leading to active site | Minimal | Synthesized |
| Lys134Glu, Arg135Glu | Positively charged region leading to active site | None | Site-directed mutagenesis |
| Arg83Ala | Interacting with noncleaved DNA strand | Minimal | Synthesized |
| Arg108Ala | Interacting with noncleaved DNA strand | None | Synthesized |
| Arg109Ala | Interacting with noncleaved DNA strand | Reduced | Site-directed mutagenesis |
| Arg108Ala, Arg109Ala | Interacting with noncleaved DNA strand | None | Synthesized |
| Arg288Ala | Linker helix | Wild type | Synthesized |
| Tyr289Ala | Linker helix | Wild type | Synthesized |
| Leu290Pro | Linker helix | Minimal | Site-directed mutagenesis |
| Arg293Ala | Linker helix | Wild type | Synthesized |
| Arg288Ala, Arg293Ala | Linker helix | Reduced | Site-directed mutagenesis |
| Arg288Glu, Arg293Glu | Linker helix | None | Site-directed mutagenesis |
| Arg288Glu, Leu290Pro, Arg293Glu | Linker helix | None | Site-directed mutagenesis |
-
*
Activity: Level of DNA relaxation activity was assessed qualitatively by comparing against the activity levels of the Topo-97 wild-type enzyme.
-
†
Source: Mutations were introduced either by site-directed mutagenesis or by total synthesis of the mutant. All mutations were done in the Topo-97 wild-type backbone.
-
‡
Table entries colored according to areas delineated in Figure 4.
Table 6
Primers used for site-directed mutagenesis.
| Mutant | Primer |
|---|---|
| Leu290Pro | Forward 5′-GACATCATGAGAAGGTATCCTGAGCAGCGGATC-3′ Reverse 5′-GATCCGCTGCTCAGGATACCTTCTCATGATGTC-3′ |
| Arg109Ala | Forward 5′-GATCGTGTACAGGGCAGGCTGGAGGGCGATC-3′ Reverse 5′-CGCCCTCCAGCCTGCCCTGTACACGATC-3′ |
| Arg288Ala, Arg293Ala | Forward 5′-GCGACATCATGAGAGCGTATCTCGAGCAGGCGATCGTCGAGTGT-3′ Reverse 5′-ACACTCGACGATCGCCTGCTCGAGATACGCTCTCATGATGTCGC-3′ |
| Arg288Glu, Arg293Glu* | Forward 5′-GCGACATCATGAGAGAGTATCTCGAGCAGGAGATCGTCGAGTGT-3′ Reverse 5′-ACACTCGACGATCTCCTGCTCGAGATACTCTCTCATGATGTCGC-3′ |
| Arg288Glu, Leu290Pro, Arg293Glu† | Forward 5′-CATGAGAGAGTATCCTGAGCAGGAGATCGTC-3′ Reverse 5′-GACGATCTCCTGCTCAGGATACTCTCTCATG-3′ |
| Lys134Glu, Arg135Glu | Forward 5′-AGAGGTGCGTGCCGTGGAGGAGAACCCGCTCCAACCGG-3′ Reverse 5′-CCGGTTGGAGCGGGTTCTCCTCCACGGCACGCACCTCT-3′ |
-
*
The double mutant Arg288Glu, Arg293Glu DNA backbone was used in mutagenesis PCR to get the Arg288Ala, Arg293Ala mutant.
-
†
The double mutant Arg288Glu, Arg293Glu DNA backbone was used in mutagenesis PCR to get the Arg288Glu, Leu290Pro, Arg293Glu triple mutant.
Additional files
Download links
A two-part list of links to download the article, or parts of the article, in various formats.
Downloads (link to download the article as PDF)
Open citations (links to open the citations from this article in various online reference manager services)
Cite this article (links to download the citations from this article in formats compatible with various reference manager tools)
Structures of topoisomerase V in complex with DNA reveal unusual DNA-binding mode and novel relaxation mechanism
eLife 11:e72702.
https://doi.org/10.7554/eLife.72702


