Cellular organization in lab-evolved and extant multicellular species obeys a maximum entropy law
- School of Physics, Georgia Institute of Technology, United States
- Department of Applied Mathematics and Theoretical Physics, Centre for Mathematical Sciences, University of Cambridge, United Kingdom
- School of Biological Sciences, Georgia Institute of Technology, United States
- Quantitative Biosciences Graduate Program, Georgia Institute of Technology, United States
- Department of Molecular Biology, Umeå University, Sweden
Figures
Figure 1 with 1 supplement
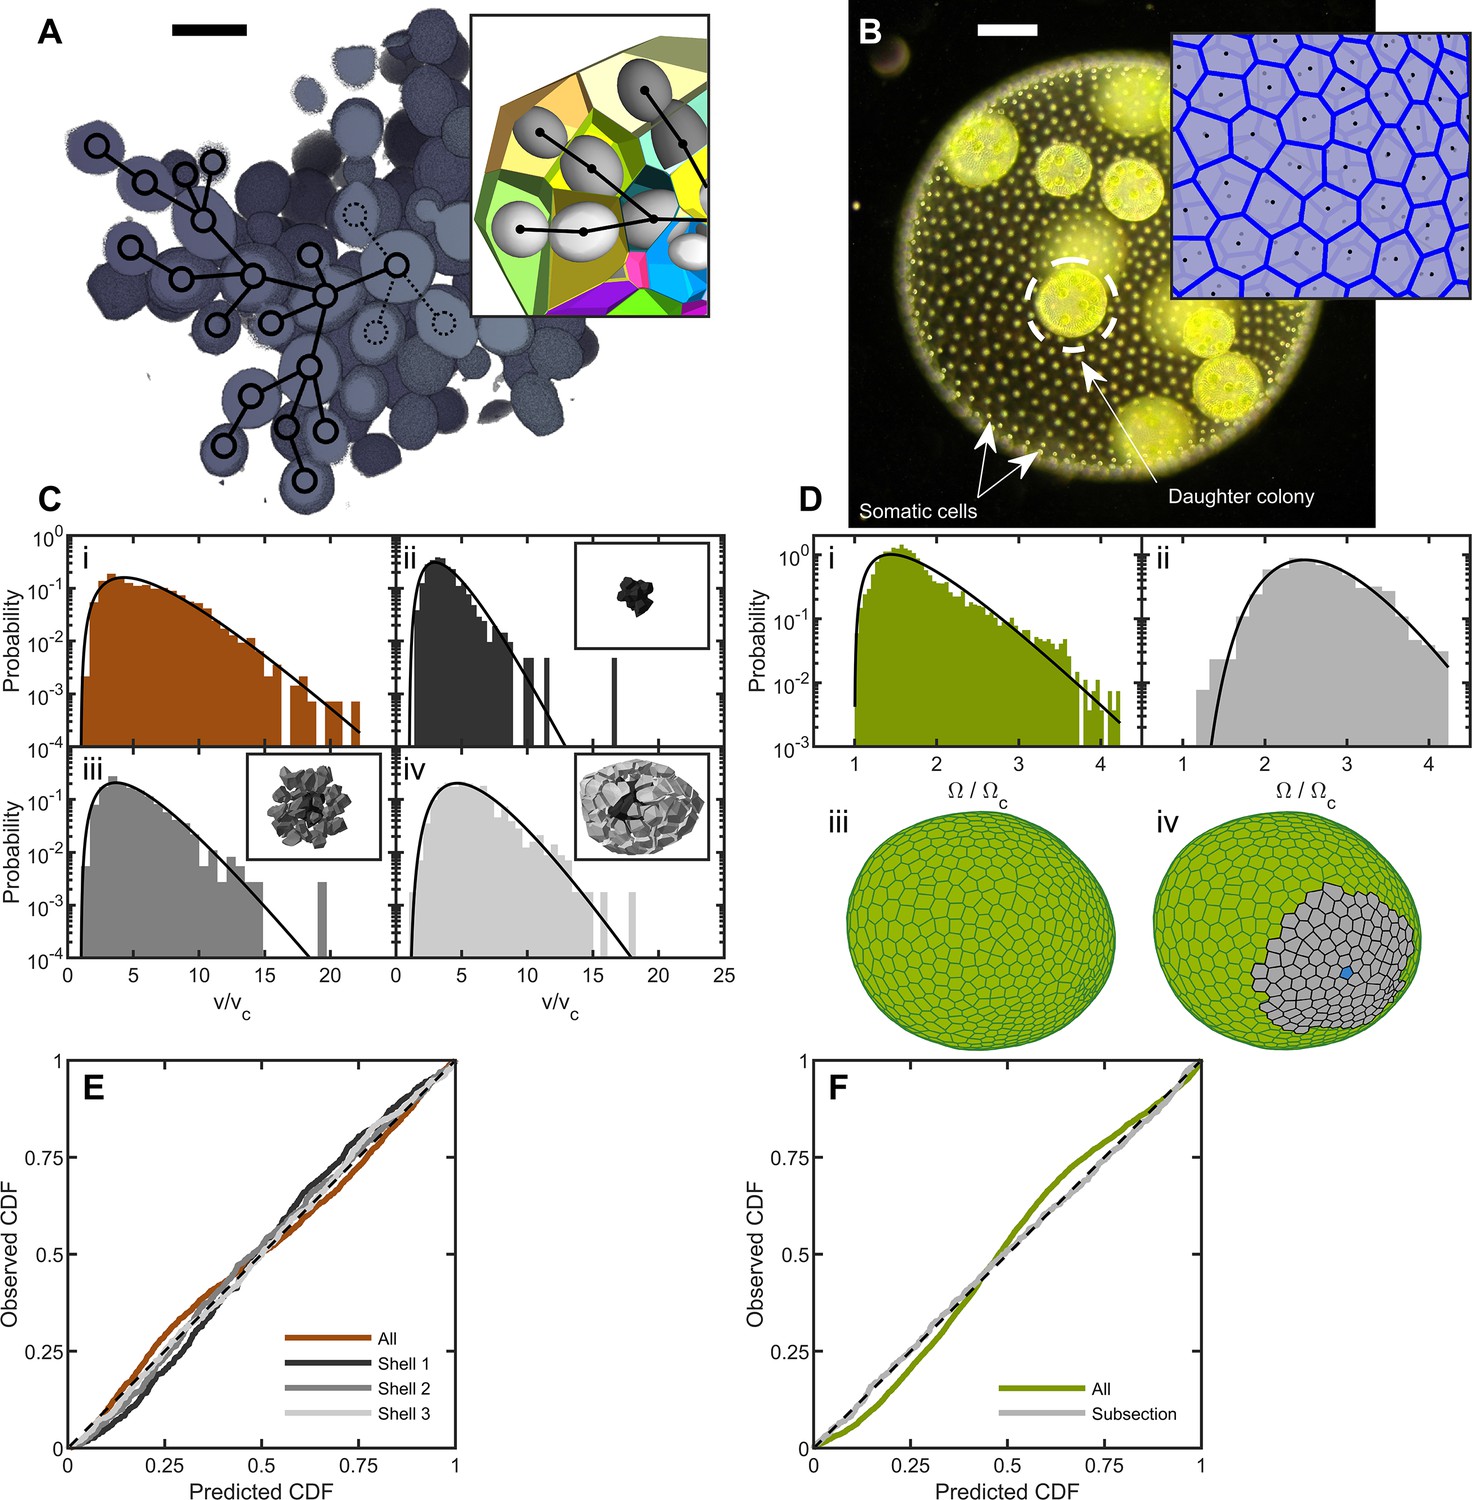
Cell packing in two multicellular species.
(A) Cross-section of a multicellular yeast organism, which grows with persistent intercellular bonds. Scalebar is 5 m. The inset shows a smaller section, with ellipsoidal fits to individual cells along with their corresponding Voronoi polyhedra. Black overlays indicate the connection topology between yeast cells; not all connections are labeled. (B) Darkfield microscopy image of Volvox carteri, scalebar is . Inset: a small piece of the Voronoi-tessellated surface; black points are somatic cell positions. (C) Distributions of Voronoi polyhedron volumes as a function of cell size normalized by average size vc for snowflake yeast. In orange is the histogram for all cells; the other three distributions correspond to different subsections of Voronoi volumes. The cells were grouped into spherical shells with radius and width from the cluster center of mass. Shown are shells with edges , , and . Black lines are maximum entropy predictions. (D) Distributions of solid angles subtended by Volvox somatic cells divided by a minimum solid angle . Solid black lines are the maximum entropy predictions. The top row shows the histogram for all cells in green and a subsection of correlated areas in gray. Bottom row illustrates the subsectioning process: blue polygon is the center of the subsectioned region. Only the Voronoi polygons, i.e. not the somatic cells, are shown for clarity. (E,F) Empirical cumulative distribution function vs entropic predictions for all distributions shown in c,d. The dashed black line represents hypothetical perfect agreement between observation and prediction.
-
Figure 1—source data 1
Experimental data files enumerating the cell centers positions for each organism sampled.
The folders are subdivided into those on snowflake yeast (from SEM studies) and Volvox (from lightsheet studies). Each subdirectory contains an explanatory README file.
- https://cdn.elifesciences.org/articles/72707/elife-72707-fig1-data1-v1.zip
Figure 1—figure supplement 1
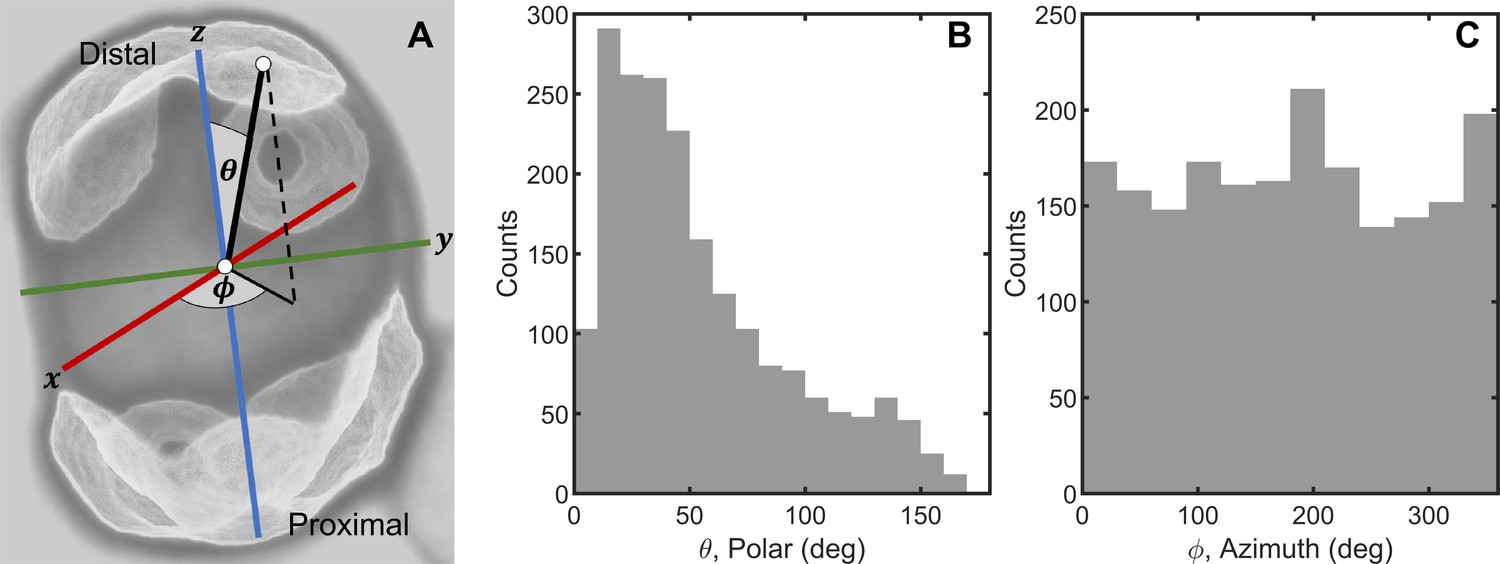
Random cell budding positions in multicellular yeast groups.
(A) Bud scars determine the position of new cell buds, and are distributed across the surface of yeast cells. We locate bud scars in a spherical coordinate system with polar angle and azimuthal angle . (B) Distribution of measured polar angle positions of new cells. (C) Distribution of measured azimuthal angle positions.
Figure 2 with 3 supplements
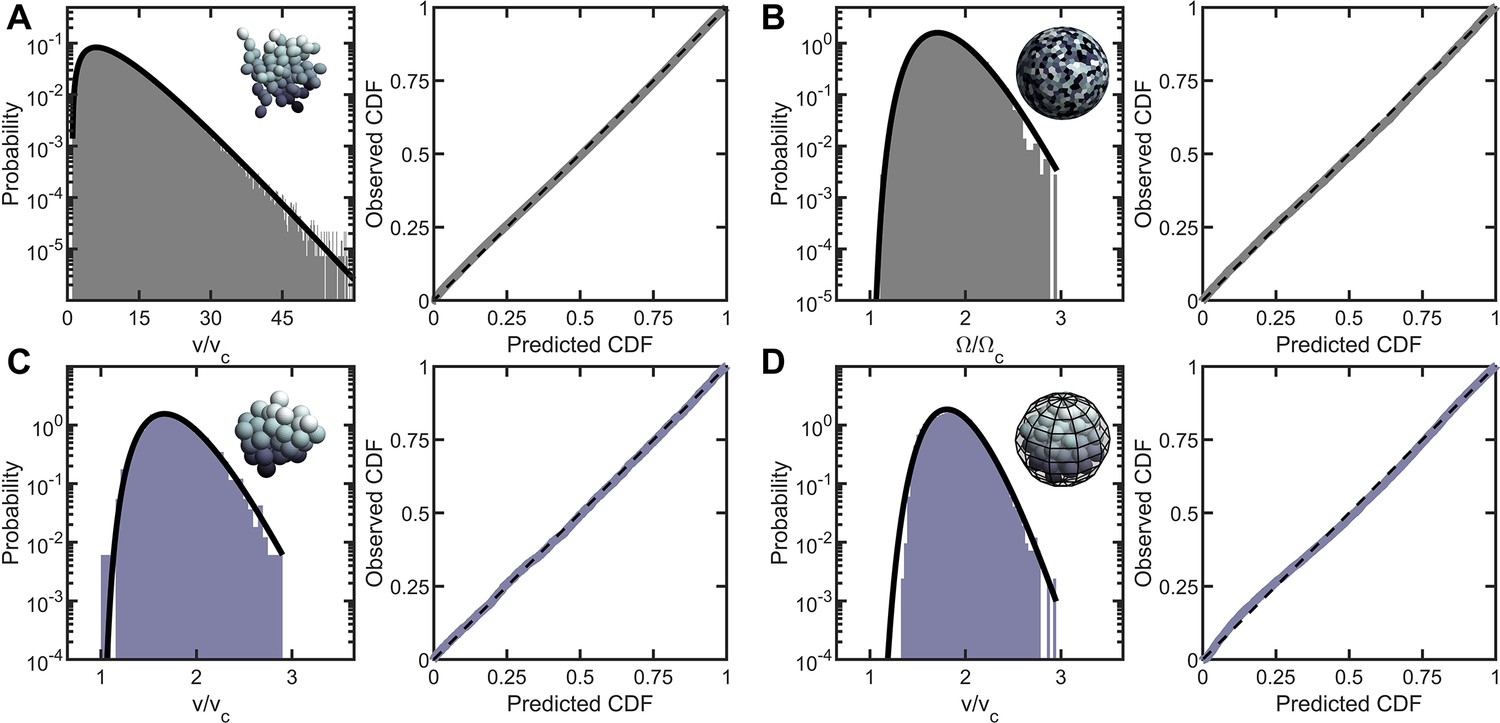
Entropic packing is a general feature of simple multicellularity.
We simulated four different growth morphologies: (A) Tree-like groups formed with rigid, permanent bonds between cells, (B) surface-attached cells located on a spherical surface, (C) aggregates formed with attractive ‘sticky’ interactions, and (D) groups formed by rapid cell division within a maternal membrane. In all subfigures, left panel shows the predicted and observed probability distributions, and right panel plots the observed cumulative distribution vs. the expected cumulative distribution. Histogram bars represent measured Voronoi volume distribution in simulations, and black solid line represents the maximum entropy prediction. Maximum entropy predictions accurately described the distribution of cellular volumes/areas, despite their varying mechanisms of group formation ().
-
Figure 2—source data 1
Simulation data (enumerating the cell center positions) for the six classes of numerical studies; aggregation, apoptosis, polydispersity, snowflake yeast growth, tree-like growth, and Volvox growth.
Each subdirectory contains an explanatory README file.
- https://cdn.elifesciences.org/articles/72707/elife-72707-fig2-data1-v1.zip
Figure 2—figure supplement 1
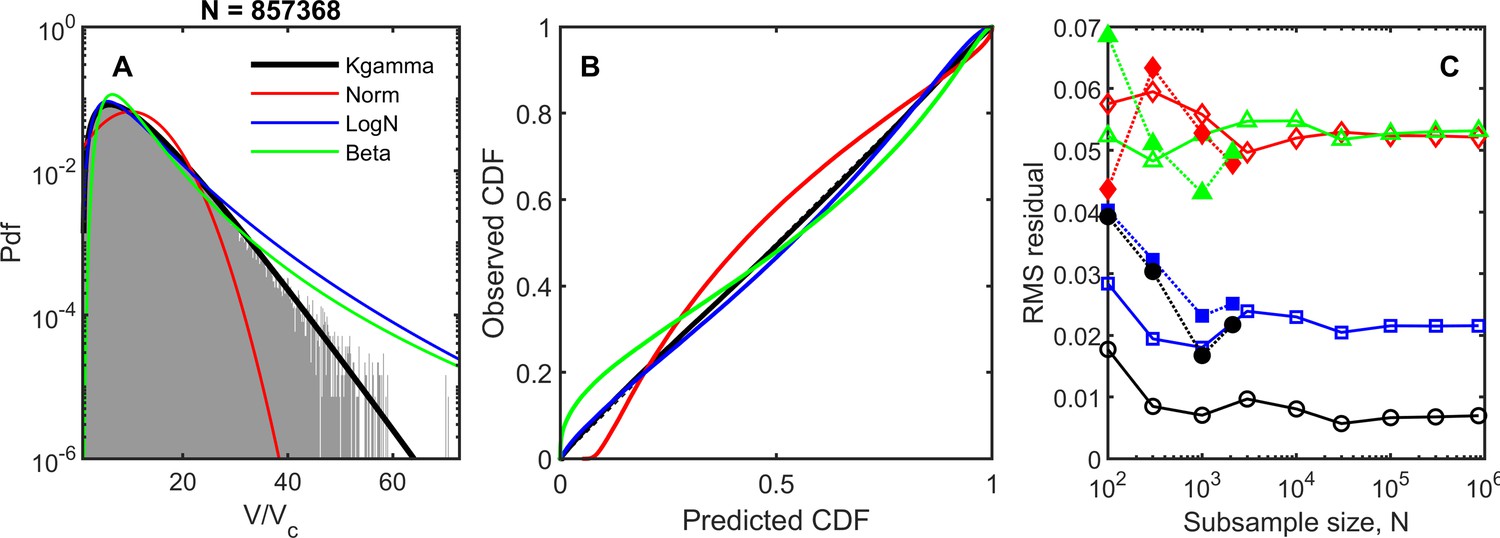
Four different distributions were tested for goodness-of-fit: the maximum entropy prediction (black line), the normal distribution (red), the log-normal distribution (blue), and the beta-prime distribution (green).
(A) Probability distribution functions for the dataset and the four model distributions, using parameters measured from the dataset. All measured values were used for this plot (number of datapoints, (B) Empirical cumulative distribution function vs. predicted cumulative distribution function. Black dashed line corresponds to perfect agreement, . (C) Root-mean-square residual of the cumulative distribution functions for various sample sizes bootstrapped from the dataset. In open symbols are simulation datasets: black circle is k-gamma, red diamond is normal, blue square is log-normal, and green triangle is beta-prime. We also include data from snowflake yeast experiments; these bootstrapped samples are shown as dotted lines with filled symbols.
Figure 2—figure supplement 2
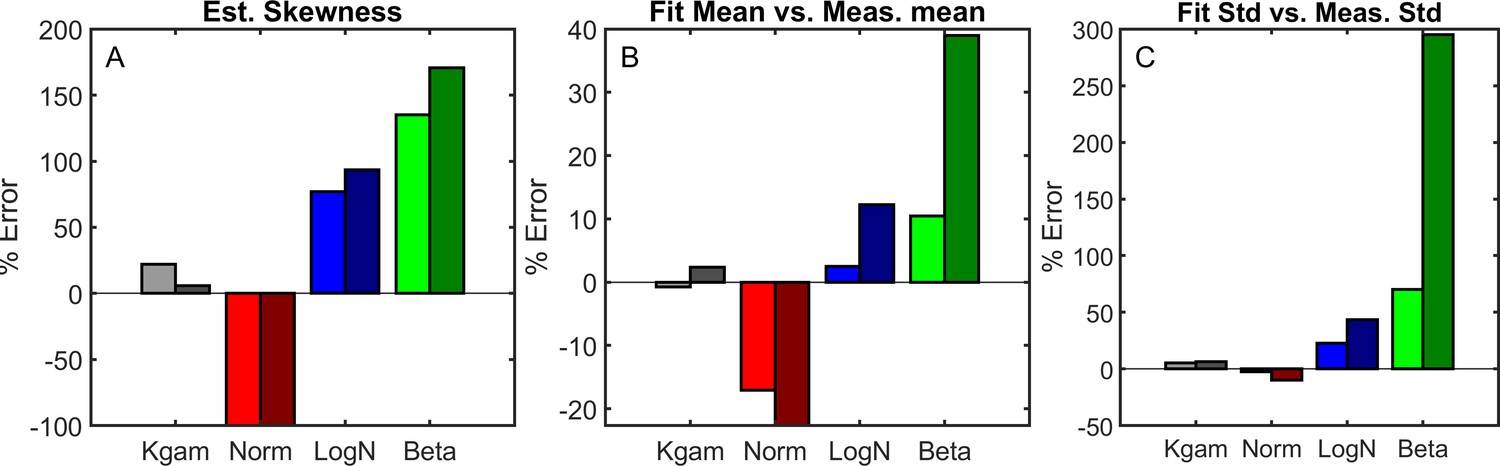
Four different distributions were used to estimate the skewness of the distribution given the first two moments (A).
We show the percent error of the estimated skewness () for both experimental data (left bars, bright) and simulation data (right bars, dark). (B-C), Four different distributions were fit using a least-squares algorithm; the fit distributions were then compared to the experimentally observed distribution by comparing their first two moments. The mean is show in B, the standard deviation in C. Experimental data was used for least square fits in the left-side bars for each pair, simulation data was used in the right-side bars for each pair.
Figure 2—figure supplement 3

In simulations of palintomy within a confining membrane, boundary effects due to frustrated packing near a wall affect the local packing fraction, but do not change the general distribution.
(A) Voronoi polyhedron volume, , vs. distance from the center of mass, . The distance is normalized by the maximum distance of any cell for each group; the volume is normalized by the minimum cell volume . All simulations are shown together as orange points. The colored partitions correspond to spherical shells. Panels B-E show the distribution of Voronoi volumes within each shell. In all cases, the k-gamma distribution describes the data well (, respectively).
Figure 3
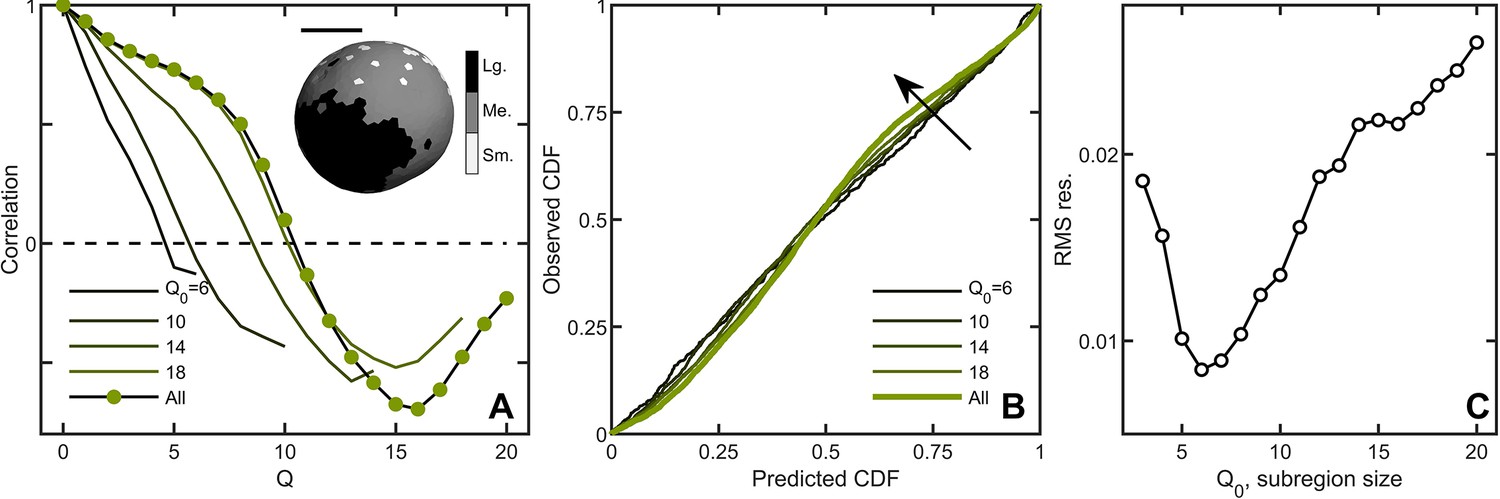
Correlations lead to deviations from maximum entropy predictions in Volvox carteri.
(A) Correlation function of Voronoi polygon areas vs. network neighbor distance . Green circles represent all experimental Volvox data. Lines indicate the same correlation function calculated in subsections of size . Inset: visualization of spatial correlations of solid angle; one Volvox’s Voronoi tessellation is displayed with a three-color heatmap corresponding to polygons with areas smaller than (light gray), within (gray) and larger (black) than one standard deviation of the mean. Scale bar is . (B) PP plots for the observed vs predicted cumulative distribution function. In green is the Volvox distribution for all cells before corrections for correlations. A selection of differently-sized subsections is also plotted, corresponding to sizes . Arrow indicates direction of increasing Q0 value. (C) Root-mean-square residual deviation from maximum entropy predictions as a function of subsection size, as a function of nearest neighbor number Q0. As the subsection size increases (including more and more uncorrelated Voronoi areas), the deviation from predictions first decreases until , then increases.
-
Figure 3—source data 1
Used in this figure is specifically Volvox cartesian cell center position measured from lightsheet microscopy.
- https://cdn.elifesciences.org/articles/72707/elife-72707-fig3-data1-v1.zip
Figure 4
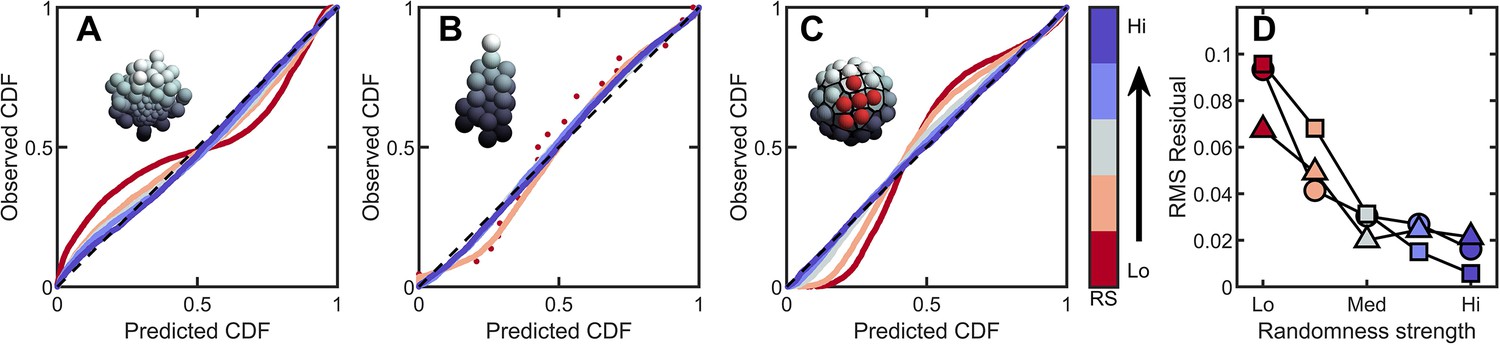
Introducing correlations and structure can break the maximum entropy distribution.
In A-C are PP plots of the observed vs. predicted cumulative distribution function for three different simulations. The colors correspond to increasing levels of noisiness in the simulations, from red (strongest correlations/determinism) to blue (strongest noise). The dashed black line in each represents , or exact predictive efficacy. (A) Aggregative groups with bimodal size polydispersity; noise is introduced by varying the probability that small cells reproduce into small or large cells, and vice versa. (B) Tree-like groups with persistent intercellular bonds that grow according to a growth plan modified by noise in cell placement. (C) Surface-bound groups with programmed cell death events that may be localized or randomly dispersed. (D) The root mean square deviation from predicted values for each simulation case. Circles are aggregative simulations from A, triangles are tree-like simulations from B, and squares are surface-bound simulations from C. Note: the discrete points in (B) arise because absent randomness in the cell locations the exact same cellular structure is achieved by every simulation. Therefore, the observed distribution of Voronoi volumes is noticeably discrete for this case. Upon adding randomness, the cellular structure is altered between successive simulations, and the distribution of Voronoi volumes becomes less discrete.
-
Figure 4—source data 1
This figure was generated from the data provided through simulations of aggregative growth with size polydispersity, tree-like growth with noise in cell position, and growth on a spherical surface with planned apoptosis.
- https://cdn.elifesciences.org/articles/72707/elife-72707-fig4-data1-v1.zip
Figure 5
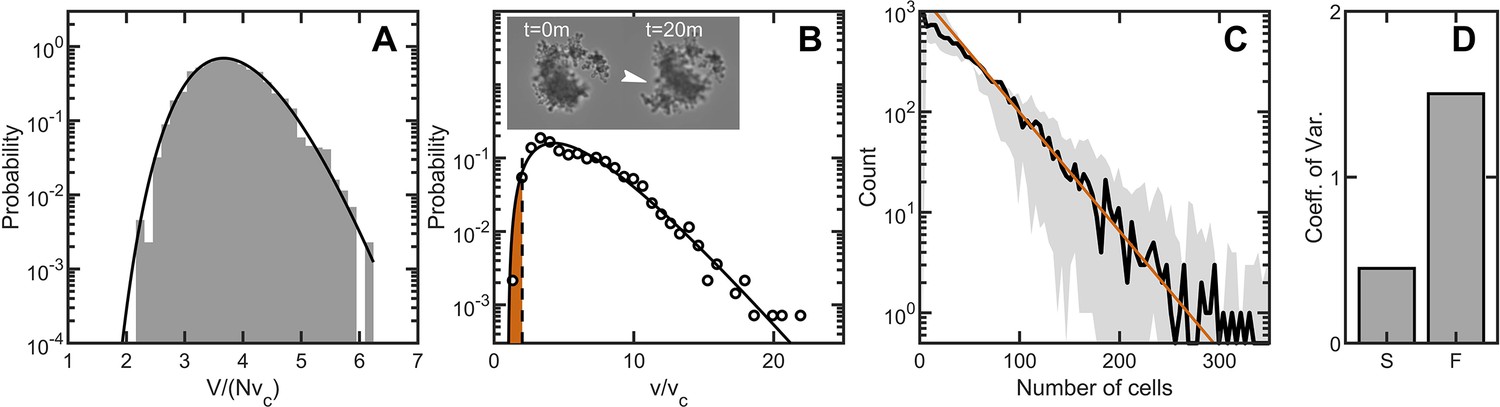
Maximum entropy cell packing generates a consistent and predictable life cycle in snowflake yeast.
(A) Distribution of total cluster volume for 3000 simulated snowflake clusters, each with cells. The total volume is divided by the minimum possible volume . The k-gamma distribution (black line, ) provides a good description of the data. (B) Distribution of all experimental Voronoi volumes (black circles) and the maximum entropy prediction (black line). The vertical black dashed line is the critical Voronoi volume predicted from simulations. Orange filled region integrates up to the probability that any one cell occupies a volume less than . Insets: sequential brightfield microscope images of one yeast cluster undergoing group fragmentation. White arrowhead indicates location of fracture point. The images measure across from top to bottom. (C), Experimentally measured yeast cluster size distribution (solid black line) along with the prediction from weakest link theory (orange line). Gray region represents confidence bounds on the measured distribution from estimating the number of cells in a group. (D), Coefficient of variation in group radius () for snowflake groups (S) and flocculating groups (F). Data from Pentz et al., 2020.
-
Figure 5—source data 1
This figure was generated from a combination of the simulation data and experimental data provided with Figures 1 and 2, as well as epxerimental size measurements included here from a particle multisizer, or Coulter Counter.
- https://cdn.elifesciences.org/articles/72707/elife-72707-fig5-data1-v1.zip
Tables
Table 1
Model parameters for distribution comparisons.
| K-gamma () | ||
| Normal () | ||
| Log-normal () | ||
| Beta prime () |
Additional files
-
Transparent reporting form
- https://cdn.elifesciences.org/articles/72707/elife-72707-transrepform1-v1.docx
-
Source code 1
Matlab code for simulations of aggregative groups.
- https://cdn.elifesciences.org/articles/72707/elife-72707-code1-v1.zip
-
Source code 2
Matlab code for simulations of groups grown confined within a membrane.
- https://cdn.elifesciences.org/articles/72707/elife-72707-code2-v1.zip
-
Source code 3
Matlab code for simulating groups confined to a spherical surface.
- https://cdn.elifesciences.org/articles/72707/elife-72707-code3-v1.zip
-
Source code 4
Matlab code for simulations of snowflake yeast, where cells bud at various angles and remain attached permanently to their mother cell.
- https://cdn.elifesciences.org/articles/72707/elife-72707-code4-v1.zip
-
Source code 5
Matlab code for simulations of prescribed tree-like growth.
The cells grow at exact positions/angles with noise strength determined by input parameters.
- https://cdn.elifesciences.org/articles/72707/elife-72707-code5-v1.zip
Download links
A two-part list of links to download the article, or parts of the article, in various formats.
Downloads (link to download the article as PDF)
Open citations (links to open the citations from this article in various online reference manager services)
Cite this article (links to download the citations from this article in formats compatible with various reference manager tools)
Cellular organization in lab-evolved and extant multicellular species obeys a maximum entropy law
eLife 11:e72707.
https://doi.org/10.7554/eLife.72707


