Synaptic mechanisms of top-down control in the non-lemniscal inferior colliculus
- Kresge Hearing Research Institute & Department of Otolaryngology, University of Michigan, United States
- Neuroscience Graduate Program, University of Michigan, United States
- Molecular and Integrative Physiology, University of Michigan Medical School, United States
Figures
Figure 1 with 4 supplements
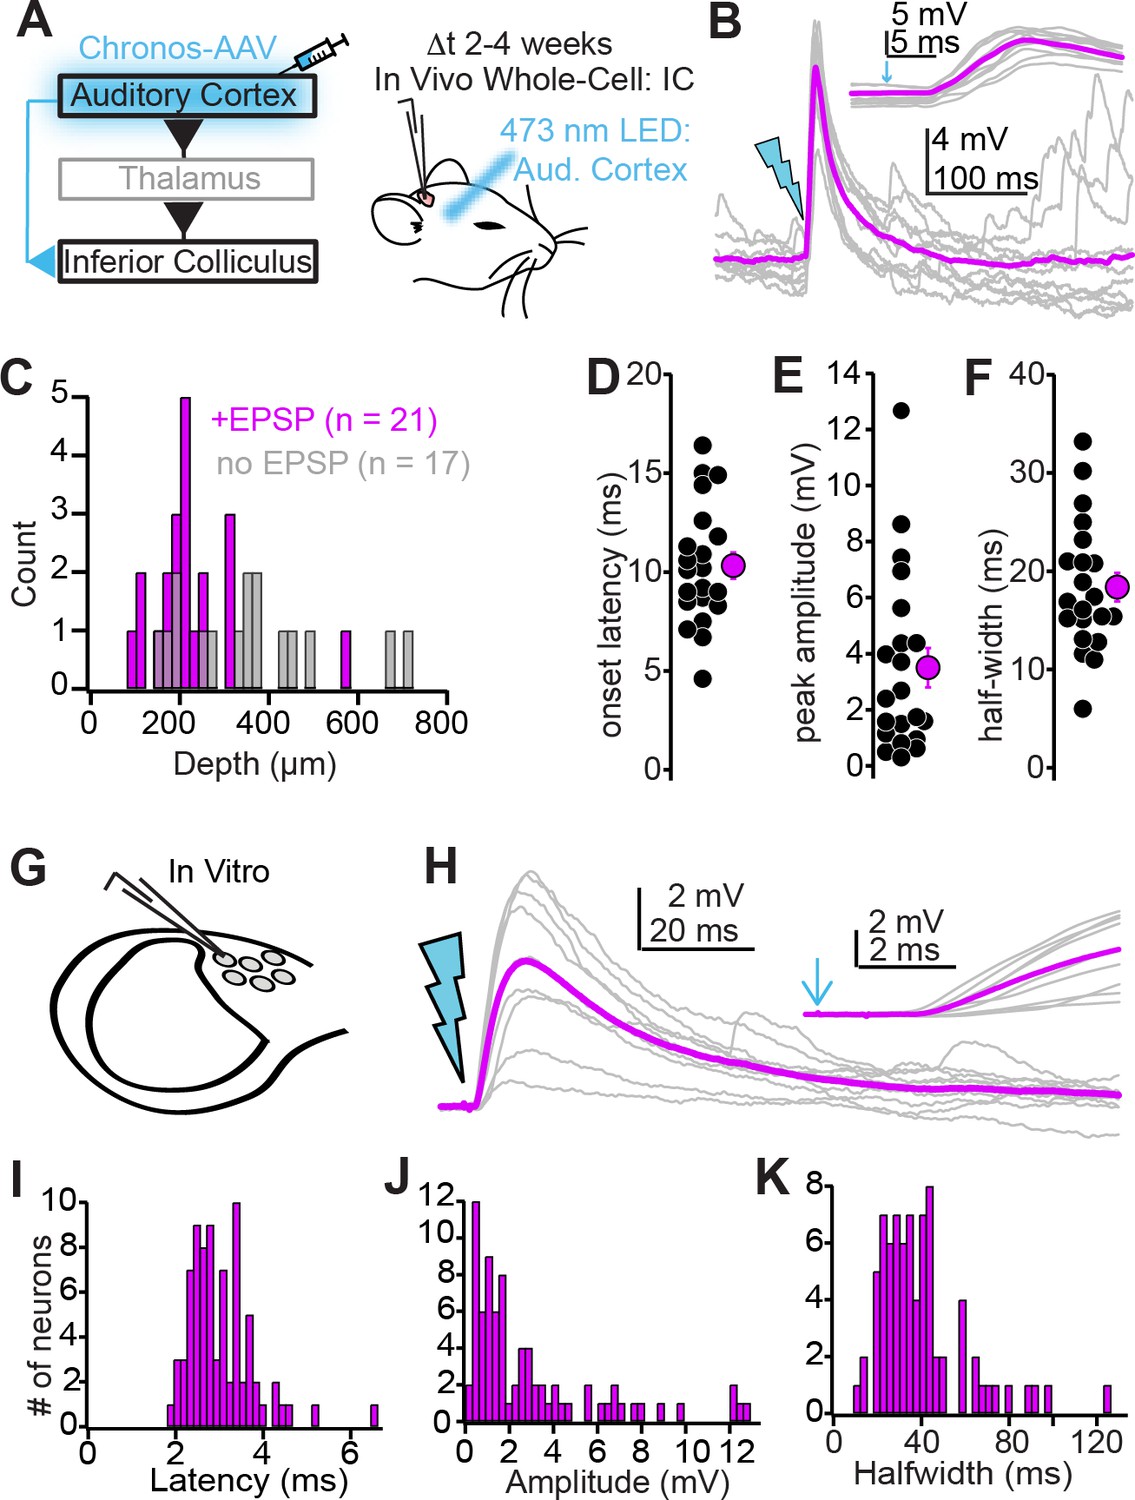
Biophysical properties of auditory cortico-collicular synapses.
(A) Cartoon of experiment. In vivo whole-cell recordings are obtained from inferior colliculus (IC) neurons 2–4 weeks following Chronos injections; an optic fiber is positioned above the auditory cortex. (B) Example EPSPs following in vivo optogenetic stimulation. Gray traces are single trials; magenta is average. Inset is the EPSP rising phase at a faster timebase, arrow denotes light onset. (C) Dorsal-ventral locations (relative to dura) for IC neurons where auditory cortical stimulation did (magenta) and did not (gray) evoke an EPSP. (D–F) Summary of EPSP onset (D) amplitude (E), and half-width (F). (G) Whole-cell recordings obtained from dorso-medial shell IC neurons in vitro. (H) EPSPs evoked by in vitro optogenetic stimulation (2 ms light flash). Inset: EPSP rising phase. (I–K) Histograms of EPSP onset (I), amplitudes (J), and half-widths (K) in vitro.
Figure 1—figure supplement 1
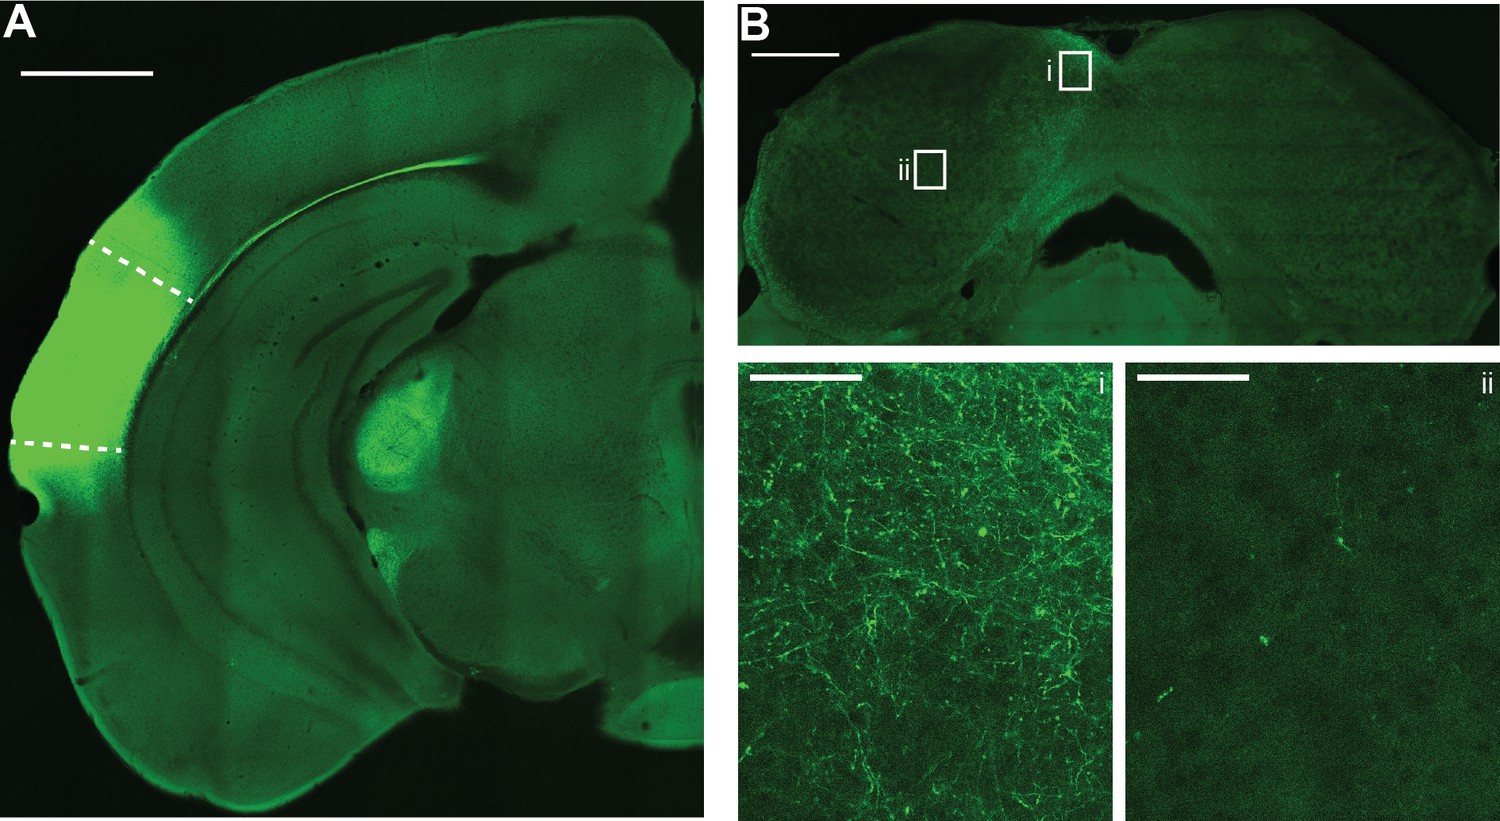
Auditory cortical axons are preferentially distributed in the non-lemniscal shell inferior colliculus (IC).
(A) Example micrograph of Chronos-GFP injection site in the left auditory cortex. Dashed lines denote approximate borders of auditory cortical areas as defined by Allen Brain Atlas. Scale bar = 1 mm. Of note is the strong corticofugal fiber labeling in medial geniculate body. (B) Micrograph of IC from the same case as in panel (A). Scale bar = 500 µm. Rectangles denote areas of interest in the dorso-medial shell (i) or central (ii) IC shown at higher magnification below. Of note is the preferential distribution of GFP labeled axons in the shell regions, with comparatively sparse labeling in central IC. Scale bars for i and ii = 50 µm.
Figure 1—figure supplement 2
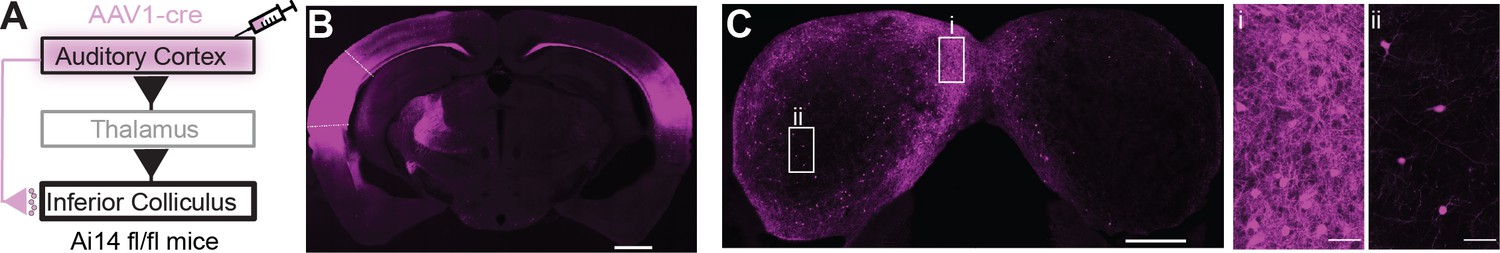
Anterograde trans-synaptic labeling of auditory cortical targets in the inferior colliculus (IC).
(A) Cartoon of experiment. An AAV1-cre virus is injected into the auditory cortex of tdTomato reporter mice (Ai14 fl/fl). This approach leads to anterograde trans-synaptic viral spread and thus tdTomato expression in postsynaptic neurons downstream of the injection site (Zingg et al., 2017; Zingg et al., 2020). (B) Micrograph of an example injection site showing viral diffusion throughout primary and secondary auditory fields. Dashed lines are approximate borders of auditory cortical areas. Scale bar = 1 mm. (C) Micrograph of the IC from the same case as in (B). Scale bar = 500 µm. Rectangles denote areas of interest in the shell (i) or central (ii) IC shown at higher magnification in the accompanying panels. Of note is the dense labeling of neuronal somata in the shell compared to the central IC. Scale bars = 50 µm.
Figure 1—figure supplement 3
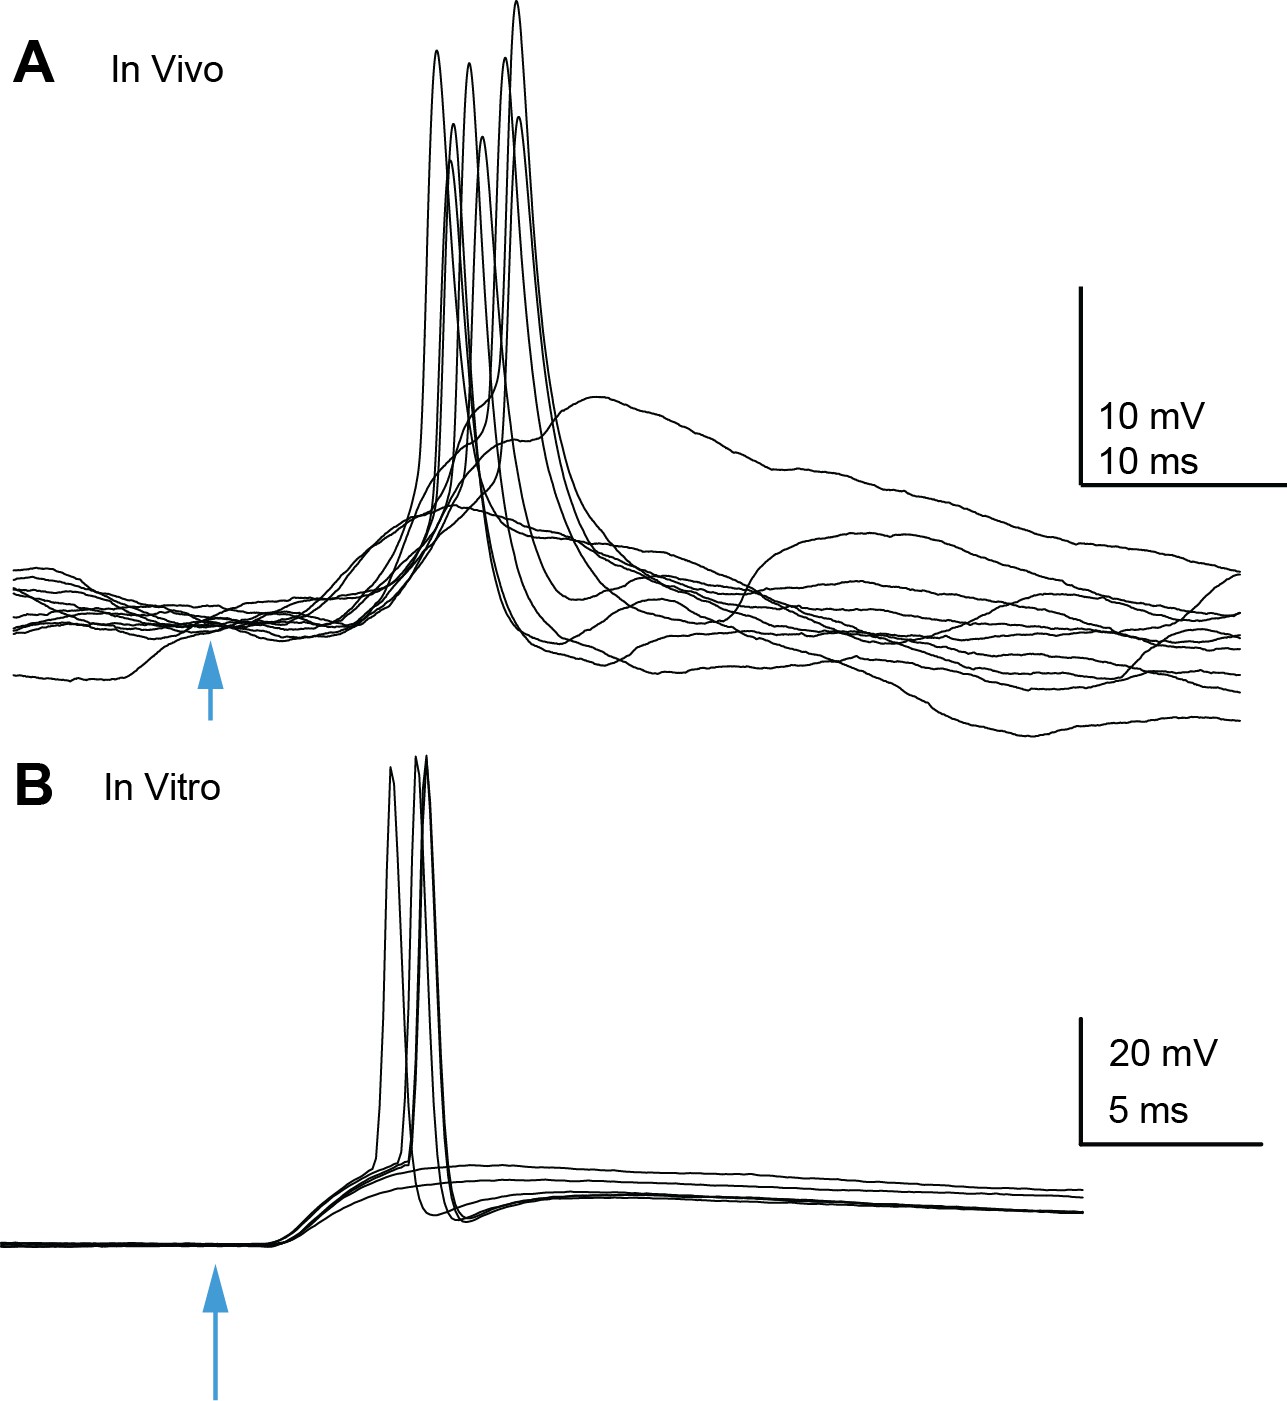
Auditory cortico-collicular EPSPs can trigger spikes in inferior colliculus (IC) neurons in vivo and in vitro.
(A) Example overlaid trials from an in vivo whole-cell recording of a superficial IC neuron. Optogenetic stimulation of auditory cortex denoted by arrowhead. (B) Example trials from an in vitro recording.
Figure 1—figure supplement 4

Auditory cortico-collicular transmission in voltage-clamp.
(A) Example excitatory postsynaptic currents (EPSCs) recorded in voltage-clamp. Gray and black traces are individual trials and average, respectively. (B–D) Summary data for EPSC peak amplitudes (B), decay time constant (C), and 10–90% rise time (D) in n = 24 cells from N = 10 mice.
Figure 2 with 1 supplement
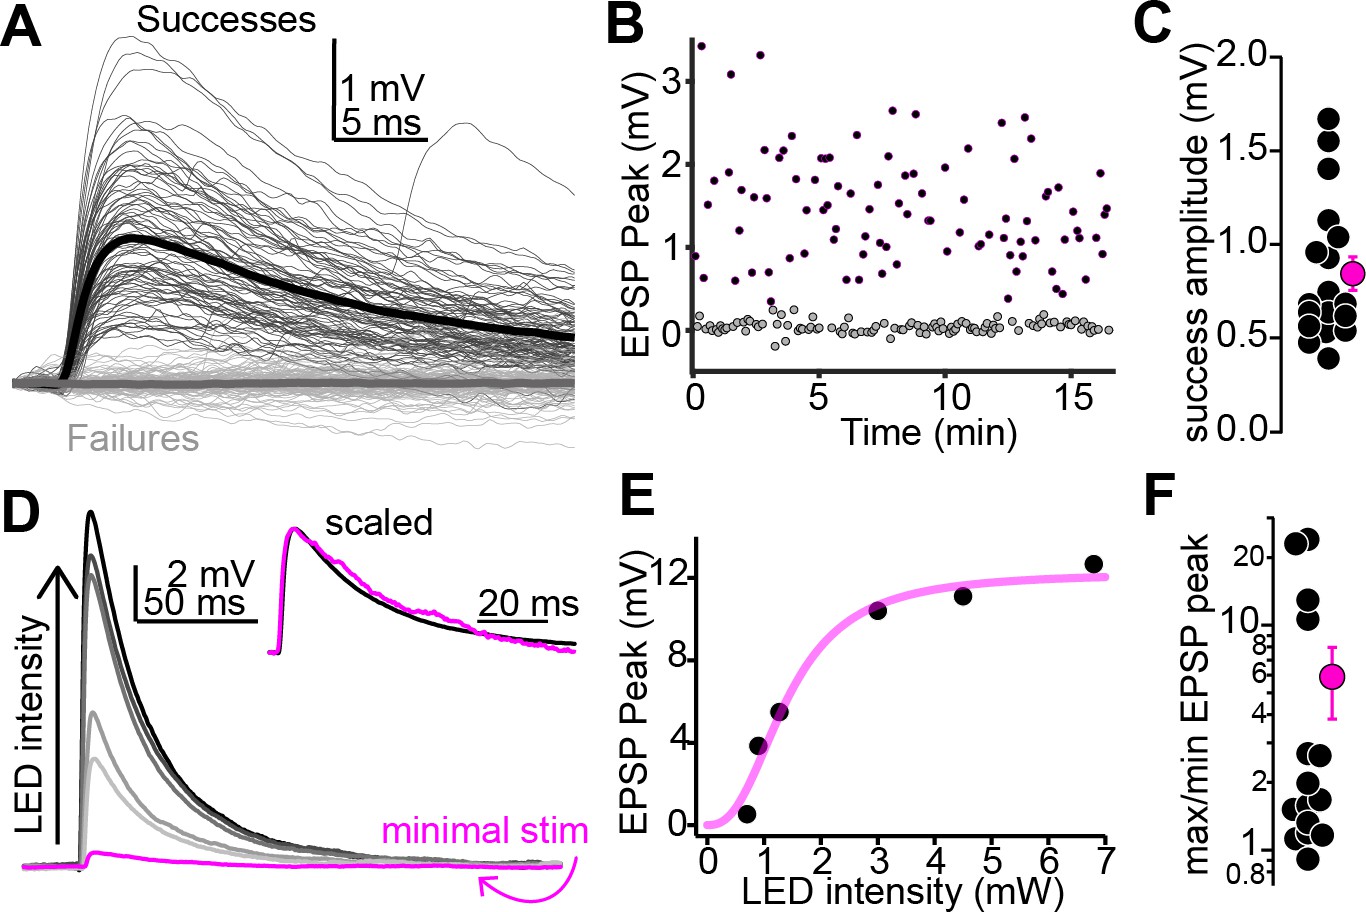
Multiple auditory cortico-collicular fibers converge onto single-shell inferior colliculus (IC) neurons.
(A) Example threshold optogenetic stimulation experiment. Thin black and gray traces are successes failures, respectively. Thick traces are averages. (B) Diary plot from the experiment in panel (A). black and gray symbols are successes and failures, respectively. (C) Summary of putative unitary EPSP amplitudes. (D) Magenta: putative unitary EPSP (average of successes recorded at threshold stimulation). Black and gray traces: averages of successes at increasing LED intensity. Data are from a different neuron as in (A). Inset: peak scaled and onset aligned EPSPs recorded at threshold and maximal intensity, revealing an identical time course. (E) EPSP peak amplitude is plotted as a function of LED intensity for the recording in (D). Magenta line is Hill fit. (F) EPSP amplitude ratios at maximal and threshold LED intensities. Most values are >1, indicating convergence of at least two fibers. Of note, data are on a log scale.
Figure 2—figure supplement 1
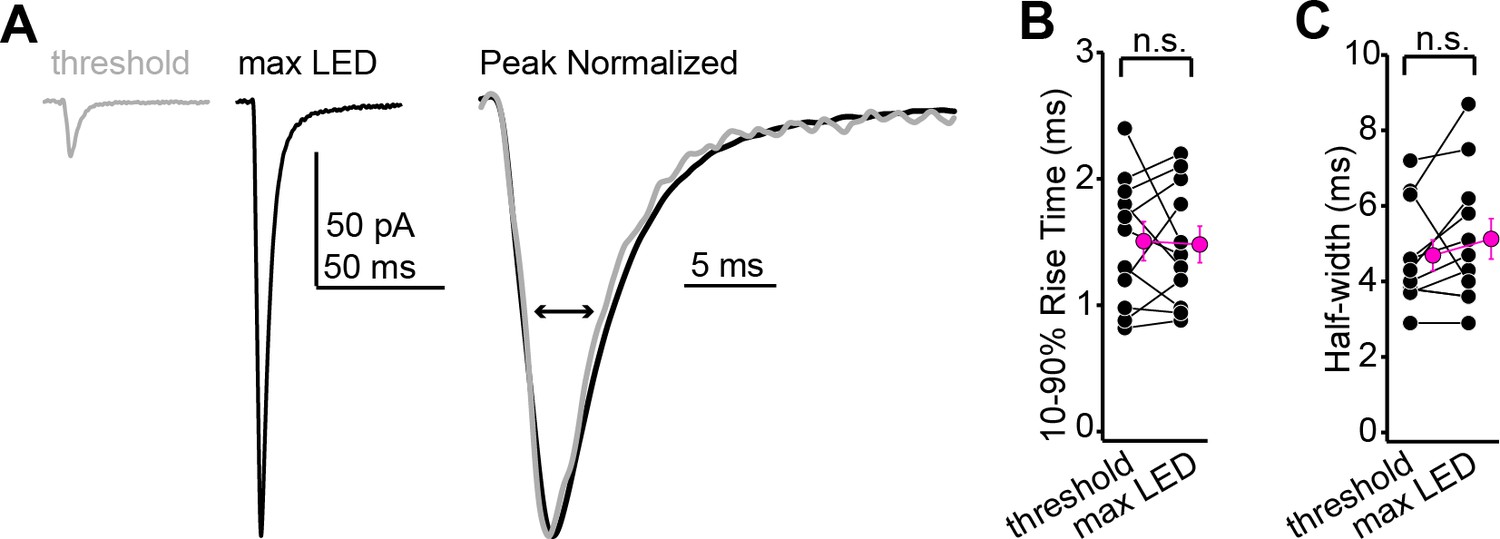
Excitatory postsynaptic current (EPSC) rise times and half-widths are similar across minimal and maximal stimulation intensities.
(A) Example averages of successful EPSCs recorded at threshold stimulation (gray) or at maximal LED intensity (black). Right shows the two waveforms scaled to peak and at a faster time base. (B) Group data showing that the EPSC rise time is similar at threshold and maximal stimulation intensities (n = 11 neurons from N = 4 mice; 1.5 ± 0.2 vs. 1.5 ± 0.1 ms for threshold and maximal intensity, respectively; p=0.85, paired t-test). (C) Same as (B), but for EPSC half-widths (n = 11 neurons from N = 4 mice; 4.7 ± 0.4 vs. 5.1 ± 0.5 ms, respectively; p=0.14, sign-rank test).
Figure 3

Shell inferior colliculus (IC) neurons receiving descending signals have diverse biophysical properties.
(A–E) Examples of different shell IC neurons. Top and middle traces are spike output and membrane hyperpolarization following positive and negative current steps, respectively. Lower traces: average auditory cortical EPSPs from the same neuron. (F, G) EPSP peak amplitude (F) and half-width (G) as a function of biophysical category. Bursting neurons are omitted due to low n.
Figure 4 with 2 supplements
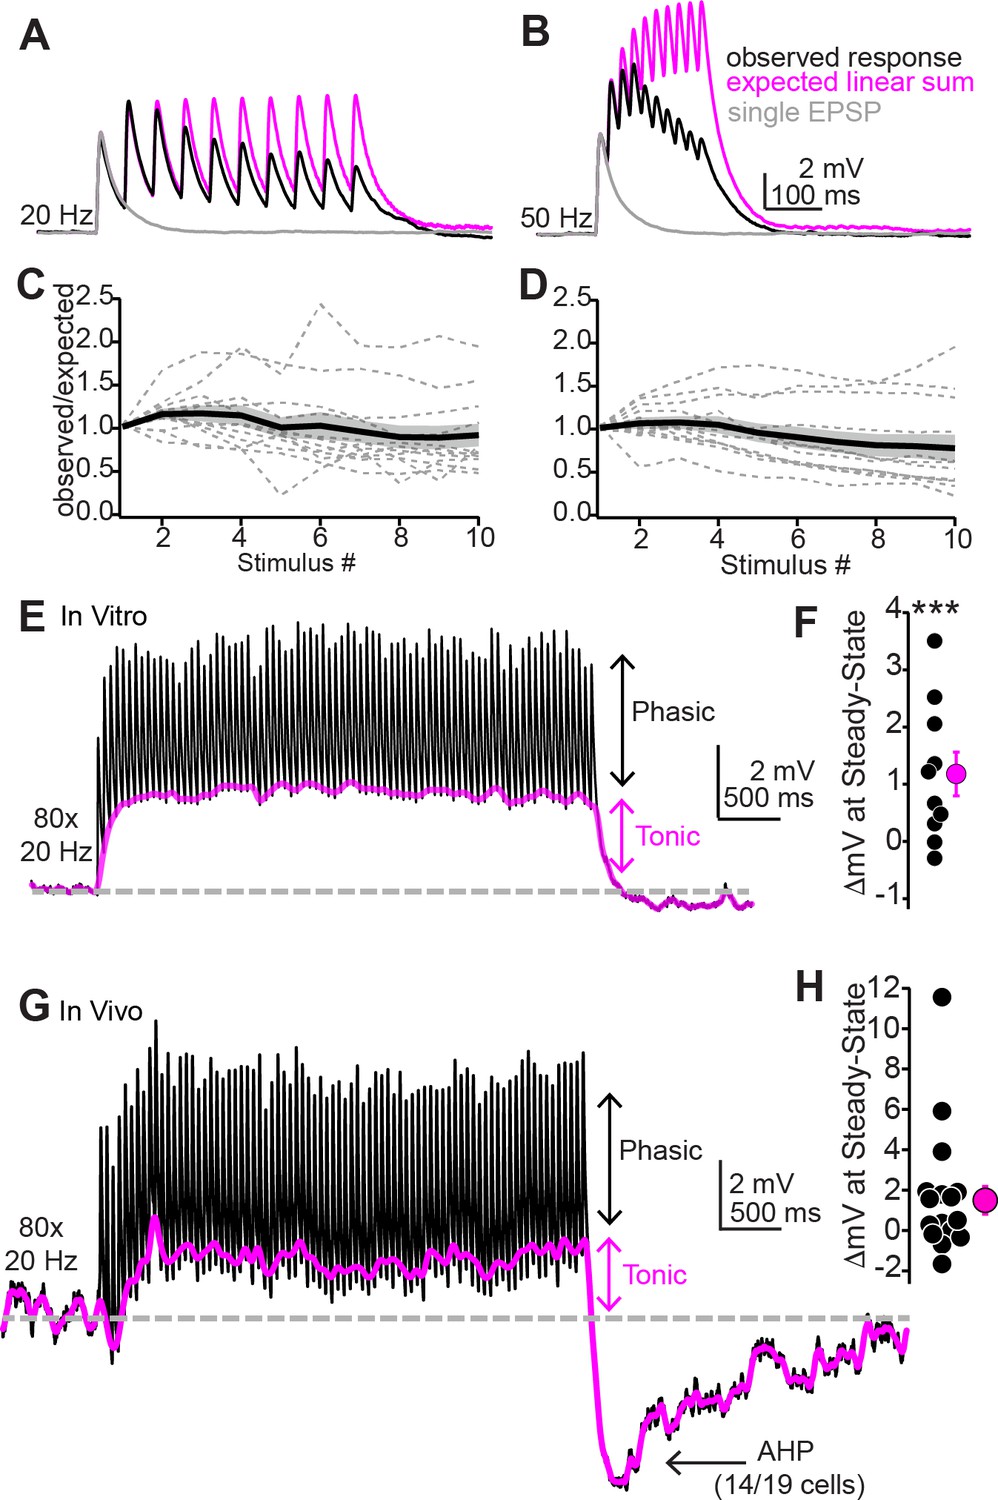
Repetitive synaptic activity tonically depolarizes shell inferior colliculus (IC) neurons despite sublinear temporal summation of EPSPs.
(A, B) Black traces: average EPSPs evoked by 20 (A) or 50 Hz (B) trains of 10 light flashes. Gray: average EPSPs evoked by a single 2 ms light flash recorded in the same neuron. Magenta: the expected response assuming linear summation of single EPSPs at each frequency. Of note is that the recorded EPSP amplitudes in the train are smaller than the expected linear sum. Data in (A) and (B) are from the same neuron. (C, D) Summary of observed over expected amplitudes for EPSPs during 20 (C) or 50 Hz (D) trains. Gray dotted lines are individual neurons; black + shading are mean ± SEM. (E) Sustained auditory cortical transmission generates phasic EPSPs (black) riding atop a tonic depolarization (magenta) in vitro. (F) Group data quantifying membrane potential changes at steady state (final 1 s of stimulation). (G, H) Same as (E) and (F) but during in vivo recordings. Of note is the large after-hyperpolarization (AHP).
Figure 4—figure supplement 1
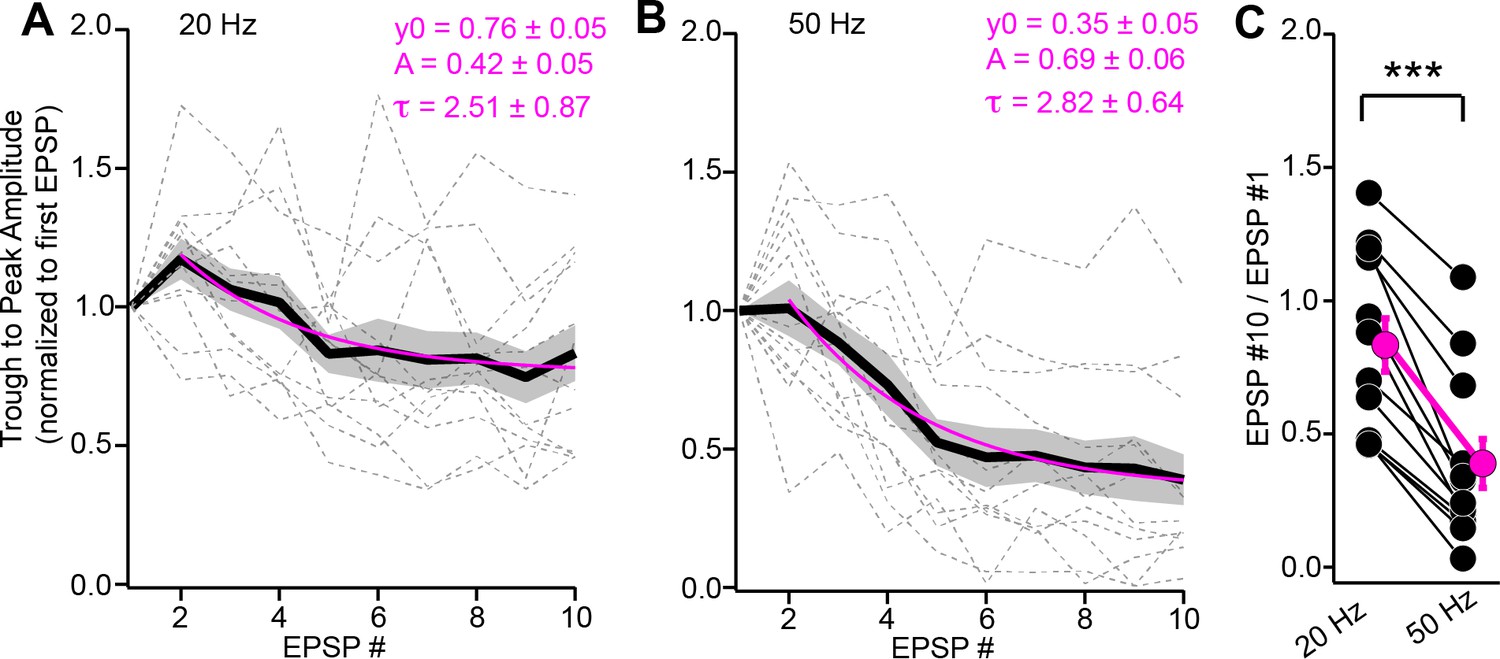
Depression of instantaneous EPSP amplitudes during trains.
(A, B) The trough-to-peak amplitude of individual EPSPs (normalized to first EPSP) plotted as a function of stimulus # for 20 (A) and 50 Hz (B) trains. Data are from the same experiments as Figure 4A–D. Gray dotted lines are individual experiments; black + shading is mean ± SEM. Magenta lines are monoexponential fits to the data beginning at the second stimulus. Fit parameters are provided above. (C) Summary data plotting the ratio of instantaneous amplitudes for the 10th and 1st EPSPs, indicating significantly greater depression of EPSP amplitudes during 50 Hz compared to 20 Hz stimulation.
Figure 4—figure supplement 2
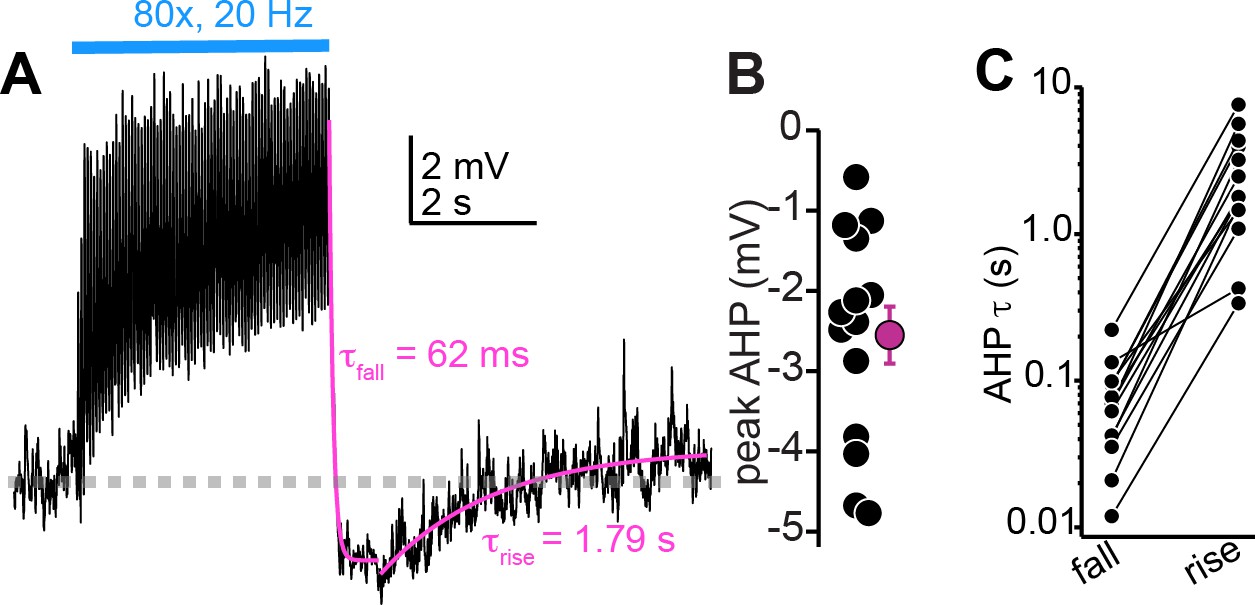
Large after-hyperpolarizations (AHPs) follow the cessation of auditory cortico-collicular activity in vivo.
(A) Membrane potential (average of multiple trials) during prolonged auditory cortical activity in vivo. Magenta are monoexponential fits to the membrane potential fall and rise upon cessation of optogenetic stimulation. (B) Peak AHP amplitude (relative to baseline mV) in n = 14 cells. (C) Time constants for the fall and raise of the membrane potential for n = 14 cells. The data are on a log scale due to the order of magnitude difference in exponent values for fall and rise.
Figure 5 with 1 supplement
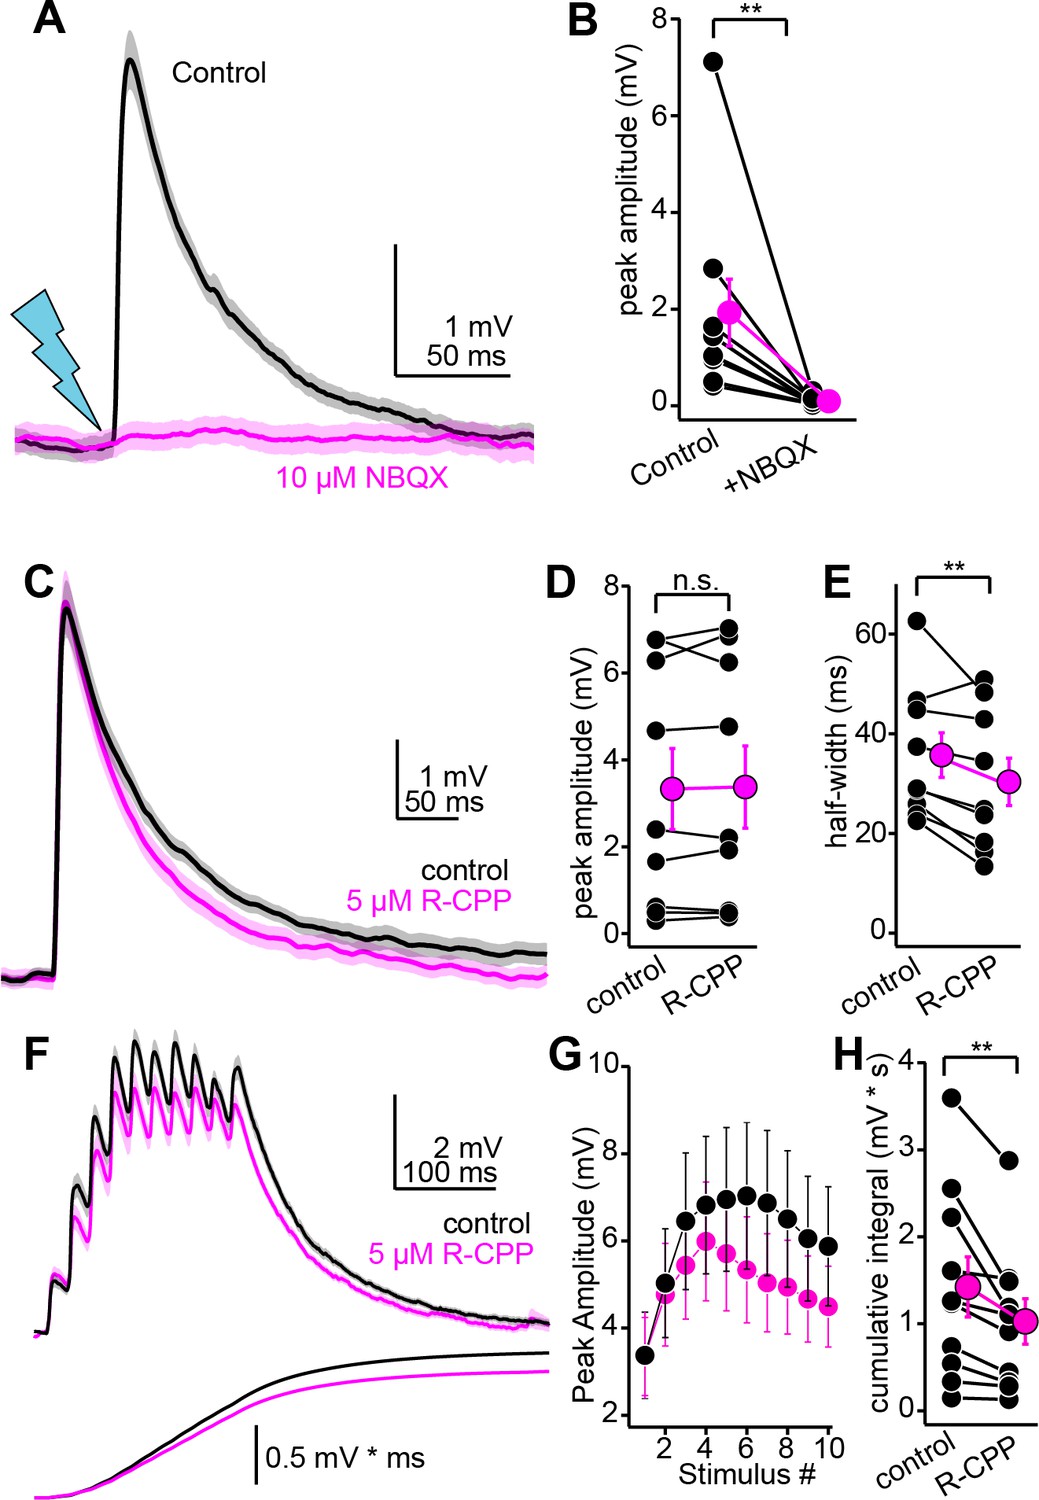
Pharmacology of descending transmission.
(A) EPSPs (mean ± SEM) from a single neuron before (black) and after (magenta) bath application of NBQX (10 µM). Of note is the absence of residual synaptic depolarization after NBQX. (B) Summary data. For the effect of NBQX on descending EPSPs. (C) EPSPs before and after R-CPP (black and magenta traces, respectively). (D, E) Group data for the effect of R-CPP on EPSP peak amplitude (D) and half-width (E). Asterisks denote statistical significance. (F) Upper panel: EPSPs (average ± SEM) evoked by 10 light flashes at 50 Hz. Black and magenta are in control and R-CPP. Lower panel is the cumulative integral of the waveforms. (G) Group data showing amplitude of each EPSP in the train (mean ± SEM) before and after R-CPP (black and magenta, respectively). (H) Group data for the effect of R-CPP on voltage integral as in (F). Asterisks denote significance.
Figure 5—figure supplement 1
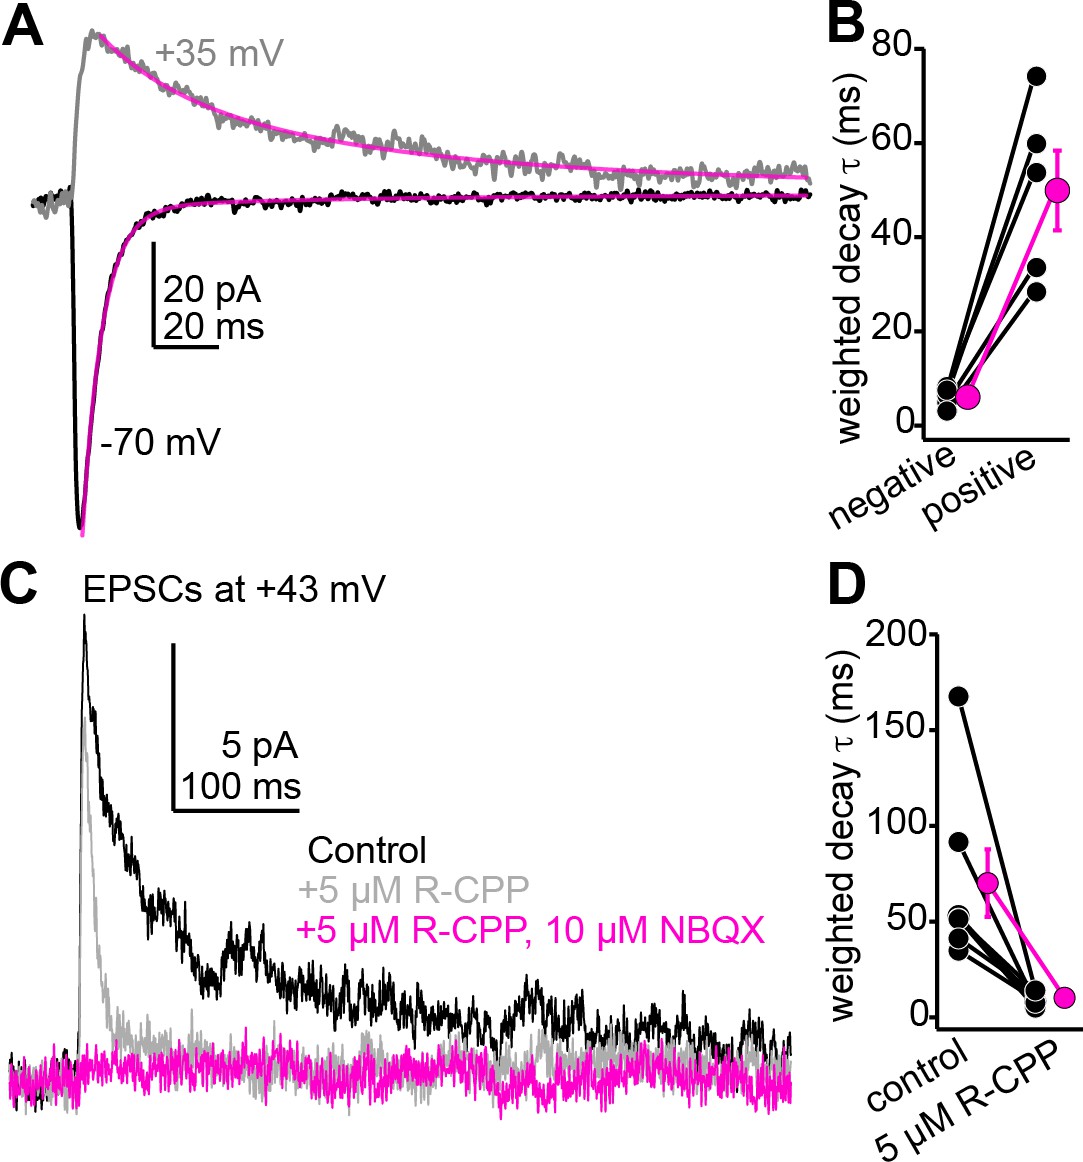
The slow component of auditory cortico-collicular excitatory postsynaptic currents (EPSCs) recorded at positive potentials is blocked by 5 µM R-CPP, consistent with the presence of R-CPP-sensitive NMDARs.
(A) Example average EPSCs recorded at negative and positive potentials. Magenta are double exponential fits to the EPSC decay. (B) Decay time constants for n = 5 cells recorded at positive and negative voltages. (C) R-CPP powerfully accelerates the decay τ of descending EPSCs recorded at positive potentials. The remaining fast EPSC is blocked by NBQX, indicating that it is mediated by AMPA/kainate receptors. (D) Summary data for the effect of R-CPP on EPSC decay τ in n = 7 cells.
Figure 6 with 1 supplement
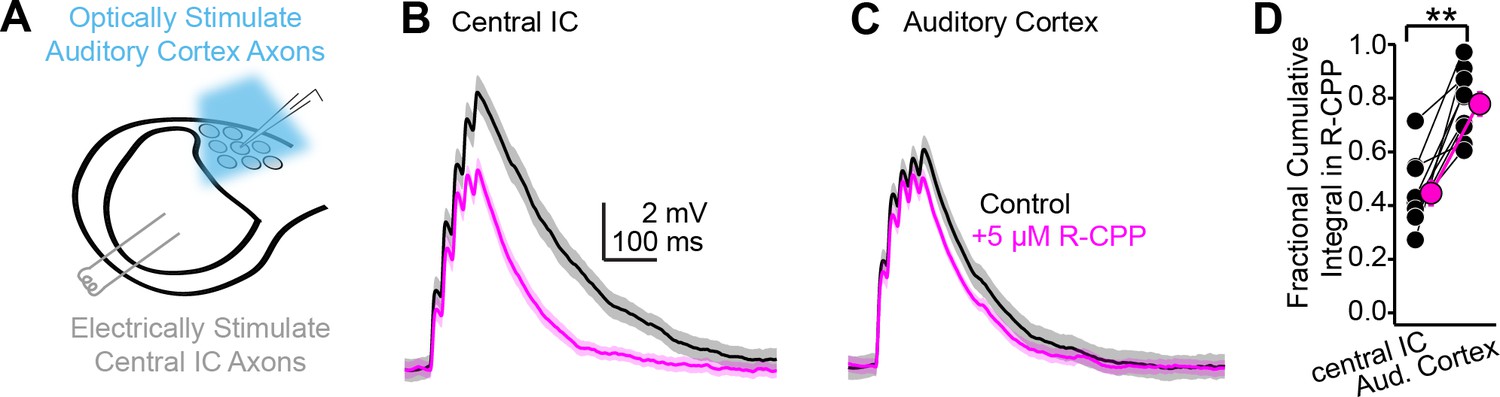
Differential contribution of NMDA receptors at ascending and descending synapses.
(A) Cartoon of experiment: blue light flashes delivered through the microscope objective activate descending auditory cortico-collicular axons; a bipolar electrode in the central inferior colliculus (IC) stimulates ascending central -> shell IC axons. (B, C) EPSPs evoked by 5 × 50 Hz stimulation of central IC (B) or auditory cortex (C) axons, in the absence or presence of R-CPP (black and magenta, respectively). Data in panels (B) and (C) are from the same neuron. (D) Group data quantifying the fractional EPSP remaining in R-CPP (as measured by the cumulative integral of the EPSP waveform) for central IC and auditory cortico-collicular synapses.
Figure 6—figure supplement 1

R-CPP has a greater effect on intra-collicular EPSPs evoked with single shock compared to descending EPSPs evoked with single light flashes.
(A) Example average traces of EPSPs recorded in a shell inferior colliculus (IC) neuron following a single shock to the central IC before (black) and after (magenta) bath application of 5 µM R-CPP. (B) Fraction of peak EPSP amplitude remaining following 5 µM R-CPP for single evoked EPSPs at intra-collicular or auditory cortical synapses onto shell IC neurons. Asterisk denotes statistical significance (see main text). (C) Same as panel (B), but for the fraction of EPSP half-width remaining in R-CPP. Values for auditory cortical EPSPs in panels (B) and (C) are from the same experiments as shown in Figure 5C–E.
Figure 7 with 2 supplements
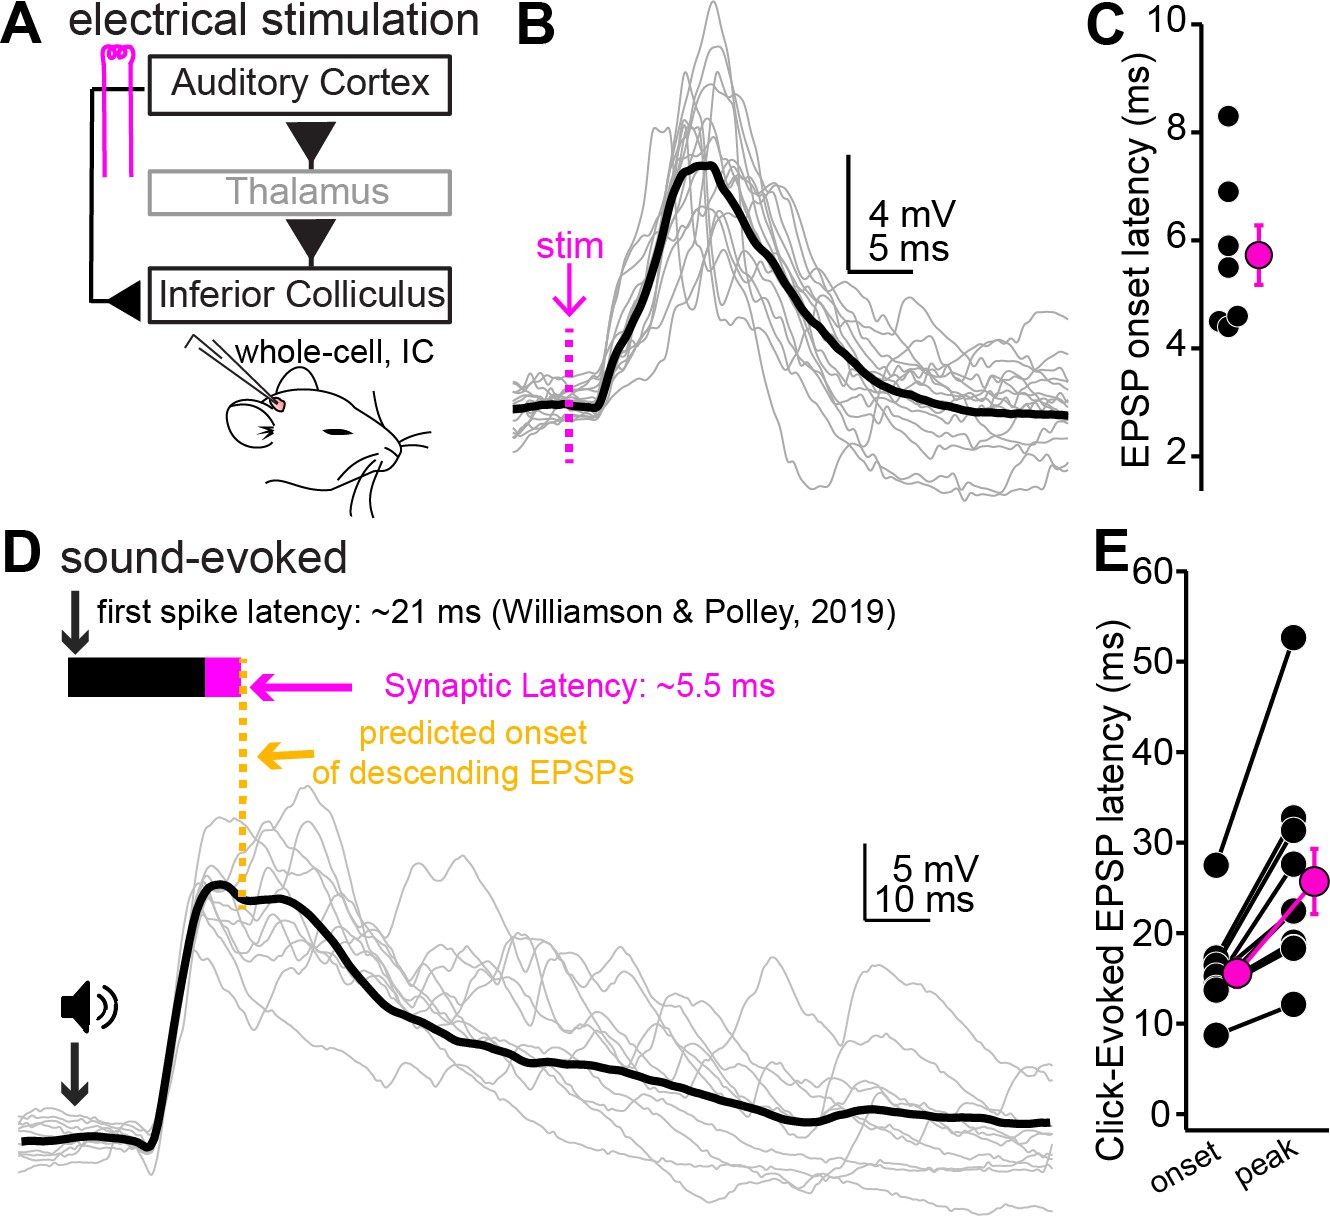
Auditory cortical feedback is predicted to collide with the peak of ascending excitation.
(A) Cartoon of experiment. (B) Example recording showing short latency EPSPs following a single shock to the auditory cortex. Dotted line is onset of stimulation. Gray traces are single trials; black is average. The stimulation artifact, as well as APs riding atop the cortical EPSP, were blanked for clarity. (C) Group data for EPSP onset latency. (D) EPSPs evoked by a 200 µs click. Arrow and speaker show sound onset. Data are from a different neuron than in (B). Black and magenta bars above the traces show the reported first-spike latency of auditory cortico-collicular neurons from previous work and the synaptic latency calculated from panels (B) and (C), respectively. (E) Group data for onset and peak latency of click-evoked EPSPs.
Figure 7—figure supplement 1

Urethane anesthesia does not impact the onset of acoustic activity in the superficial inferior colliculus (IC).
(A) Example average local field potentials (LFPs) from the superficial IC of awake (black) or anesthetized (magenta) mice following a sound click (arrow). Inset: rising phase and peak of the two waveforms at a faster time base. Of note is the similar onset latency of the LFP signal across the two example traces. (B) Summary data showing similar onset latencies of click-evoked LFPs in N = 8 anesthetized and N = 11 awake mice.
Figure 7—figure supplement 2
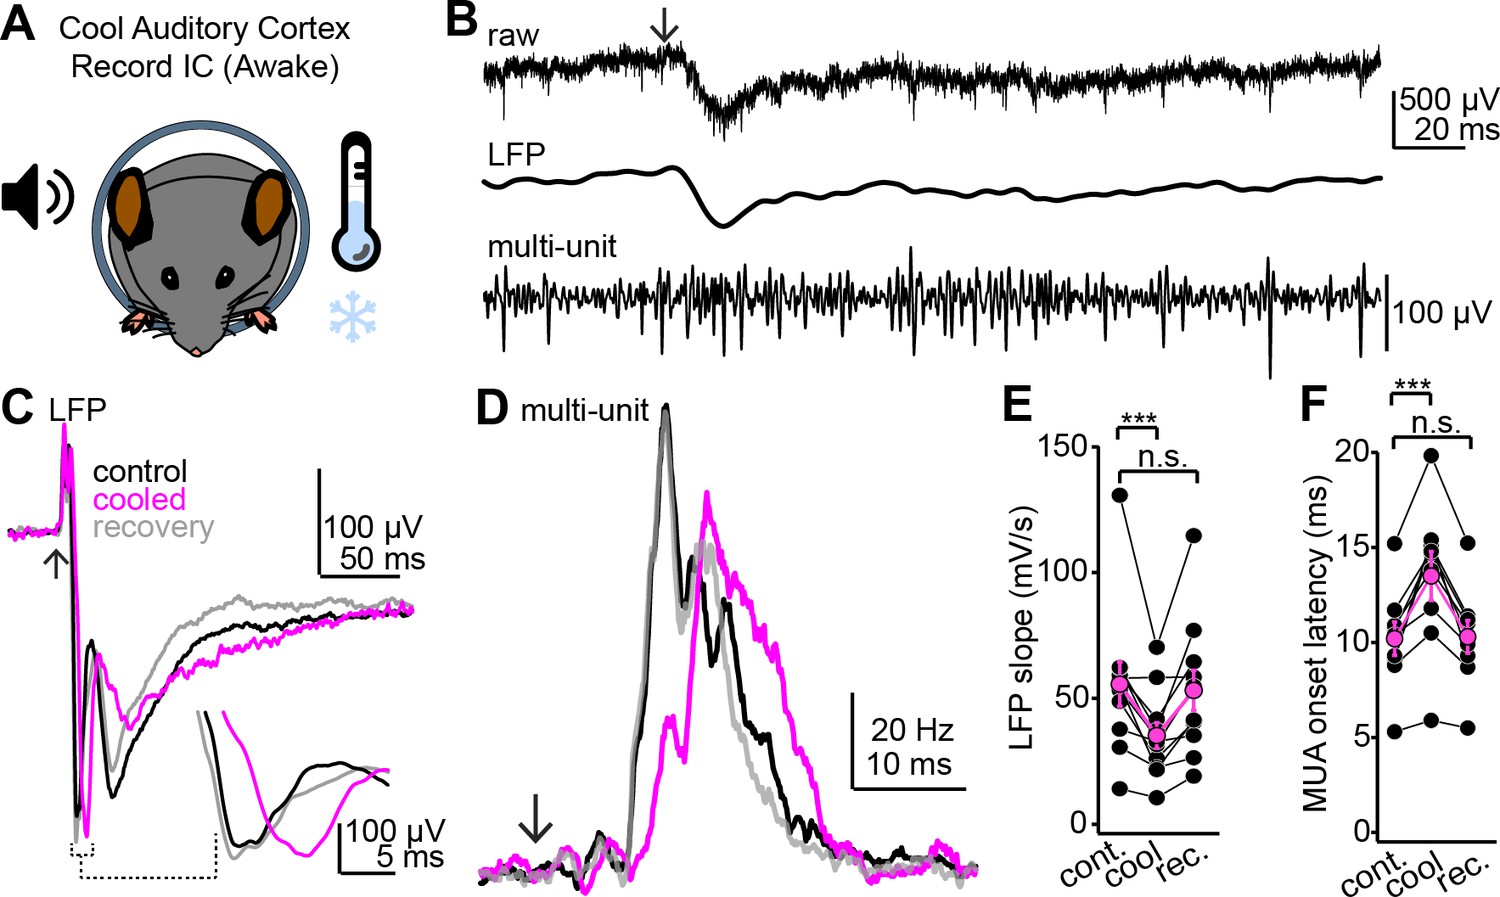
Cooling the auditory cortex impacts sound-evoked responses in the superficial inferior colliculus (IC) of awake mice.
(A) Cartoon of experiment. Extracellular recordings are obtained from the IC of awake mice; Peltier devices (not shown) are positioned bilaterally onto the auditory cortices. (B) Single trial from an example experiment. Top trace shows the raw extracellular waveform obtained following a click sound (arrow). Middle and lower traces are the local field potential (LFP) and multiunit spike activity obtained following digital filtering (see Materials and methods). (C) Example average LFP traces before (black), during (magenta), and after (gray) auditory cortical cooling. Inset shows the rising phase of the LFP at a faster time base to highlight the decrease in slope during cooling. Data are from a different experiment as the one shown in (B). Arrow denotes click onset. (D) Multiunit peristimulus time histograms (PSTHs) following click onset (arrow) before, during, and after auditory cortical cooling. Data are from the same recording as that of panel (C). Of note is that the increase in multiunit spiking is reversibly delayed by cooling, suggesting that auditory cortex indeed influences first-spike latencies in the IC. (E, F) Group data quantifying the effect of auditory cortical cooling on LFP slope (E) and onset of multiunit spiking (F). Asterisks denote statistical significance (Dunnett’s test following one-way repeated-measures ANOVA, p=0.006 and 0.0016 for E and F, respectively).
Figure 8

NMDA receptor-dependent, supralinear pathway integration.
(A) Upper and lower traces are during baseline conditions and after bath applying R-CPP. Left and middle panels: EPSPs during electrical or optogenetic stimulation of central inferior colliculus (IC) or auditory cortical axons, respectively (5×, 50 Hz stimuli). Right panel (‘combined‘): black traces are the observed depolarization during simultaneous stimulation of both pathways. Magenta is the depolarization expected from the arithmetic sum of the waveforms following stimulation of either pathway alone (e.g., left and middle traces). Of note, the observed depolarization under control conditions is larger than expected from linear summation; blocking NMDA receptors linearizes pathway integration (compare black and magenta traces in R-CPP). (B) Group data plotting the ratio of observed and expected peak amplitude for each of five EPSPs in a 50 Hz train during synchronous activation of central IC and auditory cortical synapses. Asterisks denote statistical significance of Bonferroni post-hoc test for the fourth and fifth stimuli following a main effect of drug condition (p=0.038, F(1,9), two-way repeated-measures ANOVA). (C) Group data, observed over expected ratio of the cumulative integral during combined pathway activation in control conditions and in the presence of R-CPP. Asterisks denote statistical significance (sign-rank test).
Additional files
Download links
A two-part list of links to download the article, or parts of the article, in various formats.
Downloads (link to download the article as PDF)
Open citations (links to open the citations from this article in various online reference manager services)
Cite this article (links to download the citations from this article in formats compatible with various reference manager tools)
Synaptic mechanisms of top-down control in the non-lemniscal inferior colliculus
eLife 10:e72730.
https://doi.org/10.7554/eLife.72730


