A dual endosymbiosis supports nutritional adaptation to hematophagy in the invasive tick Hyalomma marginatum
- MIVEGEC (Maladies Infectieuses et Vecteurs : Ecologie, Génétique, Evolution et Contrôle), Univ. Montpellier (UM) - Centre National de la Recherche Scientifique (CNRS) - Institut pour la Recherche et le Développement (IRD), France
- Centre of Research in Ecology and Evolution of Diseases (CREES), Montpellier, France, France
- Department of Biology and Biotechnology “L. Spallanzani”, University of Pavia, Italy
- Faculty of Science, University of South Bohemia, Czech Republic
- Koret School of Veterinary Medicine, The Robert H. Smith Faculty of Agriculture, Food and Environment, The Hebrew University of Jerusalem, Israel
- Department of Biomedical and Clinical Sciences L. Sacco and Pediatric Clinical Research Center, University of Milan, Italy
- Department of Chemical, Biological, Pharmaceutical and Environmental Sciences, University of Messina, Italy
- Center of Rickettsiosis and Arthropod-Borne Diseases (CRETAV), San Pedro University Hospital- Center of Biomedical Research from La Rioja (CIBIR), Spain
- Institute of Infection, Veterinary & Ecological Sciences, University of Liverpool, United Kingdom
- Department of Veterinary Medicine, University of Milan, Italy
Figures
Figure 1 with 3 supplements
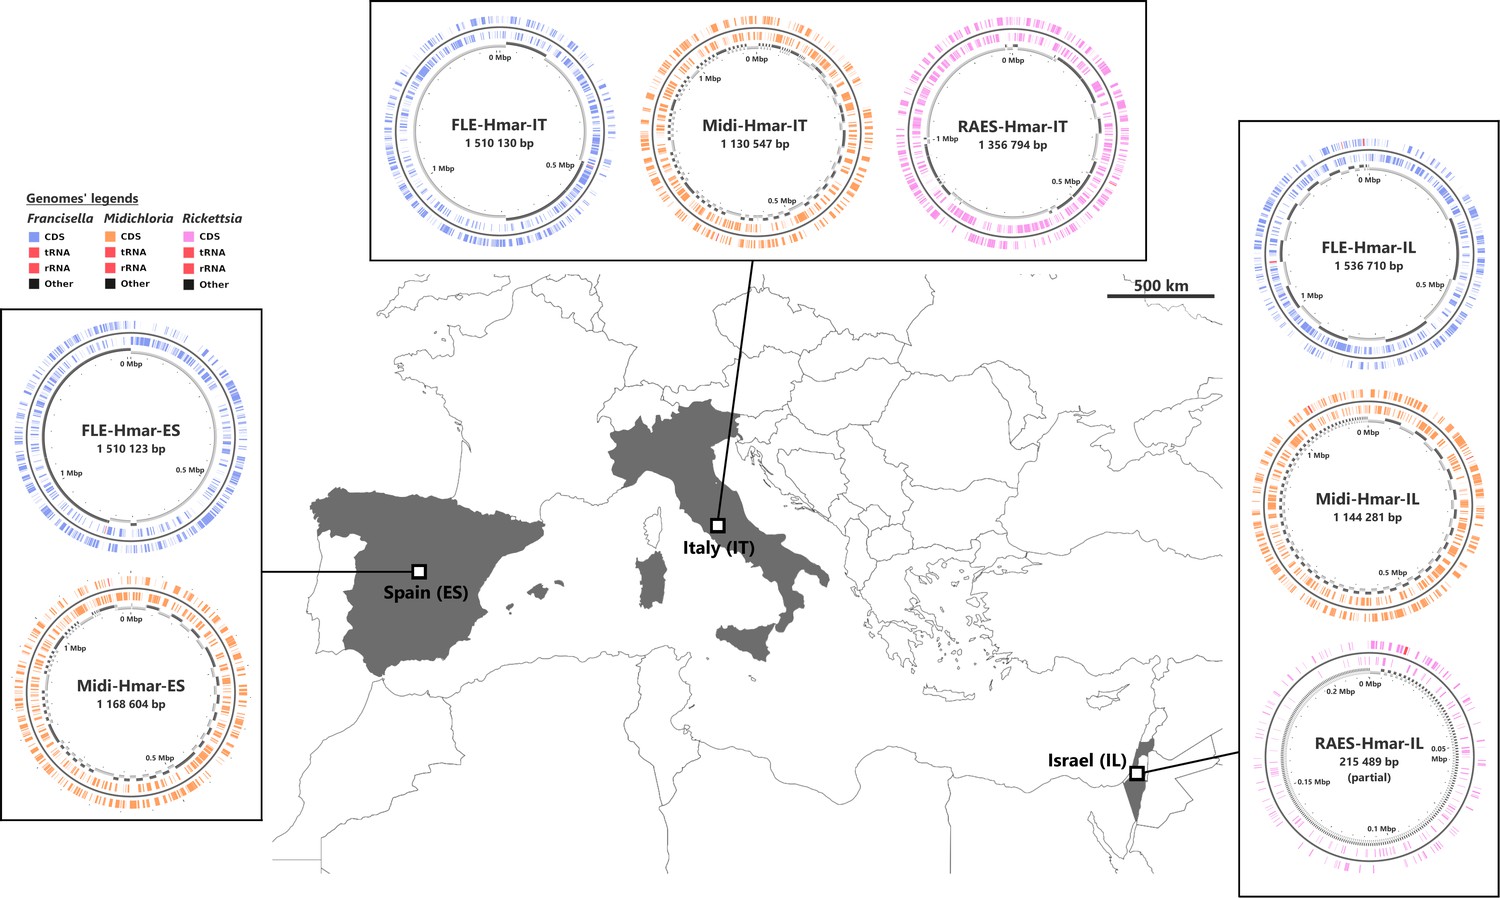
Sampled locations for Hyalomma marginatum ticks.
Sampling countries are colored in gray. The symbiont genomes retrieved from each site are graphically represented in blue, orange, and pink, corresponding to Francisella-LE (FLE), Midichloria (Midi), and R. aeschlimannii (RAES), respectively. Circles on genome maps correspond to the following: (1) forward strand genes; (2) reverse strand genes; (3) in gray and black, contigs. Circular maps of the genomes were produced using CGView.
Figure 1—figure supplement 1

Rickettsia phylogenetic tree assessing the affiliation of the Rickettsia detected in Hyalomma marginatum specimens from Italy and Israel.
The phylogenetic tree was inferred using maximum likelihood from a concatenated alignment of 324 single-copy orthologs genes (88,128 amino acids; best-fit approximation for the evolutionary model: JTT+G4+I). The numbers on each node represent the support of 1000 bootstrap replicates; only bootstrap values >70% are shown. The scale bar is in units of substitution/site. Sequence from the newly sequenced Rickettsia genome is indicated by a pink font.
Figure 1—figure supplement 2
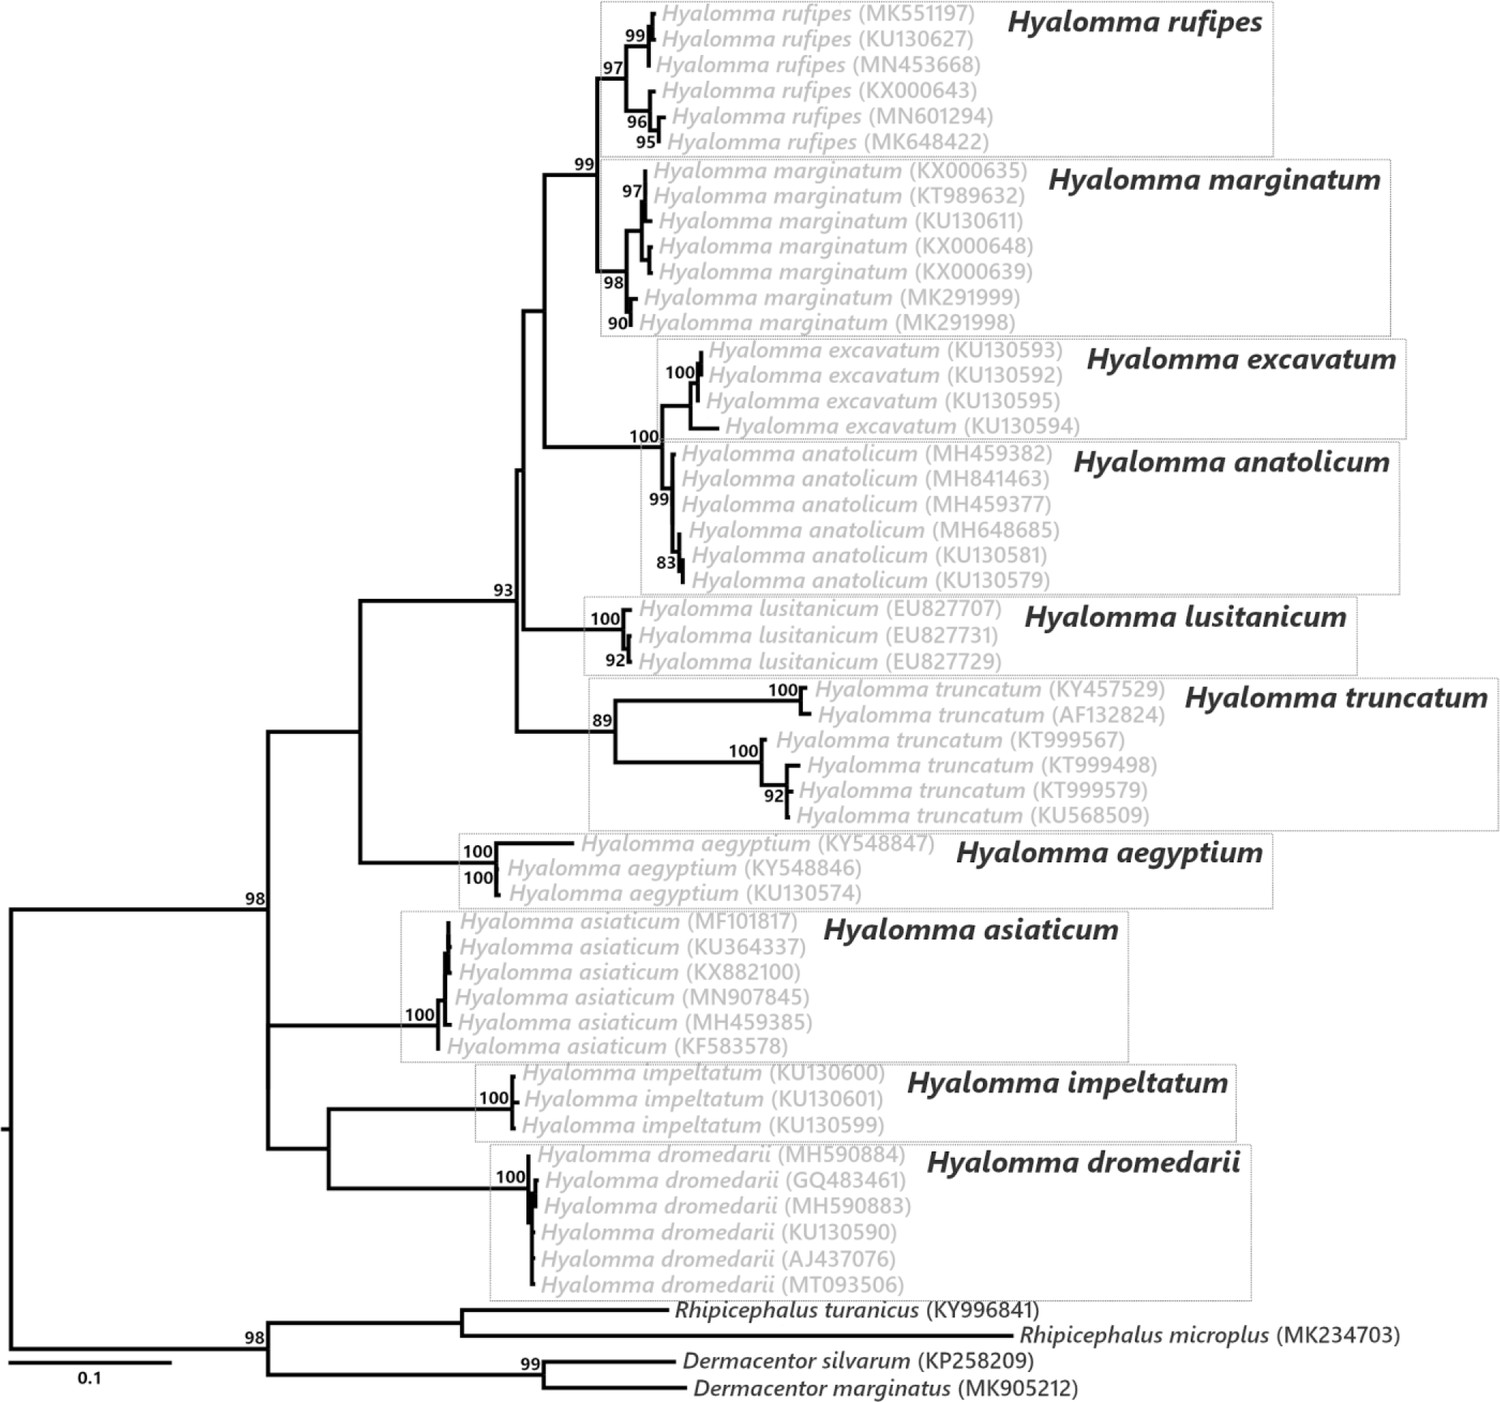
Phylogenetic relationship of the Hyalomma species used in our study.
The phylogenetic tree was inferred using maximum likelihood from an alignment of the cytochrome c oxidase I (cox1) gene sequences (546 bp unambiguously aligned, best-fit approximation for the evolutionary model: HKY+G+I). The numbers on each node represent the support of 1000 bootstrap replicates; only bootstrap values >80% are shown. The scale bar is in units of substitution/site.
Figure 1—figure supplement 3
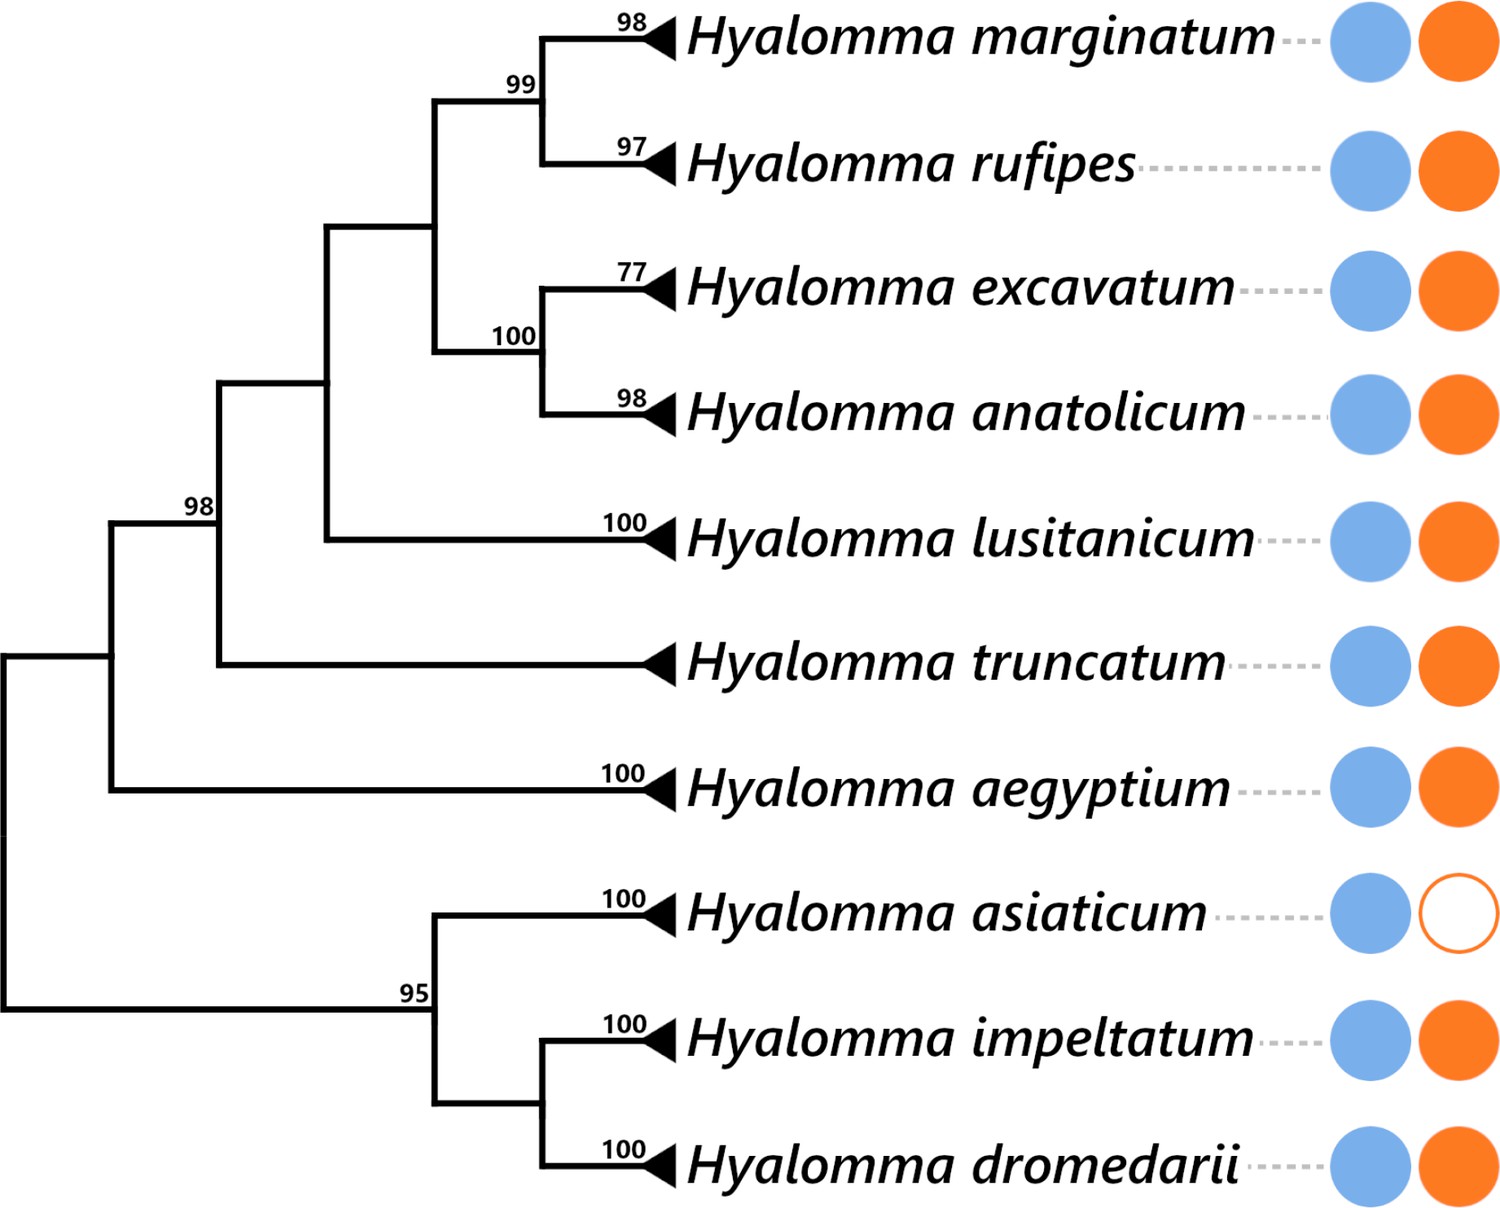
Presence of FLE and Midichloria within the Hyalomma genus.
The Hyalomma cladogram was adapted from cox1 phylogeny showed in Figure 6. The numbers on each node represent the support of 1000 bootstrap replicates; only bootstrap values >80% are shown. The scale bar is in units of substitution/site. Blue and orange plain circles indicate the presence of FLE and Midichloria, respectively, as detailed in Supplementary file 1d. Blank circle represents an absence of symbiont.
Figure 2
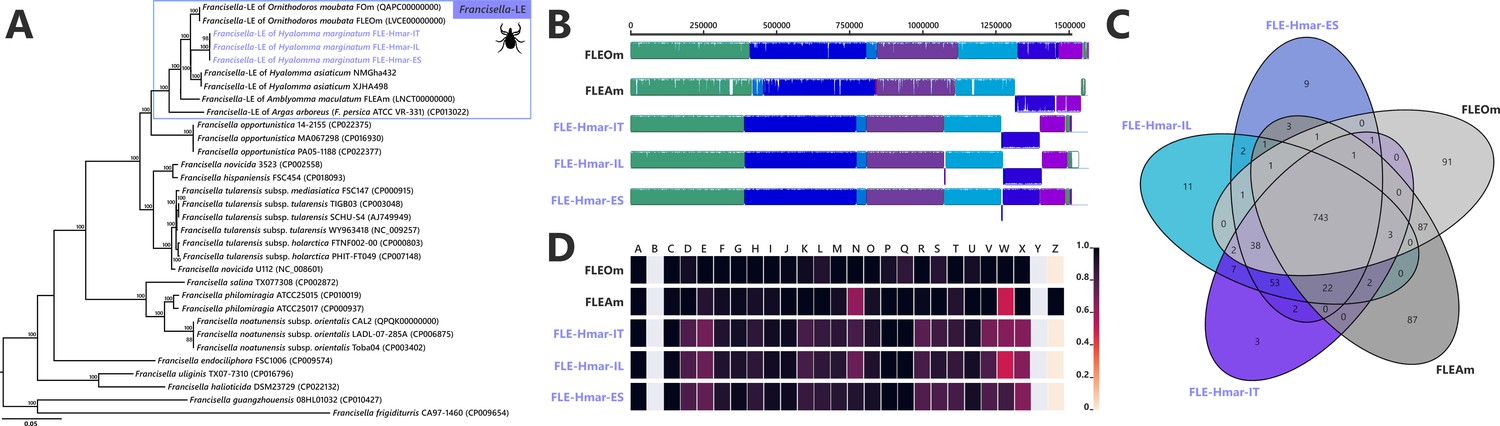
Comparative genomic features of FLE.
(A) Whole-genome phylogenetic relationship of the three FLE genomes obtained from Hyalomma marginatum specimens (highlighted), FLE of other tick species, and Francisella pathogenic species, including F. tularensis. The phylogenetic tree was inferred using maximum likelihood from a concatenated alignment of 436 single-copy orthologs genes (132,718 amino acids; best-fit approximation for the evolutionary model: CPREV+G4+I). The numbers on each node represent the support of 1000 bootstrap replicates; only bootstrap values >70% are shown. The scale bar is in units of substitution/site. Sequences from newly sequenced FLE genomes are indicated by a blue font. (B) Whole-genome synteny of the three FLE genomes obtained from H. marginatum specimens (blue font) and representative FLE (black font). Each contiguously colored locally collinear block (LCB) represents a region without rearrangement of the homologous backbone sequence. LCBs below the center in Francisella genomes represent blocks in the reverse orientation. The height of color bars within LCBs corresponds to the average level of similarity (conservation) profile in that region of the genome sequence. Areas that are completely white were not aligned and containd sequence elements specific to a particular genome. (C) Venn diagram representing orthologs distribution between the three FLE genomes obtained from H. marginatum specimens (blue font) and representative FLE (black font). (D) Clusters of orthologous groups of proteins (COGs) comparisons between the three FLE genomes obtained from H. marginatum specimens (blue font) and representative FLE (black font). The color scale indicates the percentage of functional genes per category. Gray color means that genes are not present in a given category. The COG category names (capital letters from A to Z) correspond to the NCBI reference naming system.
Figure 3
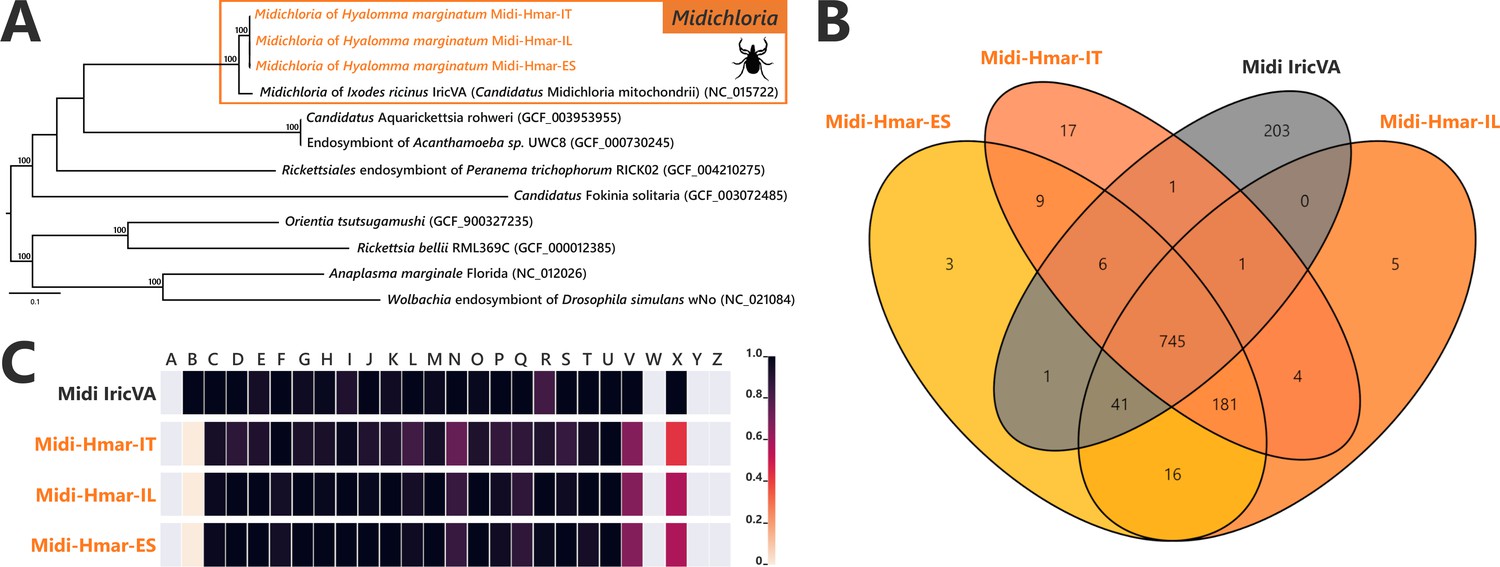
Comparative genomic features of Midichloria.
(A) Whole-genome phylogenetic relationship of the three Midichloria genomes obtained from Hyalomma marginatum specimens (highlighted), 'Ca M. mitochondrii', and other Rickettsiales species. The phylogenetic tree was inferred using maximum likelihood from a concatenated alignment of 242 single-copy orthologs genes (49,957 amino acids; best-fit approximation for the evolutionary model: LG+G4+I). The numbers on each node represent the support of 1000 bootstrap replicates; only bootstrap values >70% are shown. The scale bar is in units of substitution/site. Sequences from newly sequenced Midichloria genomes are indicated by an orange font. (B) Venn diagram representing orthologs distribution between the three Midichloria genomes obtained from H. marginatum specimens (orange font) and ‘Ca. M. mitochondrii’ (black font). (C) Clusters of orthologous groups of proteins (COGs) comparisons between the three Midichloria genomes obtained from H. marginatum specimens (orange font) and ‘Ca. M. mitochondrii’ (black font). The color scale indicates the percentage of functional genes per category. Gray color means that genes are not present in a given category. The COG category names (capital letters from A to Z) correspond to the NCBI reference naming system.
Figure 4 with 5 supplements
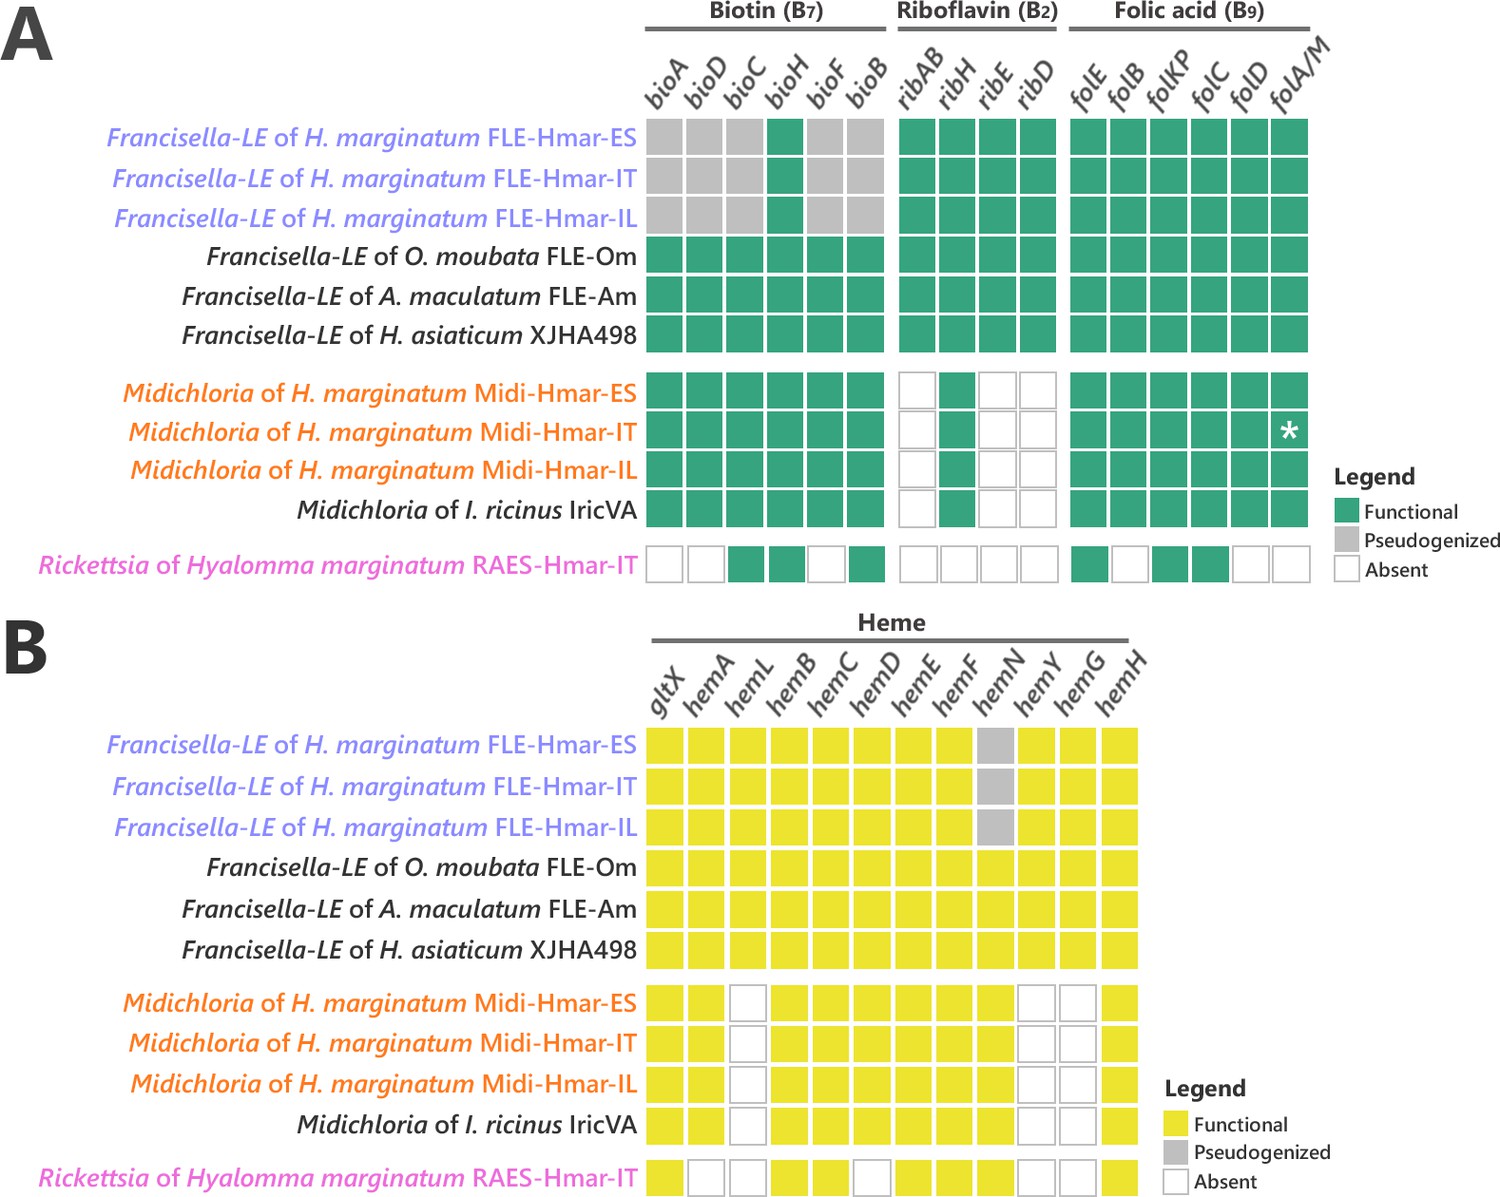
Conservation level of biosynthetic pathways involved in the symbiotic interaction between ticks and endosymbionts.
(A) Biosynthetic pathways for the three key B vitamins (biotin, folic acid, and riboflavin) required for tick nutrition of FLE, Midichloria, and Rickettsia. Newly sequenced FLE, Midichloria, and Rickettsia genomes are indicated by a blue, an orange, and a pink font, respectively. Green squares, functional genes; gray squares, pseudogenes; white squares, missing genes; asterisk, partial gene sequence that do not contain internal codon stop but that are located at the beginning of a contig. (B) Heme biosynthetic pathway of FLE, Midichloria, and Rickettsia. Newly sequenced FLE, Midichloria, and Rickettsia genomes are indicated by a blue, an orange, and a pink font, respectively. Yellow squares, functional genes; gray squares, pseudogenes; white squares, missing genes.
Figure 4—figure supplement 1

Conservation level of the genes involved in the Francisella pathogenicity island (FPI) on FLE of Hyalomma marginatum and references genomes.
Genomes of FLE of H. marginatum are indicated by a blue font. Francisella pathogenic species is indicated by a red font. Red squares, functional genes; gray squares, pseudogenes; white squares, missing genes.
Figure 4—figure supplement 2
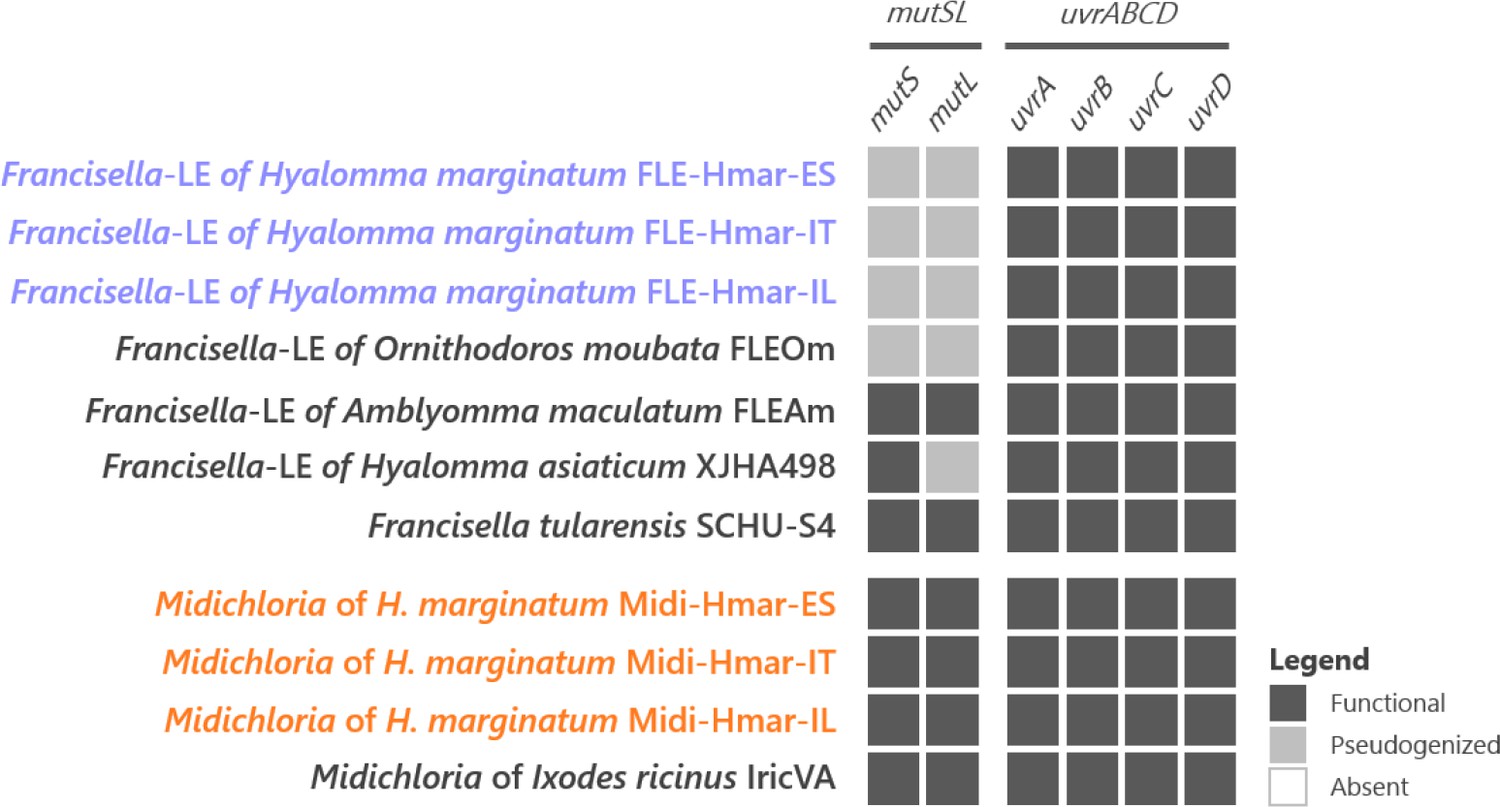
Conservation level of the genes involved in the mismatch repair system (mutSL) and the nucleotide excision repair system (uvrABCD) on FLE and Midichloria of Hyalomma marginatum and references genomes.
Newly sequenced FLE and Midichloria genomes are indicated by a blue and an orange font, respectively. Black squares, functional genes; gray squares, pseudogenes; white squares, missing genes.
Figure 4—figure supplement 3
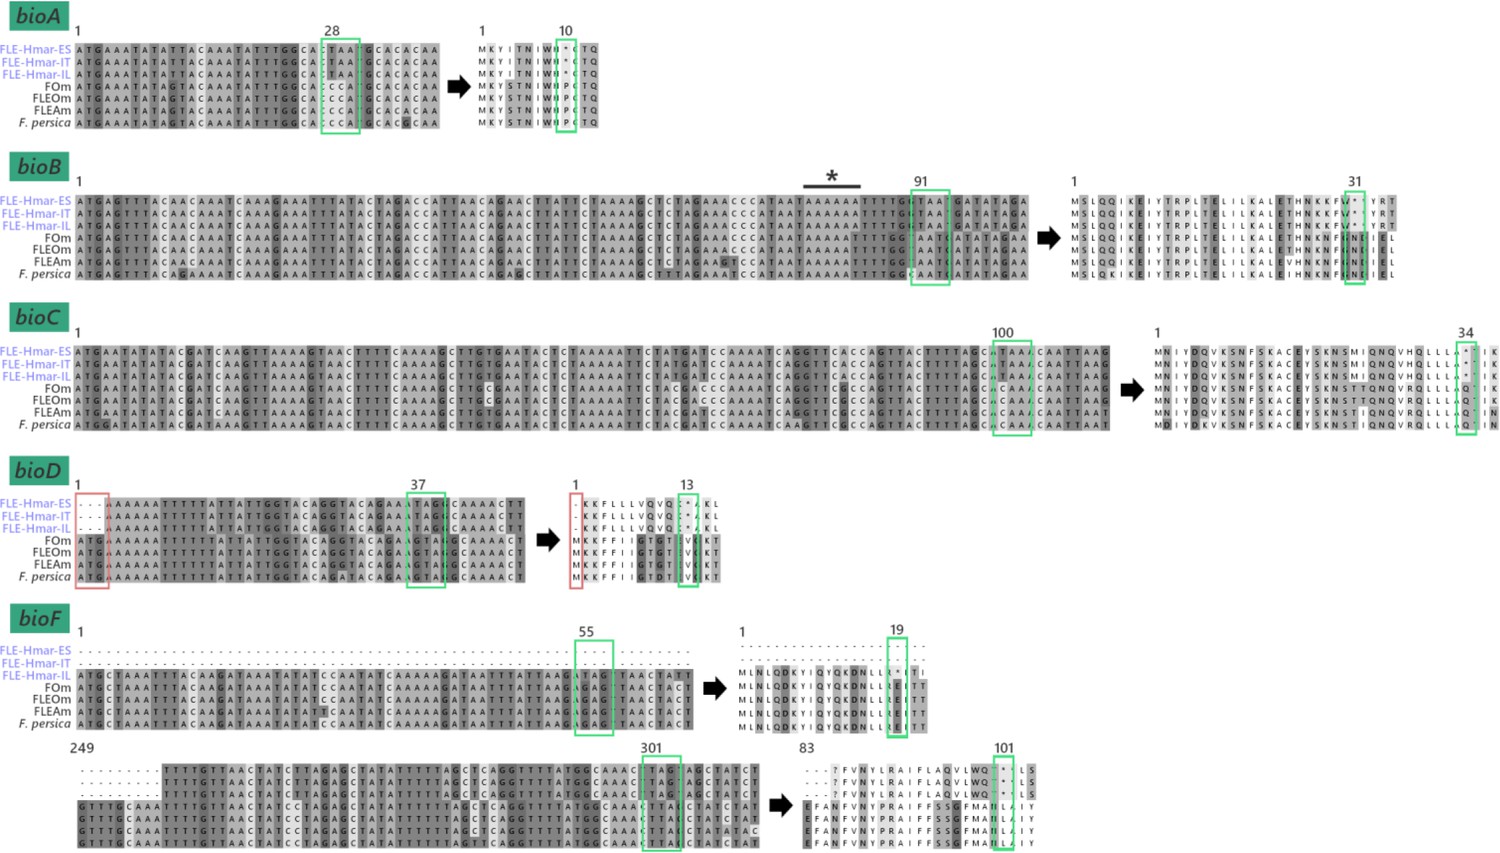
Pseudogenization of biotin synthesis genes.
Representative nucleotide and amino sequences are shown for each of the five pseudogenized biotin genes. Green box, premature stop codon; red box, absence of start codon; asterisk, insertion of one adenine base on a poly(A) zone and inducing a frameshift in the bioB coding sequence. Numbers attached to the boxes correspond to the position of the first nucleic acid leading to the premature stop codon and its position in the protein sequence.
Figure 4—figure supplement 4

Conservation level of (A) pantothenic acid, nicotinic acid, pyroxidine, and thiamine B vitamins and (B) cofactors biosynthetic pathways of FLE, Midichloria, and Rickettsia.
Newly sequenced FLE, Midichloria, and Rickettsia genomes are indicated by a blue, an orange, and a pink font, respectively. Green squares, functional genes; gray squares, pseudogenes; white squares, missing genes.
Figure 4—figure supplement 5
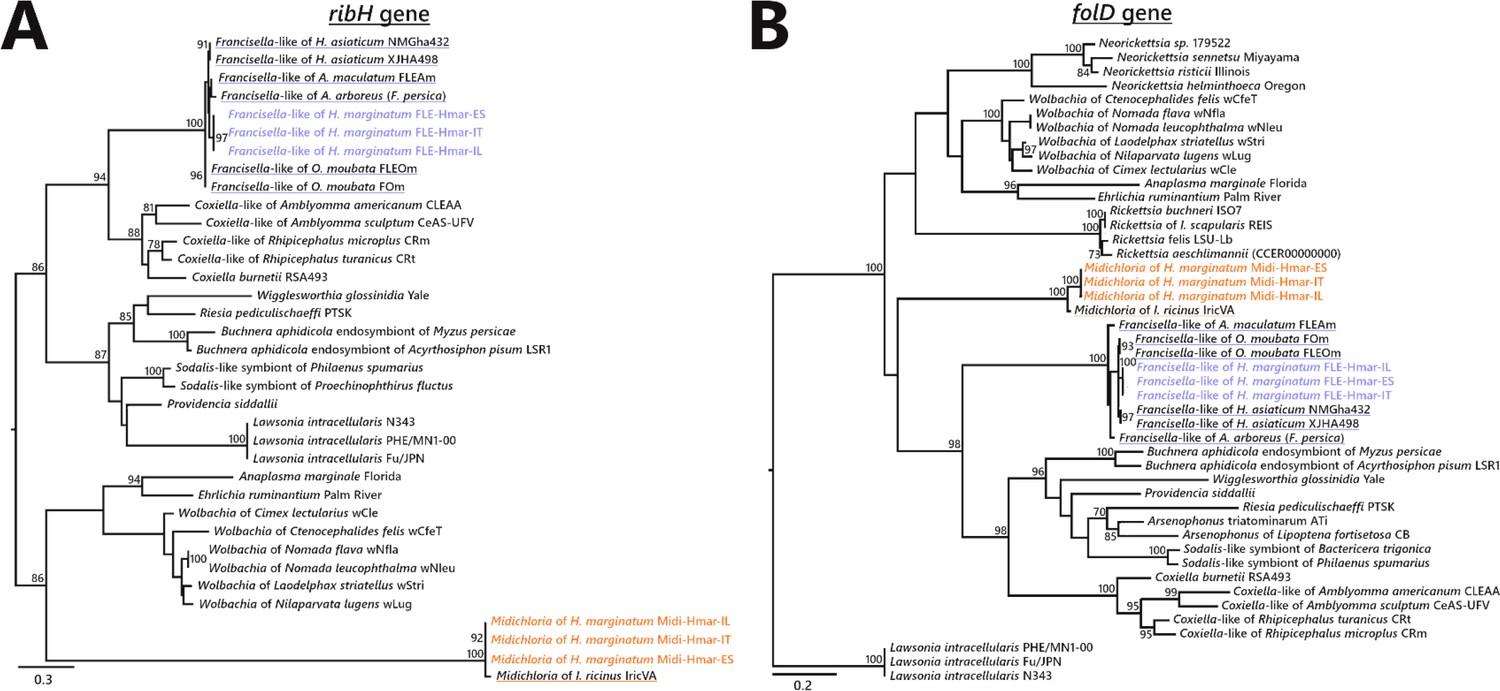
Phylogenetic trees of representative genes of riboflavin and folate biosynthesis pathways of FLE and Midichloria.
The phylogenetic trees of (A) ribH (riboflavin pathway), and (B) folD (folate) were inferred using maximum likelihood from amino acid alignments. The numbers on each node represent the support of 1000 bootstrap replicates; only bootstrap values >70% are shown. The scale bar is in units of substitution/site. ribH: 129 amino acids unambiguously aligned, best-fit approximation for the evolutionary model LG+G4; folD: 273 amino acids unambiguously aligned, best-fit approximation for the evolutionary model CPREV+G4+I. Newly sequenced FLE and Midichloria sequences are indicated by a blue and an orange font, respectively, while sequences from other FLE and Midichloria are highlighted in blue and orange, respectively.
Figure 5

Evolutionary relationships (left) and structure (middle) of the streamlined biotin operon, confronted to the bacterial phylogeny (right).
The phylogenetic tree of the streamlined biotin operon (left) was inferred using maximum likelihood (ML) from a concatenated alignment of the six genes composing the biotin biosynthetic pathway (1493 amino acids; best-fit approximation for the evolutionary model: CPREV+G4+I). The numbers on each node represent the support of 1000 bootstrap replicates; only bootstrap values >70% are shown. The scale bar is in units of substitution/site. Sequences from newly sequenced Midichloria genomes are indicated by an orange font. Structure of the streamlined biotin operon (middle) is represented by arrows in which each colored arrow corresponds to an intact gene and its direction. A discontinuous line corresponds to genes encoding on two separated contigs. The bacterial phylogenetic tree (right) was inferred using ML from an alignment of 16S rDNA sequences (1362 bp unambiguously aligned; best-fit approximation for the evolutionary model: GTR+G+I). The numbers on each node represent the support of 1000 bootstrap replicates; only bootstrap values >70% are shown. The scale bar is in units of substitution/site. Sequences from Midichloria of Hyalomma marginatum are indicated by an orange font.
Figure 6
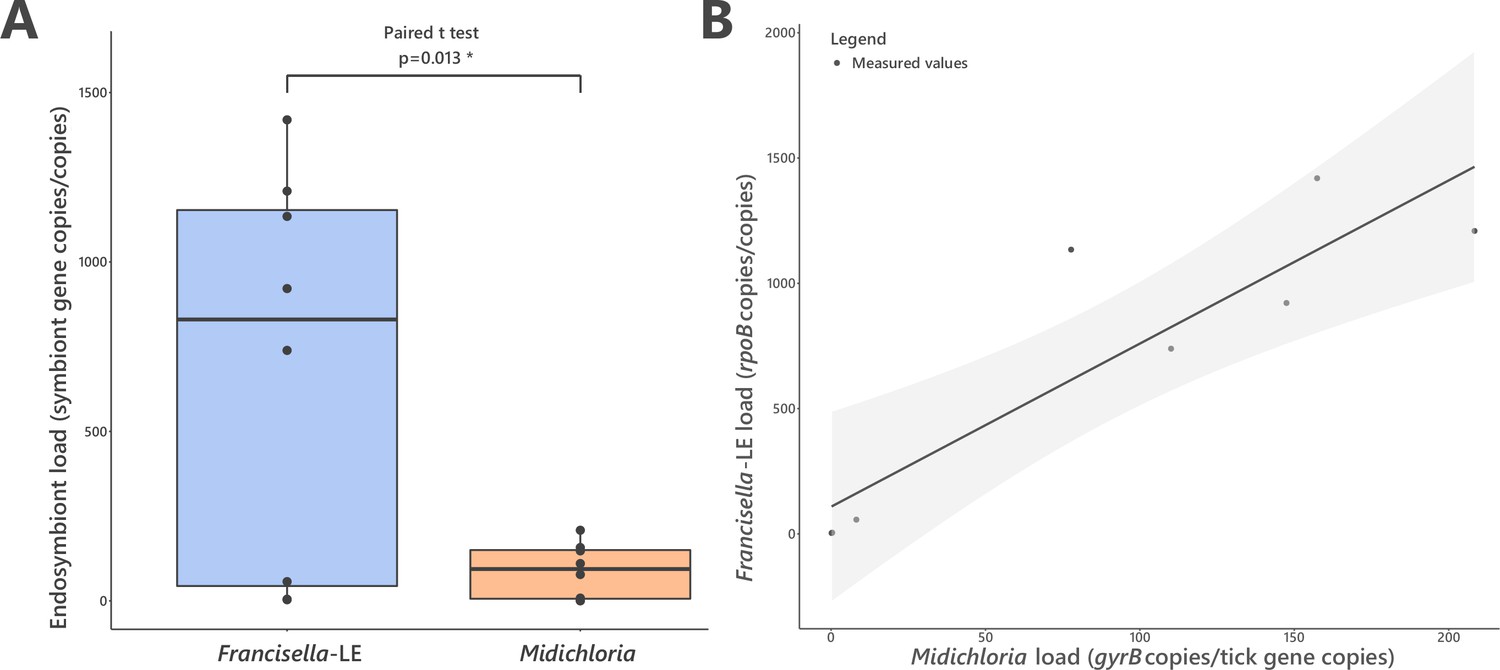
FLE and Midichloria loads in ovaries of Hyalomma marginatum.
(A) Representation and statistical comparison of FLE and Midichloria densities. (B) FLE density as a function of Midichloria density in H. marginatum ovaries. Gray area represents 95% confidence interval.
-
Figure 6—source data 1
FLE and Midichloria densities in H. marginatum ovaries.
- https://cdn.elifesciences.org/articles/72747/elife-72747-fig6-data1-v1.xlsx
Additional files
-
Supplementary file 1
Supplementary file 1 contains tables with relevant information that was needed for the genome assemblies and their following analyses, including a summary of the assembly information and quality analyses of the newly sequenced genomes.
Supplementary file 1 presents as well the genes and the primers used for qPCR assays conducted for relative quantification of FLE and Midichloria.
- https://cdn.elifesciences.org/articles/72747/elife-72747-supp1-v1.docx
-
Transparent reporting form
- https://cdn.elifesciences.org/articles/72747/elife-72747-transrepform1-v1.pdf
Download links
A two-part list of links to download the article, or parts of the article, in various formats.
Downloads (link to download the article as PDF)
Open citations (links to open the citations from this article in various online reference manager services)
Cite this article (links to download the citations from this article in formats compatible with various reference manager tools)
A dual endosymbiosis supports nutritional adaptation to hematophagy in the invasive tick Hyalomma marginatum
eLife 10:e72747.
https://doi.org/10.7554/eLife.72747


