Application of ATAC-Seq for genome-wide analysis of the chromatin state at single myofiber resolution
- Department of Human Genetics, McGill University, Canada
- Lady Davis Institute for Medical Research, Jewish General Hospital, Canada
- McGill Genome Centre, Canada
- Canadian Centre for Computational Genomics, Canada
Figures
Figure 1 with 1 supplement
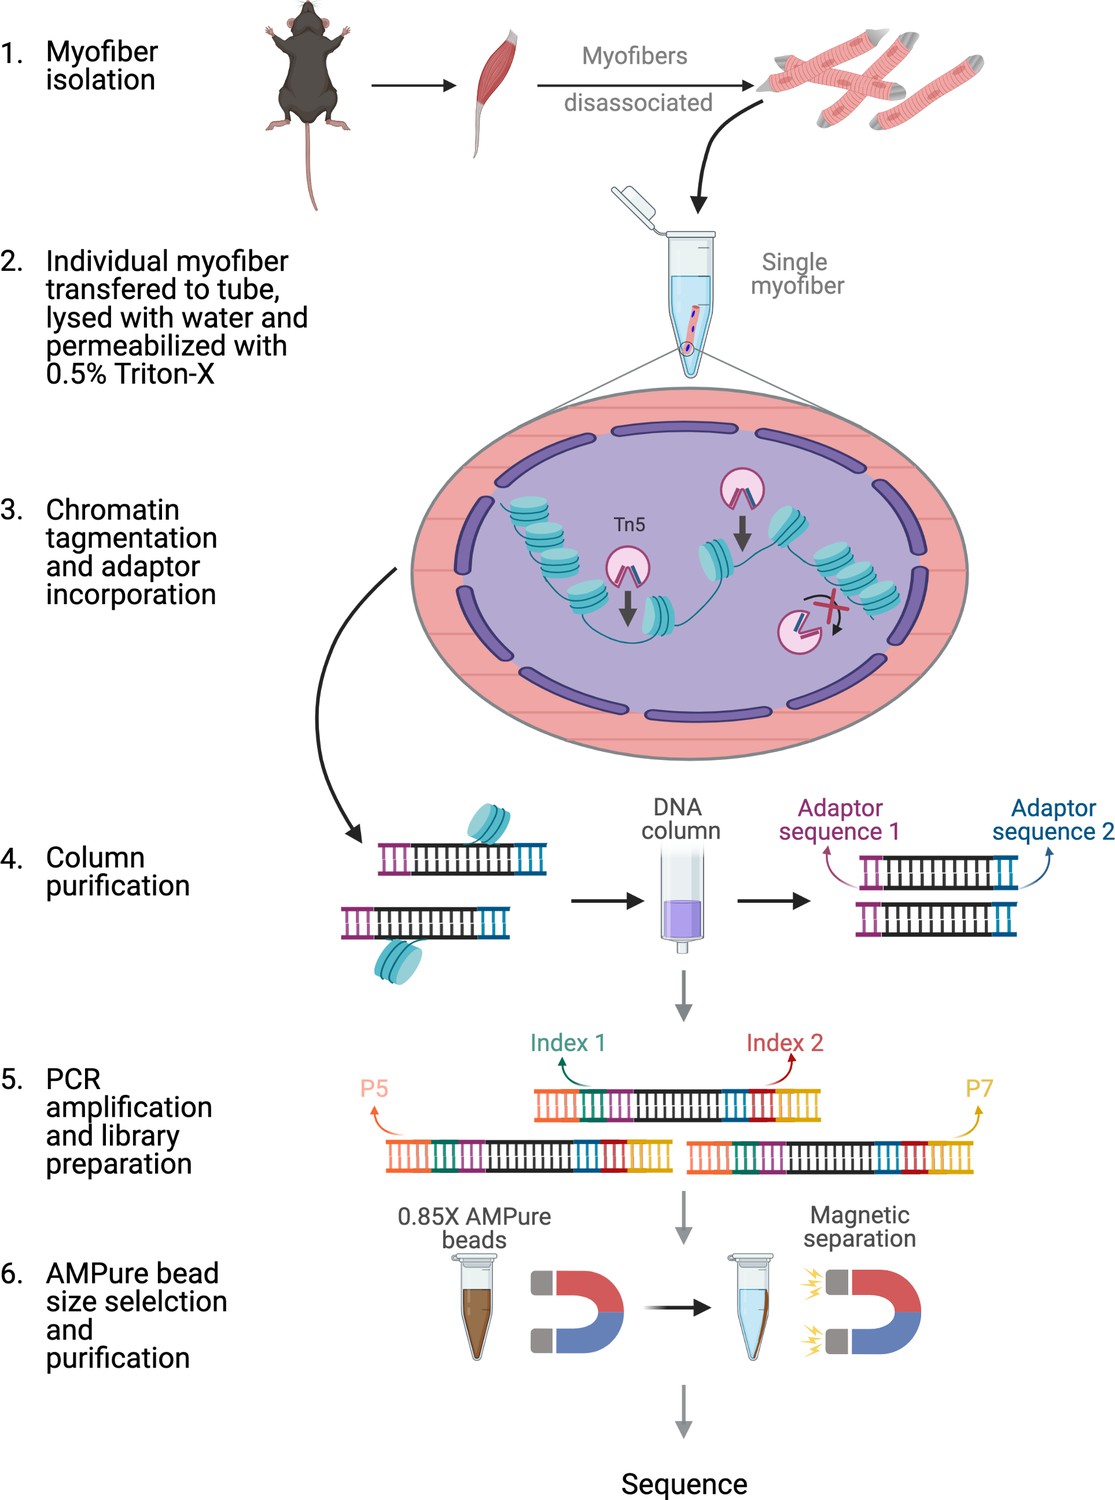
Schematic of ATAC-seq performed on a single myofiber.
Schematic of the steps and reactions involved in the preparation of sequencing ready libraries of single myofiber DNA for ATAC-Seq. Briefly, myofibers were isolated from the EDL muscle and an individual myofiber was transferred to a 0.2 mL microtube. The myofiber was then lysed with ddH2O and the myonuclei were permeabilized with 0.5% Triton X-100. Then, open chromatin regions were tagmented with hyperactive Tn5 transposase and the DNA fragments were purified through column purification. The tagmented DNA was then amplified by PCR and Nextera adaptors were incorporated. Finally, size selection and purification were performed using 0.85 X AMPure beads, resulting in sequencing ready libraries. Figure was made using BioRender.
Figure 1—figure supplement 1
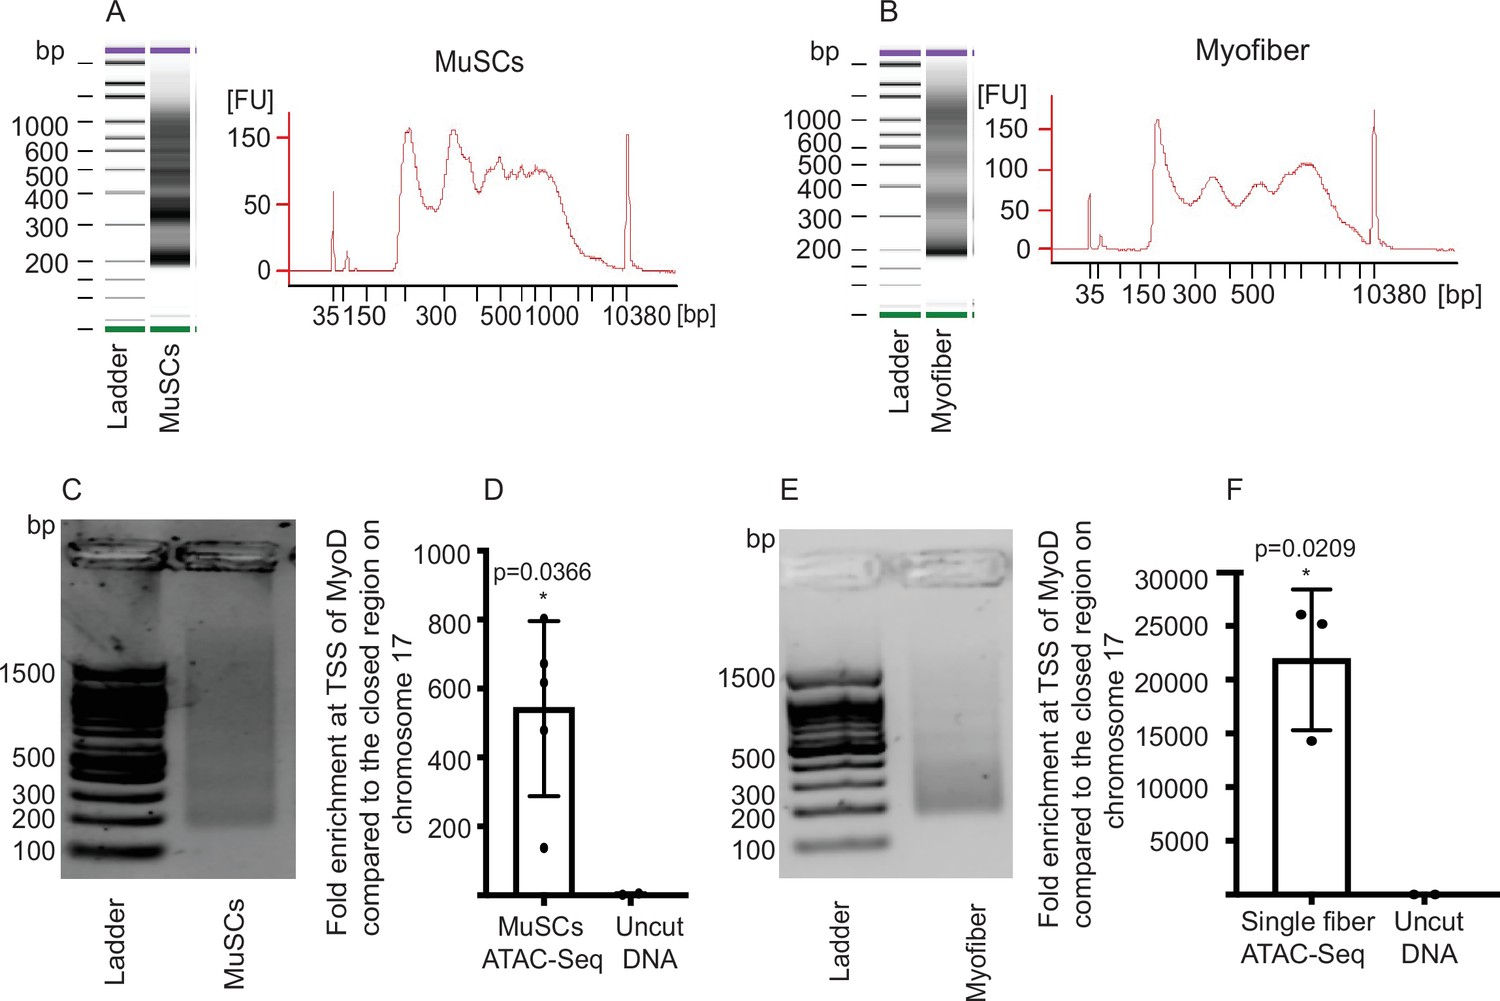
Quality control of ATAC-Seq libraries.
(A) Bioanalyzer profile of an ATAC-Seq library prepared from 5,000 MuSCs. (B) Example bioanalyzer profile of ATAC-Seq library prepared from a single myofiber. (C) Representative picture of a ready to sequence MuSC ATAC-seq library after size selection, visualized on an agarose gel. (D) Fold enrichment for the TSS of MyoD compared to negative control region of Chromosome 17 qE5 between MuSC ATAC-Seq libraries and untagmented DNA as seen by qPCR (n = 5, 3 biological replicates and two technical duplicates), two-tailed t-test, error bars = ± SD. (E) Representative picture of a ready to sequence ATAC-seq library from a single myofiber after size selection, visualized on an agarose gel. (F) qPCR for the TSS of MyoD compared with a negative control region of Chromosome 17 qE5 for the ATAC-Seq libraries prepared from single myofibers (n = 3, biological triplicates), two-tailed t-test, error bars = ± SD.
Figure 2 with 3 supplements
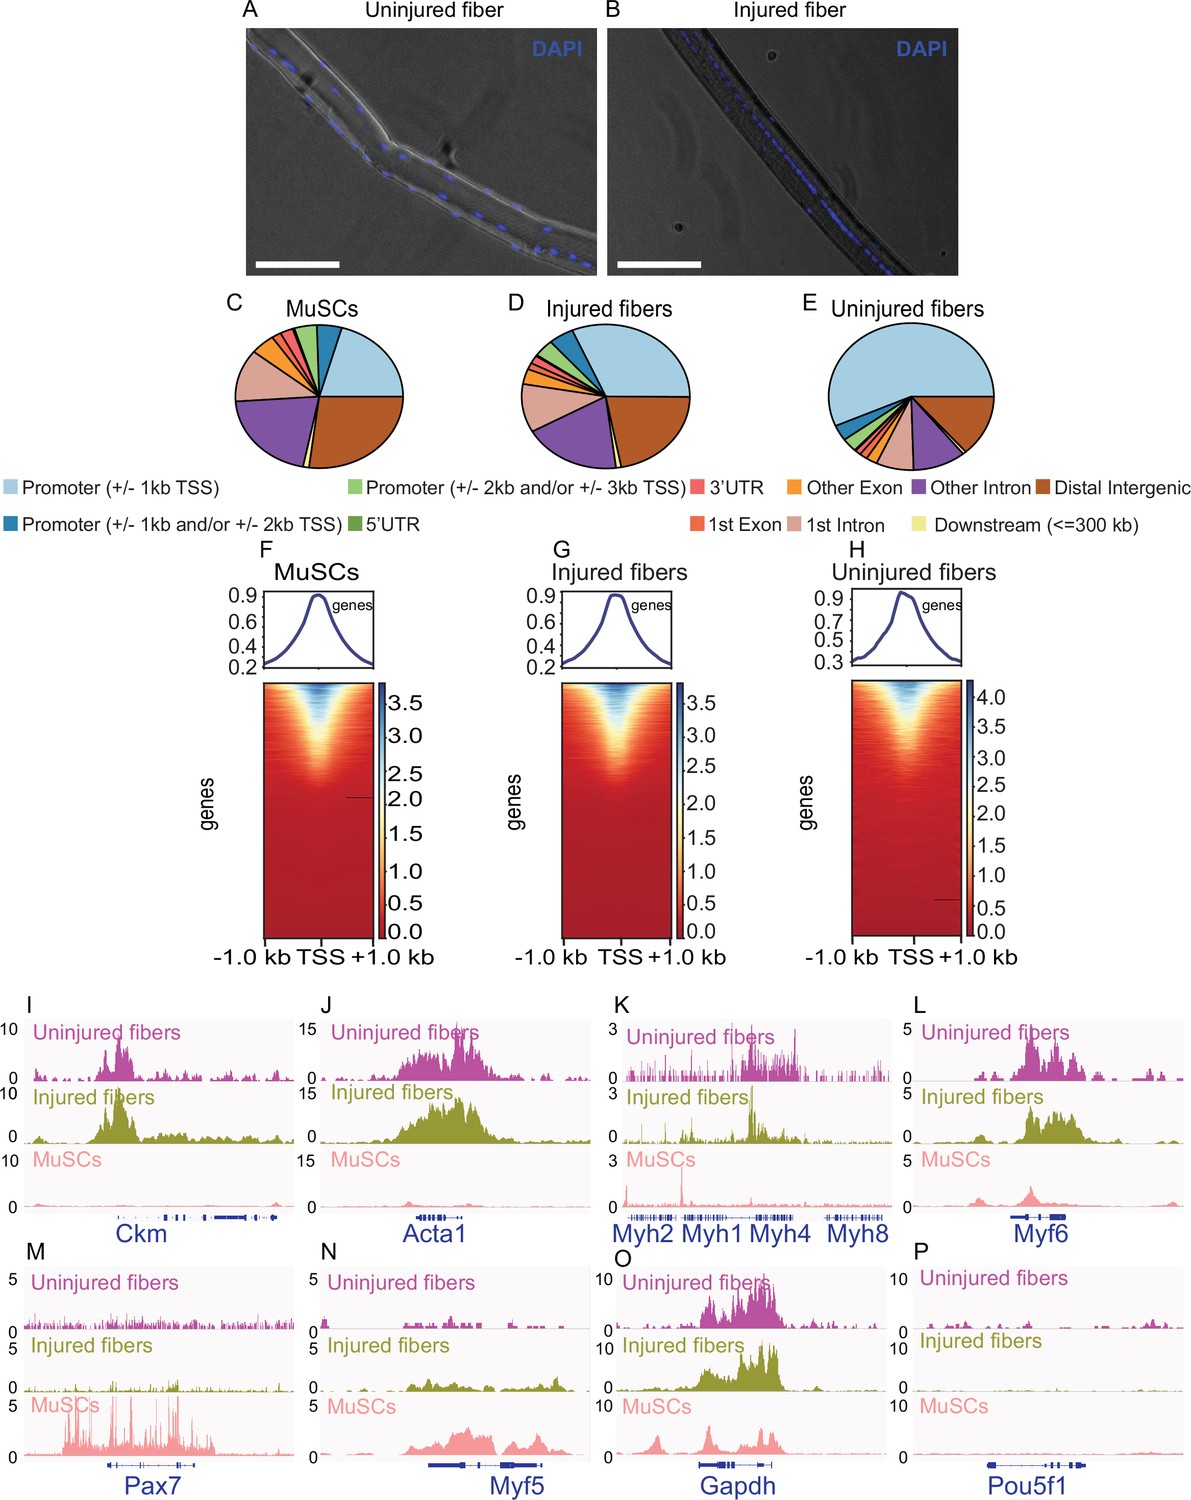
smfATAC-Seq can effectively identify the accessible regions on a single myofiber.
(A) Representative picture of an isolated WT C57BL/6 J uninjured myofiber stained for Hoechst showing the presence and location of myonuclei. Scale bar = 50 µm. (B) Representative picture of an isolated WT C57BL/6 J injured myofiber (7 days post cardiotoxin induced injury) stained for Hoechst showing centrally located myonuclei as a marker of a regenerating fiber. Scale bar = 50 µm. Hoechst stain was visualized on the DAPI channel. (C–E) Peak annotation pie charts for ATAC-Seq peaks of MuSCs, injured myofibers and uninjured myofibers, respectively. (F–H) Heatmaps showing enrichment at transcription start site (TSS) for the ATAC-Seq libraries of MuSCs, injured myofibers and uninjured myofibers, respectively. (I–P) IGV snapshots of known genes expressed in muscle fiber and/or MuSCs displaying accessibility on their respective TSS. (I) The muscle creatine kinase (Ckm). (J) Actin alpha 1 (Acta1). (K) Part of the myosin heavy chain (Myh) gene cluster. (L) Myogenic factor 6 (Myf6). (M) Paired Box 7 (Pax7). (N) Myogenic factor 5 (Myf5). (O) Housekeeping gene Gapdh. (P) POU Class 5 homeobox 1 (Pou5f1) as a negative control. *ATAC-Seq was performed in biological replicates (n = 3 MuSCs, n = 3 injured myofibers, n = 2 uninjured myofibers).
Figure 2—figure supplement 1
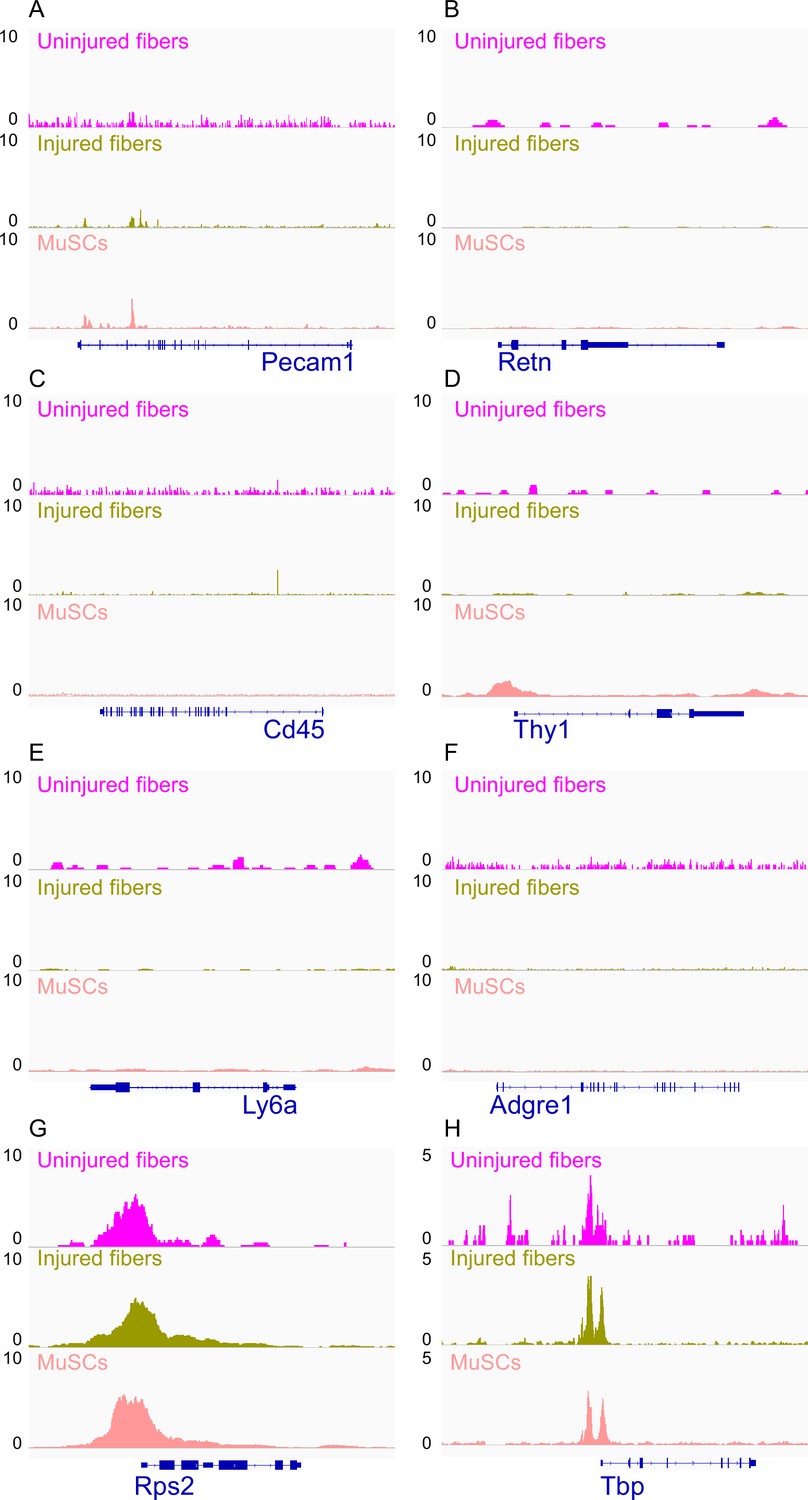
IGV snapshots of non-myogenic genes.
(A) Platelet and Endothelial Cell Adhesion Molecule 1 (Pecam1) expressed in endothelial cells. (B) Resistin (Retn) as a marker of adipocytes. (C) CD45 expressed in hematopoietic cells. (D) CD90 (Thy1) expressed in fibroblasts. (E) Lymphocyte antigen 6 a (Ly6a) expressed in fibro/adipogenic progenitors (FAPs). (F) Adhesion G-protein-coupled receptor E1 (ADGRE1) gene expressed in macrophages. (G) The housekeeping gene RPS2 used as a positive control. (H) Housekeeping gene TATA-Box Binding protein (Tbp) used as a positive control. *ATAC-Seq was performed in biological replicates; (n = 3 MuSCs, n = 3 injured myofibers, n = 2 uninjured myofibers).
Figure 2—figure supplement 2
Correlation analysis between biological replicates of each condition.
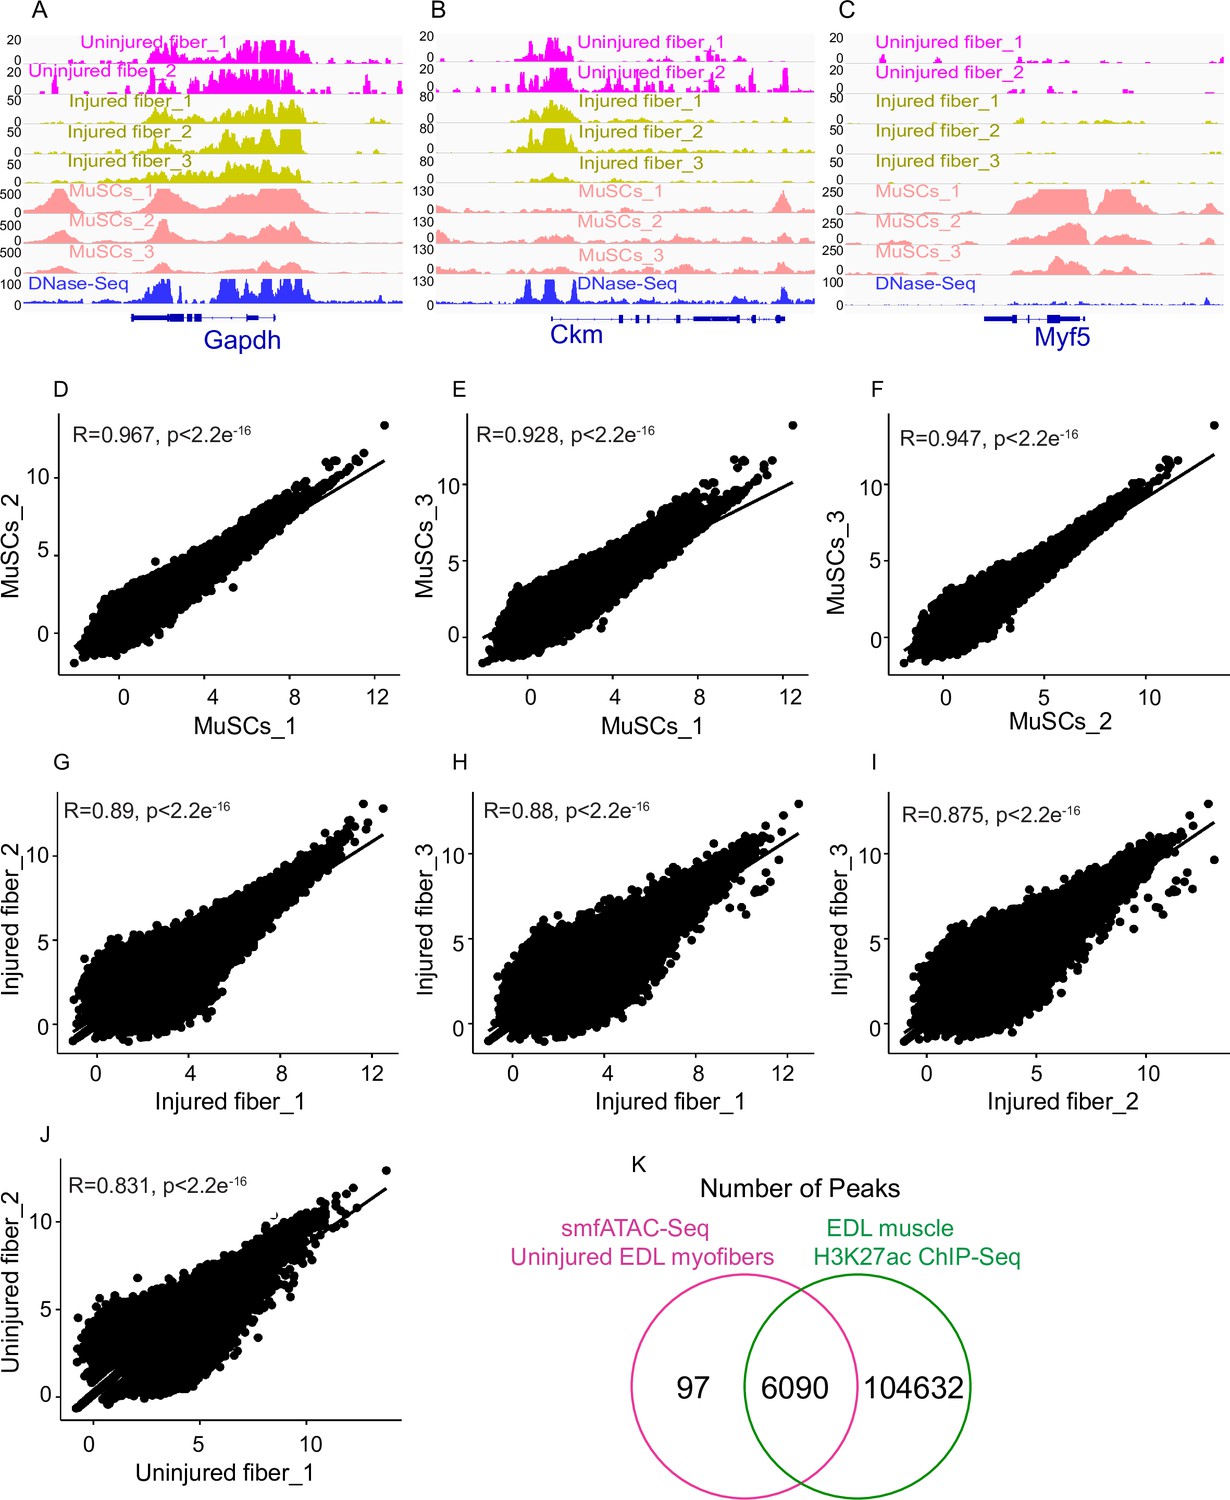
(A–C) IGV snapshots of genes expressed in myofibers and MuSCs for all the replicates of each condition that were pooled together for further analysis. DNase-Seq track added to demonstrate correlation of the myofiber ATAC-Seq with previously performed DNase-Seq on skeletal muscle. (A) Housekeeping gene Gapdh. (B) The muscle creatine kinase (Ckm). (C) Myogenic Factor 5 (Myf5). (D–J) Scatter plot showing the Pearson correlation between the replicates. (K) Venn diagram of the number of smfATAC-Seq peaks that are unique or overlapping with the peaks from ChIP-Seq of H3K27ac performed on EDL muscle. *ATAC-Seq was performed in biological replicates; (n = 3 MuSCs, n = 3 injured myofibers, n = 2 uninjured myofibers). ** The ChIP-Seq data was retrieved from “Dynamic enhancers control skeletal muscle identity and reprogramming, Ramachandran et al., 2019.” (Ramachandran et al., 2019). This data is accessible through the GEO accession numbers GSM3515022 and GSM3515023.
Figure 2—figure supplement 3
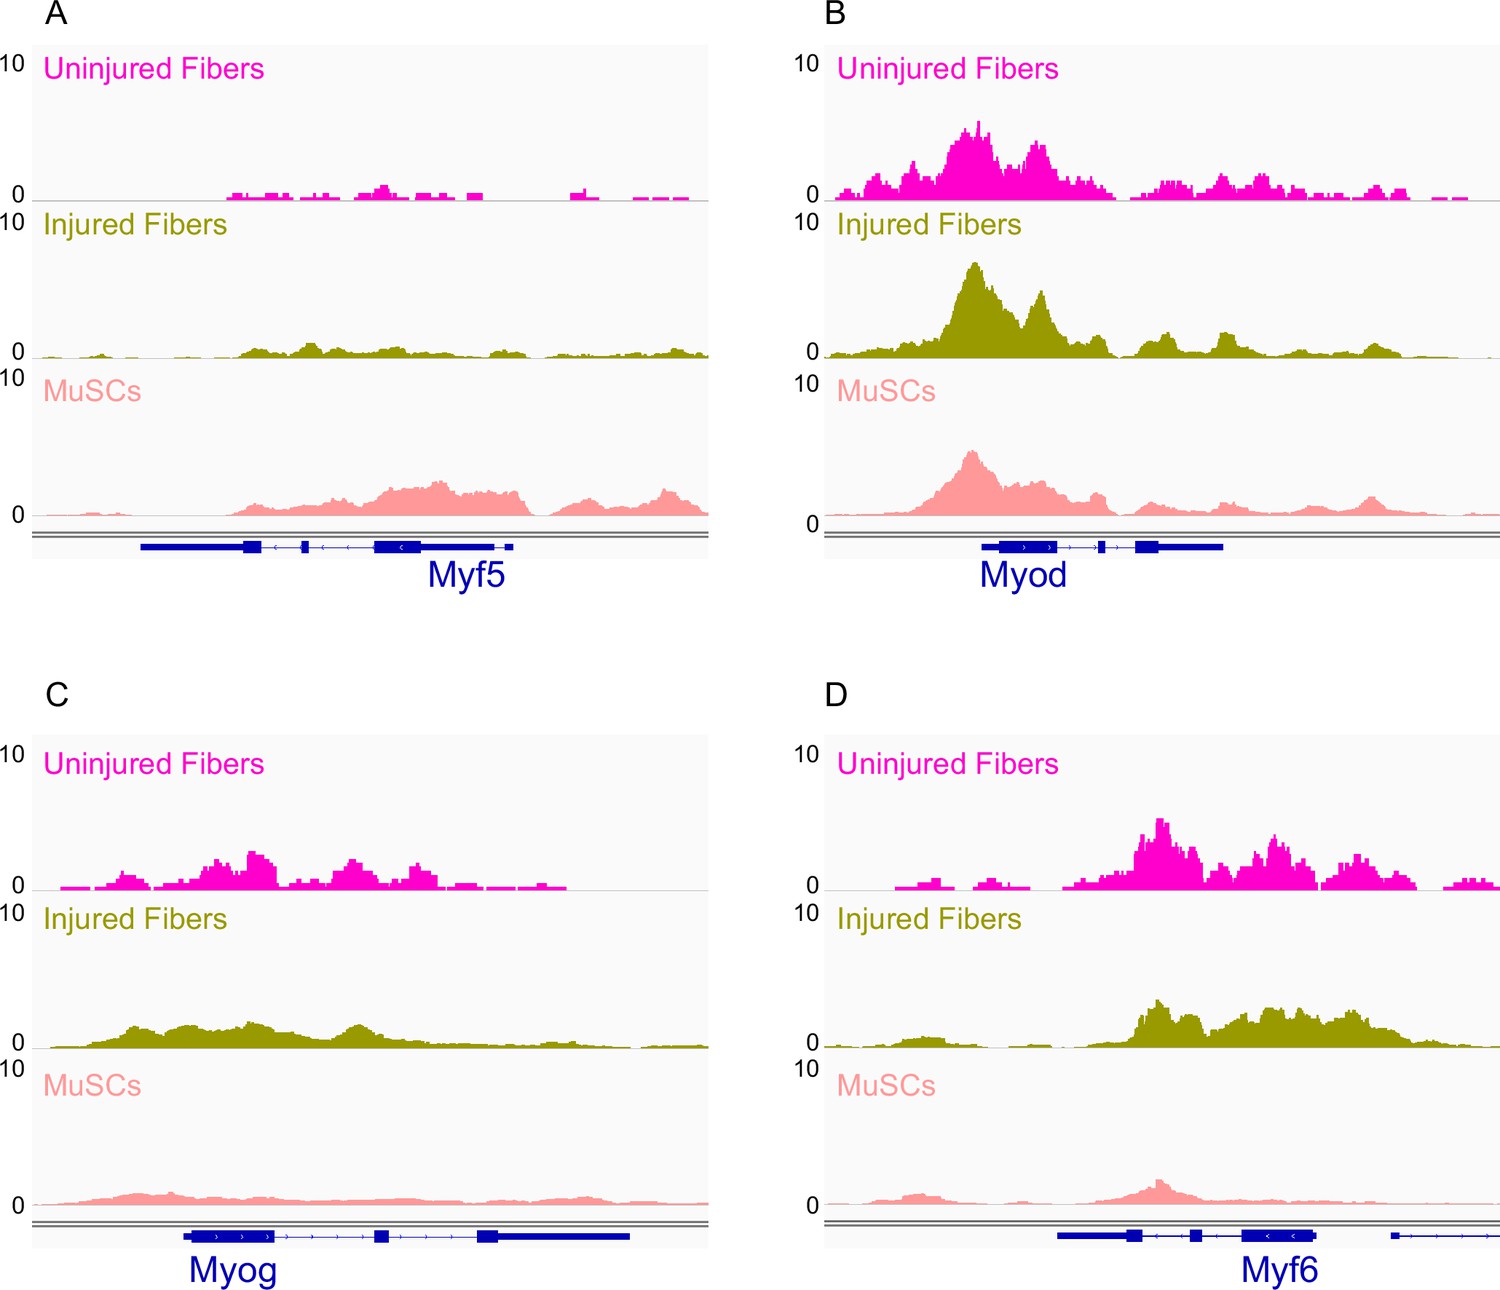
IGV snapshots of Myogenic Regulatory Factors (MRFs).
(A) Myogenic Factor 5 (Myf5). (B) MyoD. (C) Myogenin (Myog). (D) Myogenic factor 6 (Myf6). *ATAC-Seq was performed in biological replicates (n = 3 MuSCs, n = 3 injured myofibers, n = 2 uninjured myofibers).
Figure 3 with 3 supplements
Uninjured and injured myofibers and MuSCs display distinct chromatin states.
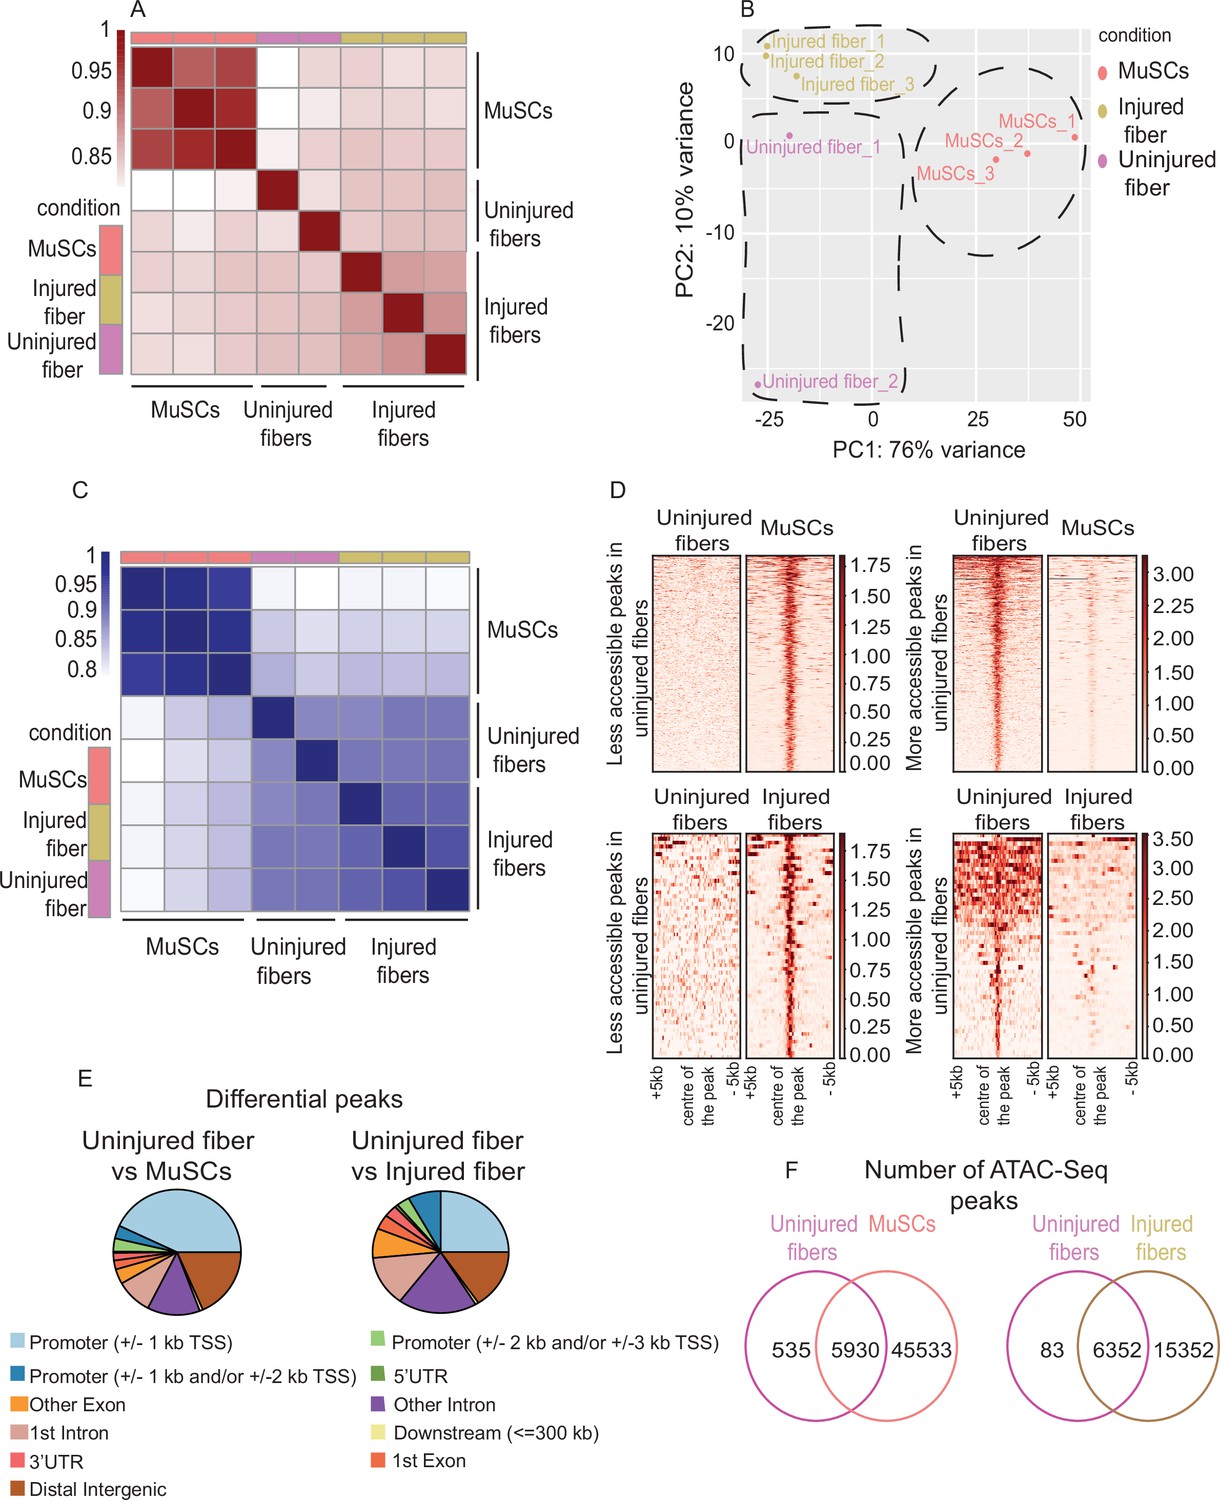
(A) Heatmap clustering of Pearson correlation coefficients showing the correlation between the replicates of the conditions in the regions defined by the union peakset (merged peaks of all replicates/samples). (B) Projection of samples along the first two principal components found by PCA showing the separate clustering of different samples and the clustering of each replicate of the same condition together. (C) Heatmap clustering of Pearson correlation coefficients indicating the correlation between the replicates in the regions defined by the consensus peakset derived from the uninjured myofibers, injured myofibers and MuSCs. (D) Pile-up analysis of differentially accessible peaks between uninjured myofibers and MuSCs and between injured myofibers and uninjured myofibers. Less accessible peaks: FDR < 0.05 and LFC < 0.5. More accessible peaks: FDR < 0.05 and LFC > 2. (E) Peak annotation pie charts for the differentially accessible peaks between uninjured myofibers vs MuSCs and uninjured myofibers vs injured myofibers. (F) Venn diagram of the number of ATAC-Seq peaks that are unique or overlapping between uninjured myofibers vs MuSCs and uninjured myofibers vs injured myofibers. *ATAC-Seq was performed in biological replicates (n = 3 MuSCs, n = 3 injured myofibers, n = 2 uninjured myofibers).
Figure 3—figure supplement 1
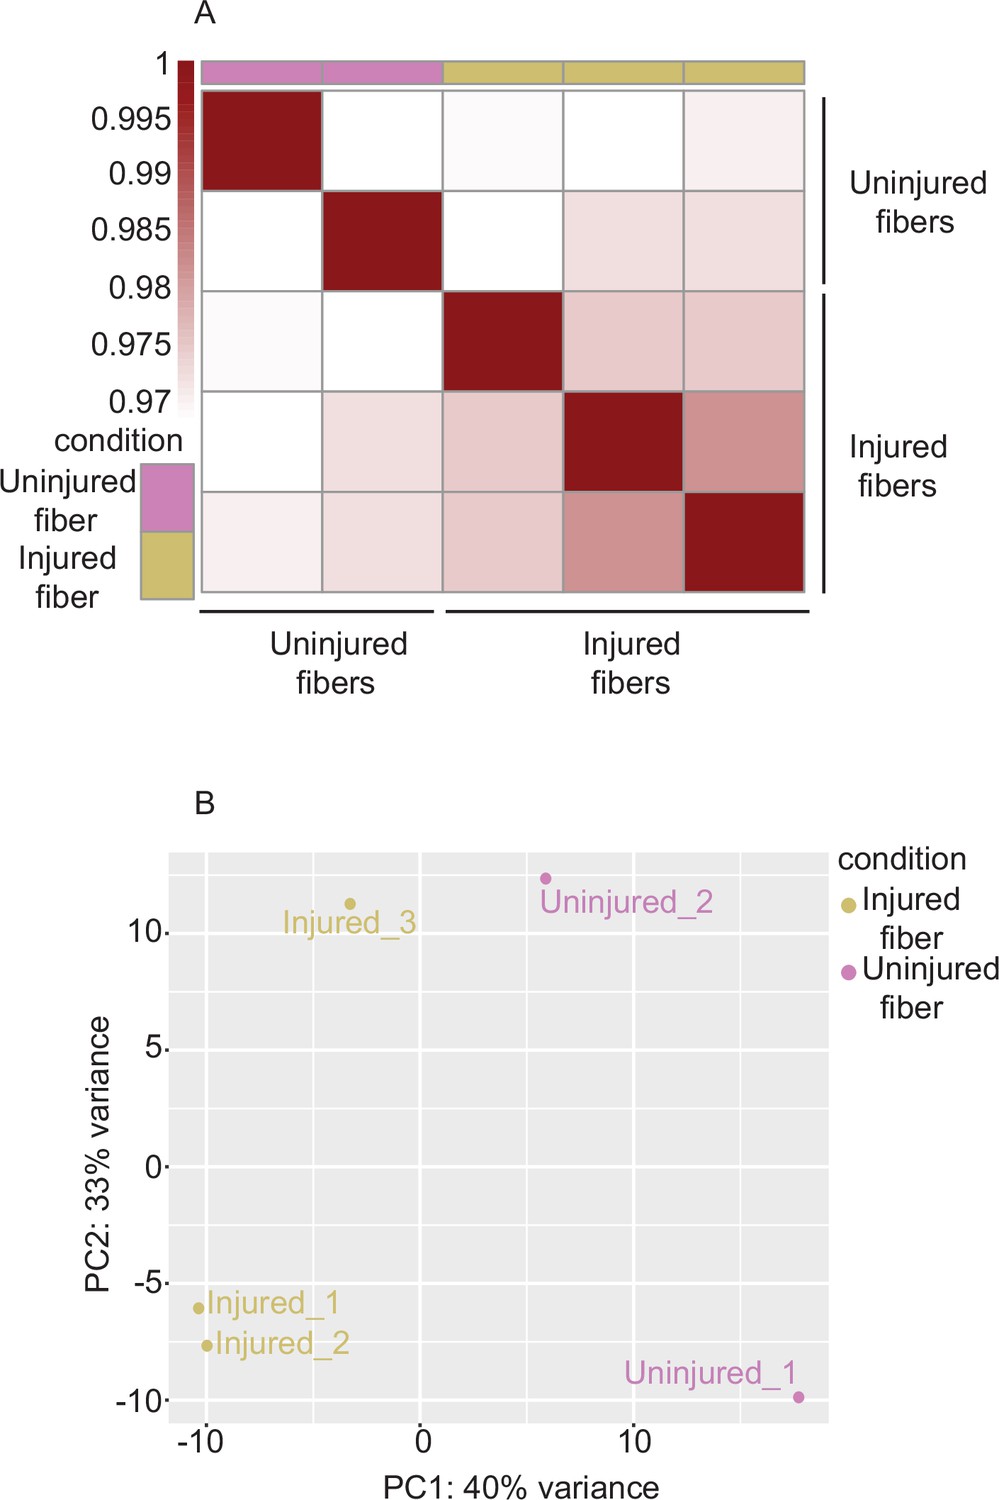
Correlation analysis between uninjured and injured myofibers only.
(A) Heatmap clustering of Pearson correlation coefficients showing the correlation between the replicates of the injured and uninjured conditions in the regions defined by the union peakset (merged peaks of all replicates/samples). (B) Projection of the myofiber samples along first two principal components found by PCA showing the separate clustering of injured and uninjured myofibers. *ATAC-Seq was performed in biological replicates (n = 3 MuSCs, n = 3 injured myofibers, n = 2 uninjured myofibers).
Figure 3—figure supplement 2
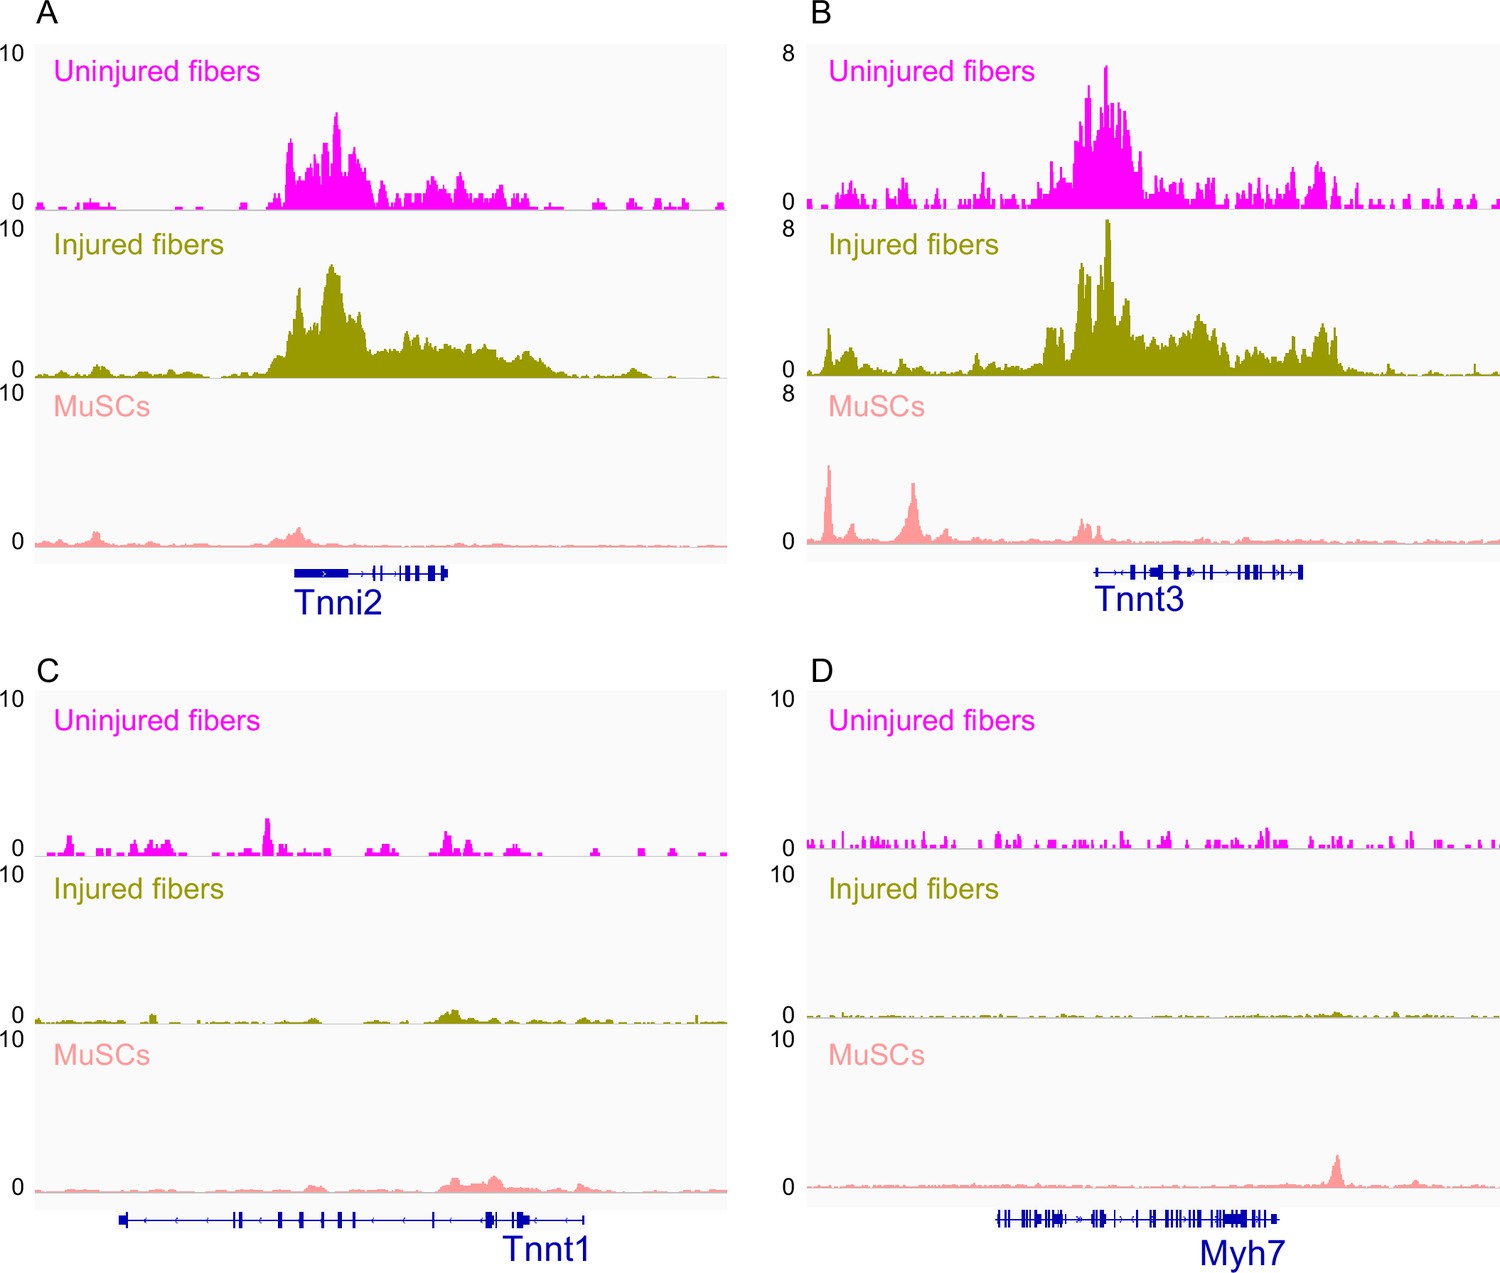
IGV snapshots of genes expressed in fast and slow muscle fiber types.
(A) Troponin I2 (Tnni2) expressed in fast skeletal muscle fiber. (B) Troponin T3 (Tnnt3) expressed in fast skeletal muscle fiber. (C) Troponin T1 (Tnnt1) expressed in slow skeletal muscle fibers. (D) Myosin heavy chain 7 (Myh7) expressed in slow skeletal muscle fibers. *ATAC-Seq was performed in biological replicates; (n = 3 MuSCs, n = 3 injured myofibers, n = 2 uninjured myofibers).
Figure 3—figure supplement 3
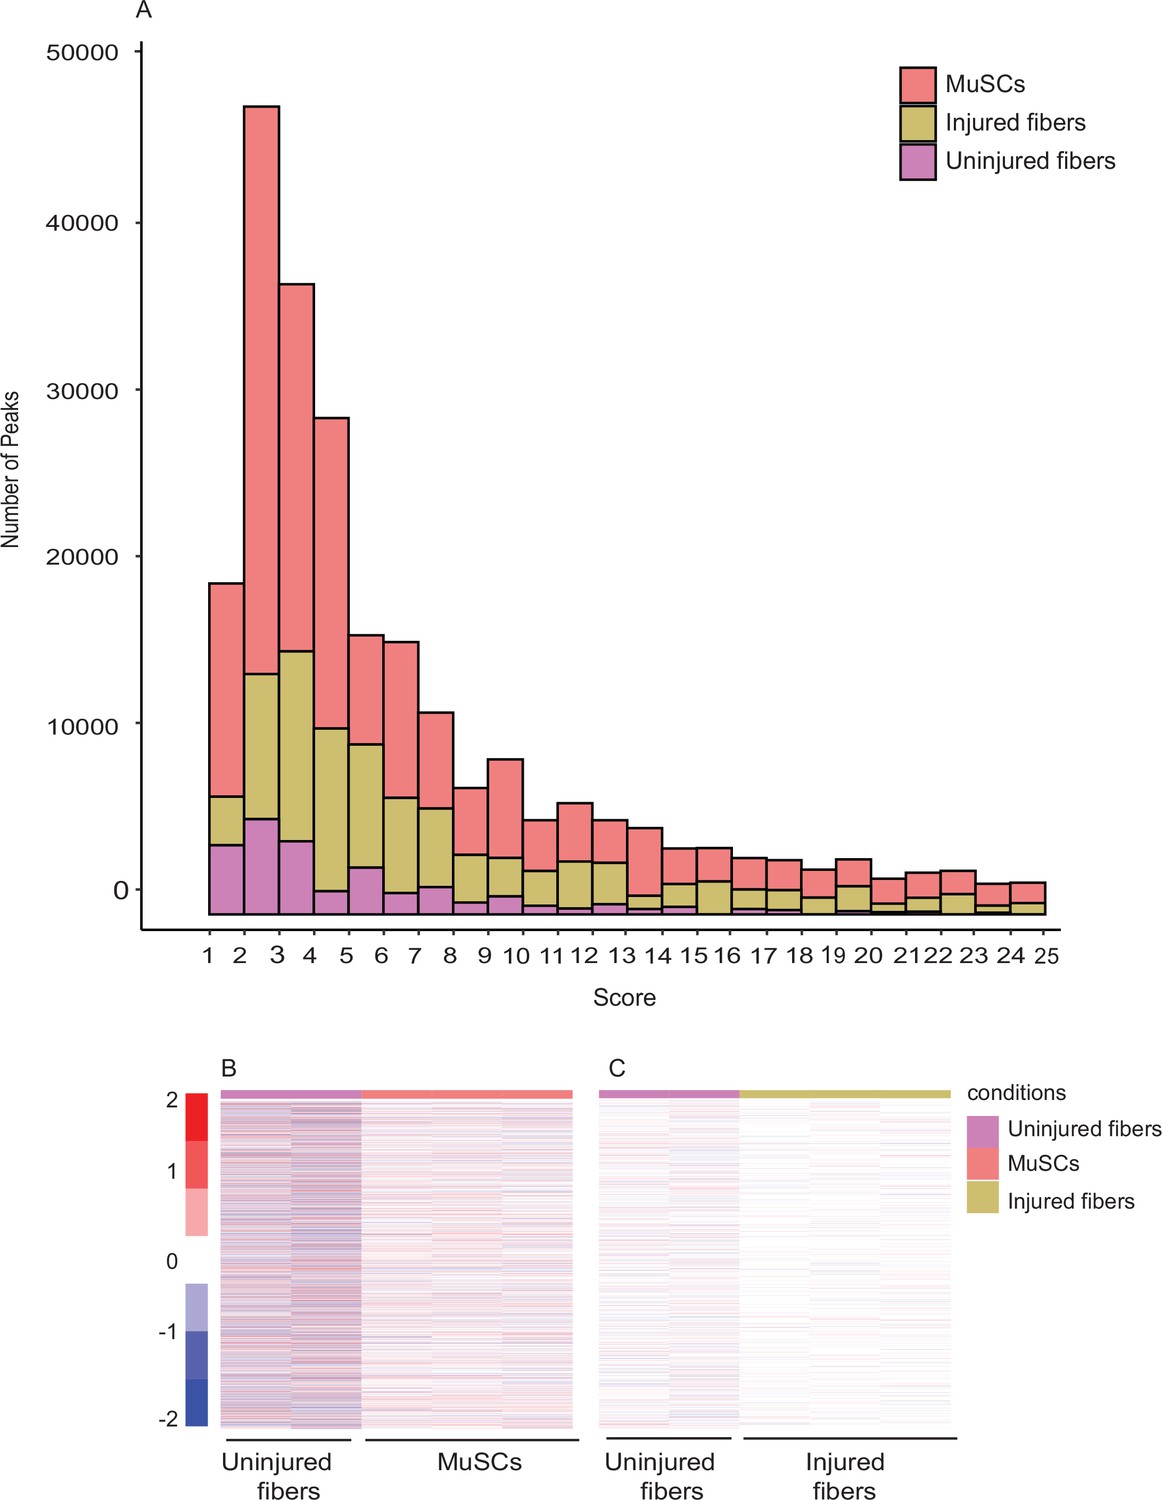
Unique peaks between different conditions indicate a distinct chromatin state for each cell type.
(A Peak score distribution (calculated by MACS2 peak calling algorithm)) for each of the different conditions. Peak score = -log10 (FDR). (B) Heatmap showing the read count +/–500 bp of the center of unique peaks to MuSCs compared to uninjured myofibers. (C) Heatmap showing the read count +/–500 bp of the center of unique peaks to injured myofibers compared to uninjured myofibers. *ATAC-Seq was performed in biological replicates (n = 3 MuSCs, n = 3 injured myofibers, n = 2 uninjured myofibers).
Figure 4 with 2 supplements
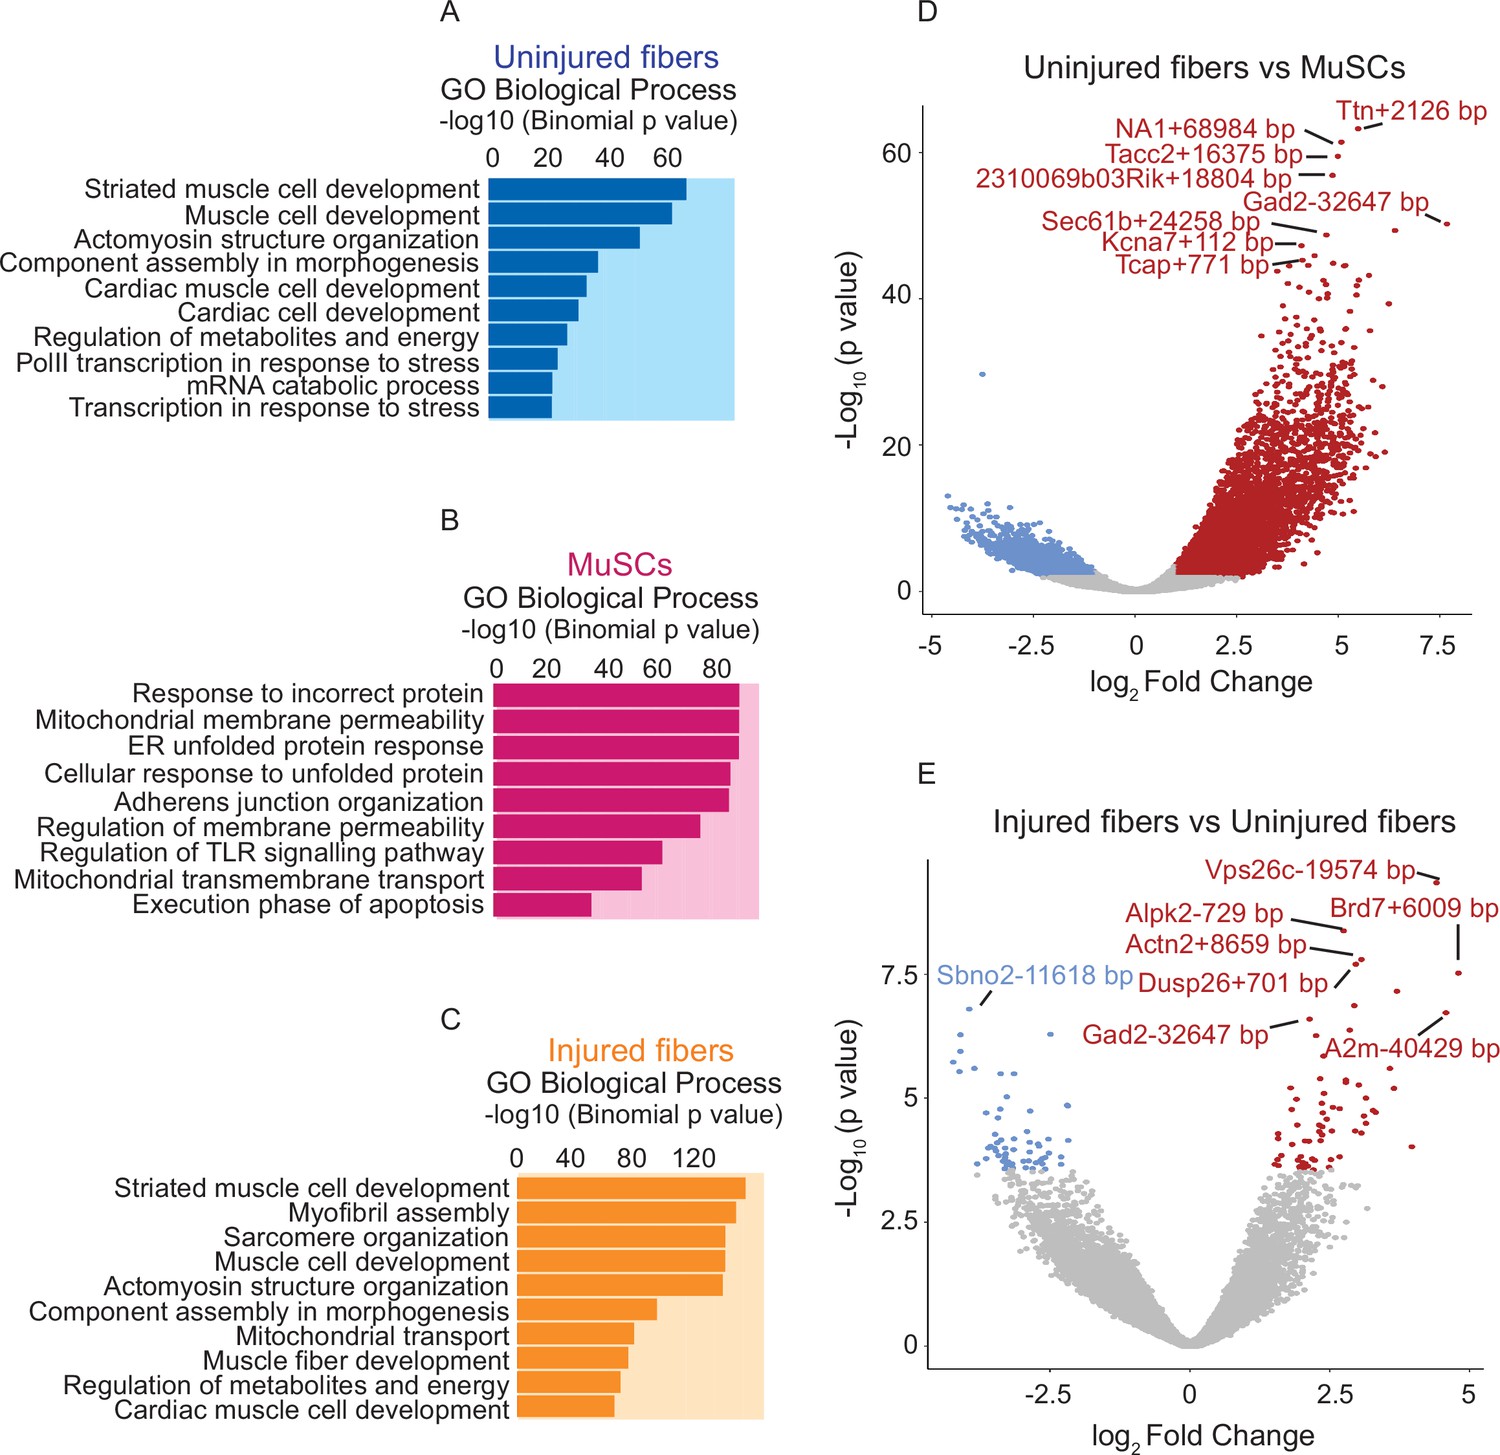
Comparative analysis of chromatin state between uninjured myofibers and MuSCs and between uninjured myofibers and injured myofibers.
(A–C) Gene Ontology (GO Biological Process) analysis of genes associated with ATAC-Seq peaks based on association by proximity using Genomic Regions Enrichment of Annotations Tool (GREAT) (McLean et al., 2010) for all peaks present in the uninjured myofibers, MuSCs and injured myofibers, respectively. (D) Volcano plot of differentially accessible regions/peaks identified by FDR < 0.05 and LFC ≥ 1 between uninjured myofibers and MuSCs. Each dot represents a differentially accessible region/peak and the distance to the nearest gene is annotated. (E) Volcano plot of differentially accessible regions/peaks identified by FDR < 0.05 and LFC ≥ 1 between uninjured myofibers and injured myofibers. Each coloured dot represents a differentially accessible region/peak and the distance to the nearest gene is annotated. *ATAC-Seq was performed in biological replicates (n = 3 MuSCs, n = 3 injured myofibers, n = 2 uninjured myofibers).
Figure 4—figure supplement 1
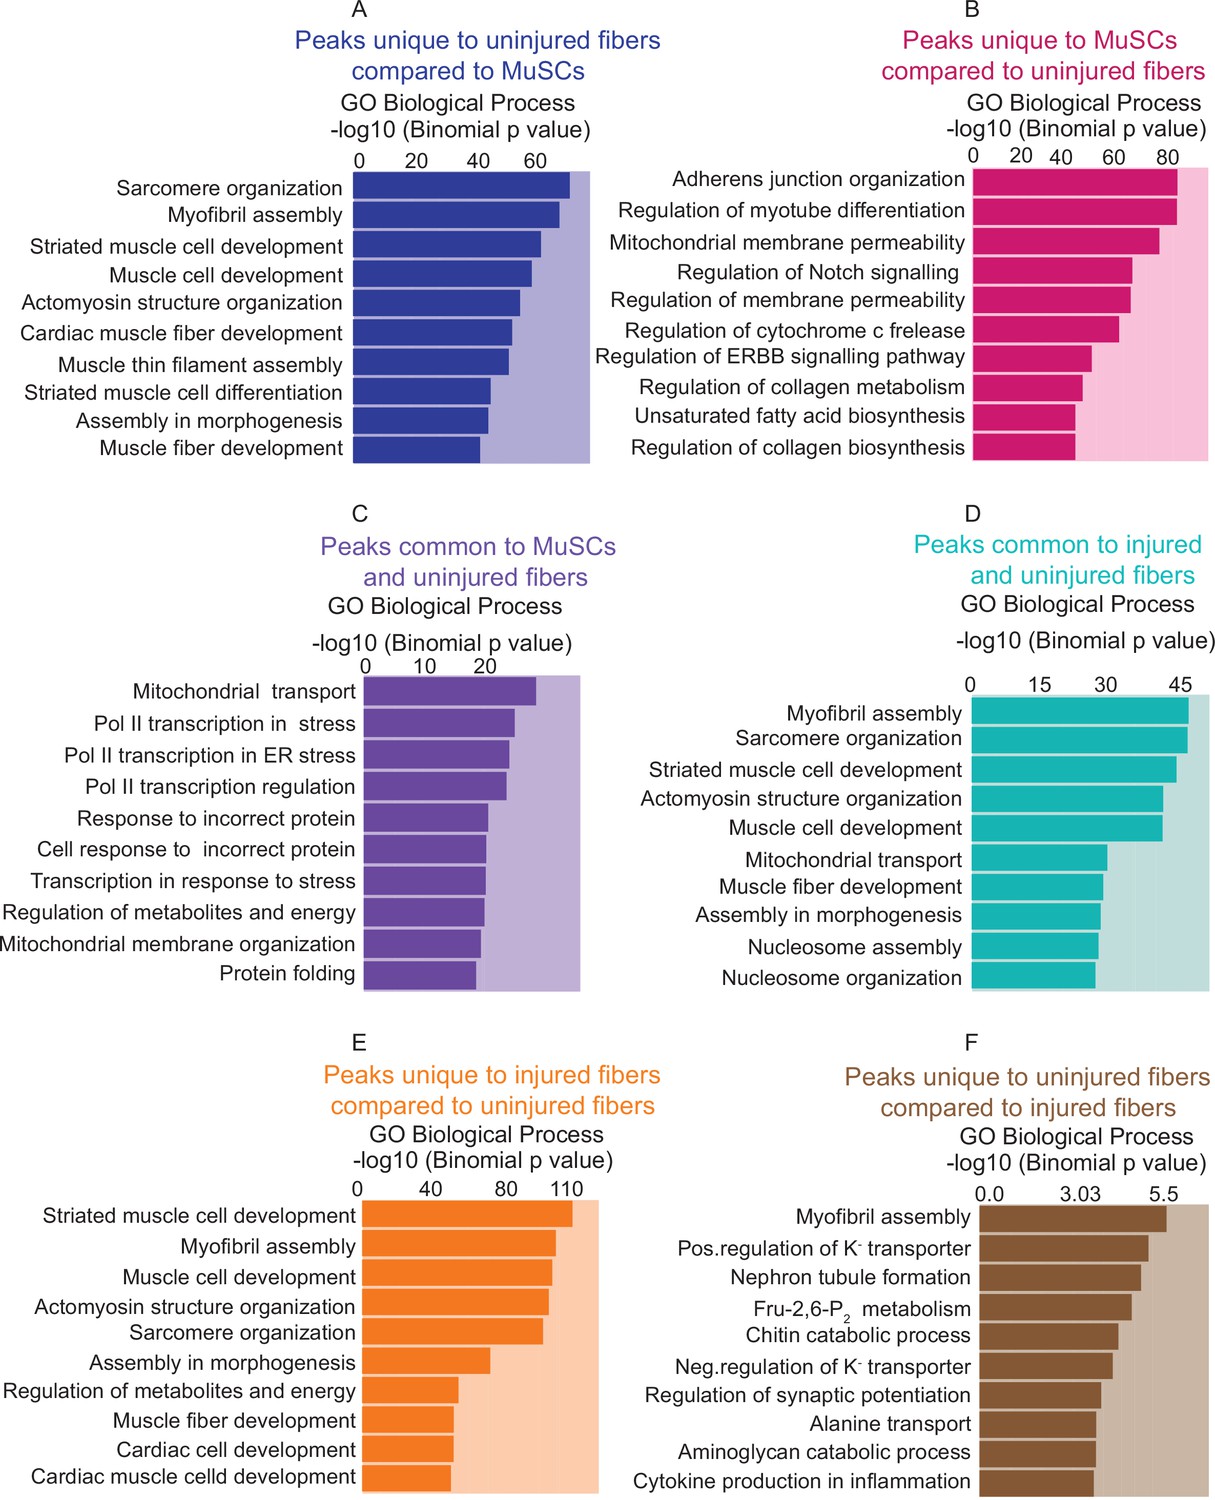
Gene Ontology analysis of unique and common peaks between conditions.
(A) Gene Ontology (GO Biological Process) analysis of genes associated with unique peaks present in the uninjured myofiber compared to MuSCs, based on the proximity of the peaks to the genes. (B) GO term analysis of genes associated with unique peaks in MuSCs compared to uninjured myofibers. (C) GO term analysis of genes associated with peaks that are common between MuSCs and uninjured myofibers. (D) GO term analysis of genes associated with peaks that are common between injured and uninjured myofibers. (E) GO term analysis of genes associated with unique peaks in injured myofibers compared to uninjured myofibers. (F) GO term analysis of genes associated with unique peaks in uninjured myofibers compared to injured myofibers. *ATAC-Seq was performed in biological replicates (n = 3 MuSCs, n = 3 injured myofibers, n = 2 uninjured myofibers).
Figure 4—figure supplement 2
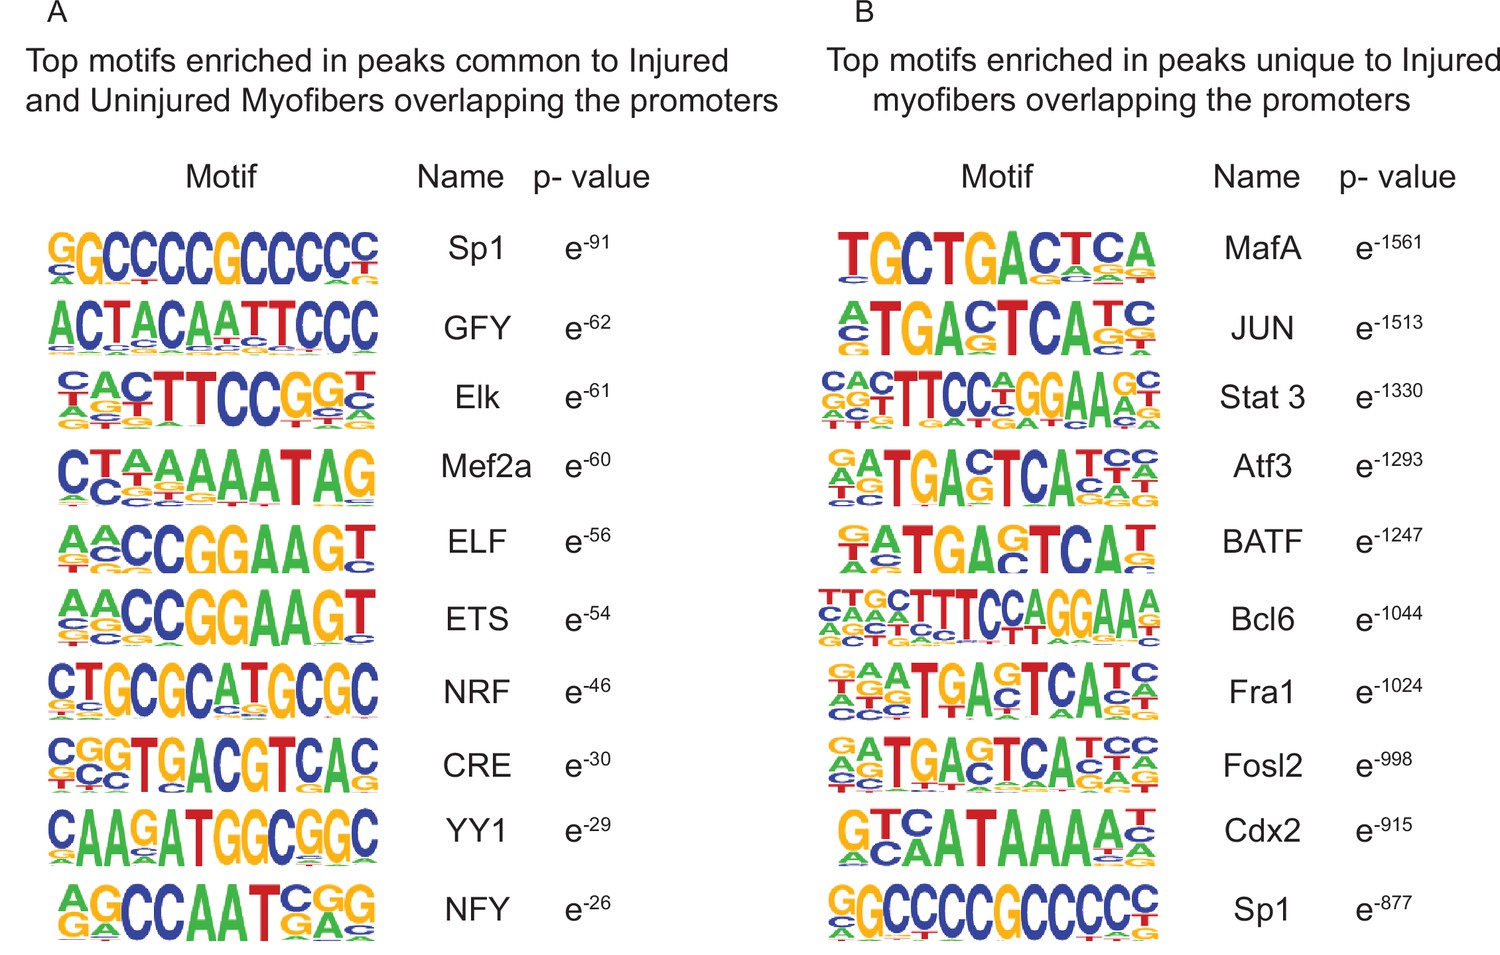
Top enriched motifs in the ATAC-Seq peaks of uninjured and injured myofibers.
(A) Top 10 significantly enriched motifs in the peaks that are common between uninjured and injured myofibers overlapping the promoters (±5 kb). (B) Top 10 significantly enriched motifs in the peaks that are unique to injured myofibers overlapping the promoters (±5 kb).
Figure 5 with 1 supplement

Identification of cell type specific pathways by global analysis of chromatin accessibility.
(A) Gene Set Enrichment Analysis performed on genes nearest to the differentially accessible regions/peaks for uninjured myofibers compared to injured myofibers. Top 10 enriched pathways are shown although do not reach significance. (B) Gene Set Enrichment Analysis performed on genes nearest to the differentially accessible regions/peaks for uninjured fibers compared to MuSCs. Top 10 significantly enriched pathways are shown (FDR < 0.01). (C) Heatmap for genes involved in myogenesis based on read counts of MuSCs and uninjured fibers ±1 kb of the TSS of each gene in the myogenic pathway. (D) IGV snapshot of Tropomyosin 2 (Tpm2). (E) IGV snapshot of Glutathione Peroxidase 3 (Gpx3). *ATAC-Seq was performed in biological replicates (n = 3 MuSCs, n = 3 injured myofibers, n = 2 uninjured myofibers).
Figure 5—figure supplement 1
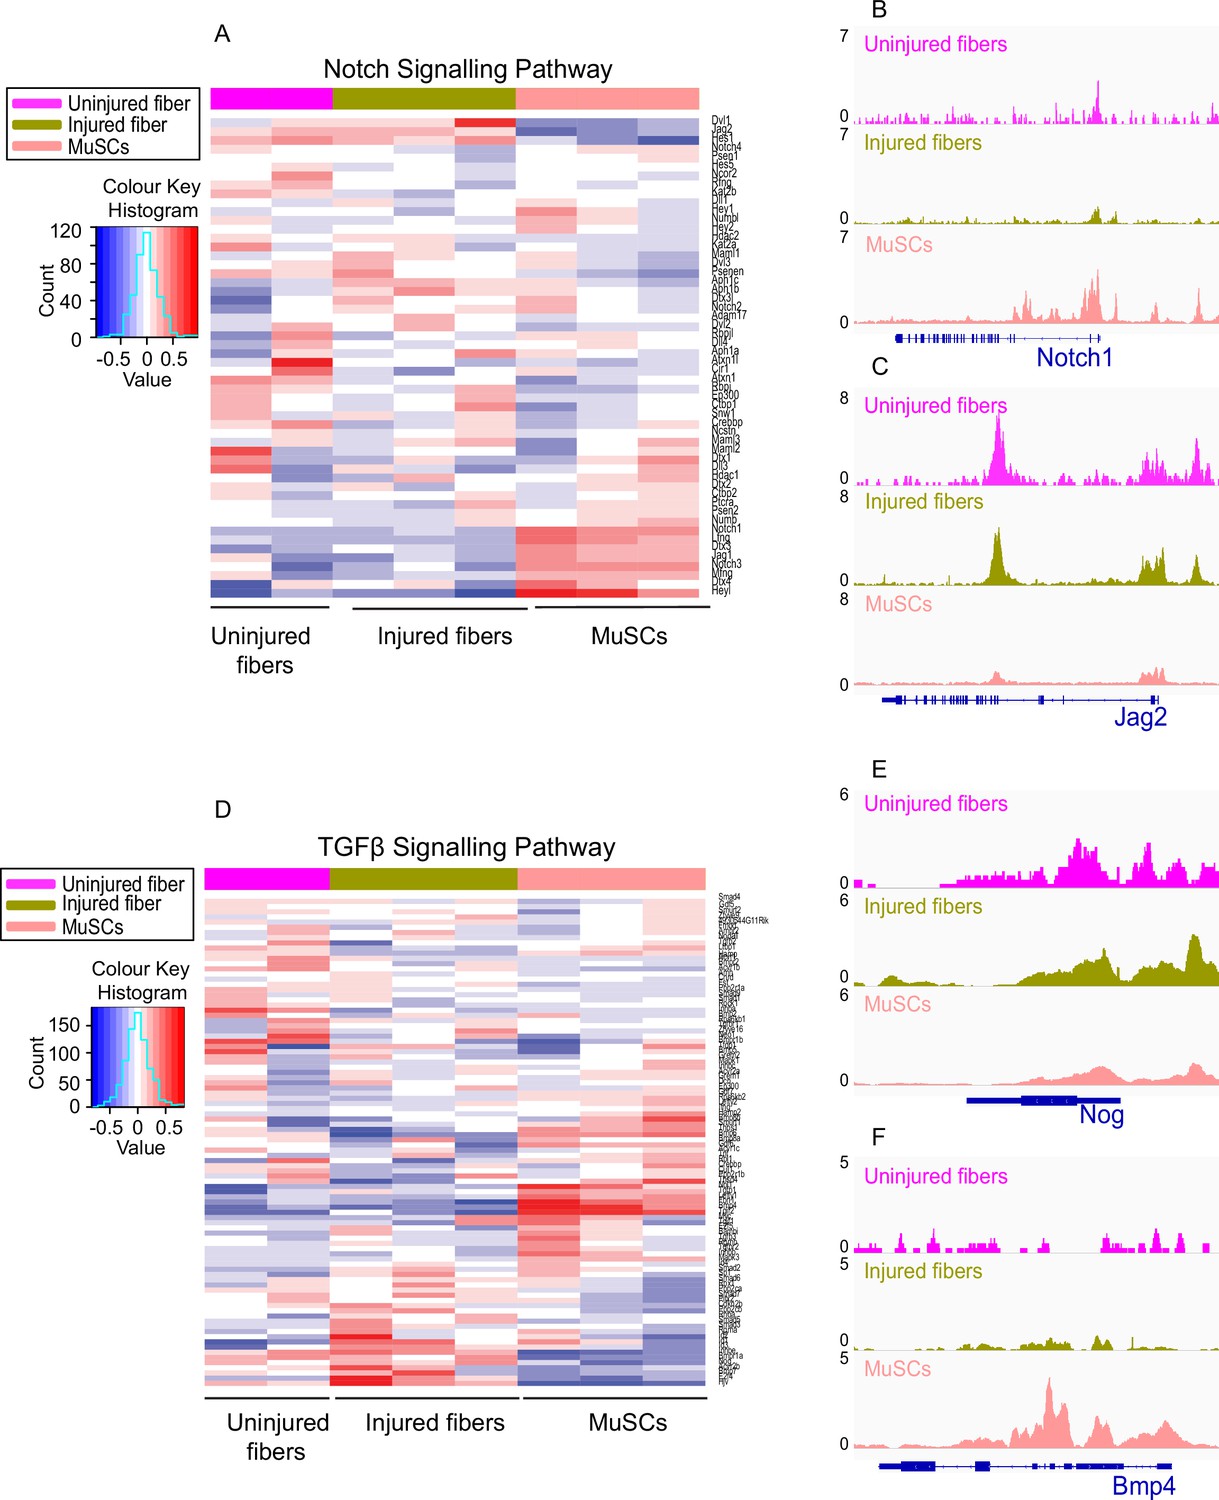
Analysis of Notch and TGFβ signalling pathways reveal differential accessibility between MuSCS and uninjured myofibers, and injured and uninjured myofibers.
(A) Heatmap showing genes involved in the Notch signalling pathway based on read counts of MuSCs, uninjured fibers and injured fibers,±1 kb of the TSS of each gene in the pathway. (B) IGV snapshot of Notch homolog 1 (Notch1). (C) IGV snapshot of Protein jagged 2 (Jag2). (D) Heatmap showing genes involved in the TGFβ signalling pathway based on read counts of MuSCs, uninjured fibers and injured fibers, ±1 kb of the TSS of each gene in the pathway. (E) IGV snapshot of Noggin (Nog). (F) IGV snapshot of Bone morphogenetic protein (Bmp4). *ATAC-Seq was performed in biological replicates (n = 3 MuSCs, n = 3 injured myofibers, n = 2 uninjured myofibers).
Figure 6 with 5 supplements

Comparative analysis of chromatin state between MDX and WT myofibers.
(A) Heatmaps showing enrichment at transcription start site (TSS) for the ATAC-Seq libraries of MDX and WT myofibers respectively. (B) Peak annotation pie charts for ATAC-Seq peaks of MDX and WT myofibers respectively. (C) Heatmap clustering of Pearson correlation coefficients showing the correlation between the replicates of the conditions in the regions defined by the union peakset (merged peaks of all replicates/samples). (D) Projection of samples along first two principal components found by PCA showing the separate clustering of different samples and the clustering of each replicate of the same condition together. (E) Pile-up analysis of differentially accessible peaks between WT and MDX myofibers. Less accessible regions: FDR < 0.05 and LFC < 0.5. More accessible peaks: FDR < 0.05 and LFC > 2. (F) Peak annotation pie charts for the differentially accessible peaks between WT and MDX myofibers. (G) Venn diagram of the number of ATAC-Seq peaks that are unique or overlapping between WT and MDX myofibers. (H) Gene Ontology (GO Biological Process) analysis of genes associated with unique peaks present in the MDX myofiber compared to WT myofibers, based on the proximity of the peaks to the genes. (I) Gene Ontology (GO Biological Process) analysis of genes associated with unique peaks present in the WT myofiber compared to MDX. *ATAC-Seq on the myofibers were performed in biological replicates (n = 3 MDX myofibers, n = 4 WT myofibers).
Figure 6—figure supplement 1
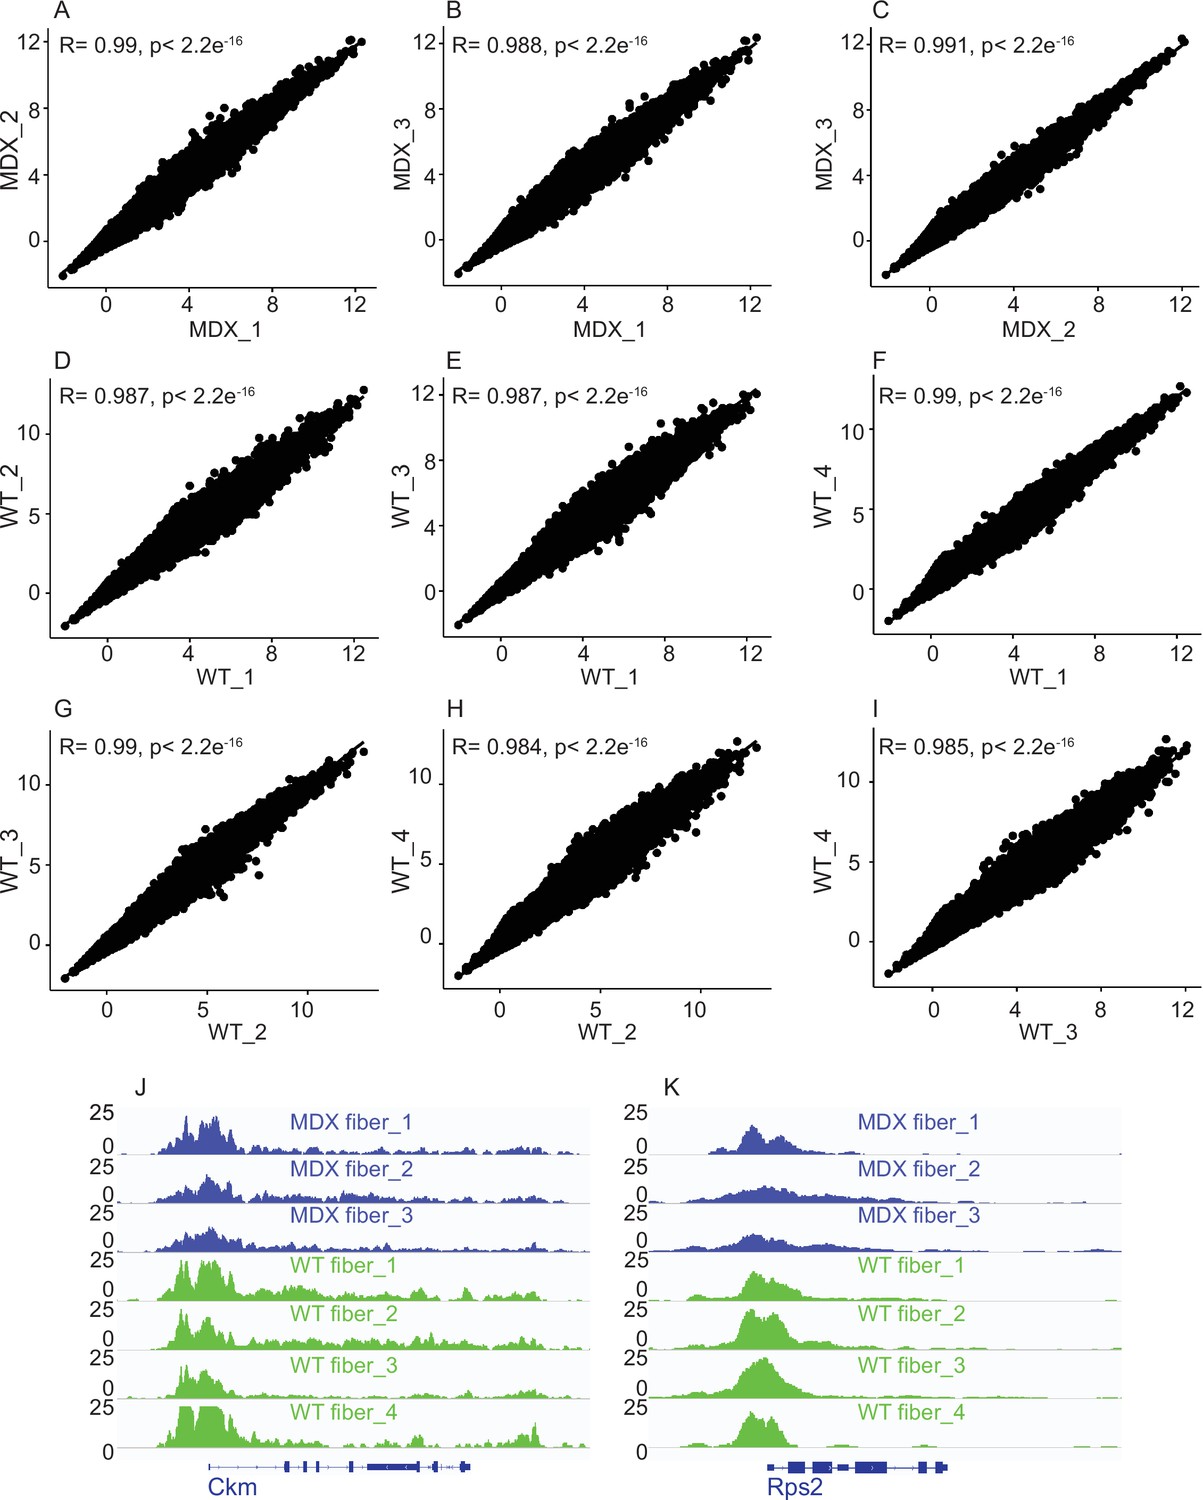
Correlation analysis between biological replicates of mdx and WT myofiber ATAC-Seq samples.
(A–I) Scatter plot showing the Pearson correlation between the replicates. (J,K) IGV snapshots of muscle creatine kinase (Ckm) and housekeeping gene Rps2 for all the replicates of each condition that were pooled together for further analysis. *ATAC-Seq on the myofibers were performed in biological replicates (n = 3 mdx myofibers, n = 4 WT myofibers).
Figure 6—figure supplement 2
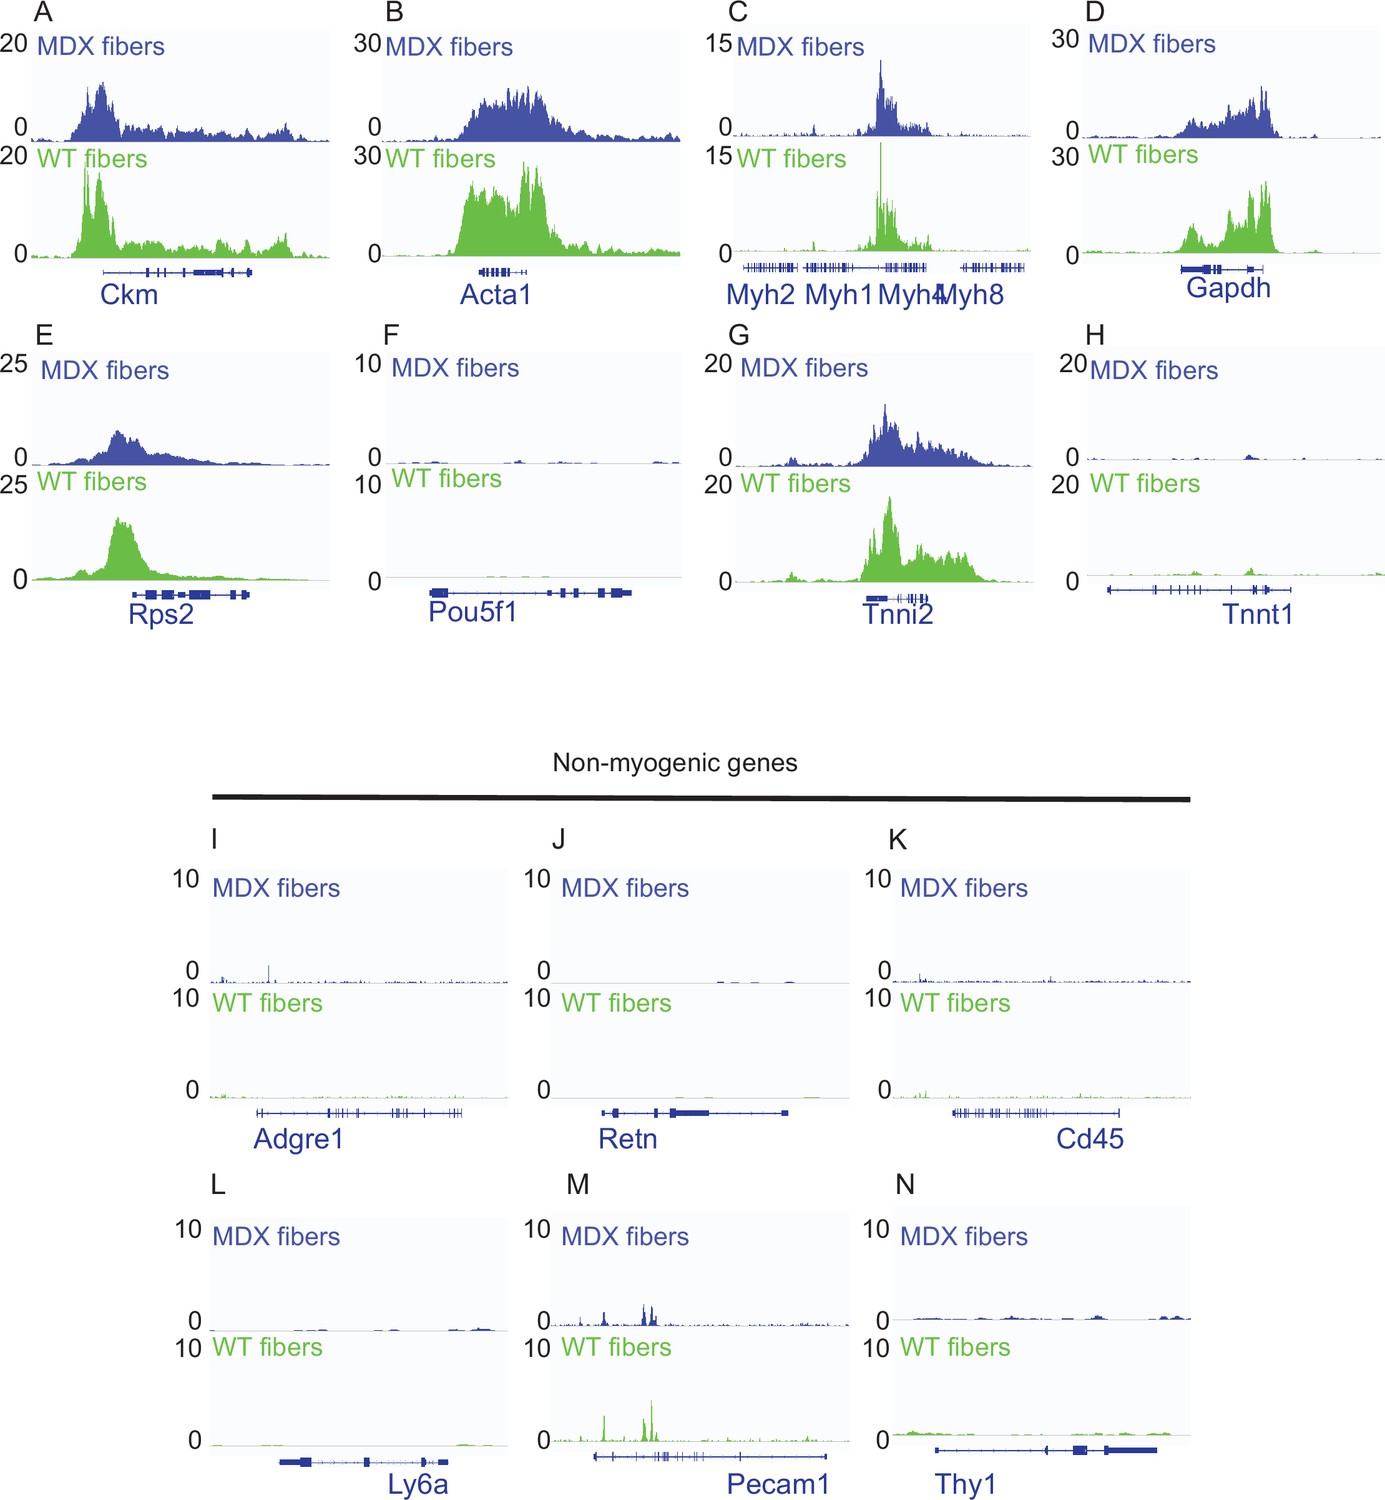
IGV snapshots of myogenic and non-myogenic genes for the quality control of mdx and WT smfATAC-Seq.
(A–F) IGV snapshots of genes known to expressed in muscle fiber displaying accessibility on their respective TSS. (A) The muscle creatine kinase (Ckm). (B) Actin alpha 1 (Acta1). (C) Part of the myosin heavy chain (Myh) gene cluster. (D) Housekeeping gene Gapdh. (E) Housekeeping gene Rps2. (F) POU Class 5 homeobox 1 (Pou5f1) as a negative control. (G–H) IGV snapshots of marker genes for fast and slow type myofibers. (G) Troponin I2 (Tnni2) expressed in fast skeletal muscle fiber. (H) Troponin T1 (Tnnt1) expressed in slow skeletal muscle fibers. (I–N) IGV snapshots of non-myogenic genes (I) Adhesion G protein-coupled receptor E1 (ADGRE1) gene expressed in macrophages. (J) Resistin (Retn) as a marker of adipocytes. (K) CD45 expressed in hematopoietic cells. (L) Lymphocyte antigen 6 a (Ly6a) expressed in fibro/adipogenic progenitors (FAPs). (M) Platelet and Endothelial Cell Adhesion Molecule 1 (Pecam1) expressed in endothelial cells. (N) CD90 (Thy1) expressed in fibroblasts. *ATAC-Seq on the myofibers were performed in biological replicates (n = 3 mdx myofibers, n = 4 WT myofibers).
Figure 6—figure supplement 3
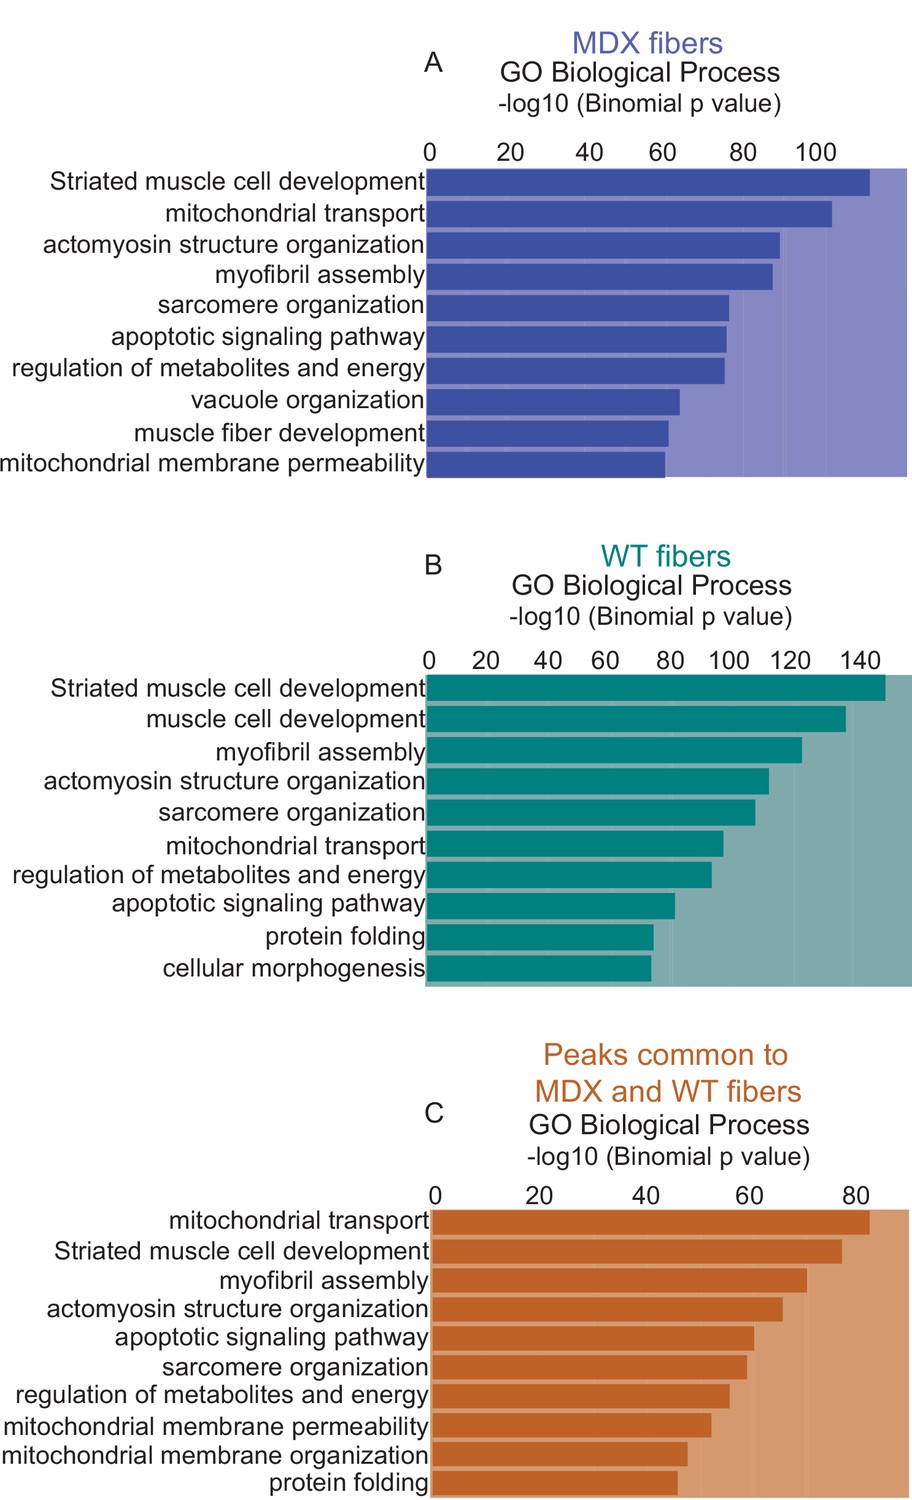
Gene Ontology analysis of total mdx and WT peaks.
(A) Gene Ontology (GO Biological Process) analysis of genes associated with all peaks present in the mdx myofiber, based on the proximity of the peaks to the genes. (B) GO term analysis of genes associated with all peaks present in the WT myofiber. (C) GO term analysis of genes associated with peaks that are common between mdx and WT myofibers. *ATAC-Seq on the myofibers were performed in biological replicates (n = 3 mdx myofibers, n = 4 WT myofibers).
Figure 6—figure supplement 4
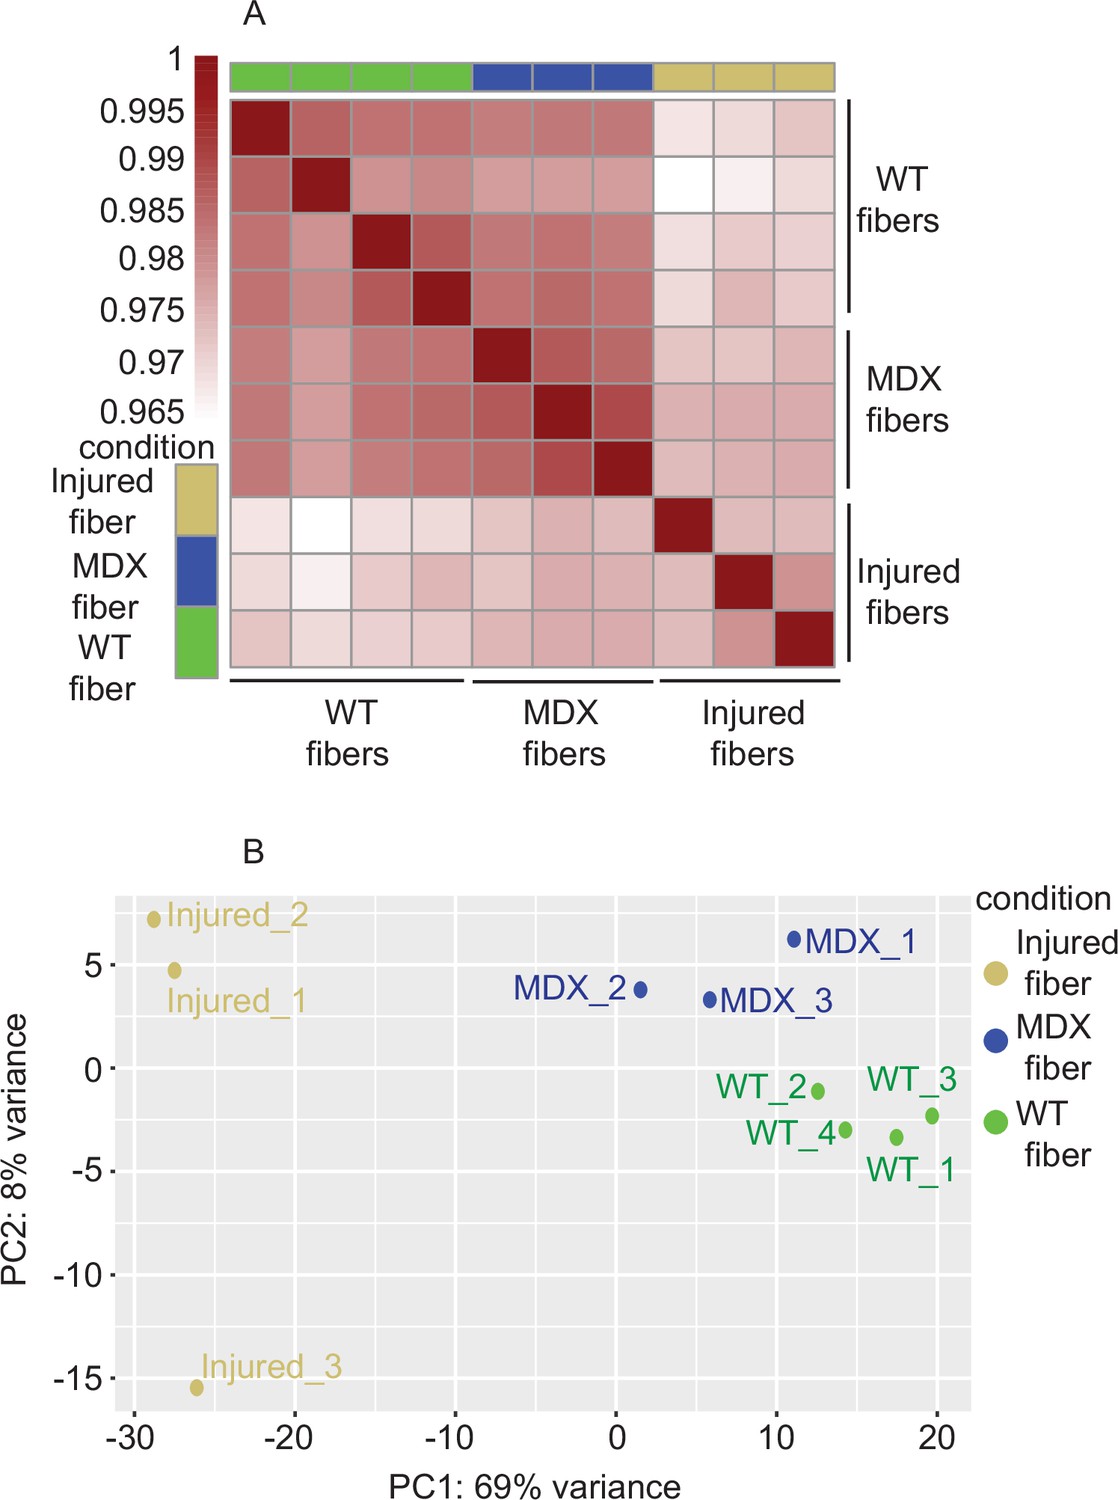
Correlation analysis between injured, mdx and WT myofibers.
(A) Heatmap clustering of Pearson correlation coefficients showing the correlation between the replicates of the conditions in the regions defined by the union peakset (merged peaks of all replicates/samples). (B) Projection of injured myofibers as well as the mdx and WT myofibers along the first two principal components found by PCA. *ATAC-Seq was performed in biological replicates (n = 3 injured myofibers, n = 3 mdx myofibers, n = 4 WT myofibers).
Figure 6—figure supplement 5
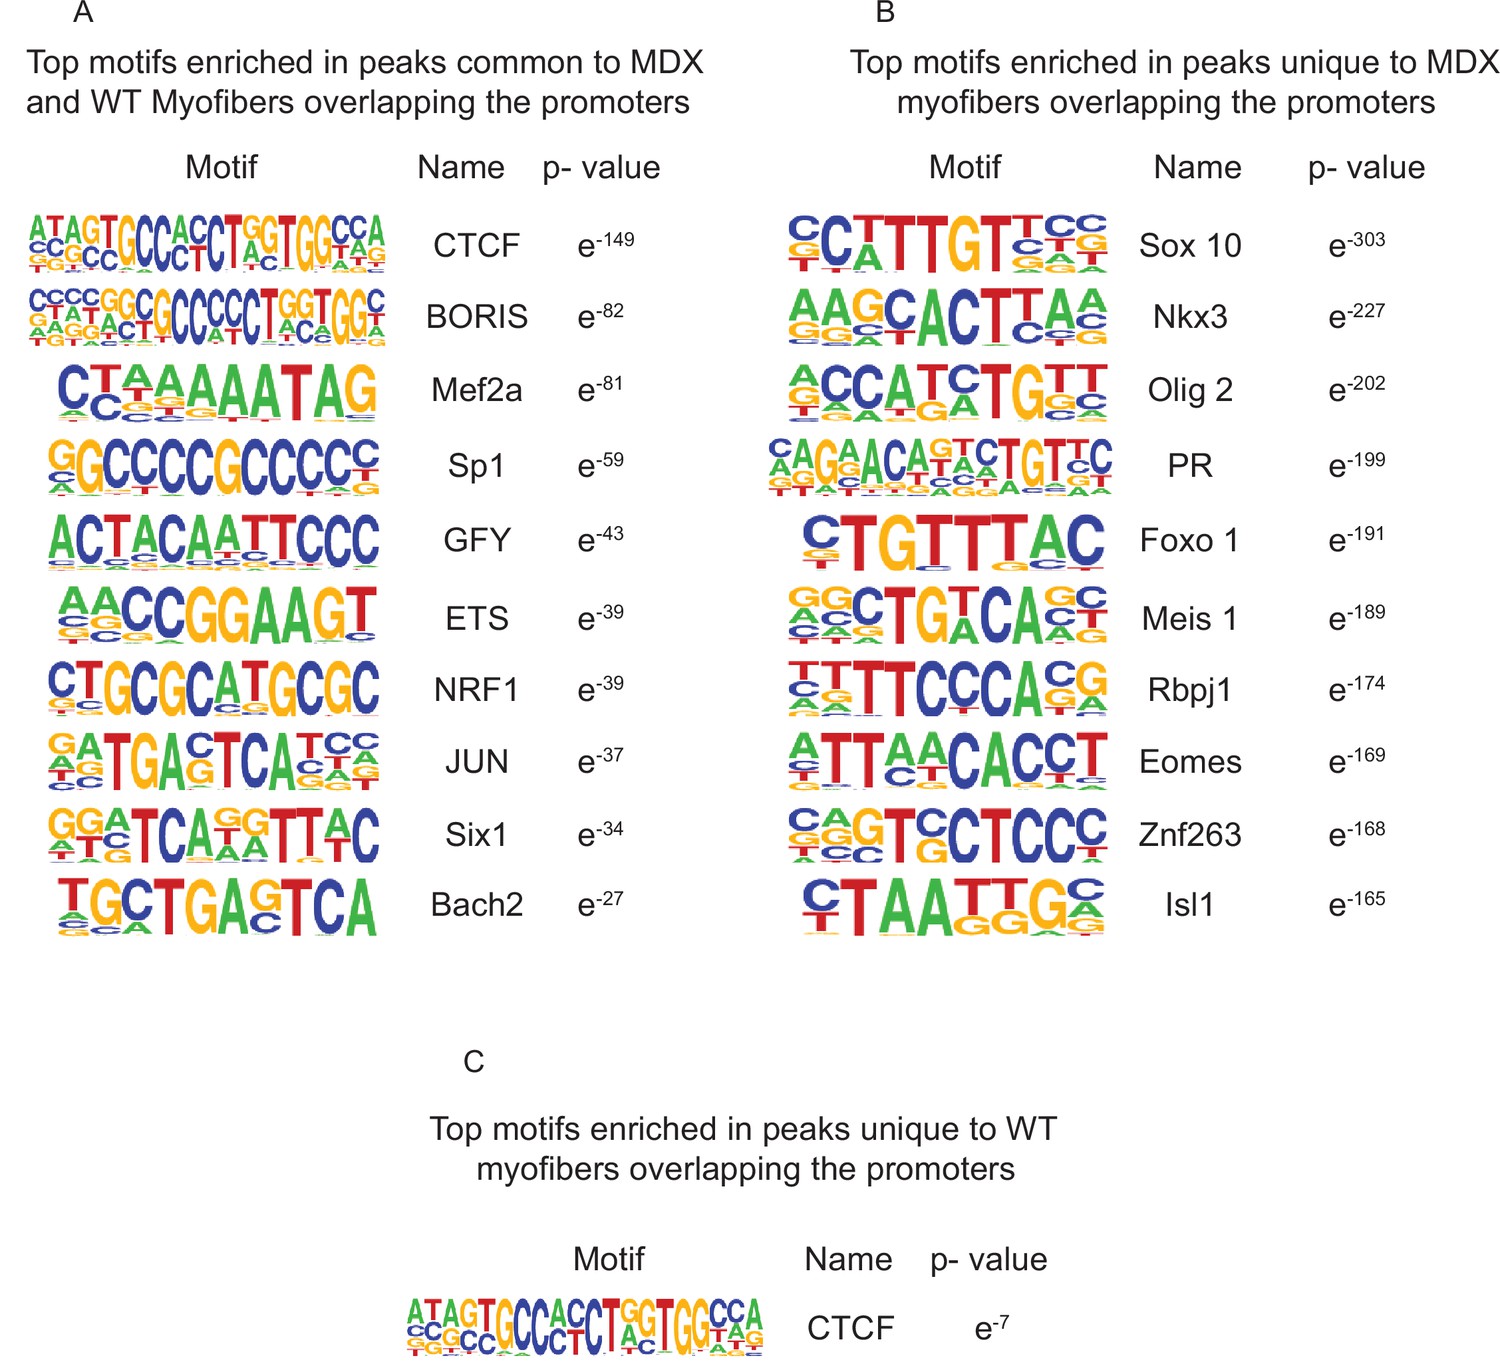
Top enriched motifs in the ATAC-Seq peaks of mdx and WT myofibers.
(A) Top 10 significantly enriched motifs in the peaks that are common between mdx and WT myofibers overlapping the promoters (±5 kb). (B) Top 10 significantly enriched motifs in the peaks that are unique to mdx myofibers overlapping the promoters (±5 kb). (C) Top 10 significantly enriched motifs in the peaks that are unique to WT myofibers overlapping the promoters (±5 kb).
Tables
Table 1
Sequencing read information for smfATAC-Seq and MuSCs ATAC-Seq libraries.
| Library | Number of raw reads | Number of surviving reads | Aligned filtered reads (mm10 reference) | Duplicate reads | Mitochondrial reads | Percentage of mitochondrial reads (%) | Final reads aligned | Number of peaks | Fraction in peaks (FrIP) |
|---|---|---|---|---|---|---|---|---|---|
| Muscle Stem Cells_1 | 175924734 | 113938436 | 103130186 | 47623836 | 529,967 | 0.51 | 54976383 | 65,568 | 0.3642 |
| Muscle Stem Cells_2 | 174965936 | 117357212 | 103570009 | 43672484 | 374,176 | 0.36 | 59523349 | 68,658 | 0.1971 |
| Muscle Stem Cells_3 | 131990380 | 91261584 | 79944121 | 31299456 | 223,540 | 0.28 | 48421125 | 69,573 | 0.1296 |
| Injured_1 | 229935426 | 117212678 | 90040002 | 81024926 | 830,215 | 0.92 | 8184861 | 32,853 | 0.2885 |
| Injured_2 | 194563870 | 129934972 | 98752157 | 88549329 | 1300615 | 1.32 | 8902213 | 28,351 | 0.2863 |
| Injured_3 | 142411536 | 62888552 | 52132455 | 42271079 | 868,808 | 1.67 | 8992568 | 25,002 | 0.2325 |
| Uninjured_1 | 145465410 | 75781456 | 61034569 | 52588315 | 1274332 | 2.09 | 7171922 | 12,276 | 0.2181 |
| Uninjured_2 | 151015852 | 64192706 | 50120282 | 45914841 | 965,037 | 1.93 | 3240404 | 14,742 | 0.3208 |
| MDX_1 | 107540762 | 50979732 | 40485803 | 36205908 | 802,561 | 1.98 | 3477334 | 40,833 | 0.7256 |
| MDX_2 | 103130726 | 54209722 | 46455472 | 37291531 | 1099747 | 2.37 | 8064194 | 39,254 | 0.4932 |
| MDX_3 | 108130662 | 48920904 | 40677359 | 34484003 | 1171316 | 2.88 | 5022040 | 35,691 | 0.5589 |
| WT_1 | 104219578 | 43914902 | 34162142 | 28600498 | 1651199 | 4.83 | 3910445 | 26,873 | 0.7283 |
| WT_2 | 110108692 | 37411936 | 31299222 | 25345321 | 1143317 | 3.65 | 4810584 | 28,430 | 0.64 |
| WT_3 | 183583506 | 72489354 | 56983637 | 49310923 | 1840265 | 3.23 | 5832449 | 39,178 | 0.7611 |
| WT_4 | 86533840 | 36708706 | 28714893 | 25157965 | 1404712 | 4.89 | 2152216 | 21,252 | 0.752 |
Table 2
Percentage of ATAC-Seq peaks that overlap with the TSS±500 bp by at least 1 bp.
| Top 100 genes expressed in whole muscle but not in myofiber | Top 50 genes expressed in whole muscle but not in myofiber | All genes expressed in whole muscle tissue | All genes in the genome | |||||||||
|---|---|---|---|---|---|---|---|---|---|---|---|---|
| Number of overlapping peaks | Total number of peaks | % overlapping peaks | Number of overlapping peaks | Total number of peaks | % overlapping peaks | Number of overlapping peaks | Total number of peaks | % overlapping peaks | Number of overlapping peaks | Total number of peaks | % overlapping peaks | |
| Uninjured_Fiber | 12 | 19,704 | 0.0609013 | 3 | 19,704 | 0.0152253 | 7,865 | 19,704 | 39.915753 | 12,995 | 19,704 | 65.951076 |
| Injured_Fiber | 65 | 47,112 | 0.1379691 | 12 | 47,112 | 0.0254712 | 14,259 | 47,112 | 30.266174 | 26,198 | 47,112 | 55.607913 |
| EDL_Whole_Muscle | 198 | 60,719 | 0.3260923 | 65 | 60,719 | 0.1070505 | 18,419 | 60,719 | 30.334821 | 33,048 | 60,719 | 54.427774 |
-
Genes identified as being expressed solely in whole muscle but not in myofiber were retrieved from “High-resolution genome-wide expression analysis of single myofibers using SMART-Seq, JBC, Blackburn et al., 2019” and were defined as any gene with an expression of at least 10 RPM in the whole muscle RNA-seq, but 0 RPM in the single myofiber RNA-seq. All genes expressed in whole muscle tissue was defined as any gene that had an RPM value of at least 10 RPM from the whole muscle RNA-seq data by Blackburn et al., 2019 accessible through the GEO accession number GSE138591.
Table 3
Percentage of overlapping peaks between smfATAC-Seq from uninjured myofibers and whole EDL muscle ATAC-Seq.
| Percent overlap (%) | |
|---|---|
| smfATAC-Seq peaks that overlap with EDL-ATAC-Seq by at least 1 bp | 65.9510759 |
| smfATAC-Seq peaks that overlap with EDL-ATAC-Seq by at least 20% | 61.4951279 |
| smfATAC-Seq peaks that overlap with EDL-ATAC-Seq by at least 40% | 52.6136825 |
| smfATAC-Seq peaks that overlap with EDL-ATAC-Seq by at least 60% | 42.1082014 |
| smfATAC-Seq peaks that overlap with EDL-ATAC-Seq by at least 90% | 24.3453106 |
-
Whole EDL muscle ATAC-Seq was retrieved from “Dynamic enhancers control skeletal muscle identity and reprogramming, Ramachandran et al., 2019.” This data is accessible through the GEO accession number GSM3981673.
Table 4
Percentage of total peaks found in each genomic feature.
| Muscle stem cells (%) | Injured myofiber (%) | Uninjured myofiber (%) | MDX myofiber (%) | WT myofiber (%) | |
|---|---|---|---|---|---|
| Promoter (±1 kb TSS) | 20.66 | 31.61 | 56.54 | 35.58 | 35.15 |
| Promoter (±1 kb and/or ±2 kb TSS) | 4.81 | 4.84 | 3.45 | 3.78 | 4.53 |
| Promoter ((±2 kb and/or ±3 kb TSS)) | 4.37 | 3.92 | 3.01 | 4.14 | 4.30 |
| 5'UTR | 0.34 | 0.27 | 0.23 | 0.46 | 0.39 |
| 3'UTR | 2.50 | 1.82 | 1.15 | 2.86 | 2.58 |
| First Exon | 1.83 | 1.47 | 1.53 | 1.94 | 1.78 |
| Other Exon | 4.75 | 3.42 | 2.19 | 4.74 | 4.25 |
| First Intron | 11.85 | 10.87 | 7.35 | 10.93 | 10.56 |
| Other Intron | 20.80 | 18.84 | 10.35 | 18.81 | 18.30 |
| Downstream ( ≤ 300 kb) | 1.16 | 1.01 | 0.69 | 1.02 | 0.99 |
| Distal Intergenic | 26.95 | 21.93 | 13.51 | 15.74 | 17.15 |
Table 5
Percentage of differential peaks in each genomic feature.
| Uninjured myofiber vs MuSCs (%) | Uninjured vs injured myofiber (%) | WT vs MDX myofiber (%) | |
|---|---|---|---|
| Promoter (±1 kb TSS) | 43.07 | 25 | 29.92 |
| Promoter (±1 kb and/or ±2 kb TSS) | 3.36 | 7.81 | 3.68 |
| Promoter (±2 kb and/or ±3 kb TSS) | 3.39 | 3.12 | 4.49 |
| 5’UTR | 0.37 | 0.78 | 0.46 |
| 3’UTR | 1.95 | 3.12 | 2.99 |
| First Exon | 2.29 | 3.91 | 1.84 |
| Other Exon | 3.85 | 7.81 | 4.49 |
| First Intron | 9.16 | 13.28 | 14.84 |
| Other Intron | 13.34 | 18.75 | 24.86 |
| Downstream ( ≤ 300 kb) | 0.83 | 0.78 | 0.12 |
| Distal Intergenic | 18.39 | 15.62 | 12.31 |
Key resources table
| Reagent type (species) or resource | Designation | Source or reference | Identifiers | Additional information |
|---|---|---|---|---|
| Genetic reagent (M. musculus) | C57BL/6 J | The Jackson Laboratory | Stock #: 000664 | |
| Genetic reagent (M. musculus) | C57BL/10ScSnJ | The Jackson Laboratory | Stock #: 000476 | |
| Genetic reagent (M. musculus) | C57BL/10ScSn-Dmdmdx/J | The Jackson Laboratory | Stock #: 001801 | |
| Genetic reagent (M. musculus) | Tg(Pax7-EGFE)#Tagb (Pax7-nGFP) | Sambasivan, R. et al. Distinct Regulatory Cascades Govern Extraocular and Pharyngeal Arch Muscle Progenitor Cell Fates. Developmental Cell, (2009). (Sambasivan et al., 2009) | PMID:19531352 | Dr. Shahragim Tajbakhsh (Institut Pasteur) |
| Commercial kit or assay | Tn5 transposase | Illumina | Cat #: 20034197 | |
| Commercial kit or assay | Nextera XT adaptors | Illumina | Cat #: FC-131–1001 | |
| Commercial kit or assay | QIAquick PCR purification kit | Qiagen | Cat #: 28,104 | |
| Chemical compound, drug | Triton X –100 | Sigma-Aldrich | Cat #: T9284 | |
| Chemical compound, drug | Tween-20 | Sigma-Aldrich | Cat #: P1379-1L | |
| Chemical compound, drug | Digitonin | Promega | Cat #: G9441 | |
| Chemical compound, drug | Collagenase D | Roche | Cat #: 11088882001 | 2.4 U/mL |
| Chemical compound, drug | Collagenase | Sigma-Aldrich | Cat #: C0130 | 1000 U/mL |
| Chemical compound, drug | Dispase II | Roche | Cat #: 39307800 | 12 U/mL |
| Chemical compound, drug | Cardiotoxin | Sigma Aldrich | Cat #: 11061-96-4 | |
| Sequence-based reagent | MyoD_L | This paper | PCR primers | TGCTCCTTTG AGACAGCAGA |
| Sequence-based reagent | MyoD_R | This paper | PCR primers | AGTAGGGAA GTGTGCGTGCT |
| Other | Q5 High Fidelity DNA polymerase | New England Biolabs | Cat #: M0491S | For amplification of DNA post Tn5 tagmentation (see Library Preparation) |
| Chemical compound | DAPI stain | Invitrogen | Cat #: D3671 | (5 mg/mL) |
| Other | Ampure XP beads | Beckman | Cat #: A63880 | For library size selection at a concentration of 0.85 x (see Library Preparation) |
| Chemical compound | Hoechst | Molecular Probes | Cat #: H1399 | (5 mg/mL) |
Additional files
-
Transparent reporting form
- https://cdn.elifesciences.org/articles/72792/elife-72792-transrepform1-v2.pdf
-
Source data 1
Quality control source data.
(A) Unlabeled agarose gel (1.25%) of MuSC ATAC-Seq sequence ready libraries. (B) Unlabeled agarose gel (1.25%) of uninjured myofiber ATAC-Seq sequence ready library. (C) Labeled agarose gel (1.25%) image of MuSC and uninjured myofiber ATAC-Seq sequence ready libraries. (D) Raw file of bioanalyzer results from single myofiber sequence ready ATAC-Seq libraries.
- https://cdn.elifesciences.org/articles/72792/elife-72792-data1-v2.zip
Download links
A two-part list of links to download the article, or parts of the article, in various formats.
Downloads (link to download the article as PDF)
Open citations (links to open the citations from this article in various online reference manager services)
Cite this article (links to download the citations from this article in formats compatible with various reference manager tools)
Application of ATAC-Seq for genome-wide analysis of the chromatin state at single myofiber resolution
eLife 11:e72792.
https://doi.org/10.7554/eLife.72792


