3D optogenetic control of arteriole diameter in vivo
- Department of Physiology, Augusta University, United States
- Department of Neuroscience, Medical University of South Carolina, United States
- Department of Neurology & Neurological Sciences, Stanford University, United States
- Department of Neuroscience, University of Minnesota, United States
- Center for Magnetic Resonance Research, University of Minnesota, United States
- Center for Developmental Biology and Regenerative Medicine, Seattle Children’s Research Institute, United States
- Department of Bioengineering, University of Washington, United States
- Department of Pediatrics, University of Washington, United States
Figures
Figure 1
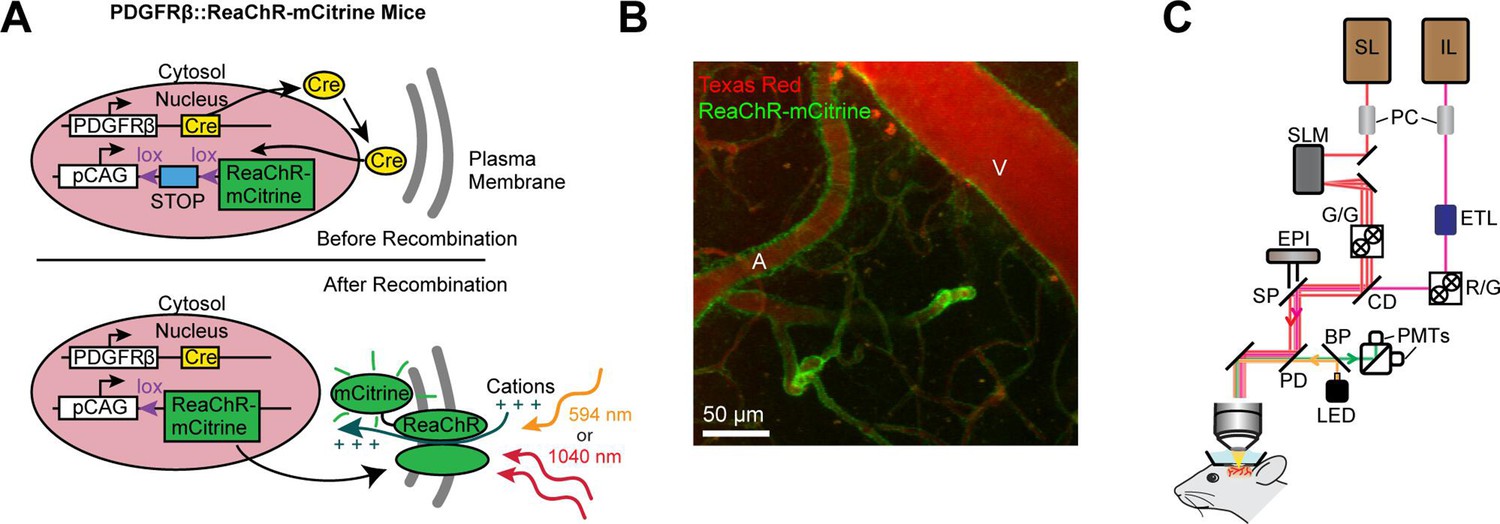
Mouse genetics and equipment for controlling arteriolar diameter with ReaChR.
(A) Crossing the PDGFRβ-Cre line with a floxed ReaChR (tagged with mCitrine) line leads to expression of the opsin in vascular mural cells. Mural cells can then be depolarized with single-photon excitation using a 594 nm LED or two-photon excitation with a fixed 1040-nm pulsed laser. Studies with control mice (see Figure 5—figure supplement 1) followed a similar strategy except only YFP was expressed in the cytosol of mural cells. (B) Maximal projection image of cortical vessels from the mouse line created in panel A. The vascular lumen is labeled with Texas Red-dextran and the green in the vessel walls shows the expression of ReaChR-mCitrine. A = pial arteriole, V = pial venule. (C) Imaging equipment – the Ultima 2P-Plus from Bruker (see Methods for details). Imaging laser (IL), stimulation laser (SL), Pockel cells (PC), spatial light modulator (SLM), galvonometer mirrors (G/G), electro-tunable lens (ETL), resonant scanning/galvonometer mirrors (R/G), combining dichroic (CD), primary dichroic (PD), light-emitting diode (LED), short-pass mirror (SP), band-pass mirror (BP), photo-multiplier tubes (PMTs), epifluorescence module (EPI).
Figure 2
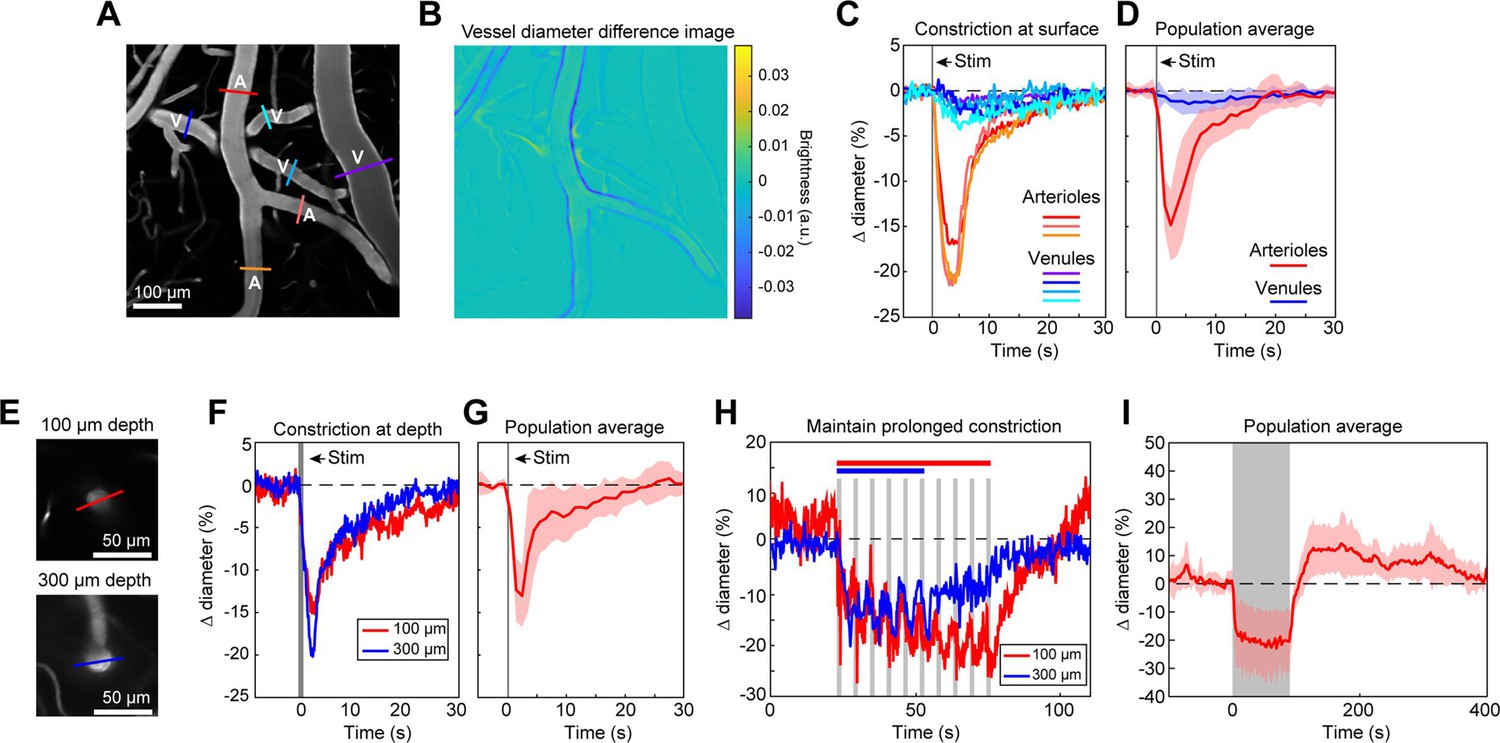
Full-field optogenetic activation of cortical vessels with 594 nm light-emitting diode (LED).
(A) Cortical surface vessels labeled with fluorescein isothiocyanate (FITC) dextran. Arterioles (A) and venules (V) are marked. (B) Difference image created by subtracting the average of 4 s of data frames following stimulation (2.5–6.5 s after onset) from the average before stimulation (0–4 s before onset). Blue lines on vessel walls opposite each other indicate reduced brightness showing where constriction occurred. Vessels with yellow on one side and blue on the other indicate XY shifts in the image between the two intervals. Units are difference in arbitrary brightness values. (C) Time courses of vessel diameter changes. Colored lines correspond to cross-sections in panel A, with arterioles in varying shades of red and venules in shades of blue. Vertical gray band is optical stimulation interval (100 ms pulse). (D) Population average of 13 surface arterioles (red) and 10 surface venules (blue) from three mice stimulated with a single 100 ms pulse from the LED. Population constriction from 1 to 5 s following stimulation pulse: Arterioles = 11.1 ± 1%; Venules = 0.7 ± 0.2% (mean ± standard error of the mean [SEM]). (E) Images of a penetrating arteriole 100 µm deep (top) and 300 µm deep (bottom) in the cortex. Colored cross-sections correspond to time course traces in F and H. (F) A single train of LED light pulses (5 pulses, 100 ms, with 100 ms between) evoked strong constriction at both depths. (G) Population average constriction of five penetrating arterioles from three mice to a single 100 ms pulse (8.6 ± 1.7%). (H) We maintained vasoconstriction with repeated stimulation trains (5 pulses, 100 ms, 100 ms interpulse interval, 4 s between trains). Six trains were applied to the vessel at 300 µm and 10 to the vessel at 100 µm. (I) Population average of 11 vessels (pial and penetrating arterioles were combined as responses were similar) from three mice to 90 s of continual LED light pulses (100 ms pulses, 0.4 Hz).
Figure 3
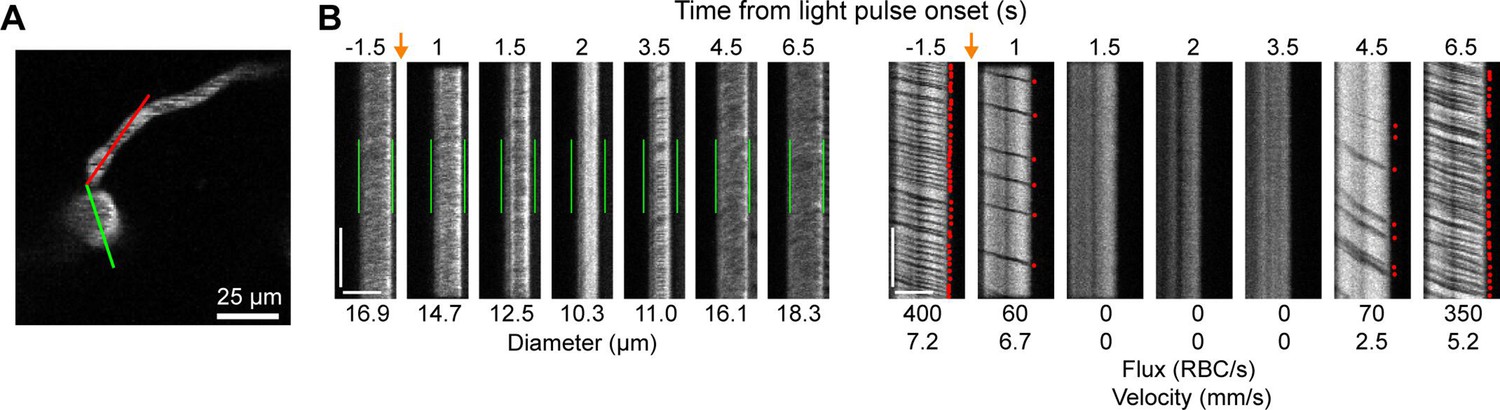
Optogenetic activation of vascular mural cells reduces blood flow.
(A) Image of penetrating arteriole with an arteriole–capillary transition branch 85 µm below the surface. Line scans were acquired to measure the diameter of the arteriole (green segment) and the flow of the transition branch (red segment). A train of pulses (10 pulses, 100 ms, with 100 ms between) was delivered over the cranial window from the light-emitting diode (LED) (594 nm). (B) Line-scan data from seven time points during the run. Y-Axis is time with each row being a single scan of the laser line. X-Axis is distance along the line. The left set of panels shows the diameter data (the green segment in A) with the green bars indicating the prestimulus diameter. The right panels show the flow (the red segment in A) with each dot representing a single RBC passing through the segment (the dark streaks). The orange arrows indicate the interval when the light stimulus was applied. Numbers below each panel give the diameter of the penetrating arteriole and the flux and blood velocity for the transitional vessel. The arteriole constricts and flow is briefly eliminated (absence of dark spots in diameter segment at 2 s) before returning as the arteriole dilates back to the baseline level. Flow is reduced in the transition branch and then drops to zero (absence of dark streaks) before slowly recovering. Scale bars: time axis: 25 ms; distance axis: 25 µm.
Figure 4 with 1 supplement
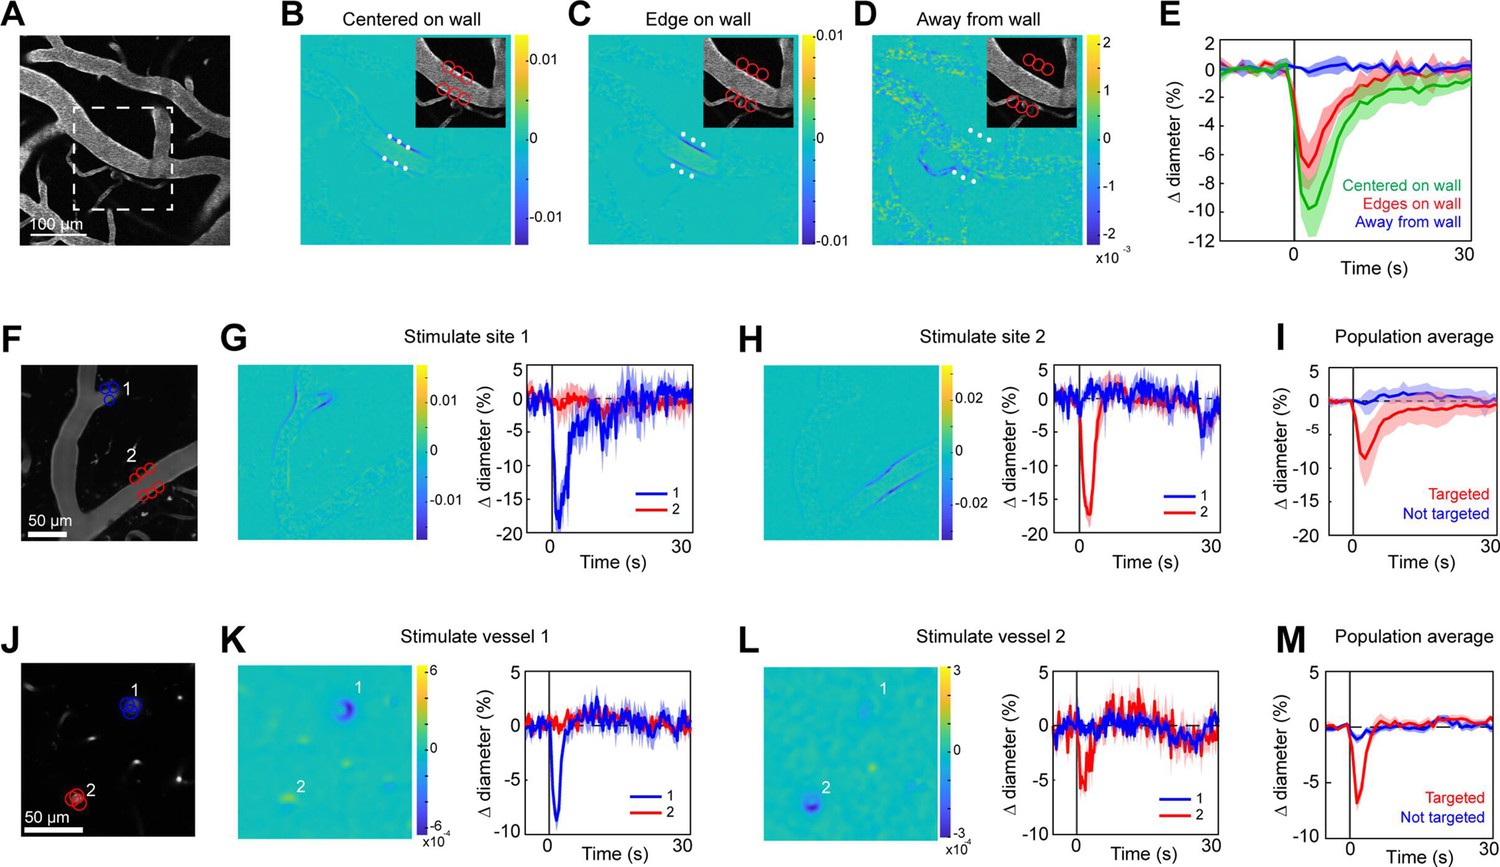
Spatial precision of two-photon optogenetic activation in the lateral plane.
(A–E) XY-precision of photostimulation. (A) Image of surface vessels labeled with Texas Red-dextran in an opsin mouse that were photostimulated with spots in different positions relative to the vessel wall. Dashed rectangle indicates region in inset on the difference image panels (B–D). Three spot positions were used: (B) spots centered on vessel walls, (C) spot edges on vessel walls, and (D) spot centers one diameter away from vessel walls. Difference images as in Figure 2. Red circles indicate the location and size of the spots, white asterisks indicate spot centers. (E) Time courses of diameter changes based on spot position. Average of three vessels, five repetitions each. Error bands are standard deviation (SD). Total laser power was ~130 mW divided between the six spots. Mean constriction for the three conditions was 7.6%, 4.8%, and 0.0% for B, C, and D respectively, with standard error of the mean (SEM) <1% for all three conditions. (F–I) Stimulation of different surface branches leads to isolated constriction. (F) Surface vasculature labeled with Texas Red-dextran. Colored circles indicate size/location of stimulation spots and correspond to time course plots in G, H. For G, total laser power was ~90 mW. For H, total power was ~70 mW. (G, H) Left panels: Difference images showing constriction (blue lines on both sides of vessel) only near stimulation points. Right panels: Time courses of diameter change for the two different stimulations: Error bands are SD across five (G) or four (H) repetitions. Vertical gray band is stimulation interval (100 ms). (I) Population average constriction of vessel segments when targeted (red) or not (blue). N = 8 vessels in 3 animals. Average total power per vessel was 138 mW (range 90–250 mW). Population mean ± SEM from 1 to 5 s following stimulation: Targeted arterioles = 6.5 ± 1%; Untargeted = 0.3 ± 0.4%. (J–M) Stimulation of penetrating arterioles with single-vessel precision. (J) Two penetrating arterioles 200 µm below the cortical surface. Left panels: Difference images when stimulating arteriole #1 (K) or arteriole #2 (L). Each arteriole was stimulated with a total power ~110 mW. Right panels: Time courses of diameter change of the vessels indicated in the left panels. Data presented as mean and SD across seven repetitions. (M) Population average constriction of penetrating arterioles when targeted with stimulation (red) and when not targeted (blue). N = 9 vessels in 3 animals. Average total power applied to each vessel was 130 mW (range 80–190 mW). Population mean ± SEM from 1.5 to 4.5 s following stimulation. Targeted arterioles = 3.8 ± 0.6%; Untargeted = 0.7 ± 0.3%.
Figure 4—figure supplement 1

Two-photon optogenetic activation in venules versus arterioles.
(A) Because venules showed small constriction to the full-field (single-photon) optogenetic stimulation (Figure 2B–D), we also tested the vessels with two-photon stimulation (1045 nm) targeted to individual vessel segments in separate runs. Colored circles indicate size and locations of stimulation spots and correspond to time courses in B. (B) Time courses of diameter change following two-photon activation. Vertical gray band is optical stimulation interval (100 ms pulse). Arterioles were stimulated with ~110 mW total power. Venules were stimulated with up to ~330 mW and still no constriction was observed. (C) Population average time course for surface arterioles (red) and venules (blue). Arterioles N = 8 vessels from 3 mice; Venules N = 8 vessels from same 3 mice. Four to six spots, 20–25 μm in size were scanned on each vessel. Average total power for arterioles was 138 mW (range 90–250) and for venules was 245 mW (range 90–330). Population mean ± standard error of the mean (SEM) from 1 to 5 s following stimulation: Arterioles = 6.5 ± 1%; Venules = 0.4 ± 0.1%. (D) Magnified view of the site of the red circles in A to show spiral pattern that was used to stimulate vessels. Circles are used throughout the paper for simplicity, but all spots were scanned in a five-spiral pattern to activate more opsin molecules.
Figure 5 with 6 supplements
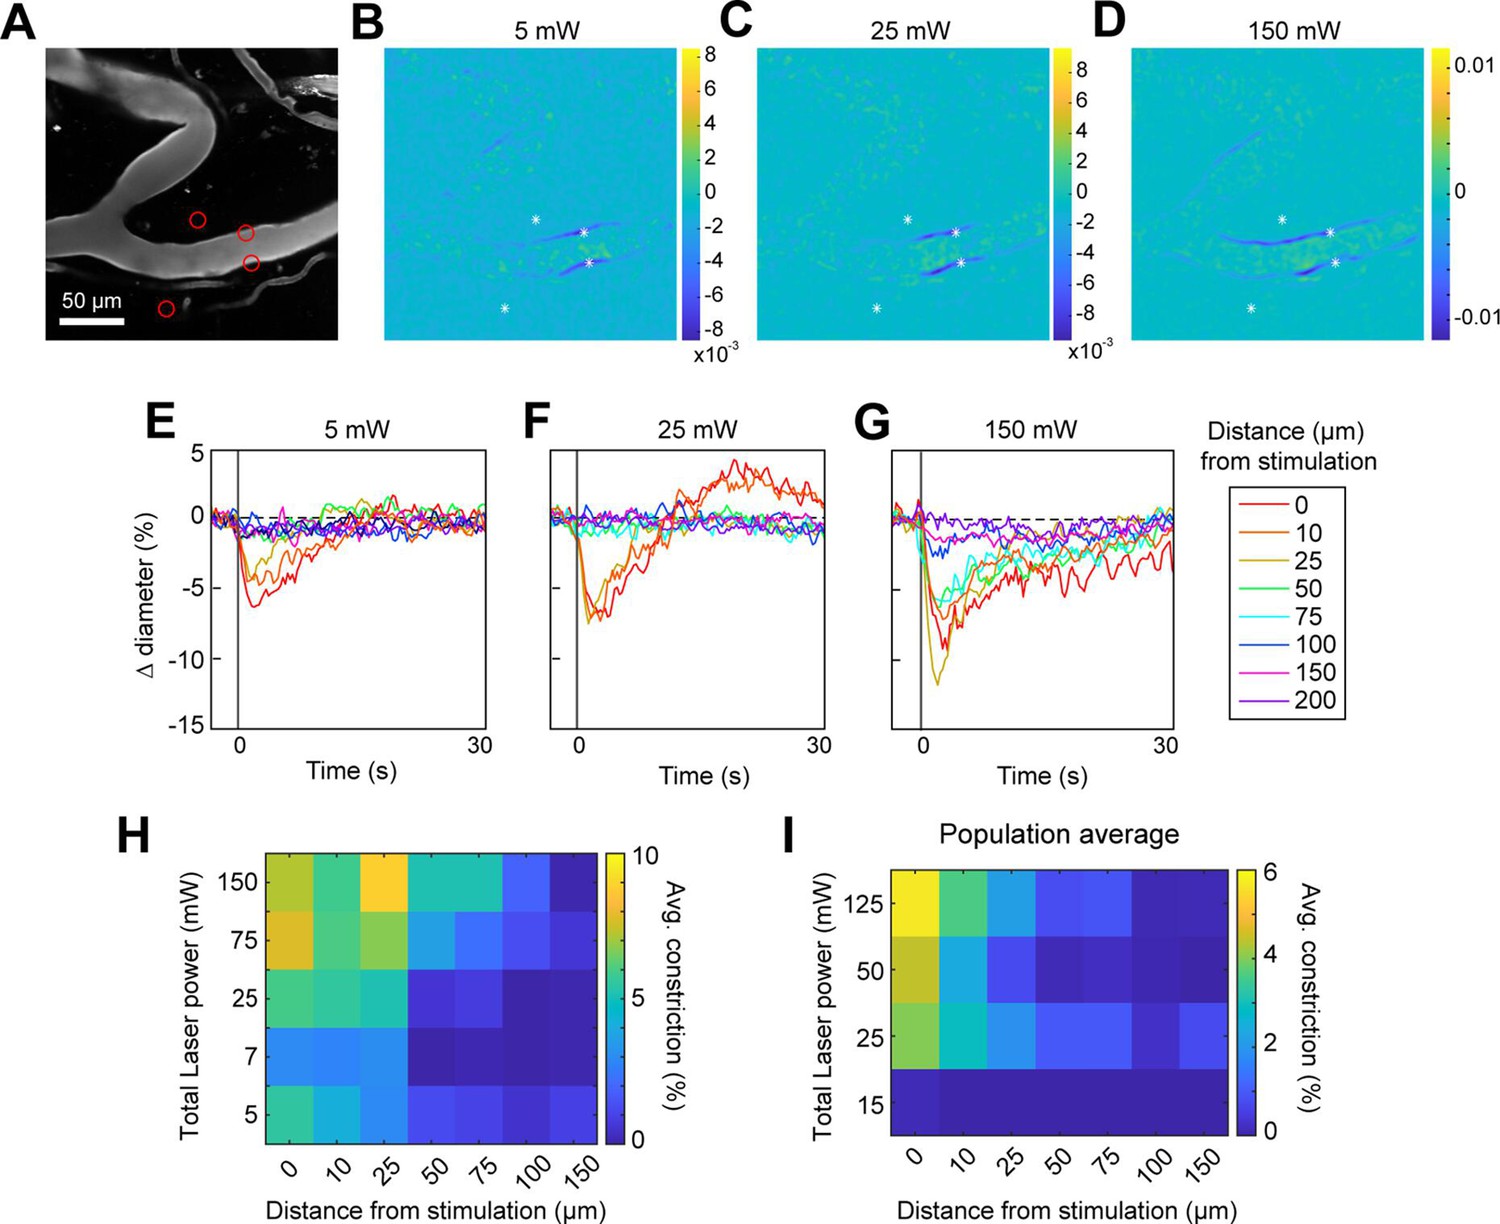
Effect of laser power on spread of constriction.
(A) Vessels labeled with Texas Red-dextran. Red circles show spot size and location. Two spots off the vessel were to maintain similar power levels per spot compared to other runs (not shown). (B–D) Difference images for three different power levels (values indicate total power of all four spots). (E–G) Time courses of diameter change at the three power levels in B–D at different distances along the arteriole from the center of stimulation. (H) Summary of constriction at all power levels tested across different distances. Average constriction from 1 to 5 s following stimulation onset (higher numbers/yellow color indicates greater constriction). (I) Population average from three vessels in three mice of constriction at different power levels and distances from stimulation location. Six spots were placed on vessels (15 µm, three on each side of vessel).
Figure 5—figure supplement 1
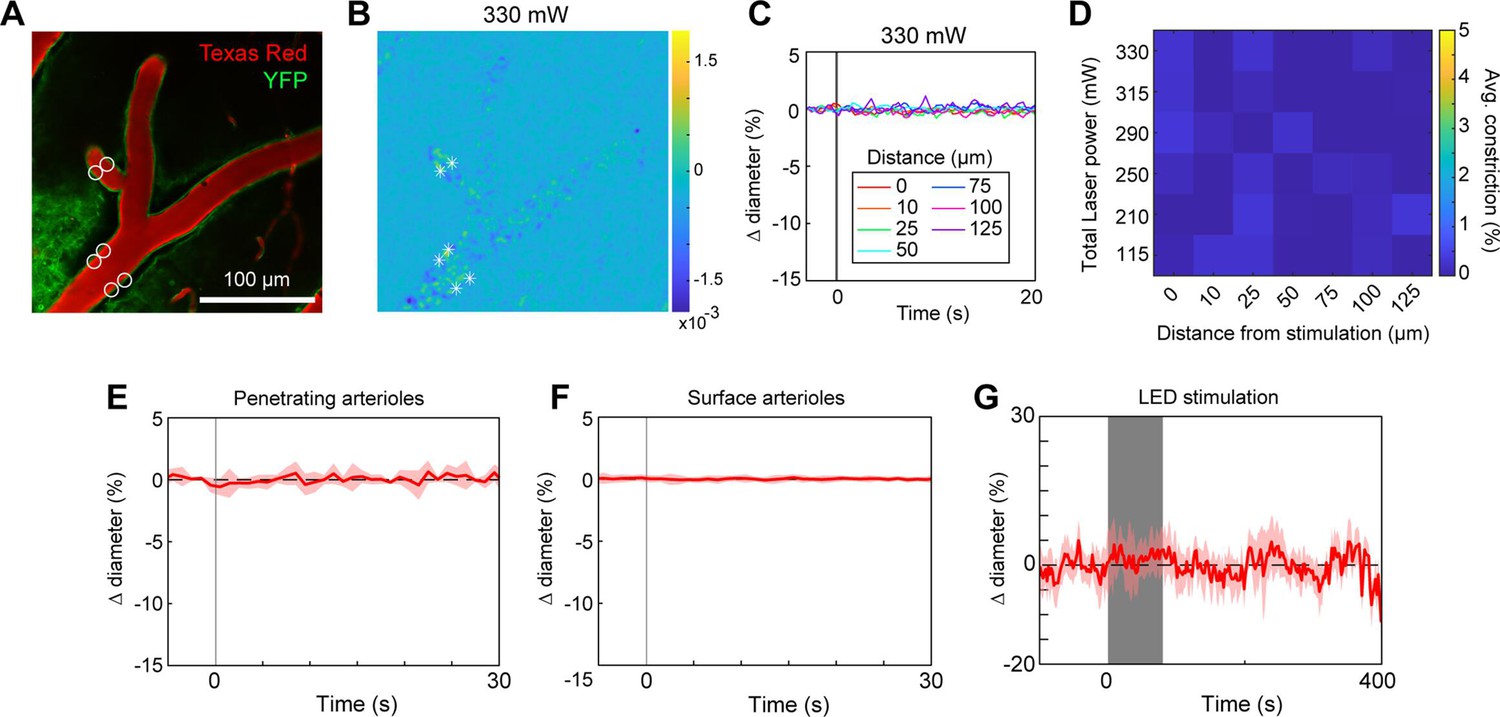
Control mouse expressing YFP only in mural cells exhibit no vasoconstriction.
(A) Control mice expressed yellow fluorescent protein (YFP) under control of the PDGFRβ promoter. Vessels labeled with Texas Red-dextran. White circles show spot size and location for two-photon optogenetic activation. (B) Difference image for the maximum power level used (value indicates total power of all six spots). (C) Time courses of diameter change at the maximum power level at different distances from the center of stimulation for the location with four spots on the arteriole. (D) Summary of constriction at all power levels tested across different distances (color scale similar to Figure 5I for comparison). Even at very high powers, no constriction was seen. Population average for spatial light modulator (SLM) stimulation of penetrating arterioles (E) and surface arterioles (F), and prolonged, repeated light-emitting diode (LED) stimulation of surface and penetrating vessels combined (100 ms pulses, 0.25–0.43 Hz, 80–116 s) (G). N = 5 vessels from 2 mice (E), 19 vessels from 2 mice (F), and 16 vessels from 3 mice (G).
Figure 5—video 1
Excessive laser power leads to vessel damage and widespread constriction.
Same vessel as Figure 4A, here using a total of ~230 mW of laser power. The first pulse leads to a visibly damaged vessel wall and the second pulse breaks the wall causing dye leakage. Video is a 218 μm x 188 μm window.
Figure 5—video 2
Control mouse expressing YFP in vessel walls shows that excessive laser power can lead to widespread constriction and vessel damage independently of opsins.
The spatial light modulator (SLM) focused 4four total spots, with pairs of spots opposite each other at the two different positions on the artery indicated by the arrows. The total stimulation power was ~265 mW, and each spot was scanned in a 12-µm diameter spiral for 100 ms. Video is a 258 μm x 258 μm window.
Figure 5—video 3
Another example of vessel trauma at high powers in control mouse.
Laser power was ~280 mW spread over 4four spots (pairs of spots opposite each other at arrow locations). Video is a 258 μm x 258 μm window.
Figure 5—video 4
Control mice show no constriction after light pulse when using powers that resulted in clear constrictions in ReaChR mice.
Same site as Figure 5—video 2. The total stimulation power was ~200 mW.
Figure 5—video 5
Same as Figure 5 - Video 3 but the power was ~200 mW.
No constriction is seen with the lower laser power.
Figure 6 with 1 supplement
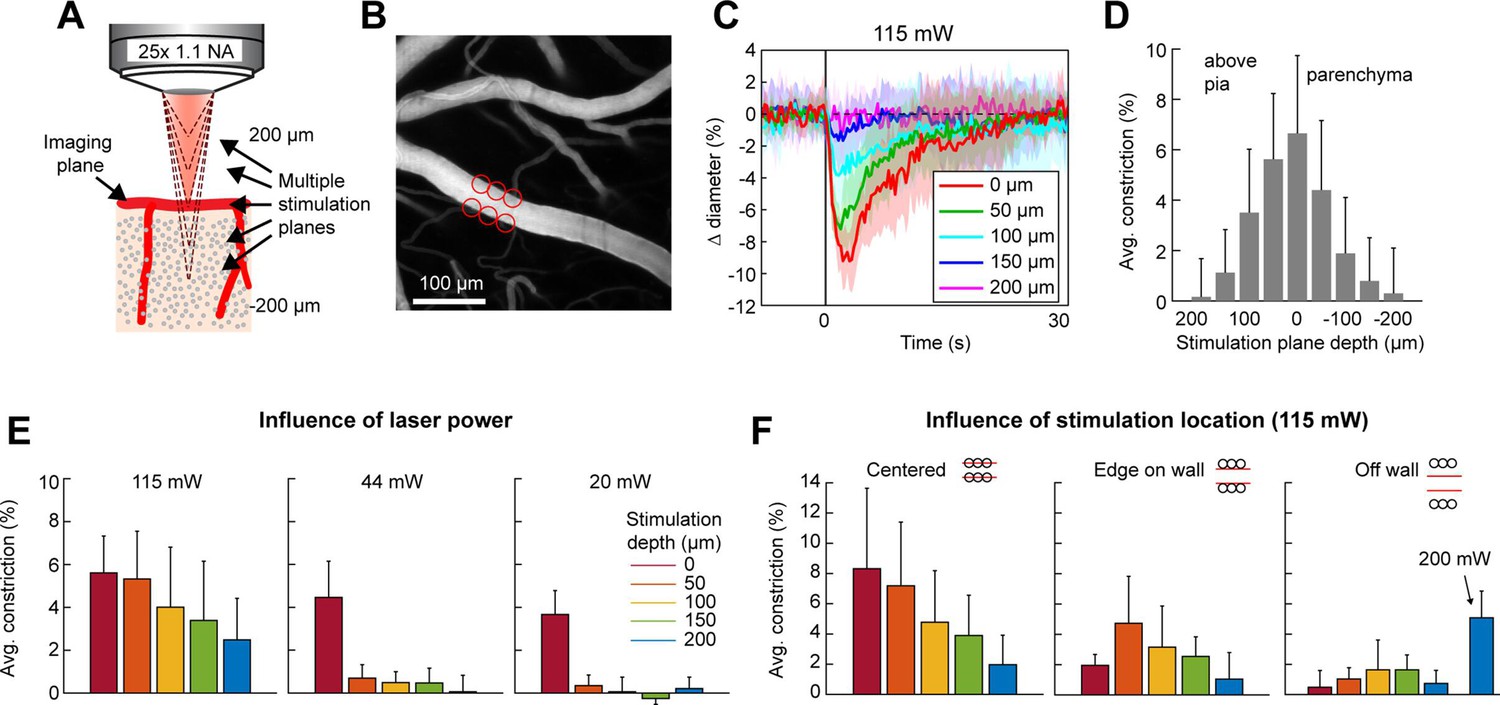
Axial resolution of two-photon optogenetic activation.
(A) Schematic of imaging setup for measuring the axial resolution of two-photon activation. The objective focused the imaging beam on a pial arteriole at the cortical surface. The dashed lines indicate various focal planes of the stimulation laser generated by the spatial light modulator (SLM). In the experiment, stimulation spots were focused from 200 µm above to 200 µm below the imaging plane in 50 µm steps. (B) Projection of surface vasculature labeled with Texas Red-dextran. Red circles indicate size and XY position of stimulation spots in varying depth planes. Total power was ~115 mW. (C) Time courses of diameter changes following stimulation at different depths from the surface. Mean and standard deviation (SD) across eight repetitions. Equidistant planes above and below the surface were averaged together for visibility. (D) Constriction amount at the different depths computed as the average change in diameter across repetitions from 1 to 5 s following the stimulation pulse. Error bars are SD across eight repetitions. (E) Axial resolution at three different total power levels averaged across three surface arterioles from three mice. Error bands are SD across vessels. (F) Influence of stimulation spot location at different depths. 115 mW total power. N = 4 surface arterioles from 4 mice. For the ‘Off wall’ condition, 200 mW total power was also used at the 200 µm depth.
Figure 6—figure supplement 1
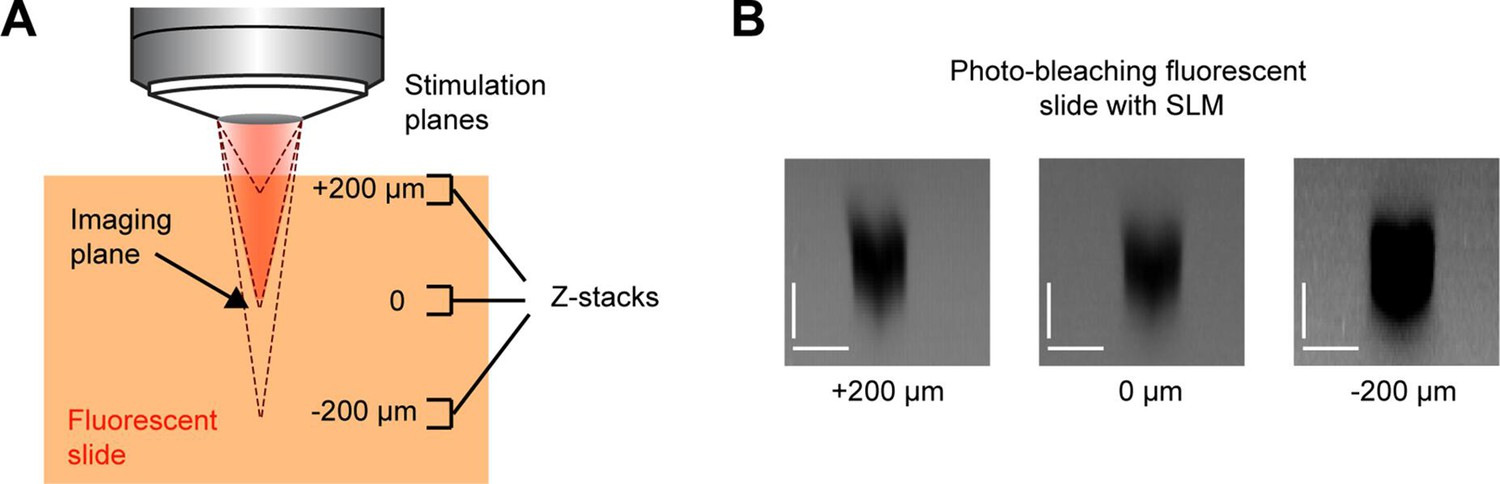
Spatial light modulator (SLM) focus test.
(A) Schematic of a test to ensure the SLM focal plane was calibrated correctly. We focused the imaging laser beam in the middle of a fluorescent Chroma slide. We then used the SLM to place the stimulation laser at three different focal planes (the dashed lines). In separate runs, three stimulation spots (15 µm diameter) were focused 200 µm above, 200 µm below, or at the imaging plane, and high powers were delivered to bleach the fluorophore in the slide. Z-stacks were subsequently obtained with the imaging laser around one spot at each of the stimulation depths to determine the spread of the bleaching (and hence the spread of photostimulation). (B) XZ projections from the fluorescent slide. The region of photo-bleaching in the axial (Z) dimension was the same regardless of the SLM focus depth. Scale bars are 15 µm for both the axial and lateral dimensions.
Figure 7 with 1 supplement
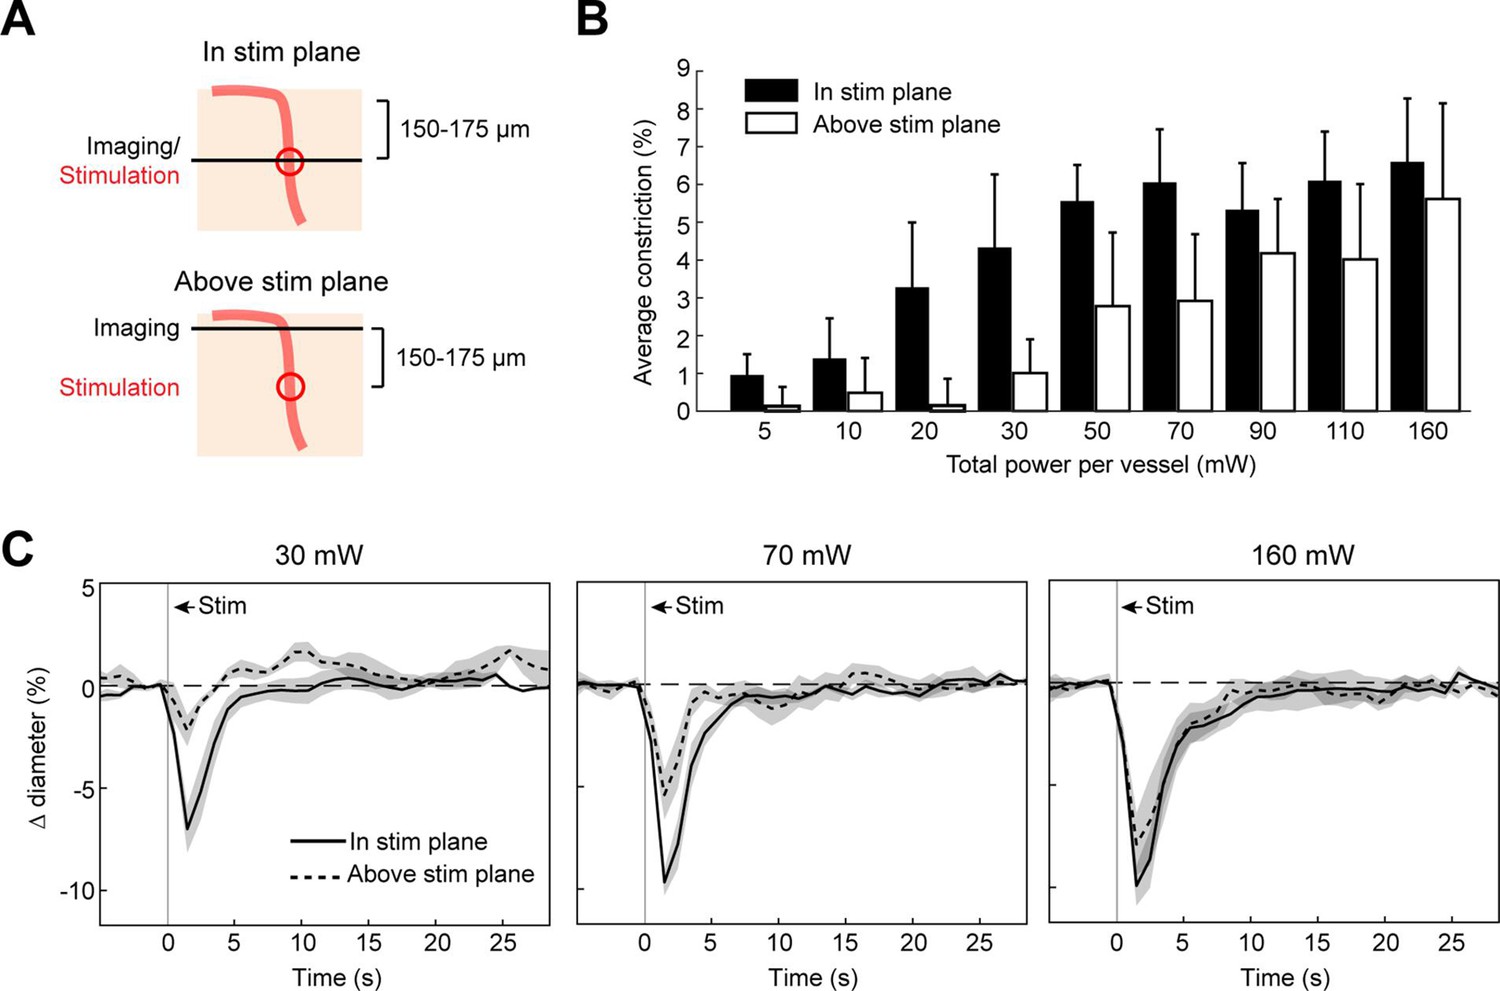
Axial spread of two-photon optogenetic activation.
(A) Penetrating arterioles were stimulated using the spatial light modulator (SLM) (100 ms light pulse) 200 µm below the surface while imaging was performed at the stimulation plane (top) or 150–175 µm above the stimulation plane (bottom). (B) Average constriction from 0.5 to 3.5 s after stimulation across a range of powers. Three 15 µm diameter spots were placed on each arteriole and the total power to vessel is reported. (C) Time course of constriction at the stimulation plane and above the stimulation plane for penetrating arterioles at three different stimulation power levels. Data for B and C are average and standard deviation (seven repetitions) of four arterioles from two mice.
Figure 7—figure supplement 1
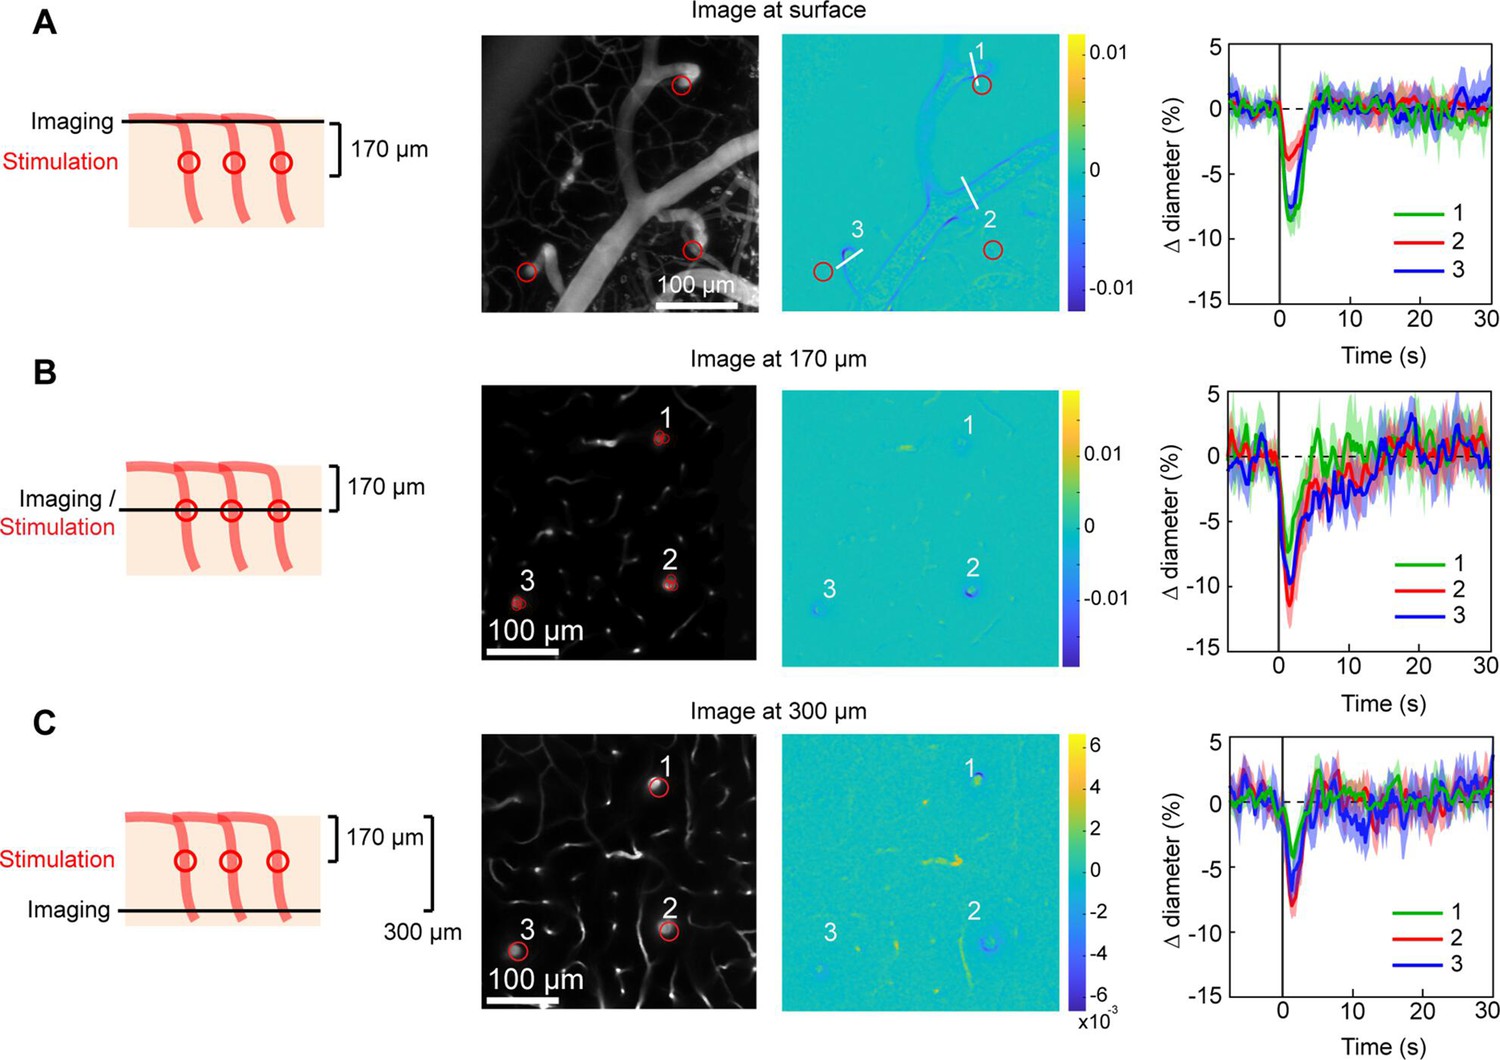
Broad axial constriction of penetrating arterioles with higher stimulation power.
Three penetrating arterioles were stimulated 170 µm below the surface while imaging at the cortical surface (A), in the stimulation plane (B), or 300 µm below the surface (C). Center-left panels show the Z-projection from the surface to 300 µm deep (A) or the single imaging plane (B, C). The red circles in A and C indicate the location of the three penetrating arterioles at the stimulation plane 170 µm below the surface. In B, the circles indicate the size and location of the stimulation spots. Total laser power to each arteriole was ~100 mW. Center-right panels are difference images. Right panels are time courses of constriction in the three vessels.
Figure 8
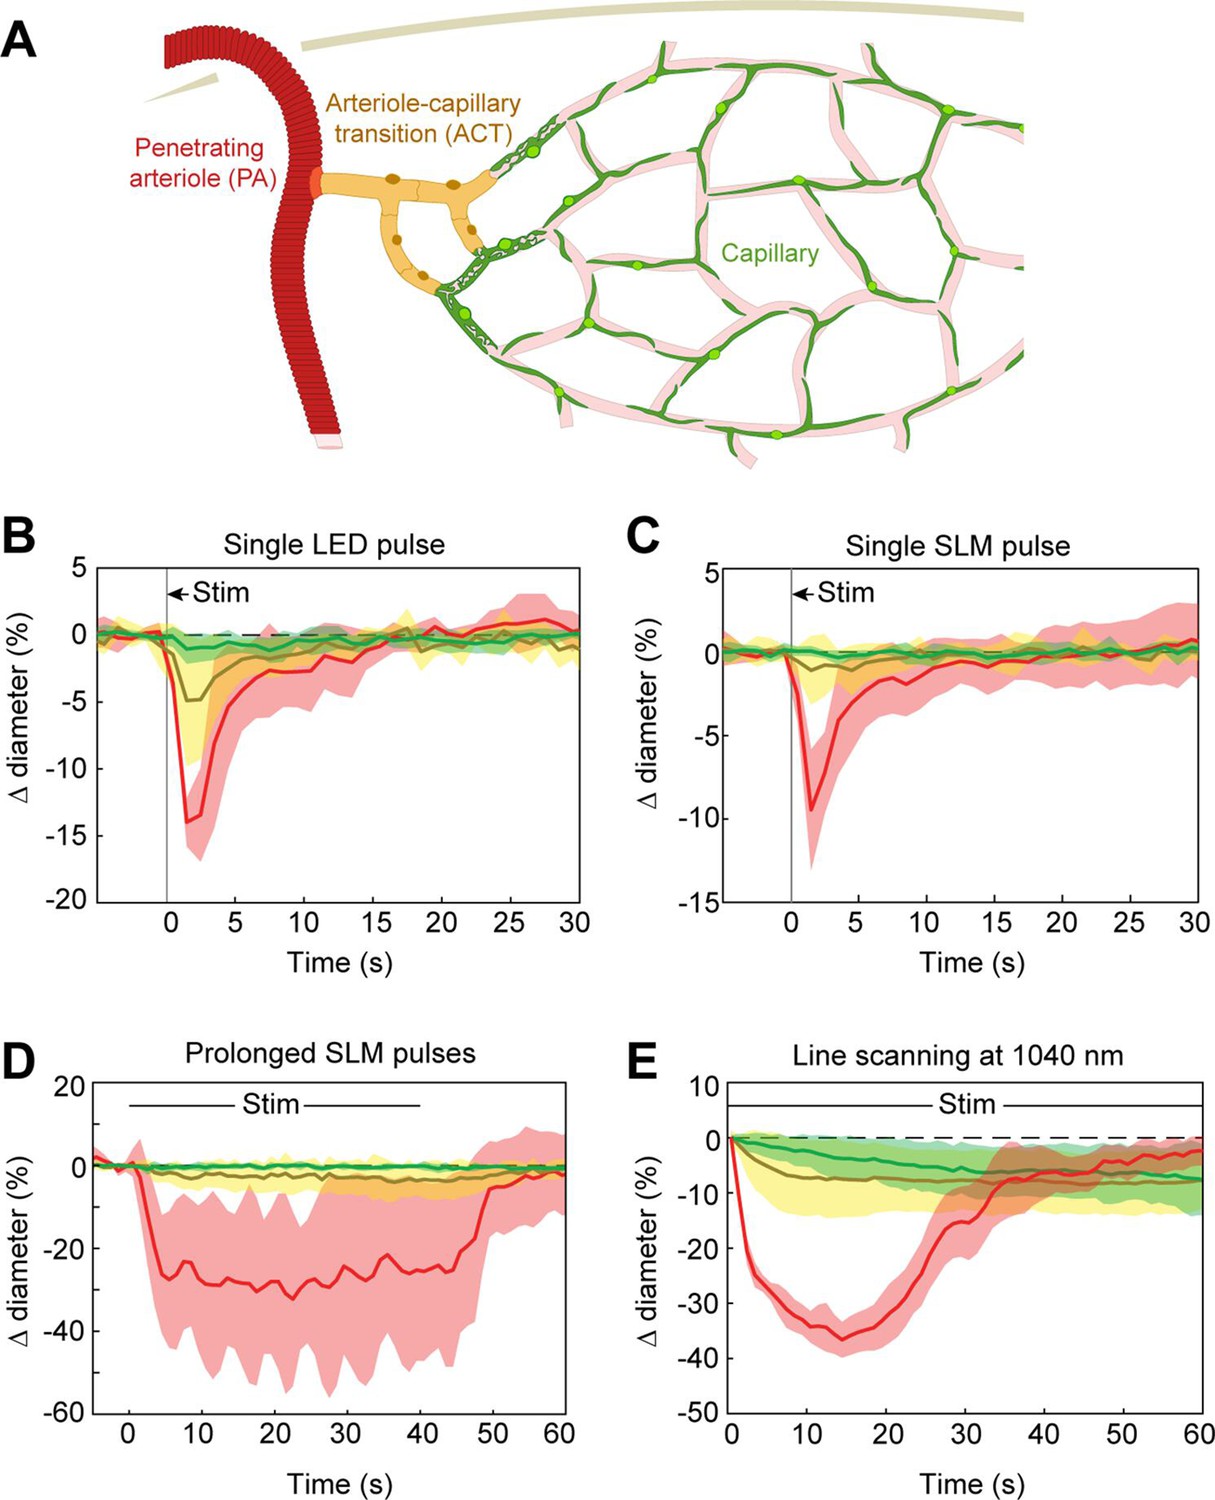
Optogenetic stimulation of vessels across microvascular zones.
(A) Schematic showing three microvascular zones examined with different stimulation paradigms. (B) Time course of constriction during a single 100 ms light-emitting diode (LED) pulse (N = 4 penetrating arterioles, N = 6 arteriole–capillary transition (ACT) vessels, and N = 9 capillaries). (C) Time course of constriction during a single 100 ms pulse using the spatial light modulator (SLM) (100–130 mW total power on each vessel) (N = 7 penetrating arterioles, N = 5 ACT vessels, and N = 4 capillaries). (D) Time course of constriction to repeated SLM pulses (100 ms pulses, 0.8–1.8 Hz, 40 s) (N = 3 penetrating arterioles, N = 6 ACT vessels, and N = 5 capillaries). (E) Time course of constriction to continuous line scanning (N = 9 penetrating arterioles, N = 24 ACT vessels, and N = 15 capillaries). Image collection and photoexcitation were simultaneously achieved with 1040 nm line scanning across vessels. Laser power varied from 10 to 120 mW with higher powers used for deeper vessels.
Figure 9
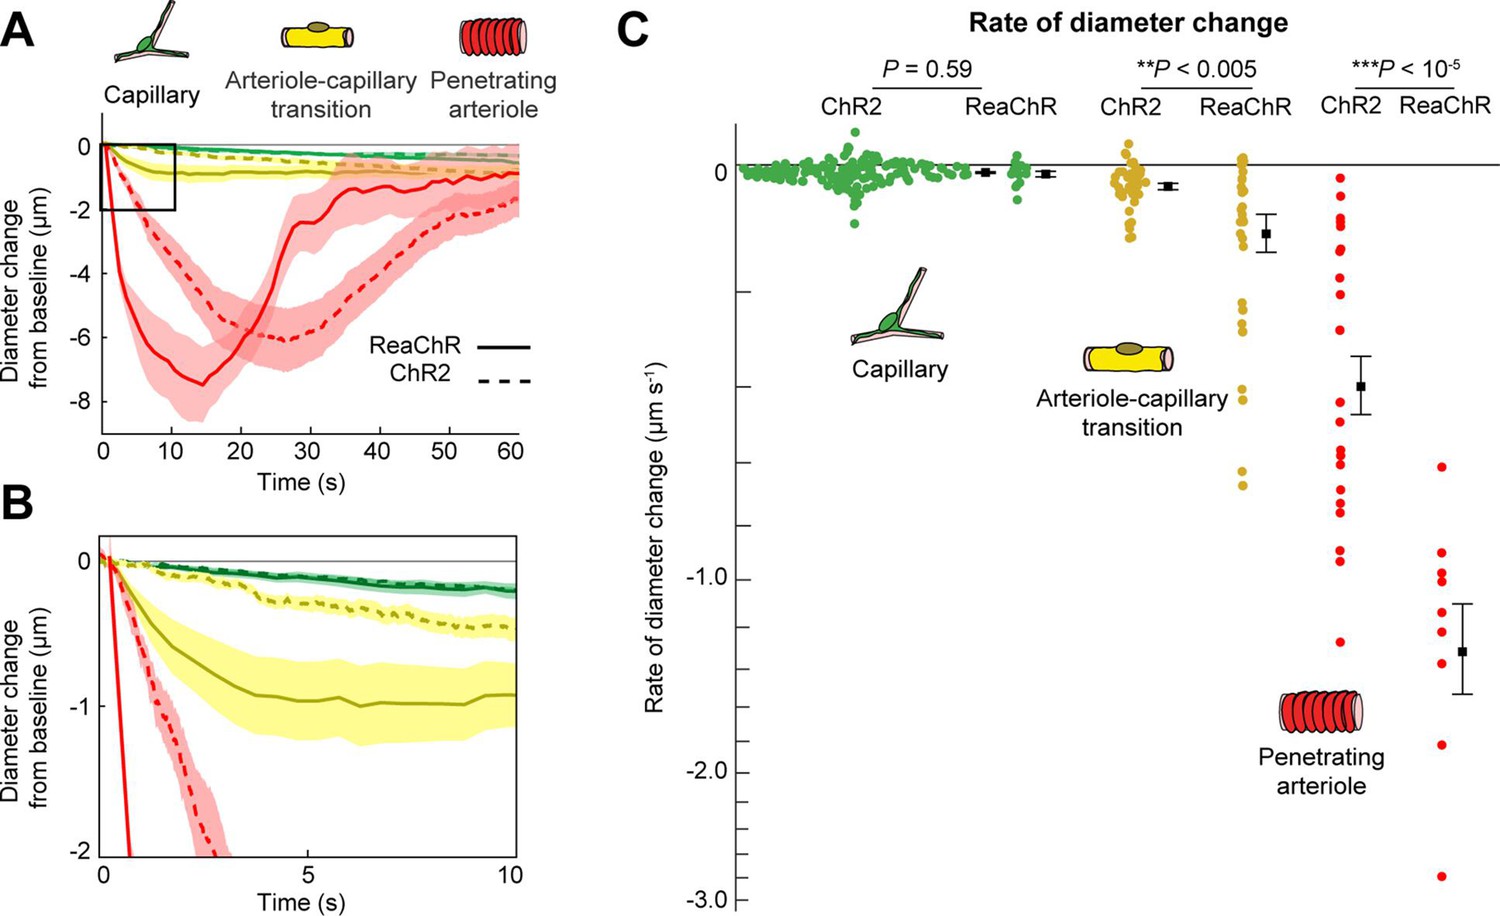
Comparison of ReaChR and ChR2 activation.
(A) Time course of constriction of three vessel classes covered by different mural cell types (ChR2 data from Hartmann et al., 2021; ReaChR data from line-scan stimulation in Figure 8E). Error bands are standard error of the mean (SEM). Peak constriction time for penetrating arterioles: ReaChR = 14.5 s, ChR2 = 26 s. (B) Inset showing zoomed view of the first 10 s of data. (C) Rate of diameter change for each vessel computed over the first 10 s for capillaries and arteriole–capillary transition (ACT) vessels, and over the first 5 s for penetrating arterioles. Black squares and error bars are mean and SEM. Mean values by group: Capillaries (−0.012 to −0.010 µm s−1 for ReaChR and ChR2, respectively); Transitional vessels (−0.10 to −0.03 µm s−1); Penetrating arterioles (−1.31 to −0.40 µm s−1). Results from one-way analysis of variance (ANOVA) on opsin type for each vessel class are shown.
Figure 10
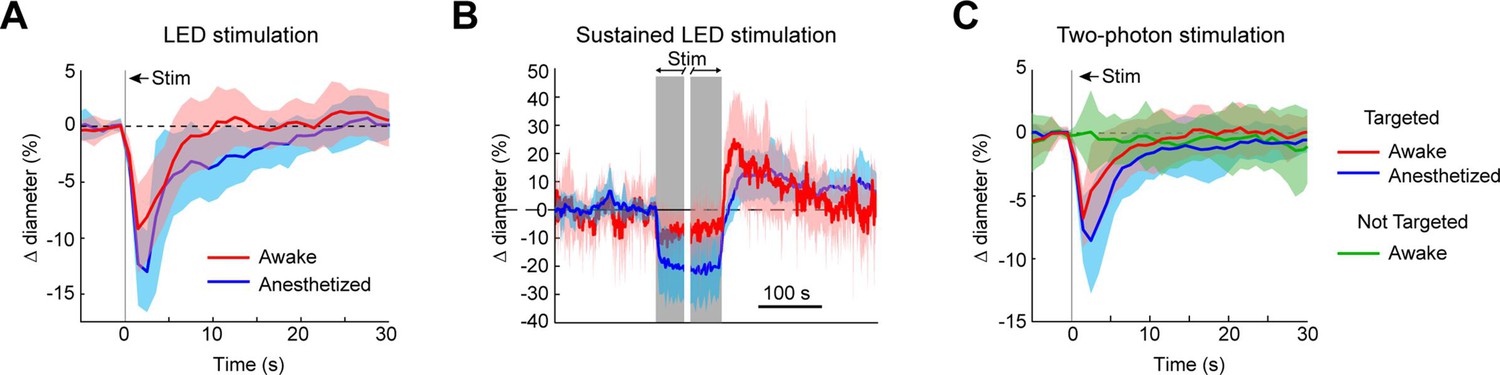
Optogenetic activation of vasculature in awake versus anesthetized mice.
(A) Constriction of surface arterioles in awake and anesthetized mice to a 100 ms pulse from the light-emitting diode (LED). Anesthetized data from Figure 2D. Awake: N = 16 vessels in 2 animals. Population mean ± standard error of the mean (SEM) from 1 to 5 s following stimulation: 6.5 ± 0.6%. (B) Constriction to prolonged repeated pulses (100 ms, 0.43–0.6 Hz, 56–145 s). Since different stimulus durations were used across animals, the time courses are aligned by onset and then by offset. N = 14 vessels from 7 animals. Anesthetized data from Figure 2I. (C) Single-vessel precision in awake animals. Average constriction of 14 vessels from 3 animals to a 100 ms pulse of two-photon stimulation using the spatial light modulator (SLM) when targeted with the light (red) and when not targeted (green). Population mean ± SEM: Targeted arterioles = 4.3 ± 0.5%; Not targeted = 0.3 ± 0.5%. Anesthetized data from Figure 4I.
Figure 11 with 2 supplements
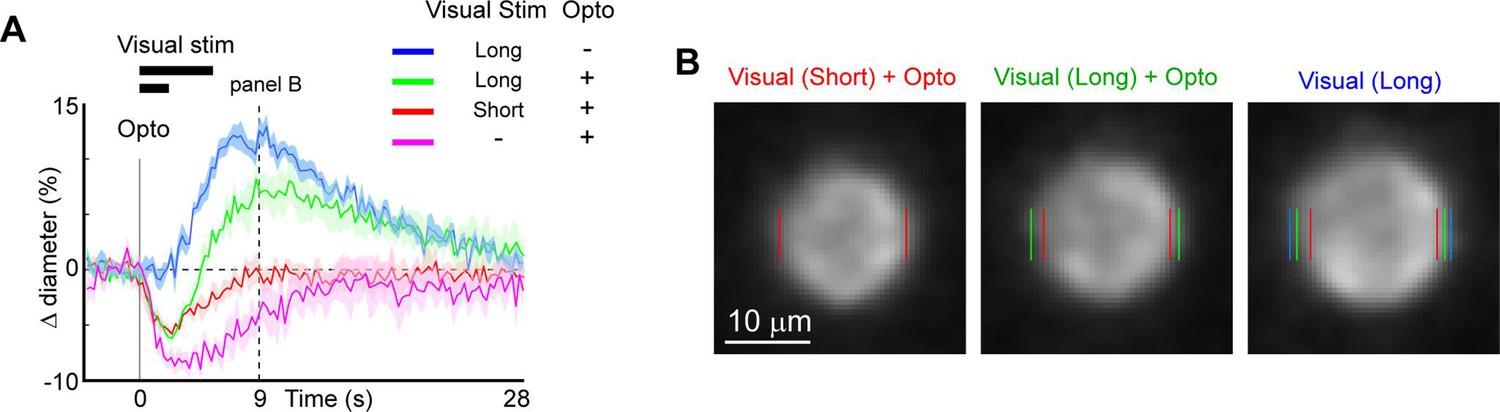
Modulation of sensory-evoked vasodilation using optogenetics.
(A) Pairing optogenetic stimulation with visual stimulation leads to reduced (green) or eliminated (red) visually evoked dilations compared to visual stimulation alone (blue). Vertical gray band at time 0 is optogenetic stimulation interval (100 ms) and black horizontal bars indicate visual stimulation duration (5 or 2 s, corresponding to long and short, respectively). Vertical dashed line at 9 s indicates time point of images shown in B. (B) Single-frame images showing penetrating arteriole 9 s after stimulus onset for the conditions with visual stimulation. Colored lines indicate the computed diameter of the vessel cross-section in the image.
Figure 11—figure supplement 1
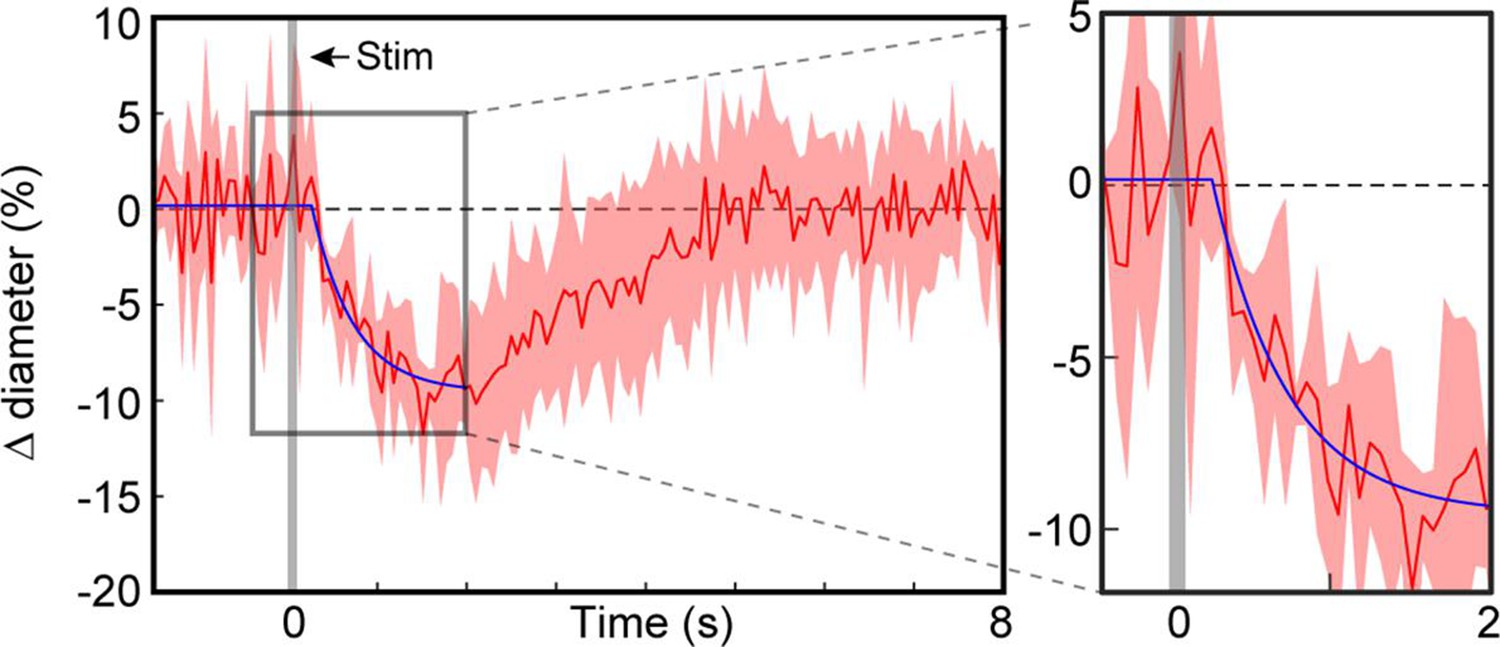
Speed of optogenetic constriction.
Time course of average of five arterioles that were imaged at high speed (15 Hz) to determine onset latency. Error band is standard deviation across runs. Blue curve is the fit to the data (see Methods). Vertical gray band is 100 ms light pulse. Right panel: Zoomed in view of plot around onset time for better visualization. Onset latency was computed as the point where the linear phase of the fit (baseline level) transitioned to the exponential phase (266 ms; 95% CI: 109–423 ms).
Figure 11—figure supplement 2
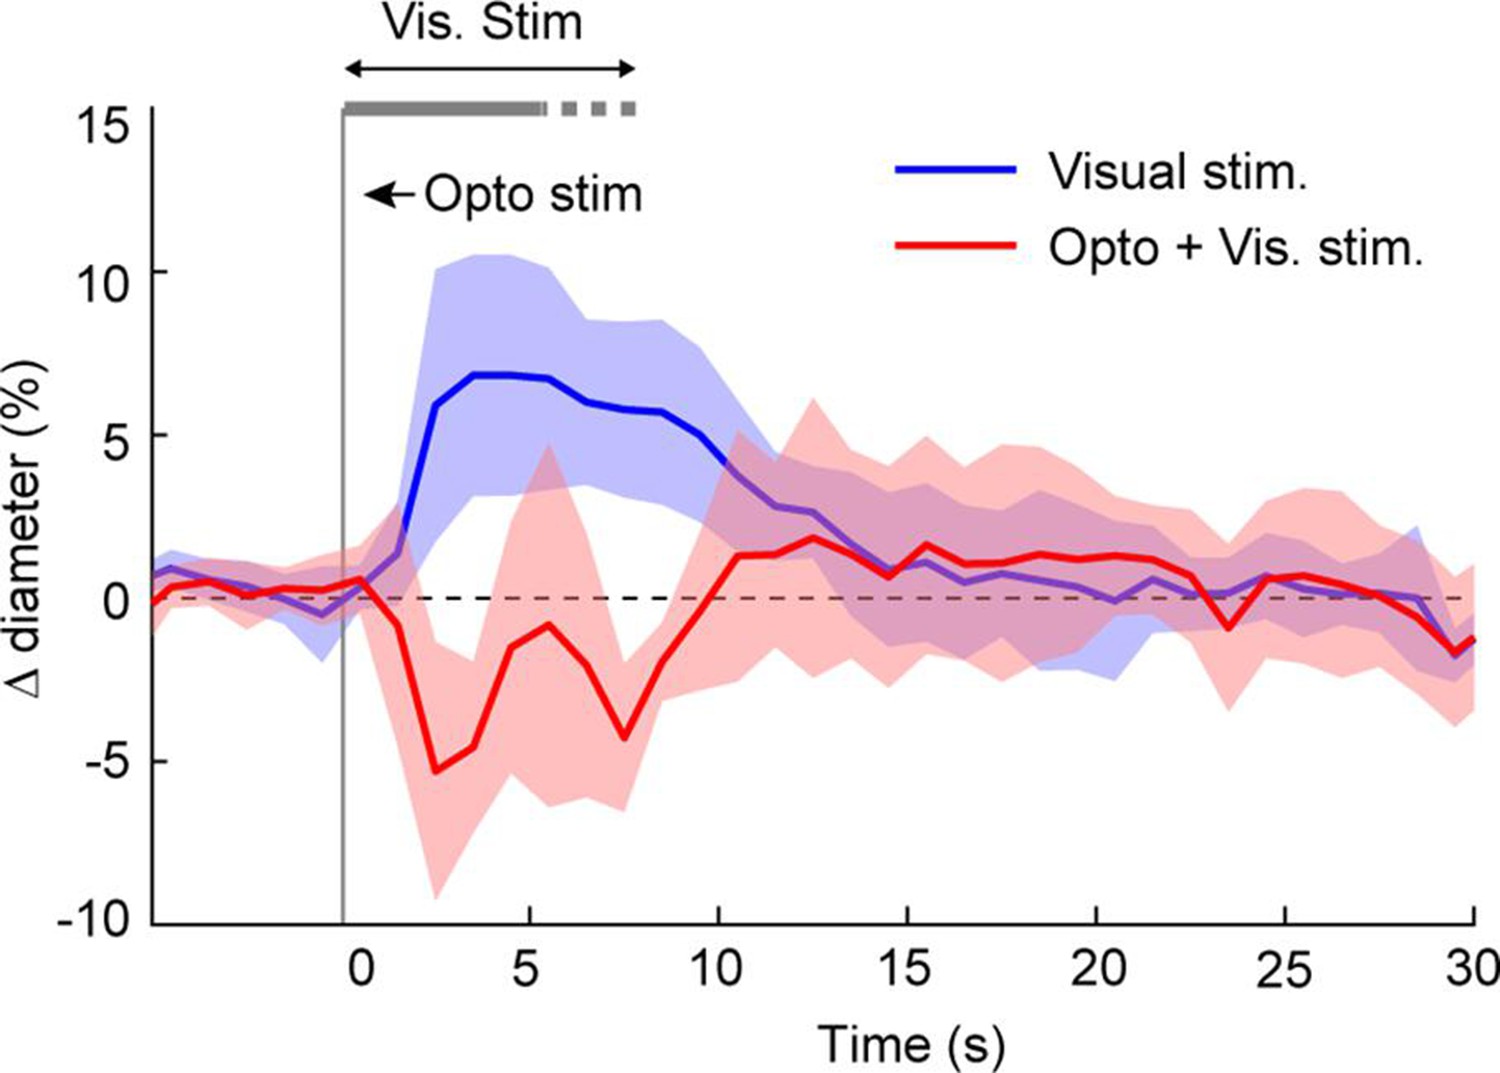
Offsetting functional hyperemia with optogenetic activation of mural cells – population data.
Population average (10 arterioles in 6 animals) diameter change to visual stimuli alone (blue) and when combined with optogenetic pulses (red: 1–3 100 ms pulses). Vertical gray band is the interval of the initial optogenetic stimulation pulse. Horizontal gray band is visual stimulus duration. The dashed right end indicates the range over which the visual stimuli ended in different animals (5–8 s). For a given vessel, the visual stimulus duration was the same in both conditions.
Videos
Video 1
Full-field activation with the 594 nm light-emitting diode (LED) in a PDGFRβ/ReaChR mouse.
Image is looking down at pial surface vessels in the neocortex labeled with fluorescein isothiocyanate (FITC) dextran. A single 100 ms pulse from the 549 nm LED was used to stimulate the vessels. In this and other videos, the dark flash indicates the time of the optical stimulation. The image darkens because the detectors are briefly blocked by mechanical shutters to protect them from the intense stimulation light. This and subsequent videos are presented at 4× real time. Video is 755 μm x 755 μm window.
Video 2
Constriction of a penetrating arteriole 100 µm below the surface with the 594 nm light-emitting diode (LED).
5 pulses, 100 ms duration with 100 ms in between were presented. Video is a 378 μm x 378 μm window.
Video 3
The same vessel as Video 2 was stimulated with 10 sets of 5 pulses, with 4 s between the onset of the pulse trains.
Power and duration of pulses as in Video 2.
Video 4
Two-photon activation leads to focal constriction.
The spatial light modulator (SLM) focused six spots at the location indicated by the red arrow. The total stimulation power was ~200 mW spread over the six spots with three adjacent spots on either side of the vessel. Each spot was scanned in a 12-µm diameter spiral for 100 ms. The white arrow is for comparison with Video 5. Vessels are labeled with Texas Red-dextran. Video is a 240 μm x 240 μm window.
Video 5
The same field-of-view as Video 4 but here a different branch of the pial artery is stimulated (red arrow).
Total power was ~75 mW spread out over three spots positioned on the branch stub and three off-target spots. The white arrow indicates the location stimulated in Video 4 for comparison.
Additional files
-
Transparent reporting form
- https://cdn.elifesciences.org/articles/72802/elife-72802-transrepform1-v1.docx
-
Source data 1
Individual vessel data used in the population plots.
- https://cdn.elifesciences.org/articles/72802/elife-72802-data1-v1.xlsx
Download links
A two-part list of links to download the article, or parts of the article, in various formats.
Downloads (link to download the article as PDF)
Open citations (links to open the citations from this article in various online reference manager services)
Cite this article (links to download the citations from this article in formats compatible with various reference manager tools)
3D optogenetic control of arteriole diameter in vivo
eLife 11:e72802.
https://doi.org/10.7554/eLife.72802


