The decoy SNARE Tomosyn sets tonic versus phasic release properties and is required for homeostatic synaptic plasticity
- Department of Brain and Cognitive Sciences, The Picower Institute of Learning and Memory, Massachusetts Institute of Technology, United States
- Department of Biology, Massachusetts Institute of Technology, United States
Figures
Figure 1
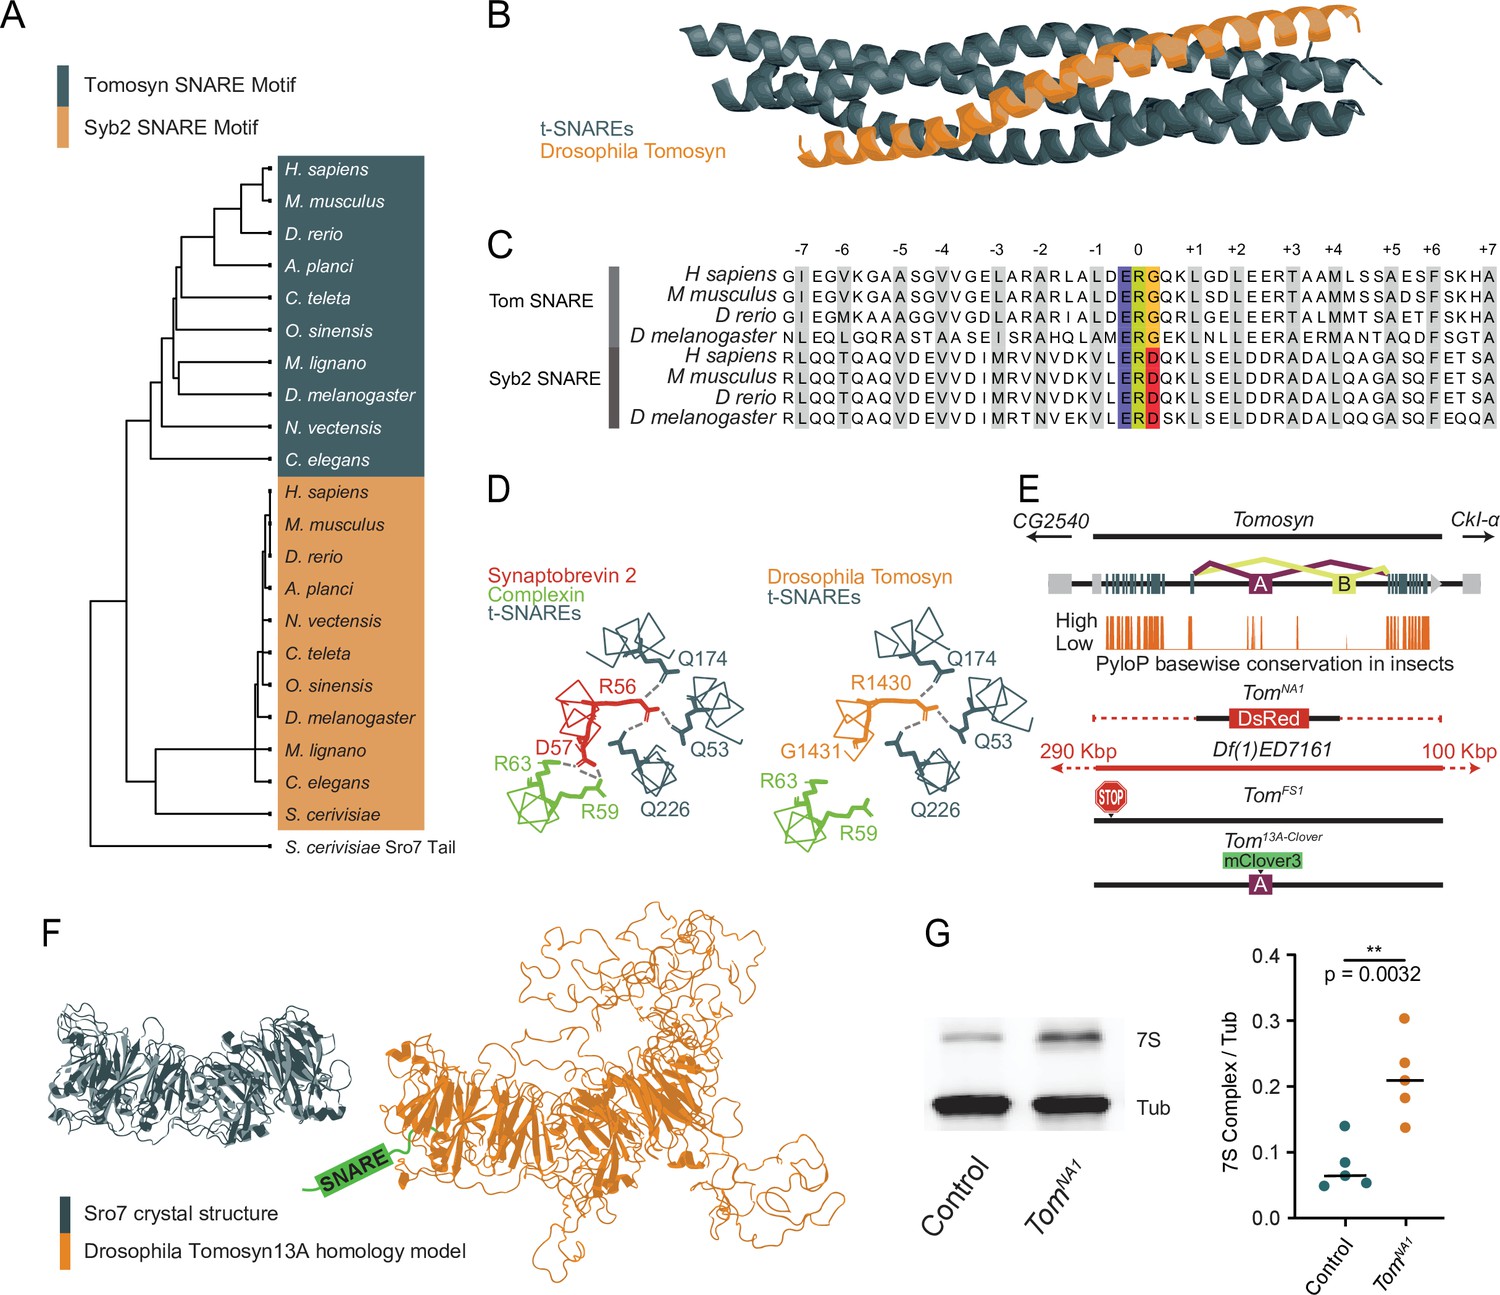
Generation of mutations in the conserved Drosophila omosyn homolog.
(A) BLOSUM62 alignment tree of Tomosyn and Syb2 SNARE motifs across the indicated species. The C-terminal tail of Saccharomyces cerevisiae Sro7 was used as an outgroup (B) Homology model of the Drosophila Tomosyn SNARE domain in complex with Syx1A and SNAP-25. (C) Sequence alignment between the SNARE domains of Tomosyn and Syb2 from humans (Homo sapiens), mouse (Mus musculus), zebrafish (Danio rerio), and Drosophila (Drosophila melanogaster). (D) Complexin interaction site with the Syb2 SNARE complex compared to the Tomosyn/t-SNARE complex (adapted from data shown in Figure 5A of Pobbati et al., 2004). (E) Genomic structure of Drosophila tomosyn shows mutually exclusive splicing at coding exon 13 (top). Basewise conservation of tomosyn across insect genomes using PhyloP (middle). Diagram of tomosyn CRIPSR mutants, including tomosynNA1 that replaces the locus with a DsRed cassette and tomosynFS1 with an early frameshift stop codon. A deficiency (Df(1)ED7161) spanning the locus is also shown. (F) Structure of the S. cerevisiae L(2)GL scaffold protein Sro7 (left, adapted from Figure 1C of Hattendorf et al., 2007) and iterative homology model of Drosophila Tomosyn13A (right, adapted from Figure 1B of Williams et al., 2011). (G) Representative Western blot of adult brain lysates stained with anti-Syx1A to label the 7 S SNARE complex and anti-Tubulin as a loading control. The ratio of 7 S complex/Tubulin intensity for control (0.06528, 0.07891±0.01658, n=5 samples, 10 brains per sample) and tomosynNA1 (0.2082, 0.2127±0.06183, n=5 samples, 10 brains per sample; Student’s t test, p=0.0032) is shown on the right (Figure 1—source data 1, Figure 1—source data 2, Figure 1—source data 3). The median is plotted in all figures, with statistical data reported as the median, mean ± SEM.
-
Figure 1—source data 1
Complete data for panel G.
- https://cdn.elifesciences.org/articles/72841/elife-72841-fig1-data1-v2.xlsx
-
Figure 1—source data 2
Western for panel G.
- https://cdn.elifesciences.org/articles/72841/elife-72841-fig1-data2-v2.pdf
-
Figure 1—source data 3
Western region used for panel G.
- https://cdn.elifesciences.org/articles/72841/elife-72841-fig1-data3-v2.pdf
Figure 2 with 1 supplement
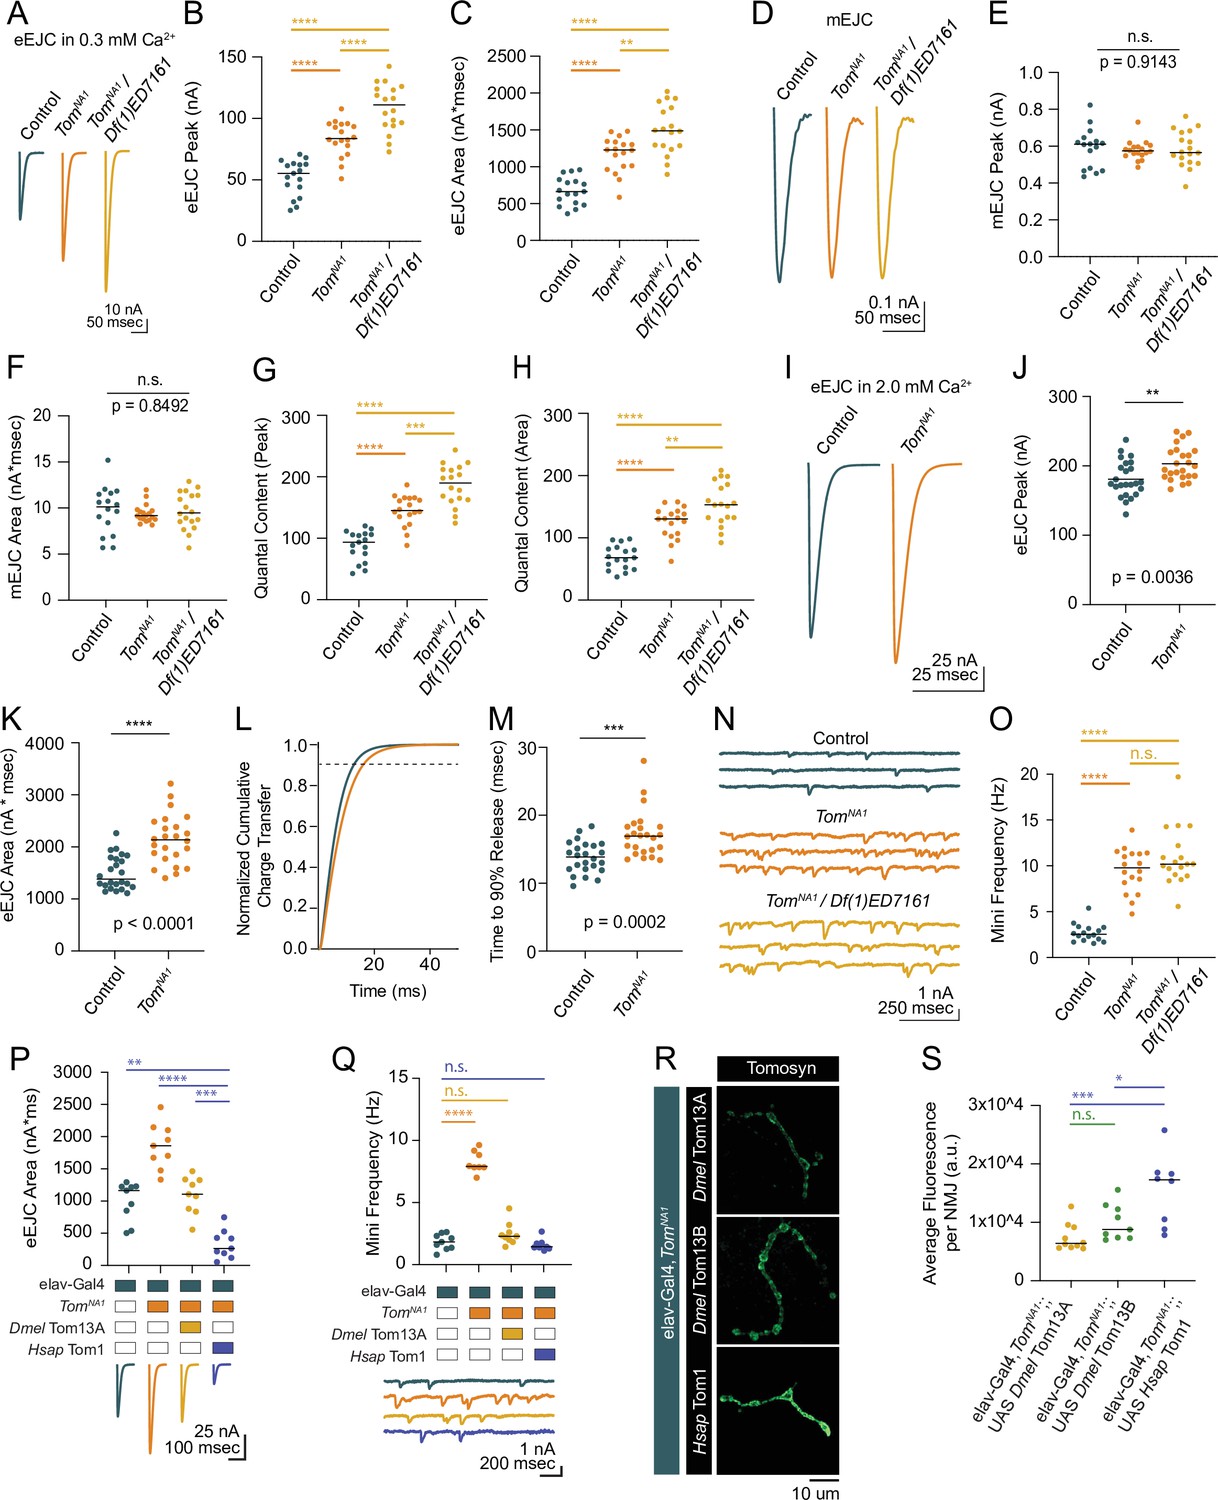
Tomosyn mutants show elevated evoked and spontaneous neurotransmitter release.
(A) Average evoked eEJC traces in 0.3 mM Ca2+. (B) Quantification of average eEJC peak amplitude (nA) per neuromuscular junction (NMJ) in 0.3 mM Ca2+ (control: 55.3, 51.78±3.522, n=17; tomosynNA1: 83.74, 83.74±3.378, n=18; tomosynNA1/Df(1)ED7161: 111.0, 108.8±4.578, n=18; p<0.0001; ≥10 larvae per group). (C) Quantification of average eEJC area (nA*msec) per NMJ in 0.3 mM Ca2+ (control: 663.2, 670.7±45.60, n=17; tomosynNA1: 1228, 1167±56.66, n=18; tomosynNA1/Df(1)ED7161: 1488, 1499±78.35, n=18; p<0.0001; ≥10 larvae per group). (D) Average mEJC traces. (E) Quantification of average mEJC peak amplitude (nA) per NMJ (control: 0.6104, 0.5898±0.02706, n=16; tomosynNA1: 0.5985, 0.5771±0.01221, n=18; tomosynNA1/Df(1)ED7161: 0.5657, 0.5846±0.02287, n=18; p=0.9143; ≥10 larvae per group). (F) Quantification of average mEJC area (nA*msecs) per NMJ (control: 10.12, 9.743±0.6477, n=16; tomosynNA1: 9.172, 9.396±0.2328, n=18; tomosynNA1/ Df(1)ED7161: 9.476, 9.697±0.4741, n=18; p=0.8496; ≥10 larvae per group). (G) Quantification of evoked quantal content in 0.3 mM Ca2+ per NMJ calculated using peak EJC (control: 93.75, 87.79±5.971, n=17; tomosynNA1: 145.1, 145.1±5.854 n=18; tomosynNA1/Df(1)ED7161: 189.9, 186.2±7.831, n=18; p<0.0001; ≥10 larvae per group). (H) Quantification of evoked quantal content in 0.3 mM Ca2+ per NMJ calculated using EJC area (control: 68.07, 68.84±4.680, n=17; tomosynNA1: 130.7, 124.2±6.030, n=18; tomosynNA1/Df(1)ED7161: 153.5, 154.6± 8.080, n=18; p<0.0001; ≥10 larvae per group). (I) Average eEJC traces in 2.0 mM Ca2+. (J) Quantification of average eEJC peak amplitude (nA) per NMJ in 2.0 mM Ca2+ (control: 174.4, 181.0±5.313, n=24; tomosynNA1: 197.1, 203.2±4.948 n=24; p=0.0036; ≥18 larvae per group). (K) Quantification of average eEJC area (nA*msec) per NMJ in 2.0 mM Ca2+ (control: 1372, 1496±66.60, n=24; tomosynNA1: 2134, 2140±97.90, n=24; p<0.0001; ≥18 larvae per group). (L) Normalized cumulative charge transfer of average eEJC in 2.0 mM Ca2+; dashed line represents 90% cumulative release. (M) Quantification of time (msec) when average eEJC reaches 90% charge transfer per NMJ in 2.0 mM Ca2+ (control: 13.85, 13.79±0.4711, n=24; tomosynNA1: 16.95, 17.19±0.7025, n=24; p=0.0002; ≥18 larvae per group). (N) Representative mEJC traces. (O) Quantification of mEJC frequency (Hz) per NMJ (control: 2.547, 2.701±0.2436, n=16; tomosynNA1: 9.783, 9.522±0.5590, n=18; tomosynNA1/Df(1)ED7161: 10.19, 10.97±0.7395, n=18; p< 0.0001; ≥10 larvae per group). (P) Quantification of evoked peak current amplitude (nA) in 0.3 mM Ca2+ in controls, tomosynNA1 mutants and tomosynNA1 mutants rescued with Drosophila (Dmel Tom13A) or human (Hsap Tom1) tomosyn (elav-Gal4: 1165, 996.6±101.7, n=9; elav-Gal4,tomosynNA1: 1860, 1856±117.2, n=9; elav-Gal4,tomosynNA1>UAS-Drosophila Tom13A: 1106, 1093±96.98, n=9 NMJs; elav-Gal4,tomosynNA1>UAS-Human Tom1: 262.7, 330 ± 73.47, n = 9; P < 0.0001; ≥ 5 larvae per group). (Q) Quantification of mEJC rate (Hz) (elav-Gal4: 1.833, 1.836 ± 0.2098, n = 9; elav-Gal4,tomosynNA1: 7.901, 8.268 ± 0.3066, n = 9; elav-Gal4,tomosynNA1> UAS-DmelTom13A: 2.300, 2.497 ± 0.3029, n = 9; elav-Gal4,tomosynNA1> UAS-HsapTom1: 1.438, 1.605 ± 0.1487, n = 9; p < 0.0001; ≥ 5 larvae per group). (R) Representative confocal images of Myc-tagged Drosophila (Dmel Tom13A and Dmel Tom13B) and human (Hsap Tom1) Tomosyn rescue constructs at 3rd instar NMJs. (S) Quantification of fluorescence intensity (arbitrary fluorescence units) of Myc-tagged Tomosyn rescue constructs (elav-Gal4,tomosynNA1> UAS Dmel Tom13A: 6391, 7437 ± 742.9, n = 10; elav-Gal4,tomosynNA1> UAS-DmelTom13B: 8764, 10,003 ± 1013,, n = 9; elav-Gal4,tomosynNA1> UAS Hsap Tom1: 17,253, 15,528 ± 2141,, n = 8; p = 0.001; ≥ 6 larvae per group). Complete data for this figure provided in Figure 2—source data 1.
-
Figure 2—source data 1
Source data for Figure 2.
- https://cdn.elifesciences.org/articles/72841/elife-72841-fig2-data1-v2.xlsx
Figure 2—figure supplement 1
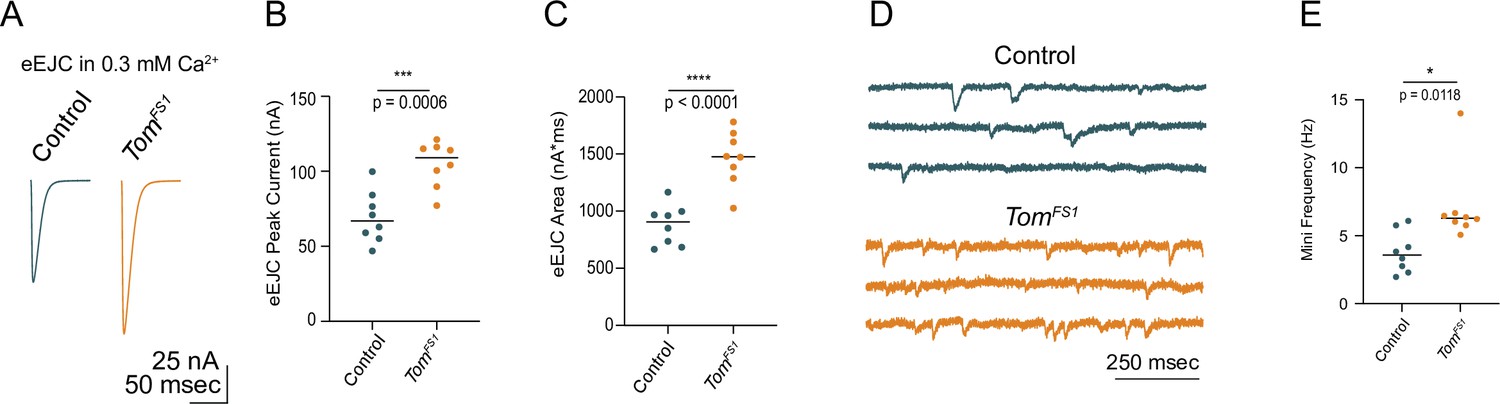
TomosynFS1 null mutants display elevated evoked and spontaneous neurotransmitter release.
(A) Average eEJC traces in 0.3 mM Ca2+. (B) Quantification of average eEJC peak amplitude (nA) per NMJ in 0.3 mM Ca2+ (control: 66.93, 69.45 ± 6.062,l n = 8; tomosynFS1: 109.1, 104.8 ± 5.333, n = 8; P = 0.0006; ≥ 4 larvae per group). (C) Quantification of average eEJC area (nA*msec) per NMJ in 0.3 mM Ca2+ (control: 906.1, 878.3 ± 62.09, n = 8; tomosynFS1: 1476, 1465 ± 84.26, n = 8; p < 0.0001; ≥ 4 larvae per group). (D) Representative mEJC traces. (E) Quantification of average mEJC peak amplitude (nA) per NMJ (control: 3.583, 3.779 ± 0.5376, n = 8; tomosynFS1: 6.300, 7.075 ± 1.005, n = 8; p = 0.0118; ≥ 4 larvae per group). Complete data for this figure provided in Figure 2—figure supplement 1—source data 1.
-
Figure 2—figure supplement 1—source data 1
Source data for Figure 2—figure supplement 1.
- https://cdn.elifesciences.org/articles/72841/elife-72841-fig2-figsupp1-data1-v2.xlsx
Figure 3 with 1 supplement
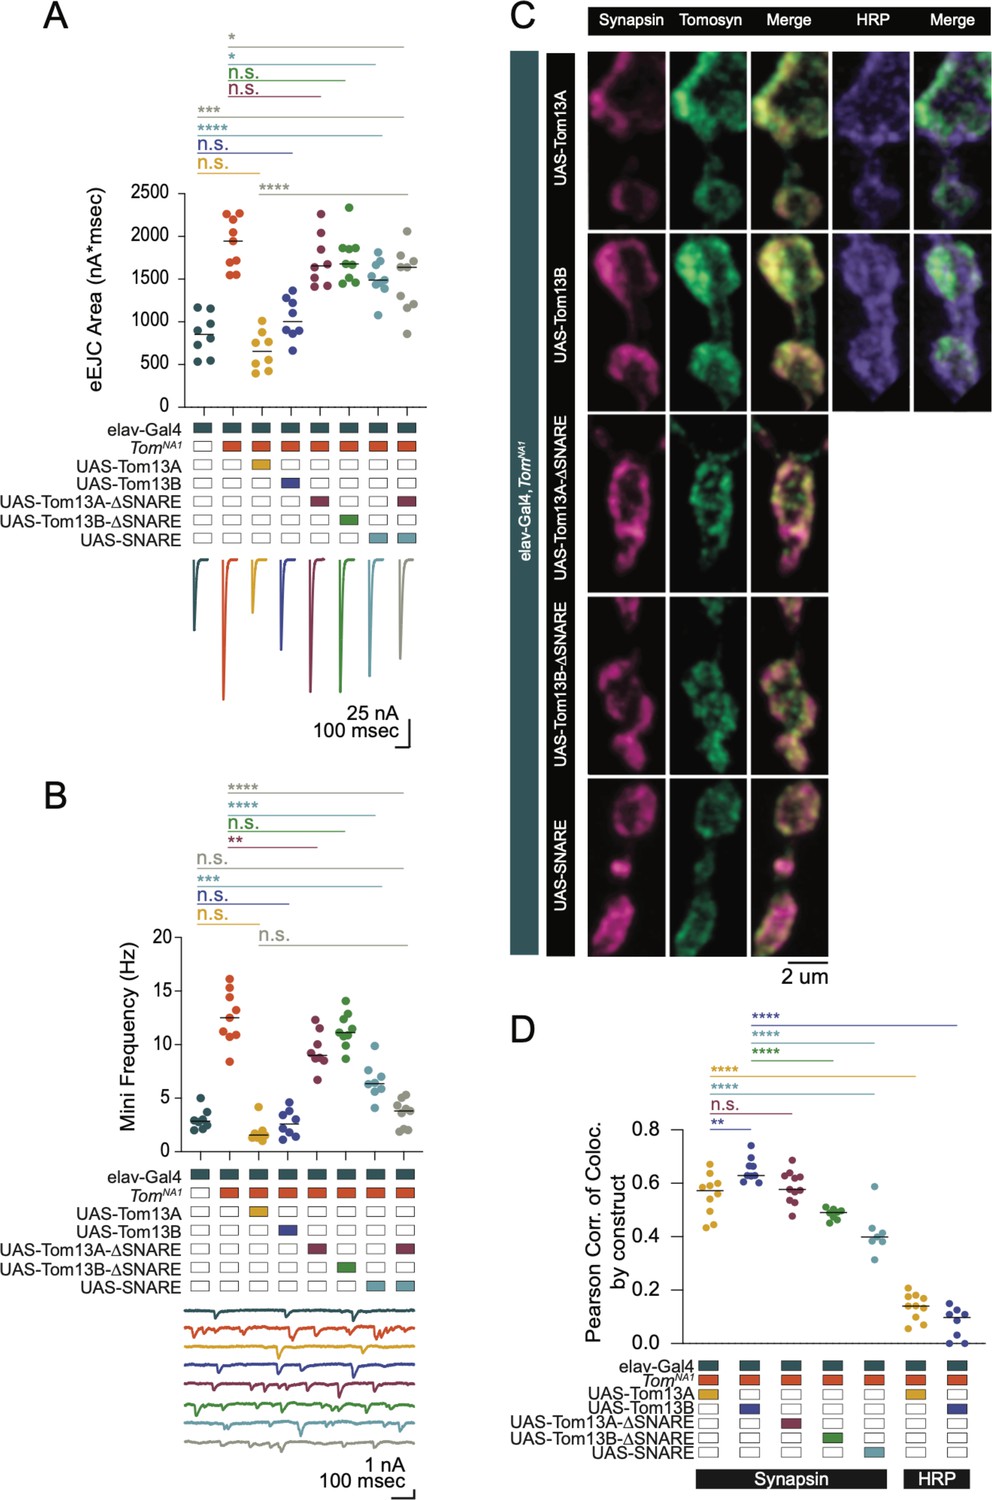
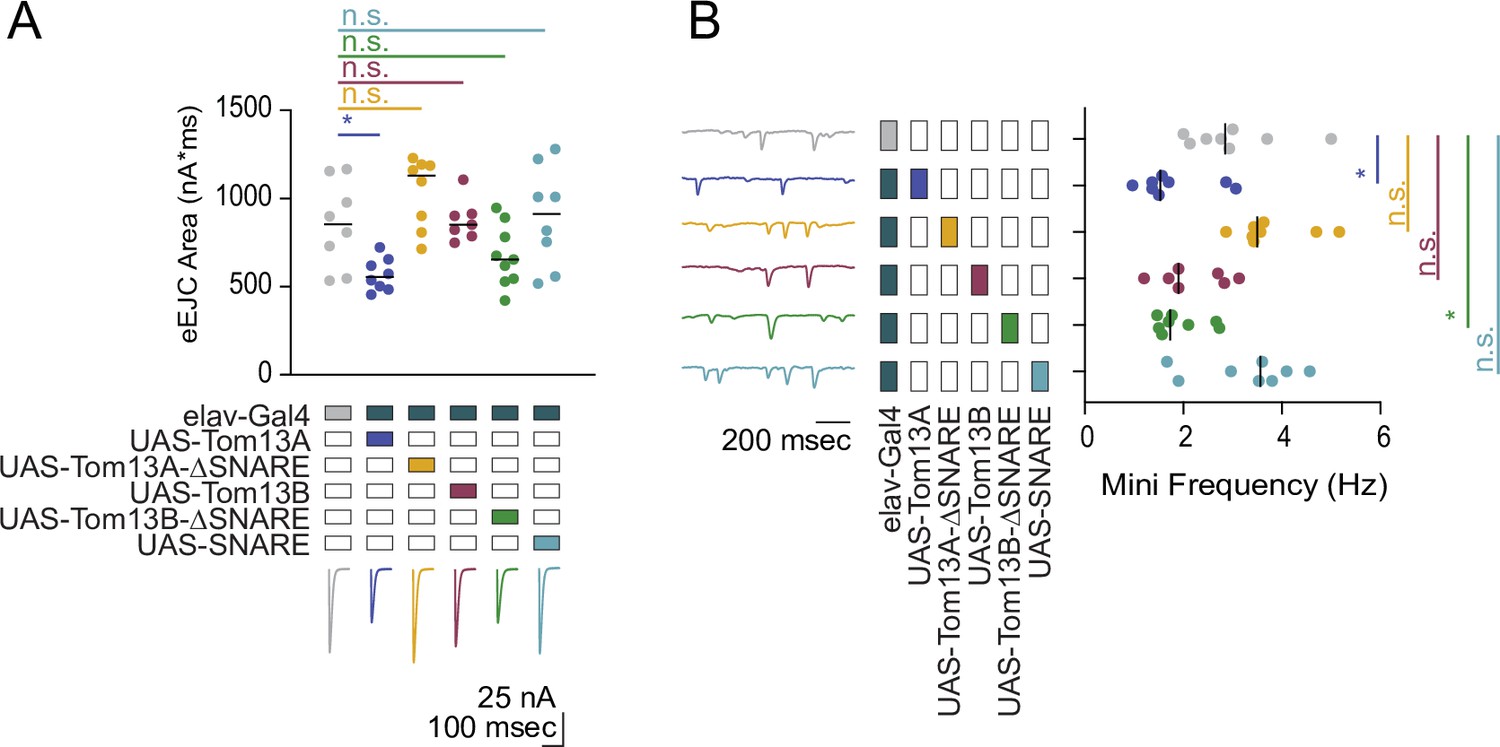
The Tomosyn SNARE domain mediates release suppression and the scaffold promotes SV enrichment.
(A) Quantification of evoked eJC area (nA*msec) in Tomosyn rescue lines in 0.3 mM Ca2+ (elav-Gal4: 853.9, 852.3 ± 86.62, n = 8; elav-Gal4,tomosynNA1: 1942, 1915 ± 98.61, n = 9; elav-Gal4,tomosynNA1> UAS-Tom13A: 655.2, 662.2 ± 79.03, n = 8; elav-Gal4,tomosynNA1> UAS-Tom13B: 1004, 1037 ± 86.03, n = 8; elav-Gal4,tomosynNA1> UAS-Tom13A-∆SNARE: 1656, 1726 ± 107.5, n = 8; elav-Gal4,tomosynNA1> UAS-Tom13B-∆SNARE: 1678, 1742 ± 92.94, n = 9; elav-Gal4,tomosynNA1> UAS-SNARE: 1488, 1508 ± 71.46, n = 9; elav-Gal4,tomosynNA1> UAS-SNARE,UAS-Tom13A: 1639, 1484 ± 124.5, n = 9; P < 0.0001; Šidak’s multiple comparisons test, p-values indicated in figure; ≥ 4 larvae per group). (B) Quantification of mEJC rate (Hz) (elav-Gal4: 2.850, 3.000 ± 0.3429, n = 8; elav-Gal4,tomosynNA1: 12.50, 12.54 ± 0.8283, n = 9; elav-Gal4,tomosynNA1> UAS-Tom13A: 1.550, 1.817 ± 0.3511, n = 8; elav-Gal4,tomosynNA1> UAS-Tom13B: 2.600, 2.671 ± 0.4371, n = 8; elav-Gal4,tomosynNA1> UAS-Tom13A-∆SNARE: 8.983, 9.467 ± 0.6319, n = 8; elav-Gal4,tomosynNA1> UAS-Tom13B-∆SNARE: 11.13, 11.34 ± 0.5356, n = 9; elav-Gal4,tomosynNA1> UAS-SNARE: 6.367, 6.596 ± 0.5937, n = 8; elav-Gal4,tomosynNA1> UAS-SNARE,UAS-Tom13A∆SNARE: 3.815, 3.571 ± 0.4309, n = 9; p < 0.0001; Šidak’s multiple comparisons test, p-values indicated in figure; ≥ 4 larvae per group). (C) Representative confocal images of NMJs immunostained for Tomosyn (anti-Myc), Synapsin (3C11) and HRP in tomosyn rescue lines (full-length Tomosyn 13 A and 13B: UAS-Tom13A and UAS-Tom13B; SNARE deletions of Tomosyn 13 A and 13B: UAS-Tom13A-∆SNARE and UAS-Tom13B-∆SNARE; SNARE domain alone: UAS-SNARE). (D) Pearson correlation of co-localization between Tomosyn rescue constructs and Synapsin (elav-Gal4,tomosynNA1> UAS-Tom13A: 0.05725, 0.5559 ± 0.02471, n = 10; elav-Gal4,tomosynNA1> UAS-Tom13B: 0.6290, 0.6509 ± 0.01516, n = 9; elav-Gal4,tomosynNA1> UAS-Tom13A-∆SNARE: 0.5770, 0.5869 ± 0.01794, n = 11; elav-Gal4,tomosynNA1> UAS-Tom13B-∆SNARE: 0.4905, 0.4850 ± 0.007283, n = 8; elav-Gal4,tomosynNA1> UAS-SNARE: 0.3990, 0.4161 ± 0.03189, n = 7) and between Tomosyn rescue constructs and HRP (elav-Gal4,tomosynNA1> UAS-Tom13A: 0.1405, 0.1372 ± 0.01571, n = 10; elav-Gal4,tomosynNA1> UAS-Tom13B: 0.09780, 0.07658 ± 0.02059, n = 8; p < 0.0001, Šidak’s multiple comparisons test, p-values indicated in figure; ≥ 6 larvae per group). Complete data for this figure provided in Figure 3—source data 1.
-
Figure 3—source data 1
Source data for Figure 3.
- https://cdn.elifesciences.org/articles/72841/elife-72841-fig3-data1-v2.xlsx
Figure 3—figure supplement 1
Tomosyn13A bidirectionally modulates evoked and spontaneous SV release.
(A) Quantification of evoked response area (nA*msec) after Tomosyn overexpression in 0.3 mM Ca2+. These experiments were performed in the same experiment as Figure 3C. The elav-Gal4 data is reproduced here for comparison (elav-Gal4: 853.9, 852.3 ± 86.62, n = 8; elav-Gal4> UAS-Tom13A: 555.3, 569.0 ± 32.45, n = 8; elav-Gal4> UAS-Tom13A-∆SNARE: 1130, 1037 ± 70.41, n = 8; elav-Gal4> UAS-Tom13B: 851.4, 876.1 ± 44.35, n = 7; elav-Gal4> UAS-Tom13B-∆SNARE: 654.0, 674.1 ± 57.48, n = 9; elav-Gal4> UAS-SNARE: 913.4, 896.7 ± 100.4, n = 8; p = 0.0003; Dunnett’s multiple comparisons test, p-values indicated in figure; ≥ 4 larvae per group). (B) Quantification of mEJC rate (Hz) following Tomosyn overexpression. These experiments were performed in the same experiment as Figure 3D. The elav-Gal4 data is reproduced here for comparison (elav-Gal4: 2.850, 3.000 ± 0.3429, n = 8; elav-Gal4> UAS-Tom13A: 1.533, 1.800 ± 0.2661, n = 8; elav-Gal4> UAS-Tom13A-∆SNARE: 3.500, 3.775 ± 0.2691, n = 8; elav-Gal4> UAS-Tom13B: 1.900, 2.195 ± 0.2651, n = 7; elav-Gal4> UAS-Tom13B-∆SNARE: 1.733, 1.938 ± 0.1807, n = 8; elav-Gal4> UAS-SNARE: 3.567, 3.267 ± 0.3627, n = 8; p < 0.0001; Dunnett’s multiple comparisons test, p-values indicated in figure; ≥ 4 larvae per group). Complete data for this figure provided in Figure 3—figure supplement 1—source data 1.
-
Figure 3—figure supplement 1—source data 1
Source data for Figure 3—figure supplement 1.
- https://cdn.elifesciences.org/articles/72841/elife-72841-fig3-figsupp1-data1-v2.xlsx
Figure 4 with 1 supplement
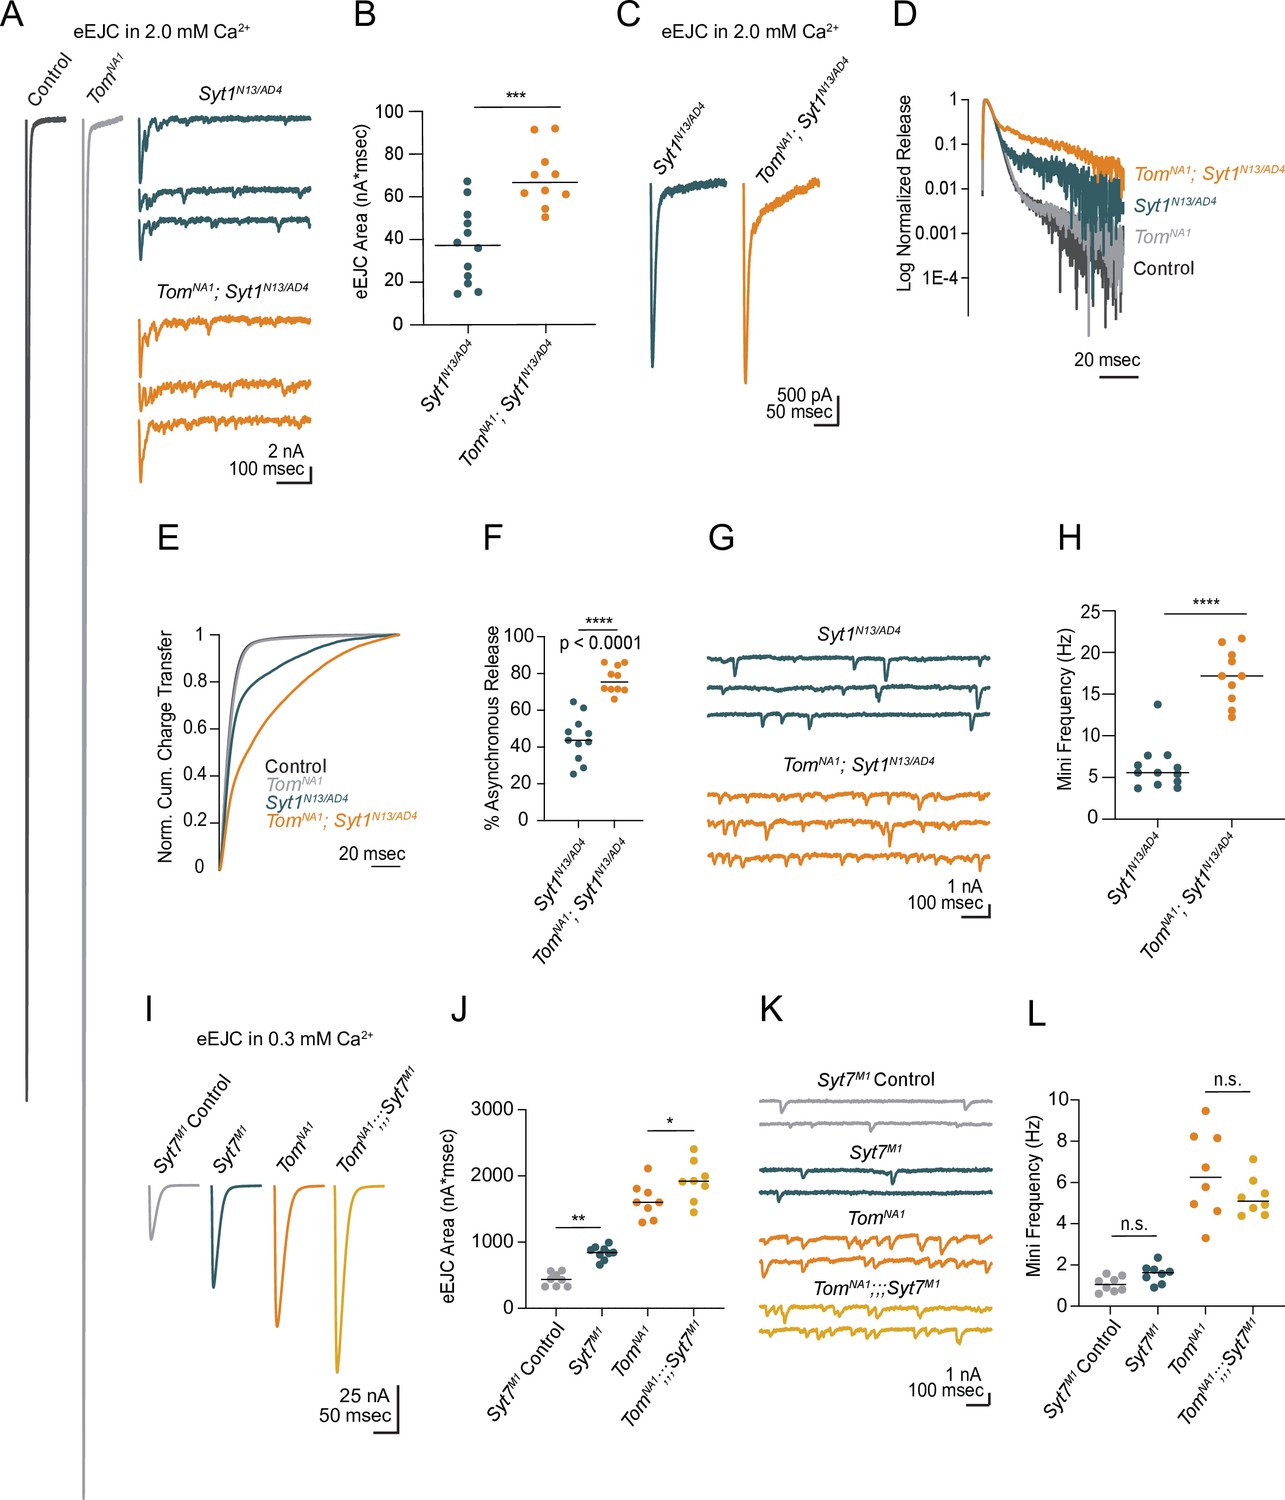
Tomosyn inhibits release independent of Synaptotagmin 1 and 7.
(A) Average evoked response in 2.0 mM Ca2+ for control and tomosynNA1 (left) compared to representative traces of syt1 nulls (Syt1N13/AD4) and tomosyn/syt1 double mutants (TomNA1;Syt1N13/AD4, right). (B) Quantification of average evoked response area (nA*msec) per NMJ in 2.0 mM Ca2+ (syt1N13/AD4: 37.22, 37.13 ± 5.139, n = 12; tomosynNA1/syt1N13/AD4: 66.59, 69.05 ± 4.471, n = 10; p = 0.0002; ≥ 5 larvae per group). (C) Average EJC response in 2.0 mM Ca2+. (D) Log normalized average evoked response in 2.0 mM Ca2+. (E) Normalized cumulative charge transfer for the average evoked response in 2.0 mM Ca2+. (F) The slow component of evoked release was identified by fitting a double logarithmic function to the average normalized cumulative charge transfer per NMJ in 2.0 mM Ca2+ and plotted as a percent of total charge transfer (syt1N13/AD4: 43.69, 44.55 ± 3.717, n = 11; tomosynNA1/syt1N13/AD4: 75.38, 76.72 ± 2.295, n = 10; p < 0.0001; ≥ 5 larvae per group). (G) Representative mEJC traces. (H) Quantification of mEJC rate (Hz) per NMJ (syt1N13/AD4: 5.567, 6.192 ± 0.7904, n = 12; tomosynNA1, syt1N13/AD4: 17.17, 17.17 ± 1.034, n = 10; p < 0.0001; ≥ 5 larvae per group). (I) Average evoked response in 0.3 mM Ca2+ of control (Syt7M1 control), syt7 null (Syt7M1), tomosyn null (tomosynNA1), and tomosyn/syt7 double null (tomosynNA1;;;Syt7M1). (J) Quantification of average evoked response area (nA*msec) per NMJ in 0.3 mM Ca2+ (control: 437.4, 437.4 ± 36.11, n = 8; syt7M1: 844.6, 840.4 ± 33.77, n = 9; tomosynNA1: 1602, 1627 ± 94.19, n = 8; tomosynNA1, syt7M1: 1920, 1923 ± 108.4, n = 8; p < 0.0001; ≥ 5 larvae per group). (K) Representative mEJC traces. (L) Quantification of mEJC rate per NMJ (Hz) (control: 1.056, 1.070 ± 0.1290, n = 8; syt7M1: 1.617, 1.569 ± 0.161, n = 8; tomosynNA1: 6.256, 6.404 ± 0.7475, n = 8; tomosynNA1, syt7M1: 5.092, 5.304 ± 0.3292, n = 8; p < 0.0001; ≥ 5 larvae per group). Complete data for this figure provided in Figure 4—source data 1.
-
Figure 4—source data 1
Source data for Figure 4.
- https://cdn.elifesciences.org/articles/72841/elife-72841-fig4-data1-v2.xlsx
Figure 4—figure supplement 1
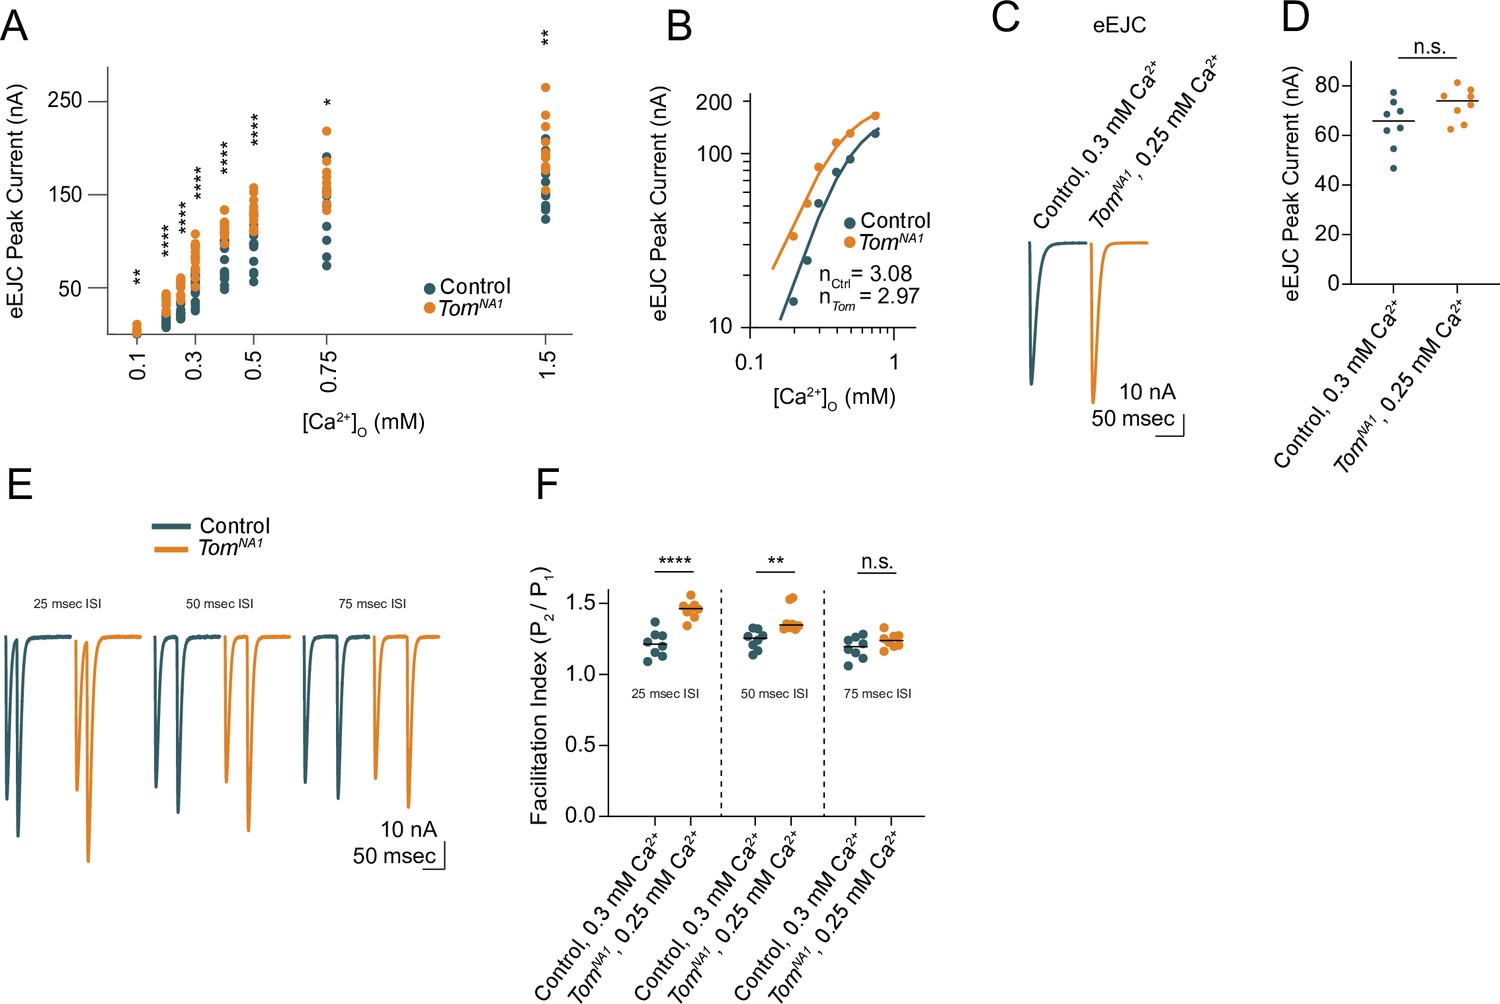
Tomosyn inhibits release in a Ca2+-independent mechanism.
(A) Quantification of average EJC peak amplitude (nA) per NMJ across a range of Ca2+ concentrations, including 0.1 mM (control: 0.7351, 0.8639 ± 0.1197, n = 12; tomosynNA1: 2.846, 3.779 ± 0.7682, n = 12; p = 0.0011; ≥ 7 larvae per group), 0.2 mM (control: 13.29, 14.14 ± 1.591, n = 12; tomosynNA1: 35.03, 33.49 ± 2.207, n = 13; p < 0.0001; ≥ 8 larvae per group), 0.25 mM (control: 22.87, 24.31 ± 1.876, n = 12; tomosynNA1: 54.26, 51.66 ± 2.273, n = 12; p < 0.0001; ≥ 7 larvae per group), 0.3 mM (control: 55.30, 51.78 ± 3.522, n = 17; tomosynNA1: 83.74, 83.74 ± 3.378, n = 128 p < 0.0001; ≥ 10 larvae per group), 0.4 mM (control: 73.90, 78.32 ± 5.599, n = 14; tomosynNA1: 114.7, 115.5 ± 3.090, n = 12; p < 0.0001; ≥ 10 larvae per group), 0.5 mM (control: 97.09, 92.87 ± 6.413, n = 12; tomosynNA1: 128.6, 130.7 ± 4.415, n = 12; p < 0.0001; ≥ 10 larvae per group), 0.75 mM (control: 139.3, 130.2 ± 11.49, n = 10; tomosynNA1: 159.8, 164.7 ± 7.758, n = 10; p = 0.0229; ≥ 7 larvae per group), and 1.5 mM (control: 150.5, 159.8 ± 8.010, n = 12; tomosynNA1: 191.2, 198.1 ± 8.781, n = 12; p = 0.0039; ≥ 7 larvae per group). (B) Log-log plot of evoked response peak amplitude across the Ca2+ range, fit with a four-parameter logistic regression. The Hill slope is not significantly different between groups (control: 3.08 ± 0.48; tomosynNA1: 2.97 ± 0.28; extra sum-of-squares F test, p = 0.8272). (C) Average evoked response in Ca2+ concentrations where first evoked response amplitude is similar between control and tomosynNA1 (0.3 mM for control, 0.25 mM for tomosynNA1). (D) Quantification of average EJC amplitude (nA) per NMJ (control, 0.3 mM Ca2+: 65.81, 64.44 ± 3.566, n = 8; tomosynNA1, 0.25 mM Ca2+: 74.02, 72.58 ± 2.346, n = 8; p = 0.0773; ≥ 7 larvae per group). (E) Representative paired-pulse recordings with interstimulus intervals (ISI) of 25 msec, 50 msec, and 75 ms. (F) Quantification of average facilitation index per NMJ, calculated as the fold change in evoked peak current amplitude between pulse 1 and pulse 2. Three different ISIs were tested, including 25 ms (control, 0.3 mM Ca2+: 1.214, 1.216 ± 0.03225, n = 8; tomosynNA1, 0.25 mM Ca2+: 1.463, 1.455 ± 0.02237, n = 8; p < 0.0001; ≥ 7 larvae per group), 50 ms (control, 0.3 mM Ca2+: 1.256, 1.244 ± 0.02428, n = 8; tomosynNA1, 0.25 mM Ca2+: 1.349, 1.386 ± 0.03265, n = 8; p = 0.0035; ≥ 7 larvae per group) and 75 msec (control, 0.3 mM Ca2+: 1.197, 1.189 ± 0.02715, n = 8; tomosynNA1, 0.25 mM Ca2+: 1.239, 1.240 ± 0.01851, n = 8; p = 0.1396; ≥ 7 larvae per group). Complete data provided in Figure 4—figure supplement 1—source data 1.
-
Figure 4—figure supplement 1—source data 1
Source data for Figure 4—figure supplement 1.
- https://cdn.elifesciences.org/articles/72841/elife-72841-fig4-figsupp1-data1-v2.xlsx
Figure 5

Loss of Tomosyn does not affect AZ number, NMJ area or SV abundance.
(A) Representative confocal images of immunohistochemistry against BRP (nc82) and neuronal membranes (anti-HRP). (B) Quantification of AZ number per muscle 4 NMJ for Ib, Is and both (control, Ib: 296.0, 288.2 ± 10.71, n = 17; control, Is: 115.5, 115.8 ± 14.97, n = 12; tomosynNA1, Ib: 246.0, 249.7 ± 7.824, n = 17; tomosynNA1, Is: 126.0, 134.1 ± 12.52, n = 17; control, total: 378.0, 374.8 ± 25.07, n = 14; tomosynNA1, total: 366.0, 383.9 ± 14.74, n = 17; p = 0.0001; ≥ 7 larvae per group). (C) Quantification of average BRP abundance per AZ per muscle 4 NMJ, measured as average of maximum pixel intensity of each BRP puncta in arbitrary fluorescence intensity units (control, Ib: 19911, 20722 ± 1210,, n = 17; control, Is: 20682, 21733 ± 1448,, n = 12; tomosynNA1, Ib: 21430, 20681 ± 895.7, n = 17; tomosynNA1, Is: 22275, 22172 ± 1372,, n = 17; p = 0.7654; ≥ 7 larvae per group). (D) Quantification of average bouton size (um2) per muscle 4 NMJ measured as the HRP positive area for each bouton along the arbor (control, Ib: 7.489, 12.16 ± 1.013, n = 195; control, Is: 4.342, 4.974 ± 0.2488, n = 140; tomosynNA1, Ib: 7.508, 8.953 ± 0.3671, n = 241; tomosynNA1, Is: 4.873, 5.413 ± 0.1777, n = 229; p = 0.7654; ≥ 7 larvae per group). (E) Quantification of muscle 4 NMJ area (um2) measured as HRP positive area (control, Ib: 176.9, 176.0 ± 8.056, n = 17; control, Is: 69.76, 88.9 ± 12.89, n = 12; tomosynNA1, Ib: 164.5, 164.7 ± 7.527, n = 17; tomosynNA1, Is: 84.32, 99.69 ± 11.80, n = 17; p < 0.0001; ≥ 7 larvae per group). (F) Quantification of muscle four bouton number per Ib motoneuron (control: 17.50, 17.19 ± 1.030, n = 16; tomosynNA1: 20, 20.19 ± 0.7025, n = 16; p = 0.0225 ≥ 7 larvae per group). (G) Representative NMJs stained with Syt1 antisera. (H) Quantification of Syt1 expression (sum of arbitrary fluorescence units) per Ib motoneuron (control: 3.913*10^8, 4.083*10^8 ± 0.949* 10^8, n = 16; tomosynNA1: 3.3900* 10^8, 3.6713*10^8 ± 0.1297*10^8, n = 16; p = 0.0892 ≥ 7 larvae per group). Complete data found in Figure 5—source data 1.
-
Figure 5—source data 1
Source data for Figure 5.
- https://cdn.elifesciences.org/articles/72841/elife-72841-fig5-data1-v2.xlsx
Figure 6
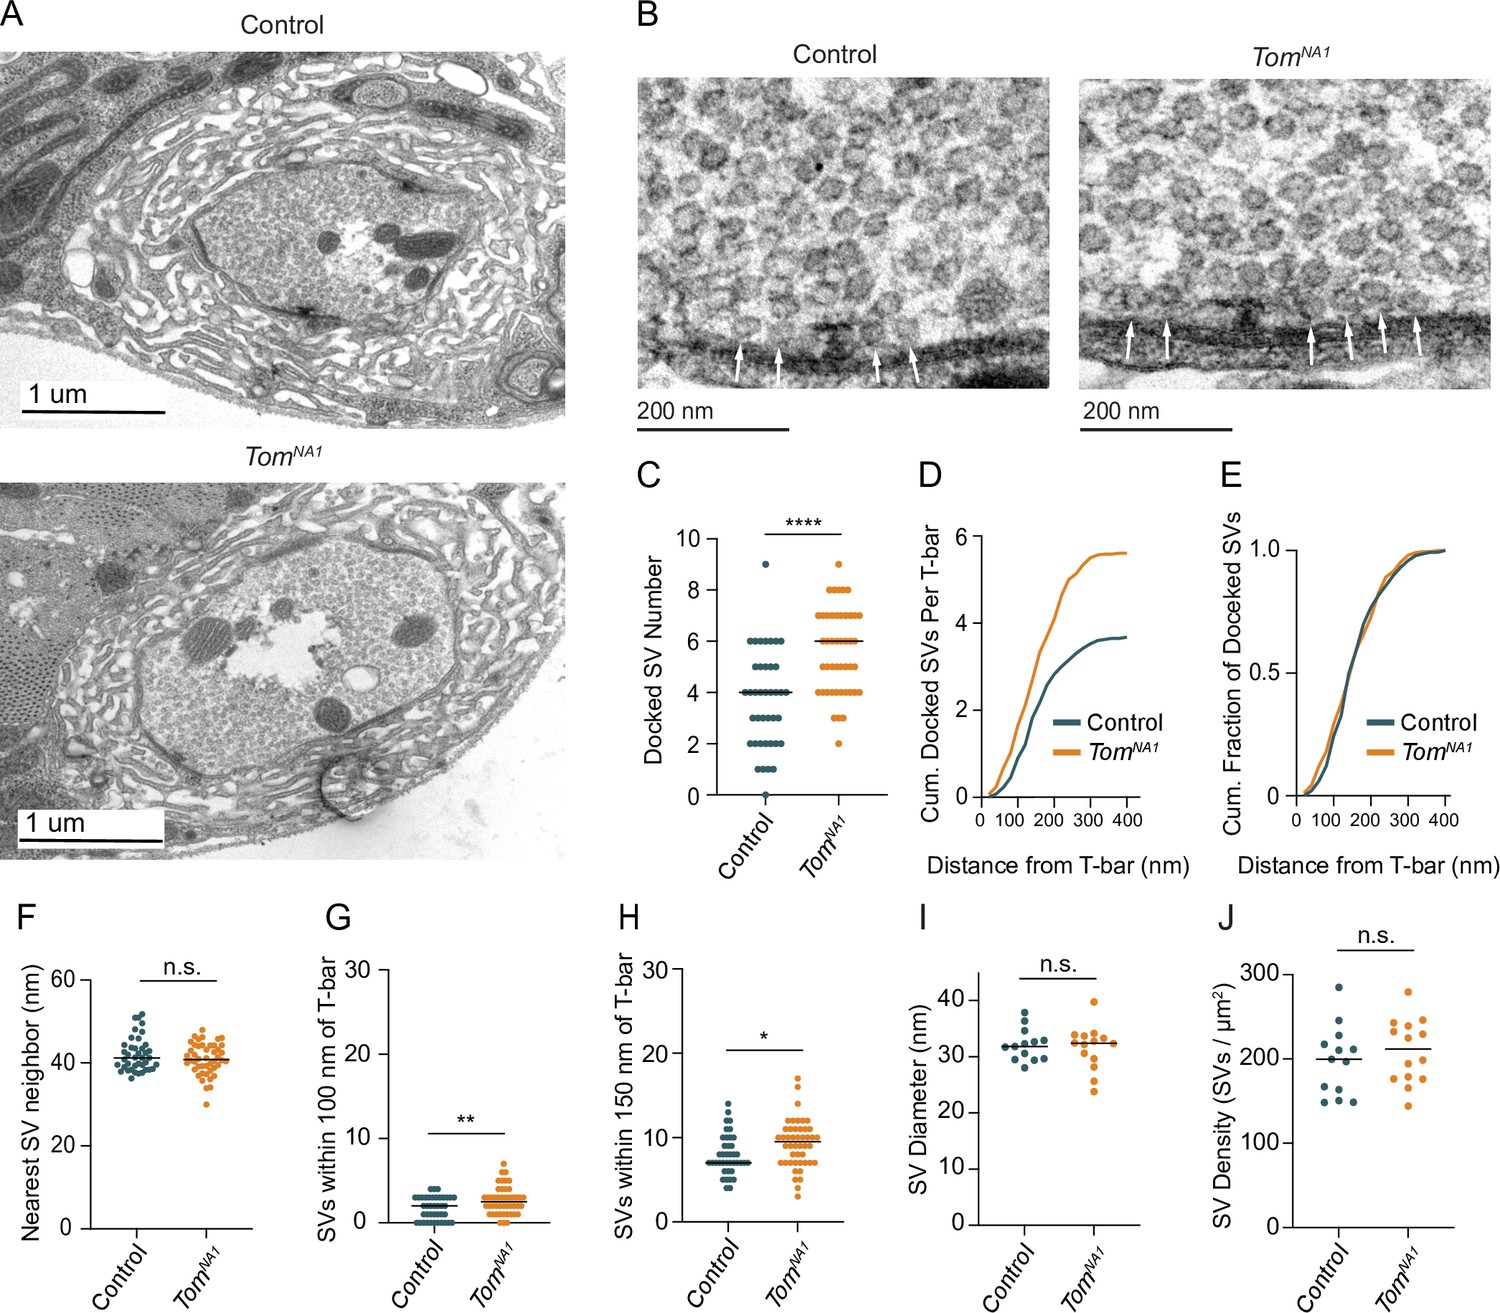
Tomosyn negatively regulates SV docking.
(A) Representative TEM bouton cross-sections at Ib NMJs. (B) Representative micrographs of Ib AZs. Arrows indicate docked SVs. (C) Quantification of docked SV number along each AZ electron density (control: 4, 3.7 ± 0.3, n = 40 AZs; tomosynNA1: 6, 5.609 ± 0.2437, n = 48 AZs; p < 0.0001; three larvae per group). (D) Average cumulative number of docked SVs at each distance from the T-bar center. (E) Docked SV distance from the AZ center, plotted as cumulative fraction of docked SVs at each distance from T-bar. (F) Quantification per micrograph of average distance (nm) from each SV to its nearest neighbor (control: 41.16, 42.02 ± 0.6476, n = 40 micrographs; tomosynNA1: 40.78 nm, 40.91 ± 0.5561, n = 46 micrographs; p = 0.1931; three larvae per group). (G) Quantification of SV number closer than 100 nm to the T-bar (control: 1, 1.075 ± 0.1535, n = 40 AZs; tomosynNA1: 2, 1.739 ± 0.1927, n = 46 AZs; p = 0.0099; three larvae per group). (H) Quantification of SV number closer than 150 nm to the T-bar (control: 7, 7.950 ± 0.3772, n = 40 AZs; tomosynNA1: 9.5, 9.261 ± 0.4164, n = 46 AZs; p = 0.0236; three larvae per group). (I) Quantification of average SV diameter (nm) per micrograph (control: 31.81, 32.11 ± 0.7935, n = 13 boutons; tomosynNA1: 32.40, 31.59 ± 1.050, n = 14 boutons; p = 0.7005; three larvae per group). (J) Quantification of average SV density per bouton area (SVs/um2) per micrograph (control: 199.6, 197.9 ± 11.52, n = 13 boutons; tomosynNA1: 211.8, 209.2 ± 10.24, n = 14 boutons; p = 0.4690; three larvae per group). Complete data found in Figure 6—source data 1.
-
Figure 6—source data 1
Source data for Figure 6.
- https://cdn.elifesciences.org/articles/72841/elife-72841-fig6-data1-v2.xlsx
Figure 7 with 1 supplement
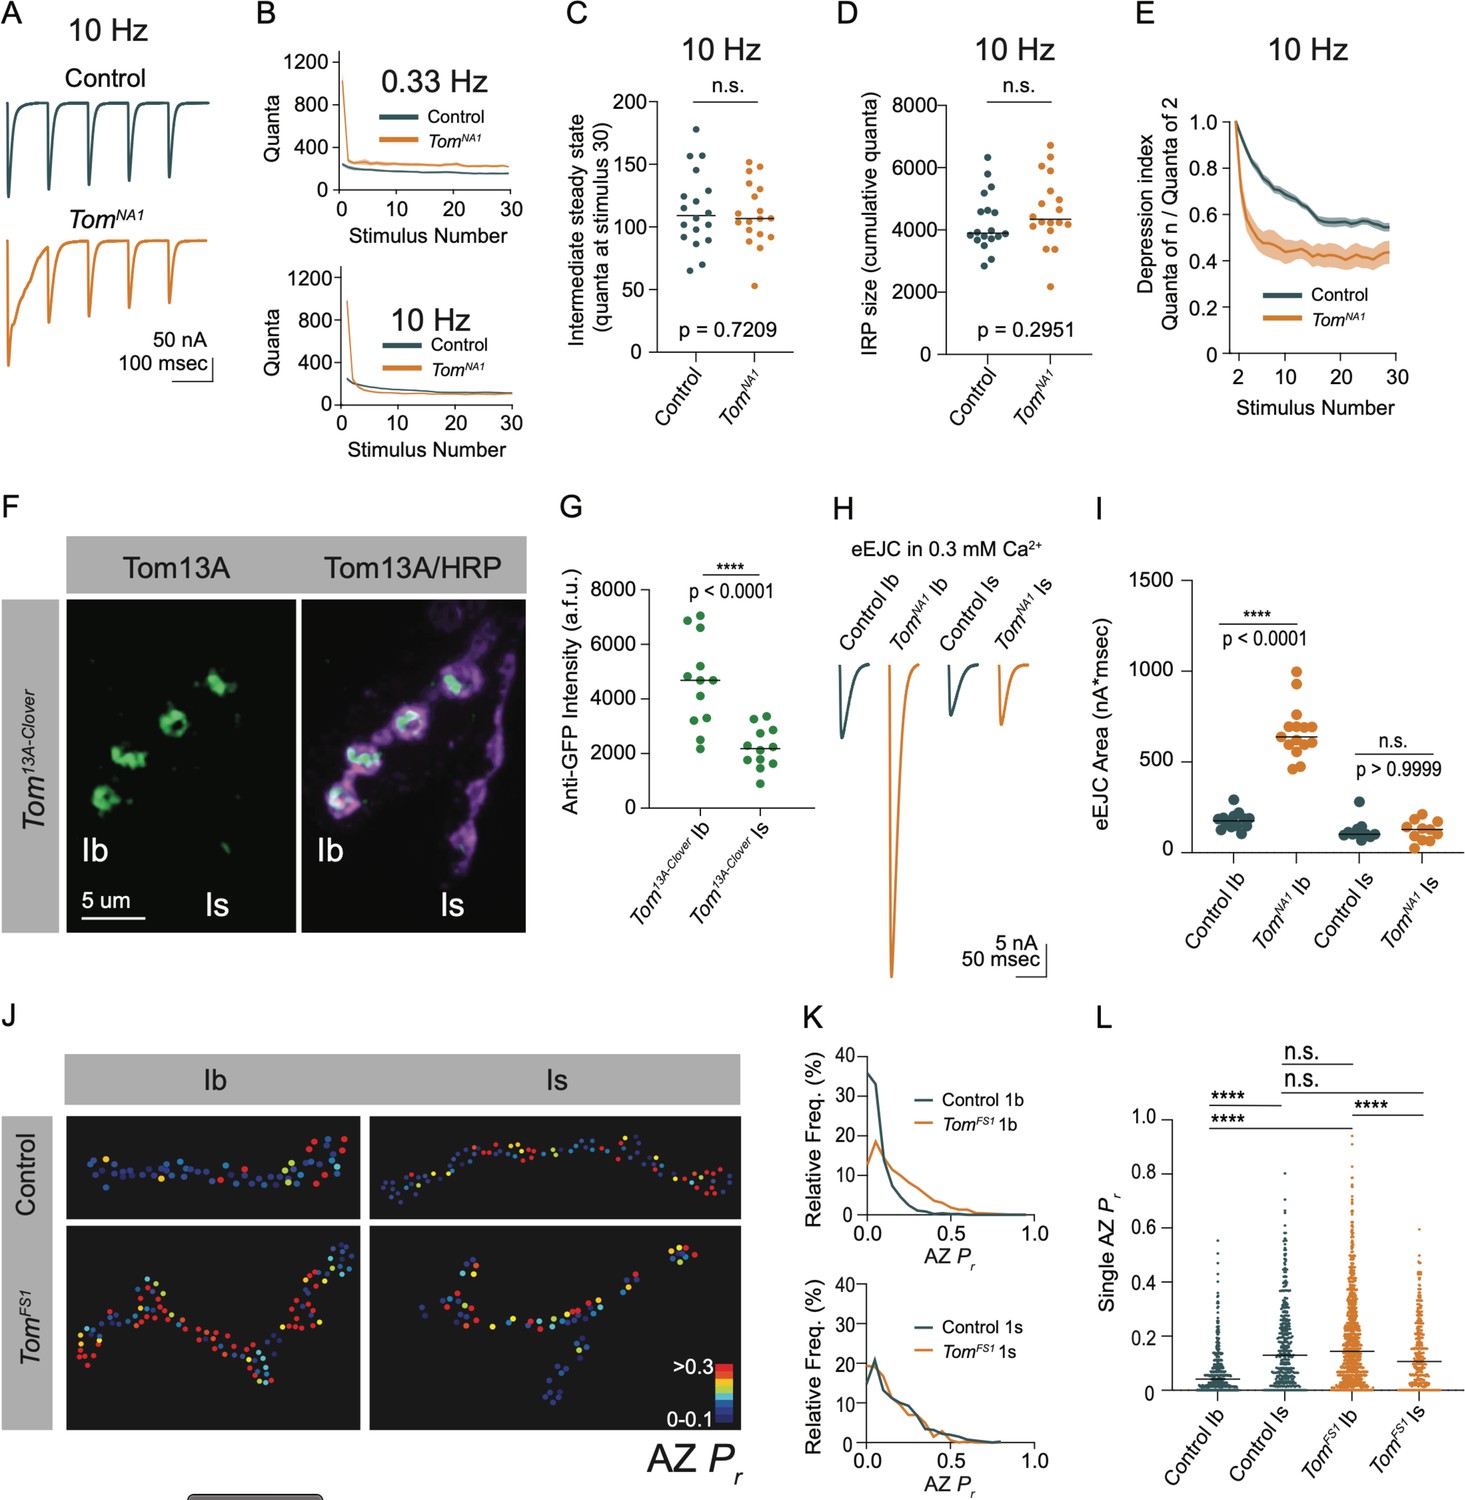
Tomosyn regulates tonic versus phasic release properties.
(A) Average evoked response trains during 10 Hz stimulation in 2.0 mM Ca2+. Stimulus artifacts were removed for clarity. (B) Evoked quantal content in 2.0 mM Ca2+ (quanta) during a 0.33 Hz stimulus train (top) and during a 10 Hz stimulus train (bottom). Lines indicate mean values, with SEM noted by the shaded area (SEM is partly obscured in these plots by the line indicating the mean). (C) Quantification of evoked response size (quanta) at intermediate steady state, approximated as size of stimulus 30 following 10 Hz stimulation in 2.0 mM Ca2+ (control: 109.0, 113.8 ± 7.217, n = 18; tomosynNA1: 106.8, 8.110 ± 5.964, n = 18; p = 0.7209; ≥ 12 larvae per group). (D) Quantification of the immediately releasable pool size, approximated as the cumulative quanta released within 30 stimulations at 10 Hz in 2.0 mM Ca2+ (control: 3899, 4247 ± 219.5, n = 18; tomosynNA1: 4314, 4615 ± 268.1, n = 18; p = 0.2951; ≥ 12 larvae per group). (E) The depression index was calculated as the ratio of stimulus n to stimulus 2 during a 10 Hz train in 2.0 mM Ca2+. At stimulus 30, the depression index is: control: 0.5565, 0.5527 ± 0.1885, n = 18; tomosynNA1: 0.3961, 0.4277 ± 0.03628, n = 17 (p = 0.0039; ≥ 12 larvae per group). (F) Representative NMJ images of anti-GFP staining in tomosyn13A-Clover. (G) Quantification of Tomosyn13A-Clover expression level (arbitrary fluorescence units) in Ib and Is terminals (tomosyn13A-Clover, Ib: 4680, 4601 ± 475.1, n = 12; tomosyn13A-Clover, Is: 2180, 2201 ± 215.7, n = 12; p < 0.0001; ≥ 4 larvae per group). (H) Average optically evoked responses from motoneurons expressing ChR2 with Gal4 drivers only in Ib (GMR94G06) or Is (GMR27F01). (I) Quantification of optically evoked response area (nA*msec) in Ib and Is (GMR94G06> UAS-ChR2: 175.2, 175.7 ± 12.31, n = 14; tomosynNA1, GMR94G06> UAS-ChR2: 638.0, 667.1 ± 37.91, n = 15; GMR27F01> UAS-ChR2: 101.9, 121.1 ± 17.05, n = 11; tomosynNA1, GMR27F01> UAS-ChR2: 128.7, 120.6 ± 17.01, n = 11; p < 0.0001; ≥ 5 larvae per group). (J) Representative maps of AZ Pr at Ib or Is terminals in control or tomosynFS1 mutants following optical quantal analysis. (K) Histogram of single AZ Pr at Ib (top) and Is (bottom) NMJs. (L) Quantification of single AZ Pr per motoneuron per genotype (the mean is plotted, control Ib: 0.04150, 0.06938 ± 0.003829, n = 463 AZs; control Is: 0.1295, 0.1664 ± 0.007488, n = 409 AZs; tomosynFS1 Ib: 0.1434, 0.1846 ± 0.004917, n = 1,075 AZs; tomosynFS1 Is: 0.1066, 0.1389 ± 0.006720, n = 346 AZs; p < 0.0001; ≥ 4 larvae per group). Complete data provided in Figure 7—source data 1.
-
Figure 7—source data 1
Source data for Figure 7.
- https://cdn.elifesciences.org/articles/72841/elife-72841-fig7-data1-v2.xlsx
Figure 7—figure supplement 1
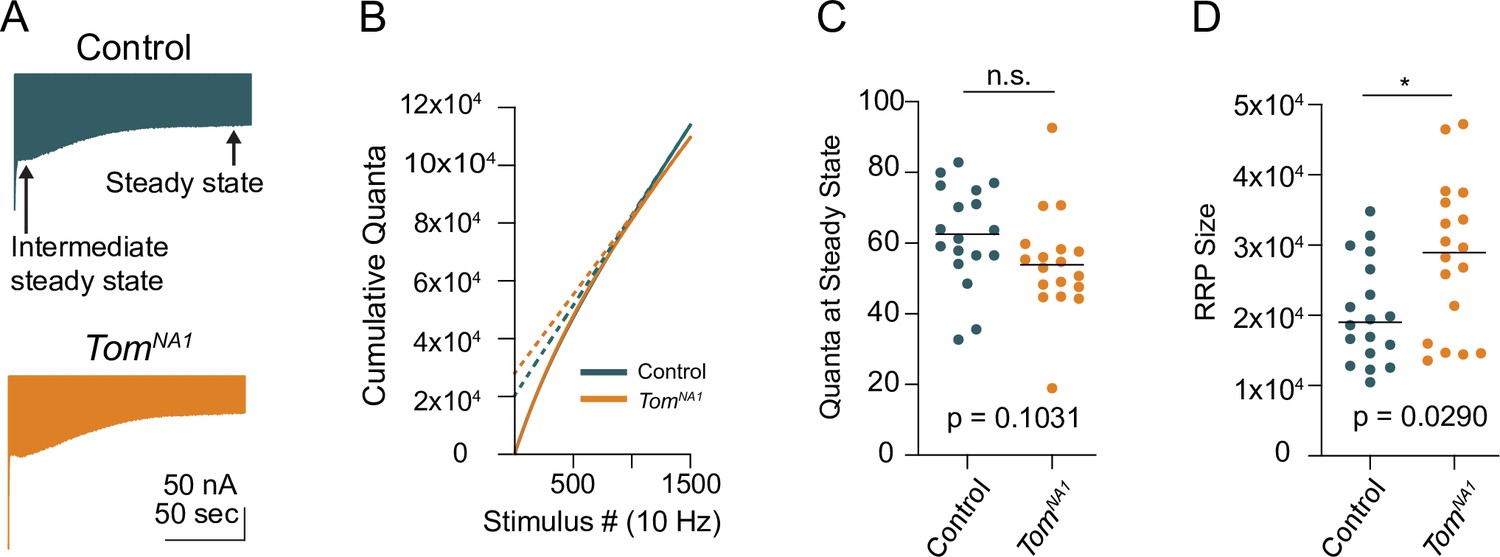
Steady-state recycling rate and RRP size in tomosyn mutants.
(A) Average evoked response trains at 10 Hz for 1500 stimulations in 2.0 mM Ca2+. The intermediate steady state and final steady state are represented with arrows. (B) Average cumulative quanta per stimulus (solid line), with back extrapolation of the RRP size minus steady state recycling (dashed line). (C) Quantification of evoked response size at steady state (quanta) following 1500 stimulations at 10 Hz in 2.0 mM Ca2+ (control: 62.51, 62.36 ± 3.329, n = 18; tomosynNA1: 53.85, 54.29 ± 3.486, n = 18; p = 0.0315; ≥ 12 larvae per group). (D) Quantification of RRP size in quanta (control: 19,041, 20,333 ± 1724,, n = 18; tomosynNA1: 28,956, 28,189 ± 2537, n = 18; p = 0.0290; ≥ 12 larvae per group). Complete data provided in Figure 7—figure supplement 1—source data 1.
-
Figure 7—figure supplement 1—source data 1
Source data for Figure 7—figure supplement 1.
- https://cdn.elifesciences.org/articles/72841/elife-72841-fig7-figsupp1-data1-v2.xlsx
Figure 8 with 1 supplement
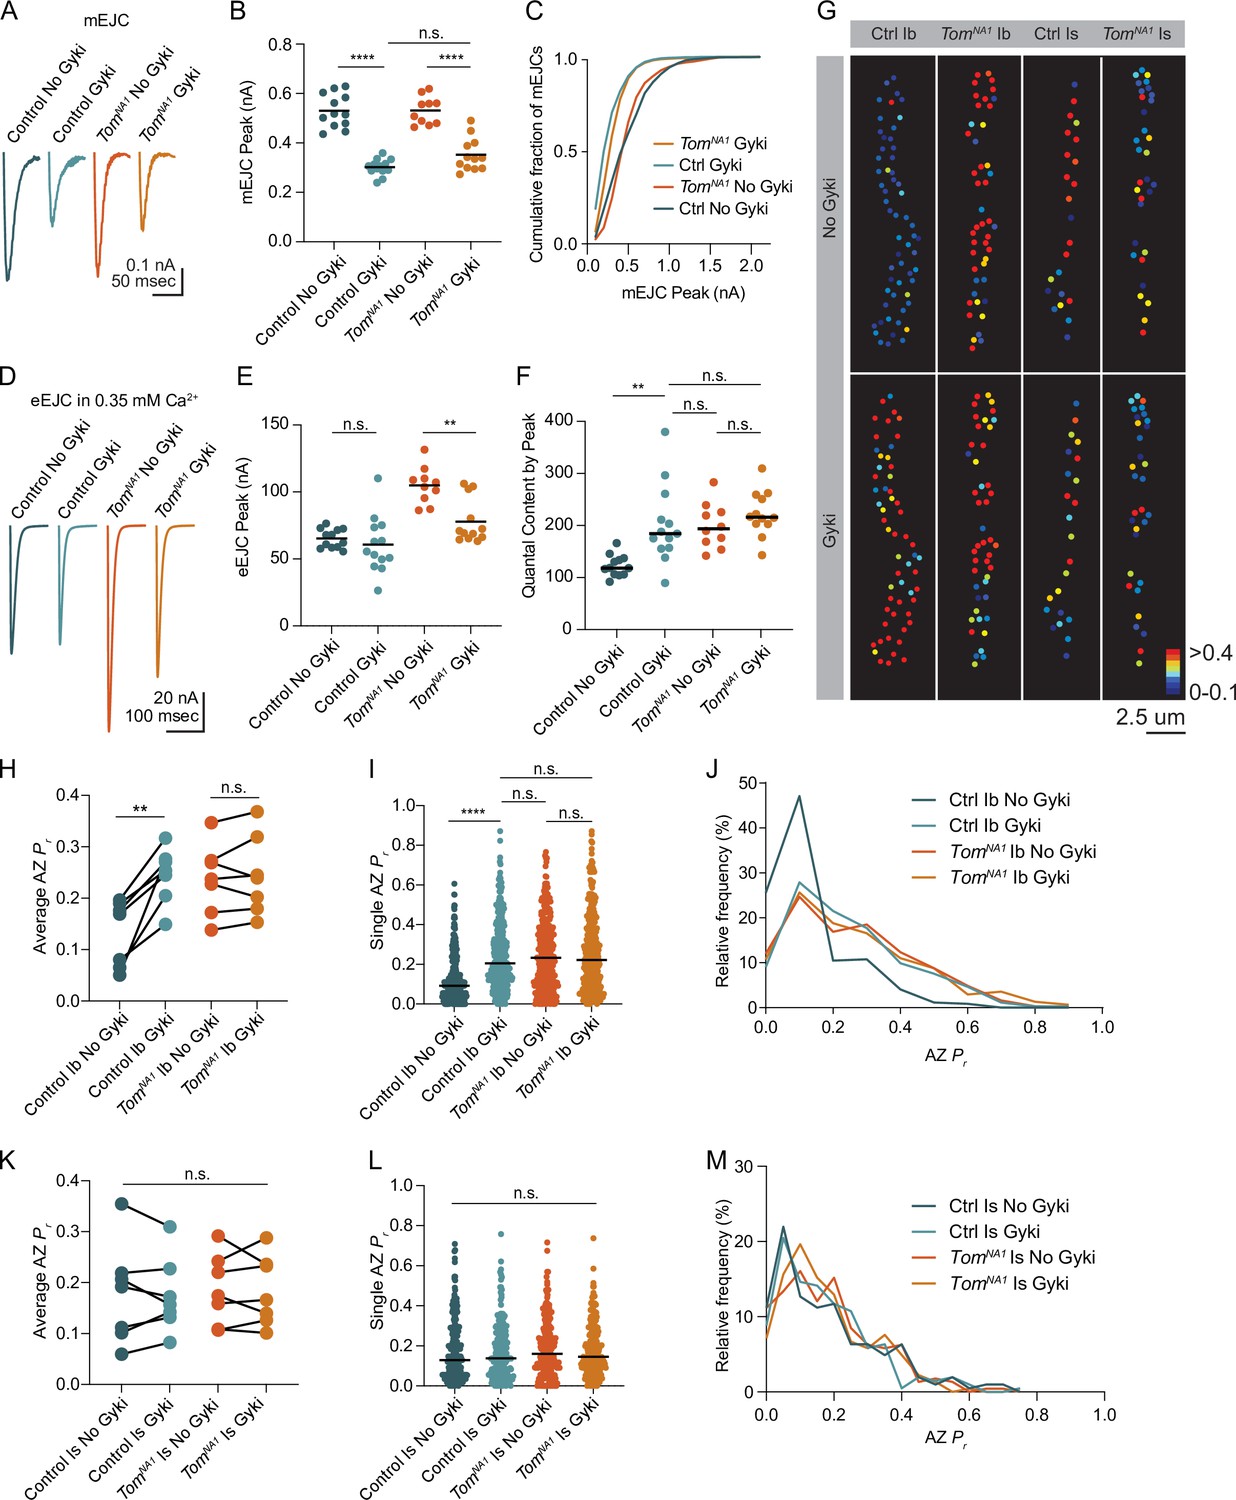
Tomosyn is essential for Gyki-induced presynaptic homeostatic potentiation (PHP).
(A) Average mEJC amplitude in the presence and absence of the allosteric GluR inhibitor Gyki (10 uM). (B) Quantification of average mEJC peak current (nA) per NMJ (control, no Gyki: 0.5161, 0.5302 ± 0.01964 n = 12; control, Gyki: 0.3062, 0.3019 ± 0.009029, n = 13; tomosynNA1, no Gyki: 0.5318, 0.5312 ± 0.01789, n = 10; tomosynNA1, Gyki: 0.3373, 0.3521 ± 0.01934, n = 12; p < 0.0001; ≥ 7 larvae per group). (C) Histogram showing cumulative fraction of mEJCs by peak current. (D) Average eEJC peak amplitude (nA) following 15 min incubation in Gyki (10 uM). (E) Quantification of average eEJC peak (nA) per NMJ in 0.35 mM Ca2+ (control, no Gyki: 65.02, 65.28 ± 2.062 n = 12; control, Gyki: 55.52, 60.67 ± 5.819, n = 13; tomosynNA1, no Gyki: 105.5, 104.9 ± 4.315, n = 10; tomosynNA1, Gyki: 70.10, 77.82 ± 4.778, n = 12; p < 0.0001; ≥ 7 larvae per group). (F) Quantification of average evoked quantal content per NMJ in 0.35 mM Ca2+ approximated by peak current (control, no Gyki: 120.3, 124.9 ± 5.927 n = 12; control, Gyki: 185.7, 202.6 ± 20.54, n = 13; tomosynNA1, no Gyki: 195.2, 200.9 ± 13.47, n = 10; tomosynNA1, Gyki: 217.1, 224.2 ± 12.40, n = 12; p < 0.0001; ≥ 7 larvae per group). (G) Representative maps of AZ Pr in Ib and Is before and after Gyki incubation following optical quantal imaging. (H) Average AZ Pr per Ib NMJ before and after Gyki (control Ib, no Gyki: 0.1690, 0.1325 ± 0.02419, n = 7; control Ib, Gyki: 0.2538, 0.2451 ± 0.02049, n = 7; tomosynNA1 Ib, no Gyki: 0.2373, 0.2377 ± 0.02602, n = 7; tomosynNA1 Ib, Gyki: 0.2395, 0.2438 ± 0.02894, n = 7; p = 0.0094; ≥ 4 larvae per group). (I) Single AZ Pr at Ib NMJs before and after Gyki (control Ib, no Gyki: 0.09200, 0.1275 ± 0.006387, n = 344; control Ib, Gyki: 0.2051, 0.2412 ± 0.009160, n = 344; tomosynNA1 Ib, no Gyki: 0.2325, 0.2515 ± 0.01016, n = 308; tomosynNA1 Ib, Gyki: 0.2220, 0.2601 ± 0.001117, n = 308; p < 0.0001; ≥ 4 larvae per group). (J) Histogram of single AZ Pr at Ib NMJs before and after Gyki. (K) Average AZ Pr per Is NMJ before and after Gyki (control Is, no Gyki: 0.1917, 0.1777 ± 0.03719, n = 7; control Is, Gyki: 0.1568, 0.1746 ± 0.02786, n = 7; tomosynNA1 Is, no Gyki: 0.1740, 0.1859 ± 0.02609, n = 7; tomosynNA1 Is, Gyki: 0.1662, 0.1843 ± 0.02598, n = 7; p = 0.9918; ≥ 4 larvae per group). (L) Single AZ Pr at Is NMJs before and after Gyki (control Is, no Gyki: 0.1291, 0.1817 ± 0.01094, n = 205; control Is, Gyki: 0.1382, 0.1752 ± 0.009807, n = 205; tomosynNA1 Is, no Gyki: 0.1605, 0.1844 ± 0.009462, n = 224; tomosynNA1 Is, Gyki: 0.1454, 0.1813 ± 0.008662, n = 224; p = 0.9246; ≥ 4 larvae per group). (M) Histogram of single AZ Pr at Is NMJs before and after Gyki. Complete data provided in Figure 8—source data 1.
-
Figure 8—source data 1
Source data for Figure 8.
- https://cdn.elifesciences.org/articles/72841/elife-72841-fig8-data1-v2.xlsx
Figure 8—figure supplement 1
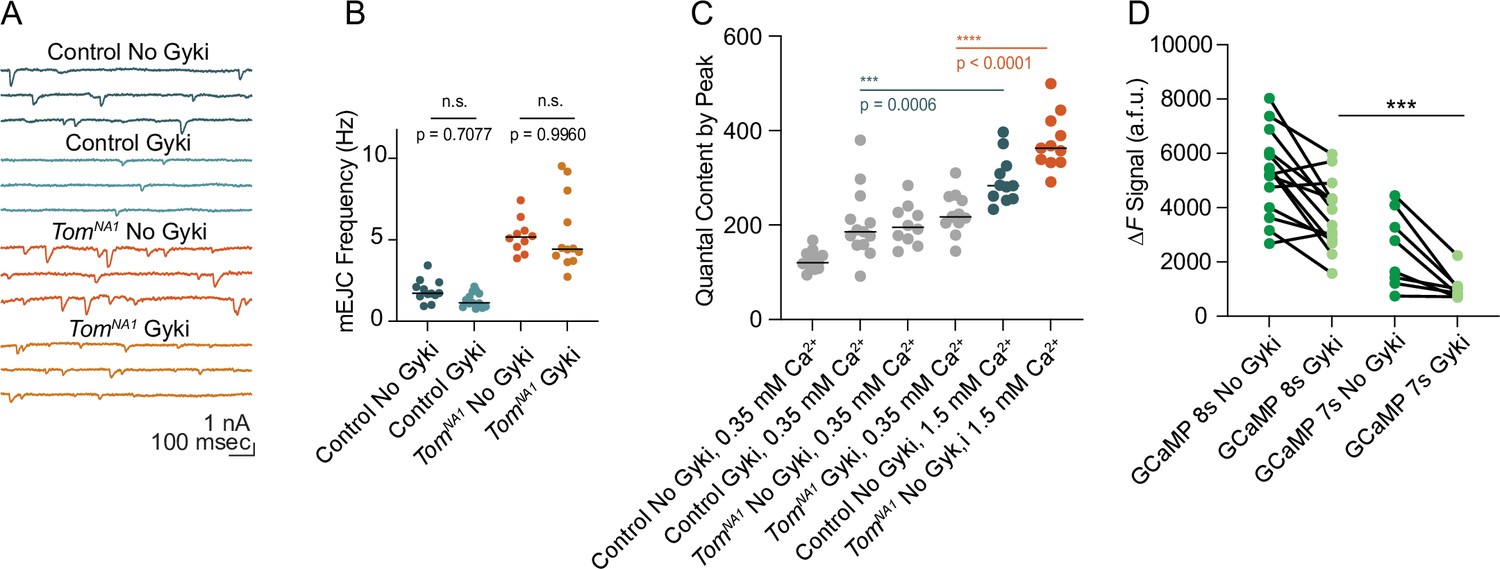
mEJC detection and non-saturation of quantal content following Gyki application.
(A) Representative mEJC traces. (B) Quantification of mEJC frequency per NMJ (control, no Gyki: 1.717, 1.883 ± 0.1972 n = 12; control, Gyki: 1.133, 1.314 ± 0.1280, n = 13; tomosynNA1, no Gyki: 5.165, 5.253 ± 0.3340, n = 10; tomosynNA1, Gyki: 4.433, 5.380 ± 0.6626, n = 12; p < 0.0001; ≥ 7 larvae per group). (C) Quantification of average evoked quantal content per NMJ in 0.35 mM Ca2+ (reproduced from Figure 8F for comparison) and 1.5 mM Ca2+ (control, no Gyki: 283.1, 295.8 ± 15.43 n = 11; tomosynNA1, no Gyki: 362.5, 375.9 ± 17.81, n = 11; p < 0.0001; ≥ 7 larvae per group). (D) Average ∆F signal (arbitrary fluorescence units) per NMJ before and after Gyki using the indicated GCaMP variants (GCaMP 8 s, no Gyki: 5321, 5270 ± 415.6, n = 14; GCaMP8s, Gyki: 3647, 3733 ± 340.0, n = 14; GCaMP7s, no Gyki: 2216, 2455 ± 493.0, n = 8; GCaMP 7 s, Gyki: 933.9, 1061 ± 175.9, n = 8; p < 0.0001; ≥ 4 larvae per group). Complete data provided in Figure 8—figure supplement 1—source data 1.
-
Figure 8—figure supplement 1—source data 1
Source data for Figure 8—figure supplement 1.
- https://cdn.elifesciences.org/articles/72841/elife-72841-fig8-figsupp1-data1-v2.xlsx
Additional files
Download links
A two-part list of links to download the article, or parts of the article, in various formats.
Downloads (link to download the article as PDF)
Open citations (links to open the citations from this article in various online reference manager services)
Cite this article (links to download the citations from this article in formats compatible with various reference manager tools)
The decoy SNARE Tomosyn sets tonic versus phasic release properties and is required for homeostatic synaptic plasticity
eLife 10:e72841.
https://doi.org/10.7554/eLife.72841


