Alternate patterns of temperature variation bring about very different disease outcomes at different mean temperatures
- Institute for Chemistry and Biology of the Marine Environment [ICBM], Carl von Ossietzky University of Oldenburg, Germany
- Department of Zoology, School of Natural Sciences, Trinity College Dublin, Ireland
Figures
Figure 1
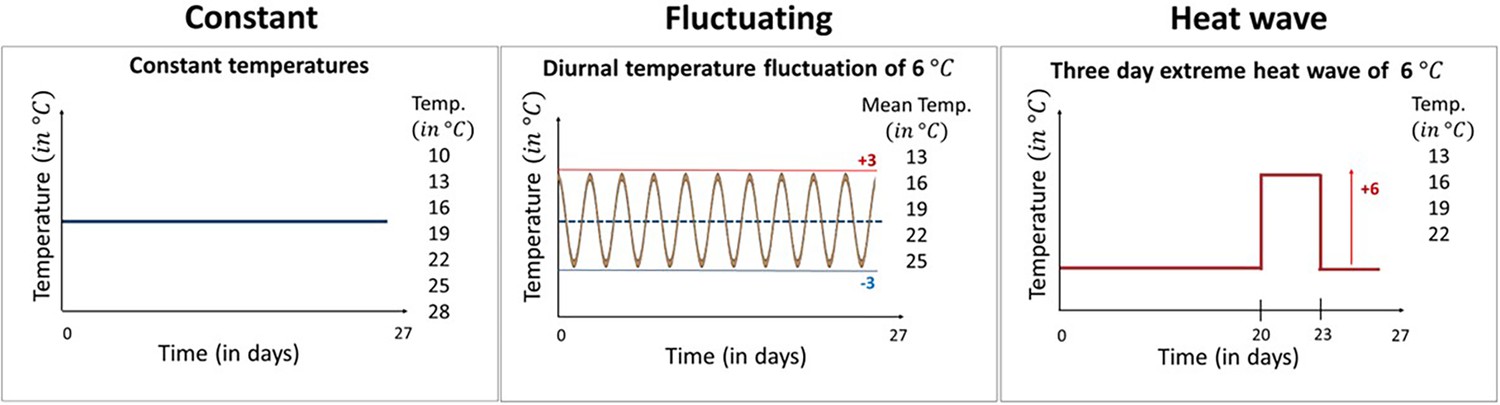
The three temperature regimes used in our experiment.
Our experimental design comprised seven constant temperature regimes with temperatures ranging from 10°C to 28°C, five variable temperature regimes mimicking diurnal temperature fluctuations of ±3°C around the mean, and four heatwave regimes where temperatures were identical to the equivalent constant treatment except during a 3-day period between days 20 and 23 when temperatures were raised by 6°C. All temperature treatments were exposed to the Daphnia parasite Ordospora and to a placebo infection that served as a control for parasite exposure. Constant temperature regimes were replicated 12 times (7×12×2=168 individuals), while in the variable temperature regimes, the number of replicates was increased to 18 as we expected increased mortality in these treatments (5×18×2=180 and 4×18×2=144, respectively, for the fluctuating and heatwave regime). All animals were terminated after day 27 and fitness estimates were collected within 3 days.
Figure 2
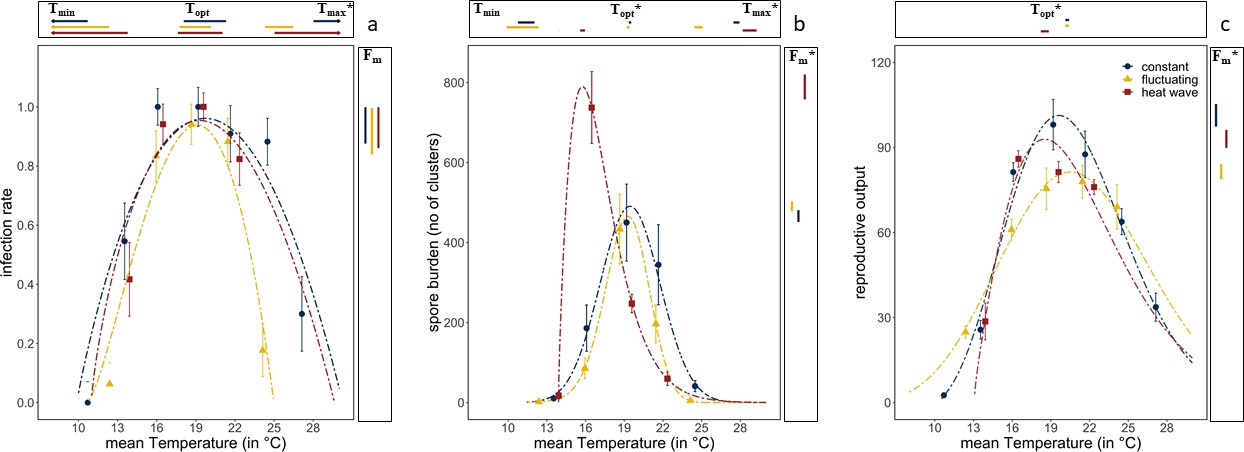
Thermal performance curves of host and parasite life-history traits across our three temperature regimes.
(a) Infection rates of Ordospora in its Daphnia host. (b) Mean number of spore clusters in infected Daphnia at the end of the experiment. (c) Reproductive output of the host when exposed to Ordospora (for a comparison of individuals exposed to Ordospora and the controls that were exposed to a placebo, see Figure 3). For all panels, the constant temperature regime is in blue, the diurnally fluctuating regime in yellow, and the heatwave in red. Points present the observed mean values for the measured traits and dashed lines provide the fit for the Beta Function. 95% confidence intervals of Beta Function estimates for minimum, optimal, and maximum temperature (respectively, Tmin/Topt/Tmax) are shown above the x-axis. The estimate for the optimal value of the life-history trait (Fm) and its 95% confidence interval is displayed to the right of each panel. Significant differences (non-overlapping 95% confidence intervals) in parameter estimates are highlighted with an asterisk. Error bars on data points indicate standard error. Beta Function parameter estimates displayed in this figure can be found in Supplementary files 2–4.
Figure 3
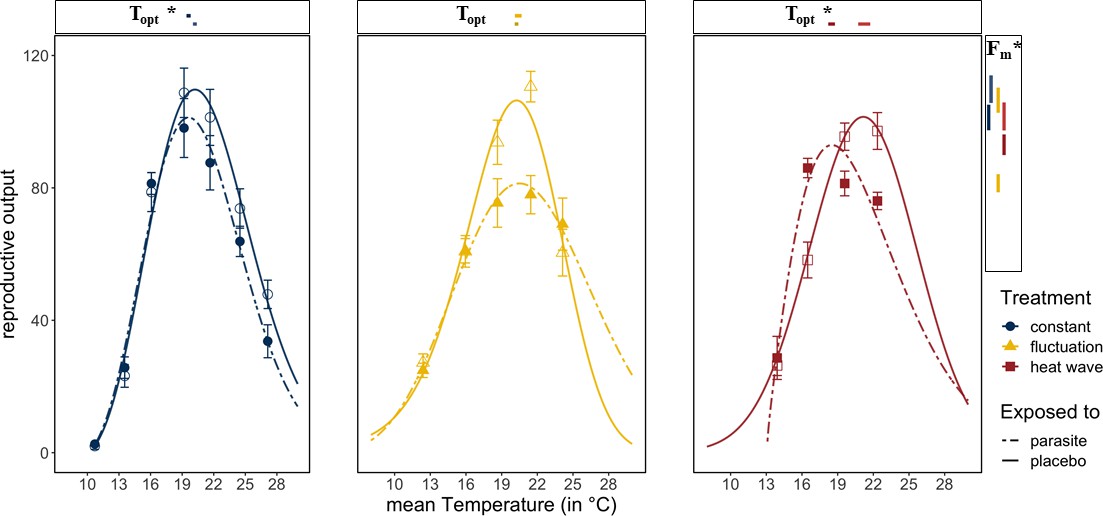
Reproductive success in Daphnia exposed to Ordospora and controls that were exposed to a placebo.
Daphnia exposed to the parasite (dotted lines and filled symbols) produce less offspring than control individuals (solid lines and open symbols). Lines are the fitted Beta Functions for the different temperature regimes (constant temperature regime in blue, the diurnally fluctuating regime in yellow, and the heatwave in red). 95% confidence intervals of maximum reproductive output (Fm) are shown to the right, and the temperature of this optimum (Topt) is shown above the x-axis. Significant differences in parameter estimates of the Beta Function are highlighted with an asterisk. Estimates for minimum and maximum temperatures are not displayed as we used restrictive priors. Error bars on data points indicate standard error. Beta Function parameter estimates displayed in this figure can be found in Supplementary file 4.
Additional files
-
Transparent reporting form
- https://cdn.elifesciences.org/articles/72861/elife-72861-transrepform1-v1.docx
-
Supplementary file 1
Priors for the parameters in the Beta Function.
- https://cdn.elifesciences.org/articles/72861/elife-72861-supp1-v1.docx
-
Supplementary file 2
Parameter estimates of the Beta Function for infection rates.
- https://cdn.elifesciences.org/articles/72861/elife-72861-supp2-v1.docx
-
Supplementary file 3
Parameter estimates of the Beta Function for spore burden of Ordospora colligata.
- https://cdn.elifesciences.org/articles/72861/elife-72861-supp3-v1.docx
-
Supplementary file 4
Parameter estimates of the Beta Function for reproductive success of Daphnia magna.
- https://cdn.elifesciences.org/articles/72861/elife-72861-supp4-v1.docx
Download links
A two-part list of links to download the article, or parts of the article, in various formats.
Downloads (link to download the article as PDF)
Open citations (links to open the citations from this article in various online reference manager services)
Cite this article (links to download the citations from this article in formats compatible with various reference manager tools)
Alternate patterns of temperature variation bring about very different disease outcomes at different mean temperatures
eLife 11:e72861.
https://doi.org/10.7554/eLife.72861


