Structural basis of Plasmodium vivax inhibition by antibodies binding to the circumsporozoite protein repeats
- Program in Molecular Medicine, The Hospital for Sick Children Research Institute, Canada
- Department of Biochemistry, University of Toronto, Canada
- Department of Medical Biophysics, University of Toronto, Canada
- Department of Immunology, University of Toronto, Canada
Figures
Figure 1
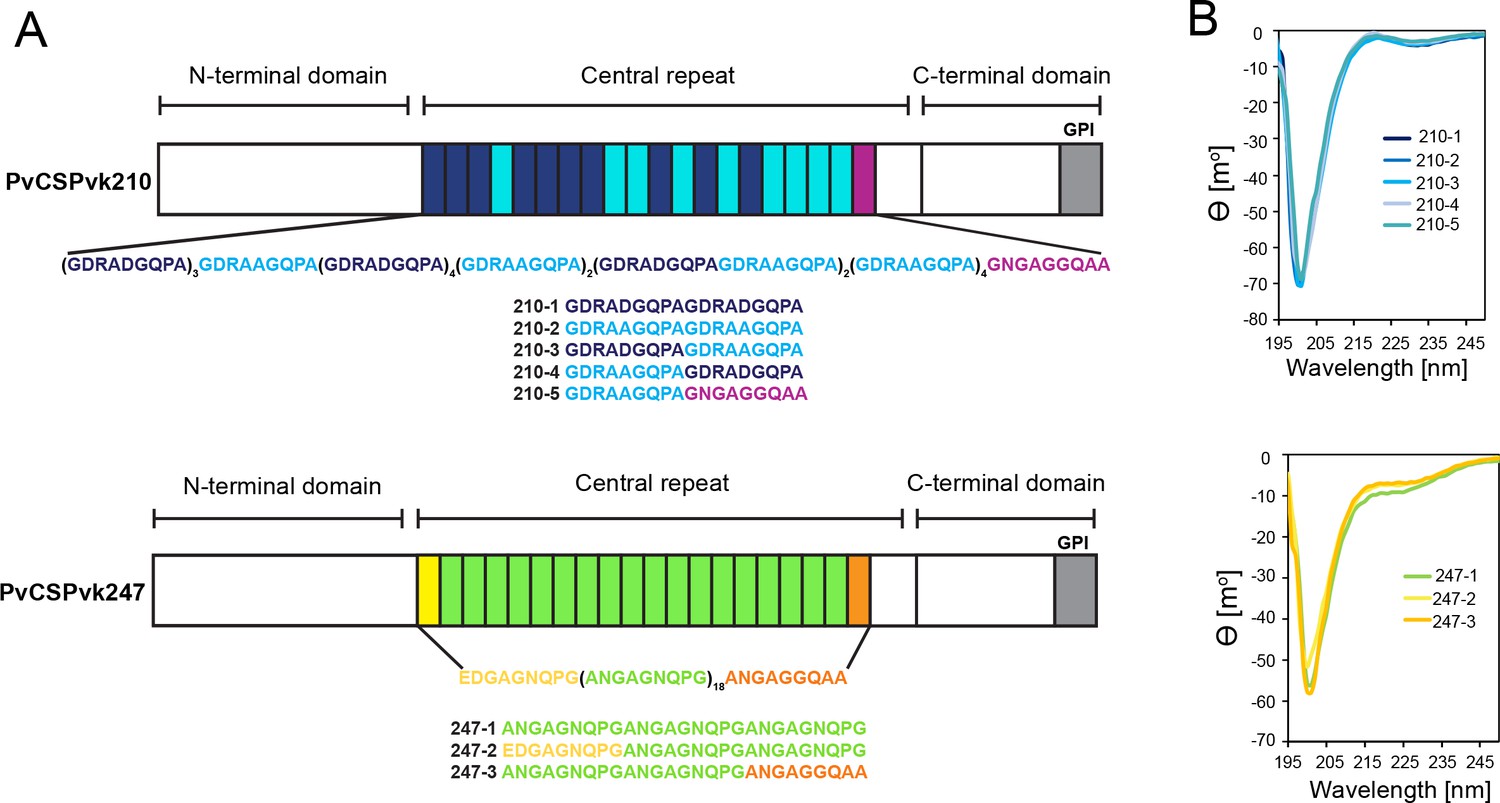
Comparison of PvCSPvk210 and PvCSPvk247 repeat sequences.
(A) Schematic representations of PvCSPvk210 and PvCSPvk247 sequences, each including an N-terminal domain, central repeat region, and C-terminal domain. Colored blocks represent repeat motifs. The sequence of peptides used in circular dichroism (CD) spectroscopy studies is shown below. (B) Superimposition of the CD spectra obtained for PvCSPvk210 (top panel) and PvCSP247 peptides (bottom panel). PvCSPvk210 peptides 210-1, 210-2, 210-3, 210-4, and 210-5 are colored from navy to light blue; PvCSPvk247 peptides are depicted in green (247-1), yellow (247-2), and orange (247-3), respectively.
Figure 2 with 2 supplements
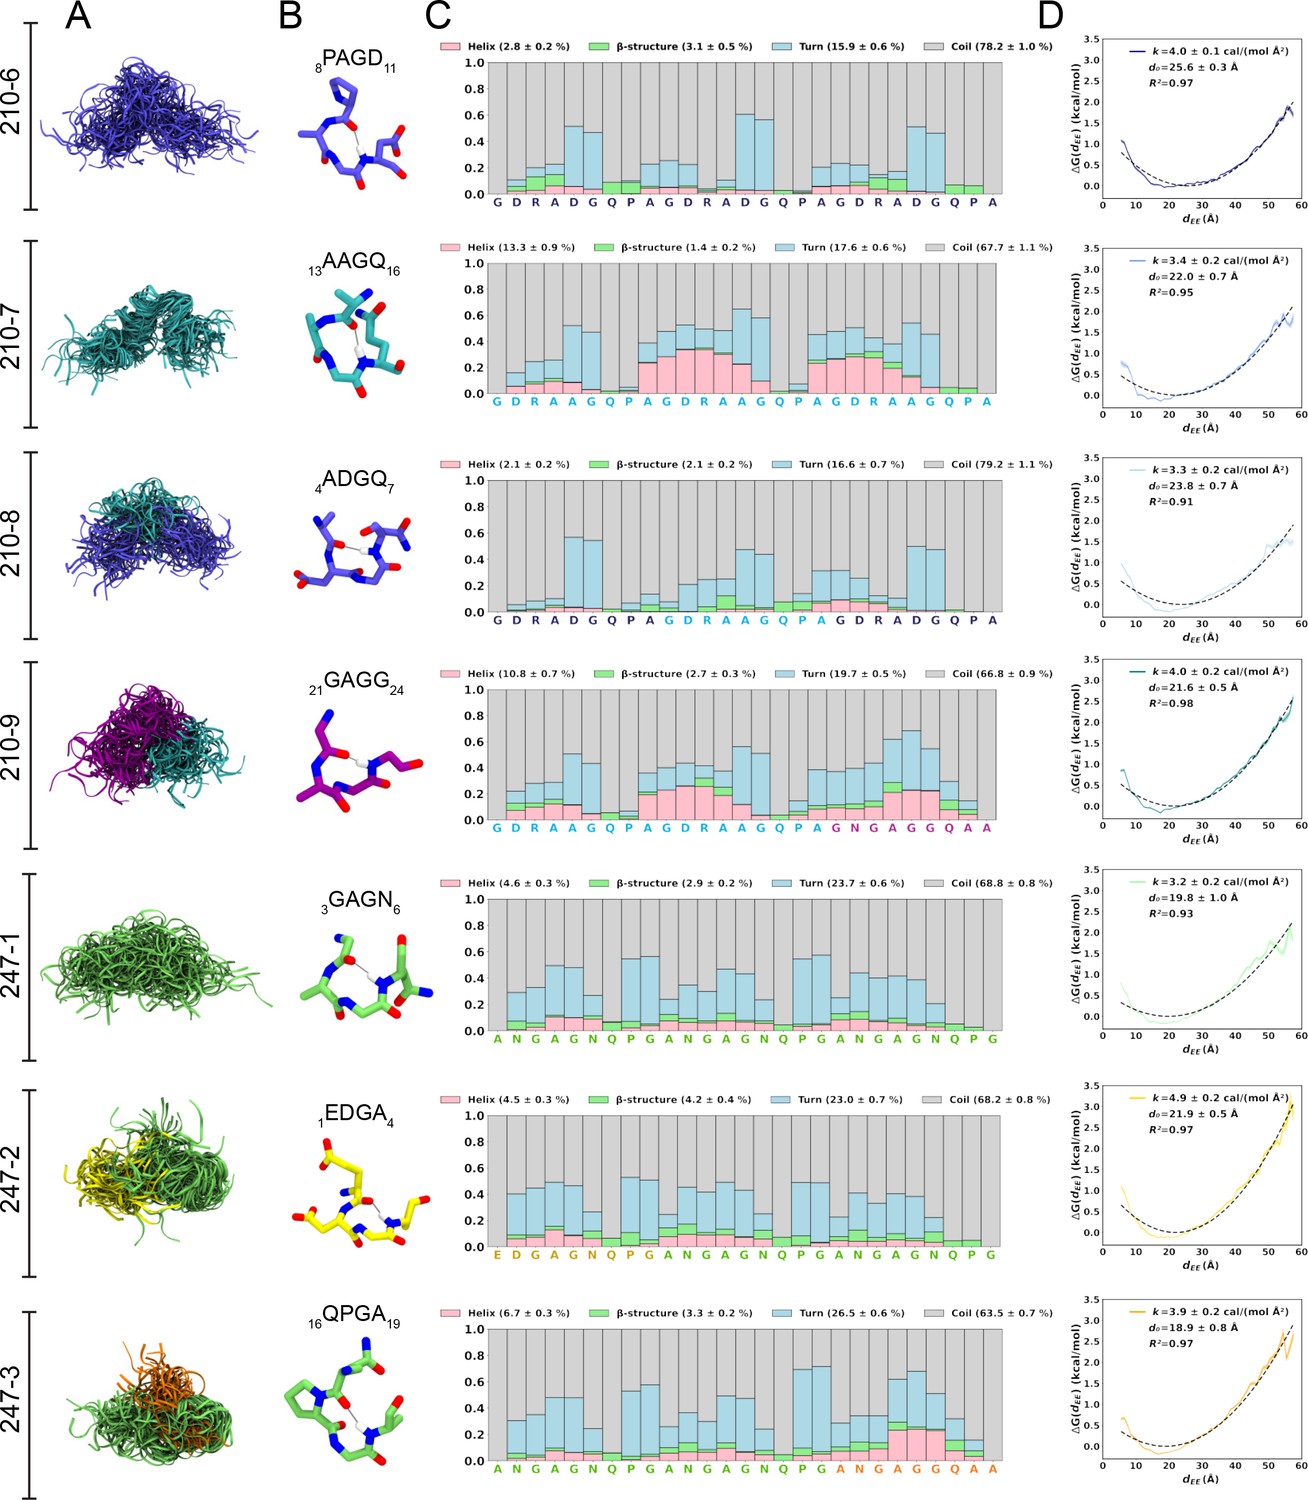
Conformational flexibility of PvCSPvk210 and PvCSPvk247 peptides.
(A) Superposition of the conformations of peptides resulting from molecular dynamics (MD) simulations at every 2 ns and aligned to the conformational median structure. (B) Example snapshots of the highest (peptides 210-7, 210-8, 210-9, and 247-3) or the second highest (peptides 210-6, 247-1, 247-2) propensity β-turn for each peptide. Color coding of atoms: oxygen (red), nitrogen (blue), and hydrogen (white). For clarity, only the hydrogen atom involved in the H-bonded turn is shown. H-bond between C=O of residue i and N–H of residue i + 3 is shown as a gray line. (C) Secondary structure propensity at each residue, averaged over 20 replicas and computed using the Dictionary of Secondary Structure for Proteins (DSSP) criteria (Nagy and Oostenbrink, 2014). (D) Elastic modulus of peptides computed from MD simulations. The reversible work or free energy (ΔG) for extension and compression of the peptide is plotted as a function of equilibrium end-to-end distances (dEE) (solid line). The data is fitted to the quadratic function of elastic potential energy (black dashed line). For each peptide, the estimated values of k (elastic modulus), d0 (equilibrium dEE), and R2 (regression coefficient to indicate quality of fit) are shown. Shading represents standard error of mean.
Figure 2—figure supplement 1
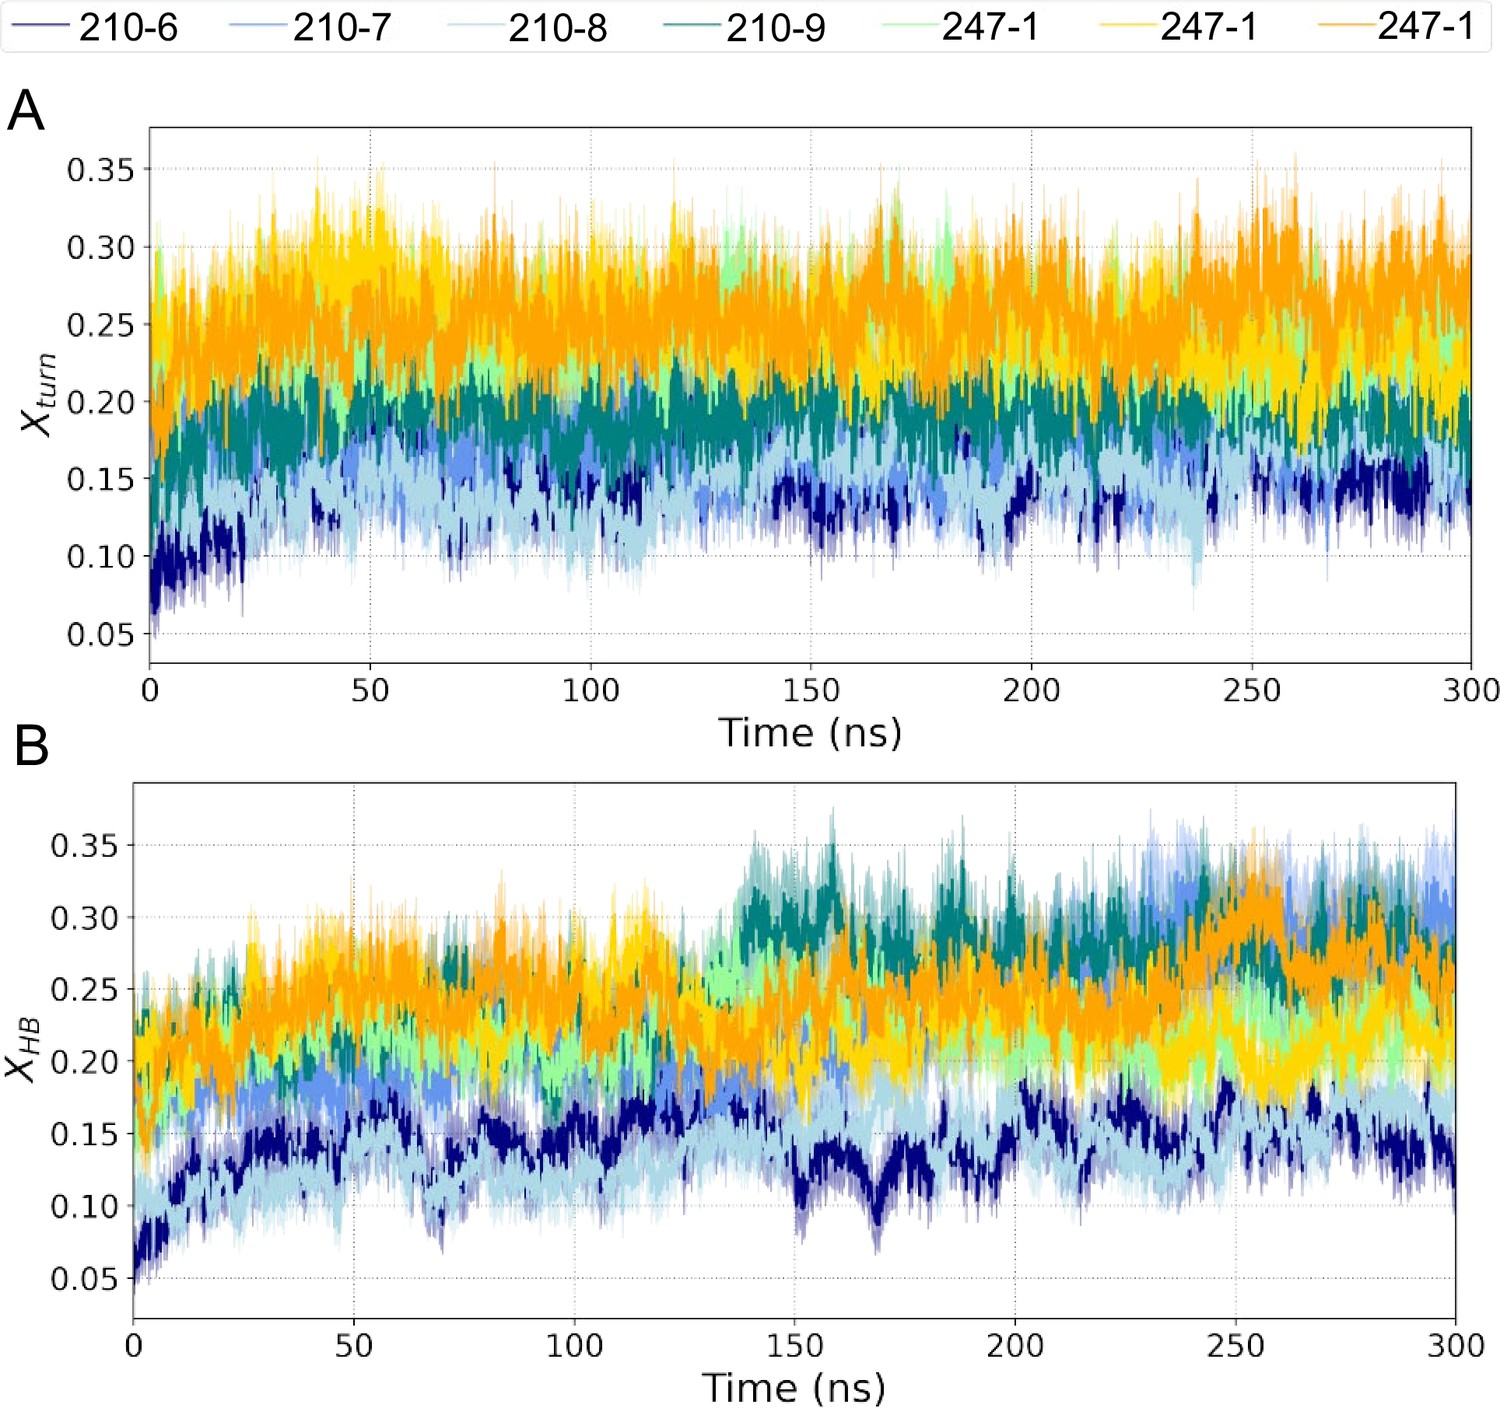
Time evolution of structural properties of PvCSP peptides.
Properties are averaged over 20 replicas, with the shading area representing standard error of the mean. (A) H-bond turn propensity (Xturn). (B) Number of peptide-peptide H-bonds per residue (XHB).
Figure 2—figure supplement 2
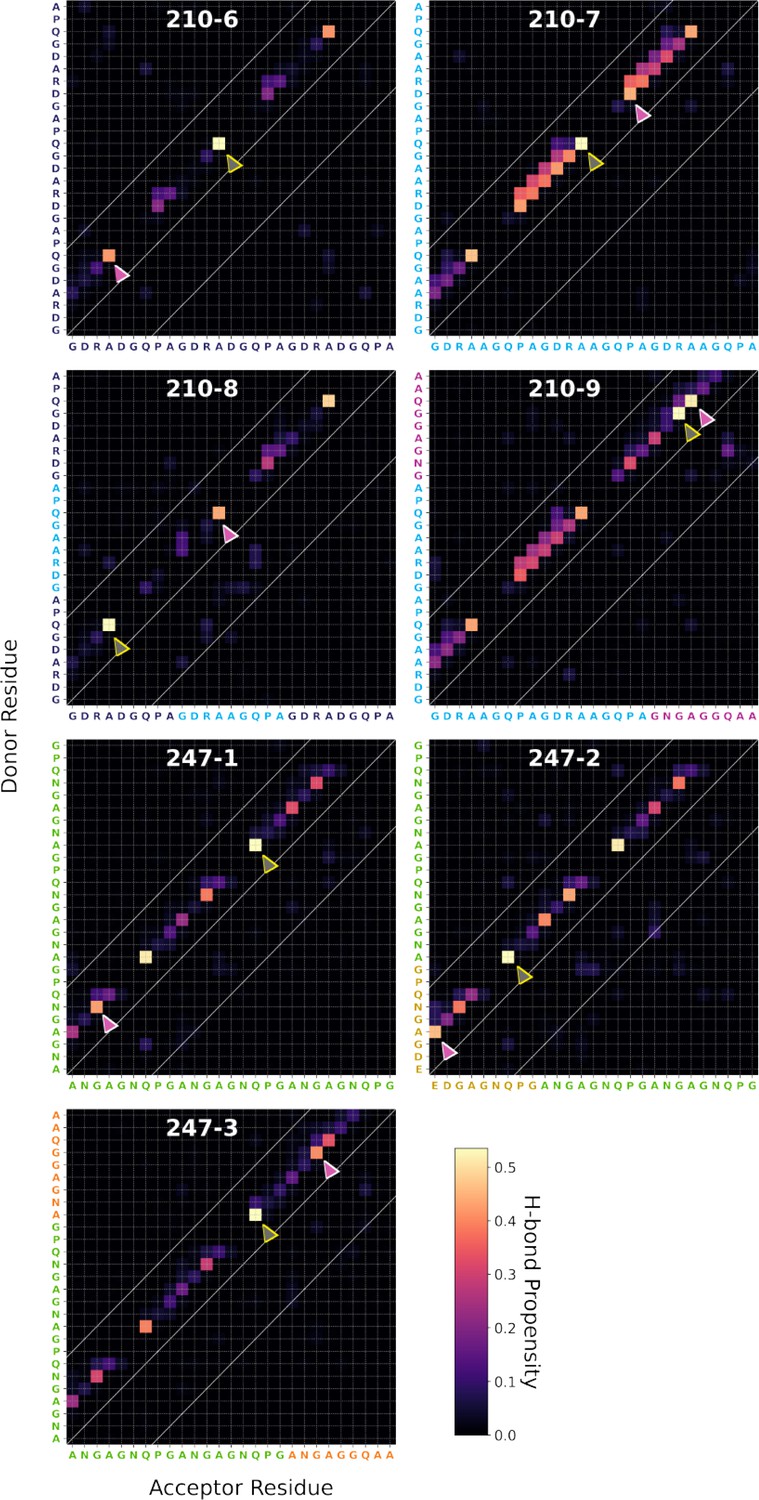
Ensemble-averaged backbone-backbone H-bonding maps for each PvCSP peptide sequence.
A forward H-bond forms between C=O (acceptor) of residue i and N–H (donor) of residue i + n (upper diagonal), while the reverse forms a reverse H-bond (lower diagonal). Within the diagonal represents local interactions, which forms by a pair of residues that are less than seven residues apart. The color of each square represents the H-bond propensities formed by the interacting residues. The gray and the pink arrows indicate the highest and the second highest propensity turn, respectively.
Figure 3 with 4 supplements
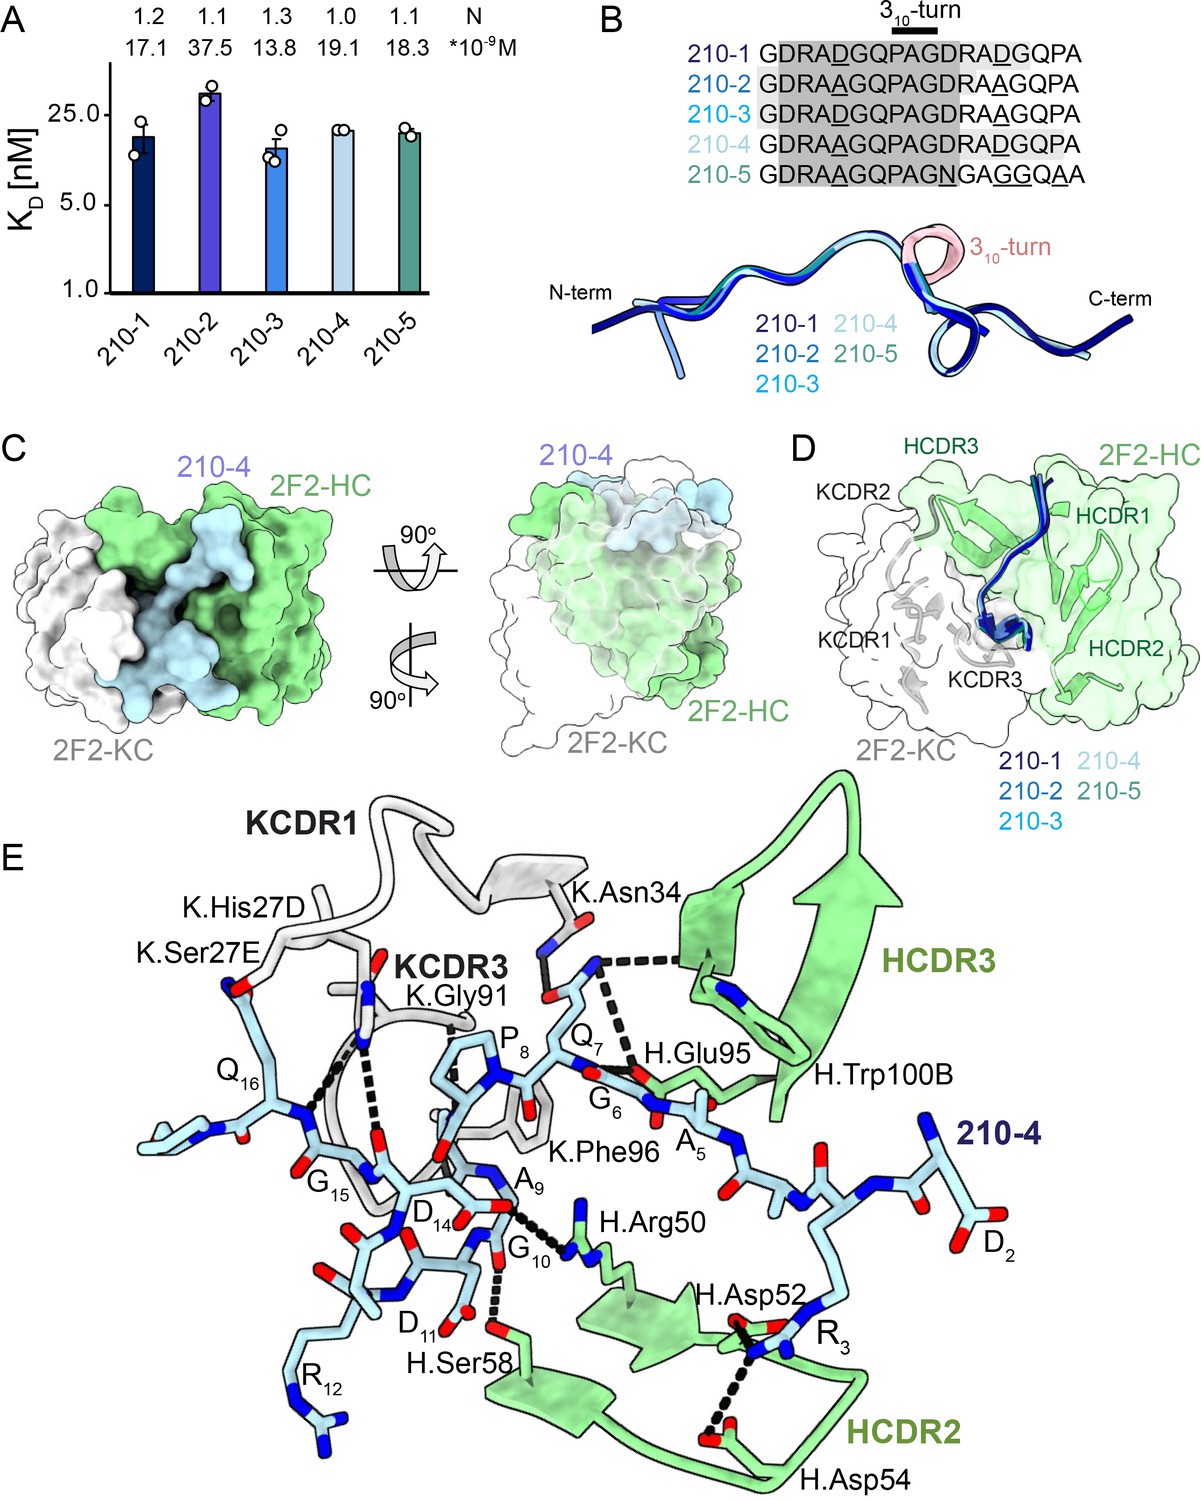
2F2 Fab binding to PvCSPvk210 repeat peptides.
(A) Affinities of 2F2 Fab for peptides 210-1, 210-2, 210-3, 210-4, and 210-5 as measured by isothermal titration calorimetry (ITC). Open circles represent independent measurements. Mean binding constant (KD) and binding stoichiometry (N) values are shown above the corresponding bar. Error bars represent SEM. (B) Upper panel: sequences of peptides used in ITC experiments with variable residues underlined. Dark gray denotes the core epitope of the peptide resolved in all the X-ray crystal structures, and light gray shading indicates residues resolved in the corresponding X-ray crystal structures. Bottom panel: comparison of the conformations of PvCSP210 peptides in X-ray crystal structures. PvCSPvk210 peptides are colored from navy to light blue, with the residues adopting one turn of a 310-helix depicted in pink. (C) Top and side views of the 210-4 peptide (light blue) in the binding groove of the 2F2 Fab shown as surface representation (heavy chain [HC] shown in green and kappa chain [KC] shown in white). (D) Comparison of the conformations adopted by the core epitope of peptides 210-1, 210-2, 210-3, 210-4, and 210-5 when bound to 2F2. (E) Detailed interactions between Fab 2F2 and peptide 210-4. H-bonds and salt bridges are shown as black dashes, peptide 210-4 is shown in light blue, HC is shown in green, and KC is shown in gray. Fab residues are annotated with H or K letters to indicate heavy and kappa light chain, respectively.
Figure 3—figure supplement 1
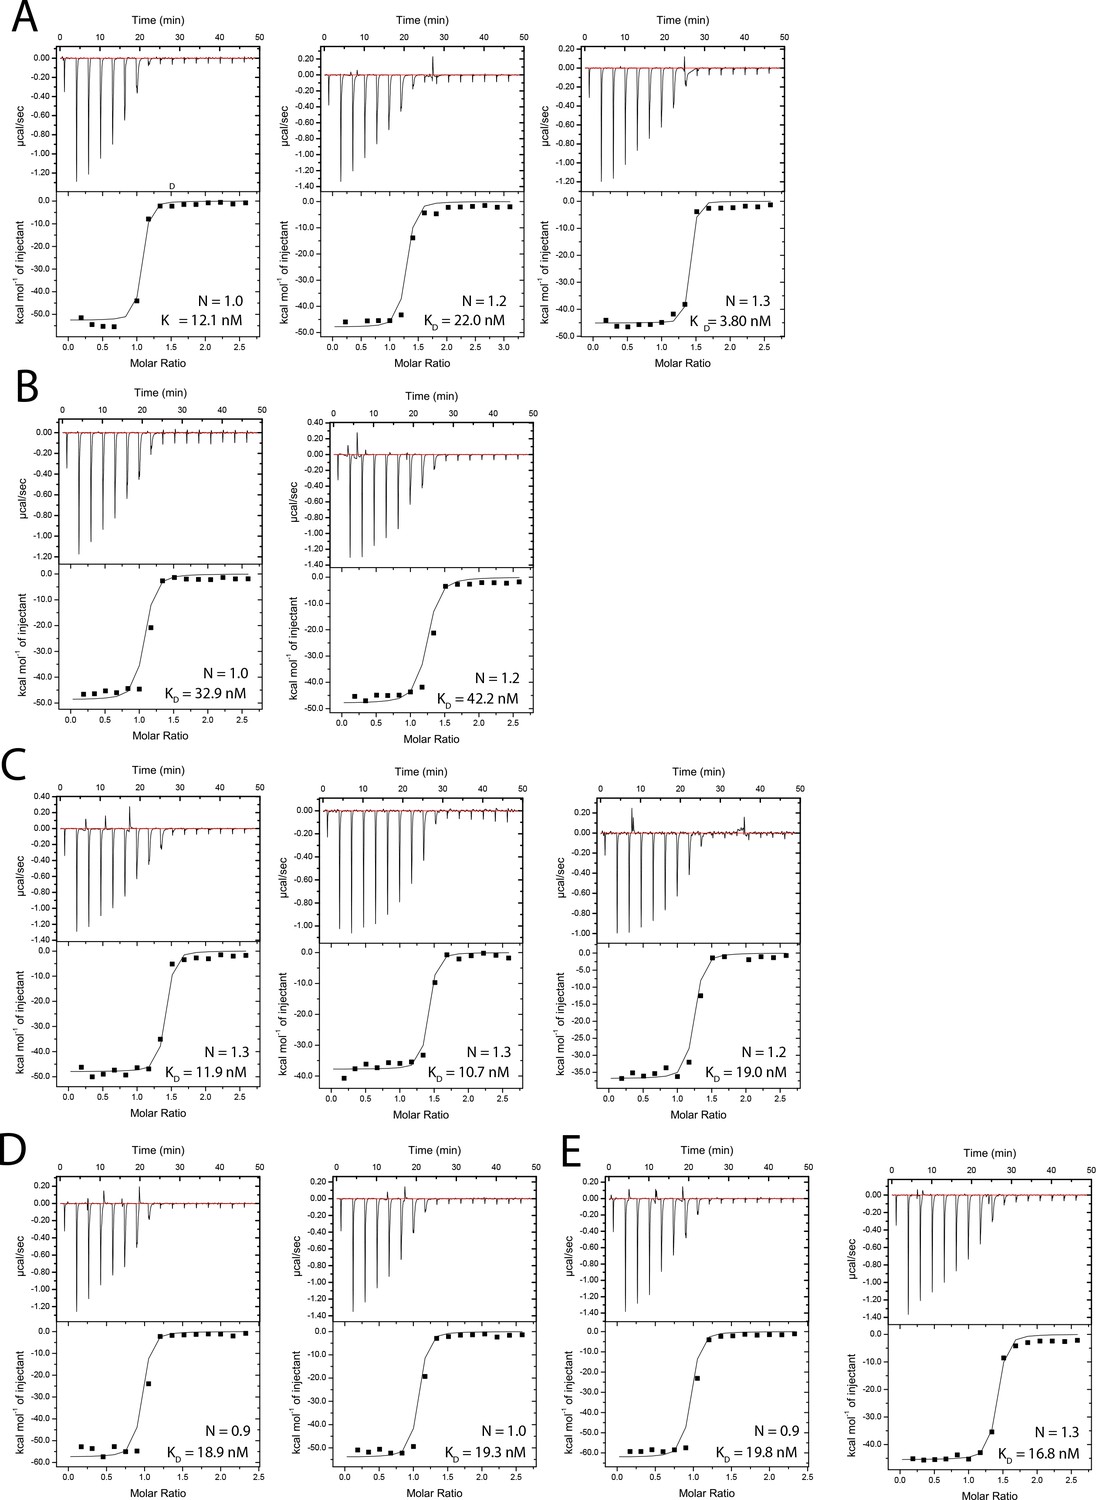
Isothermal titration calorimetry (ITC) measurements of 2F2 Fab binding to peptides 210-1 (A), 210-2 (B), 210-3 (C), 210-4 (D), and 210-5 (E).
Figure 3—figure supplement 2
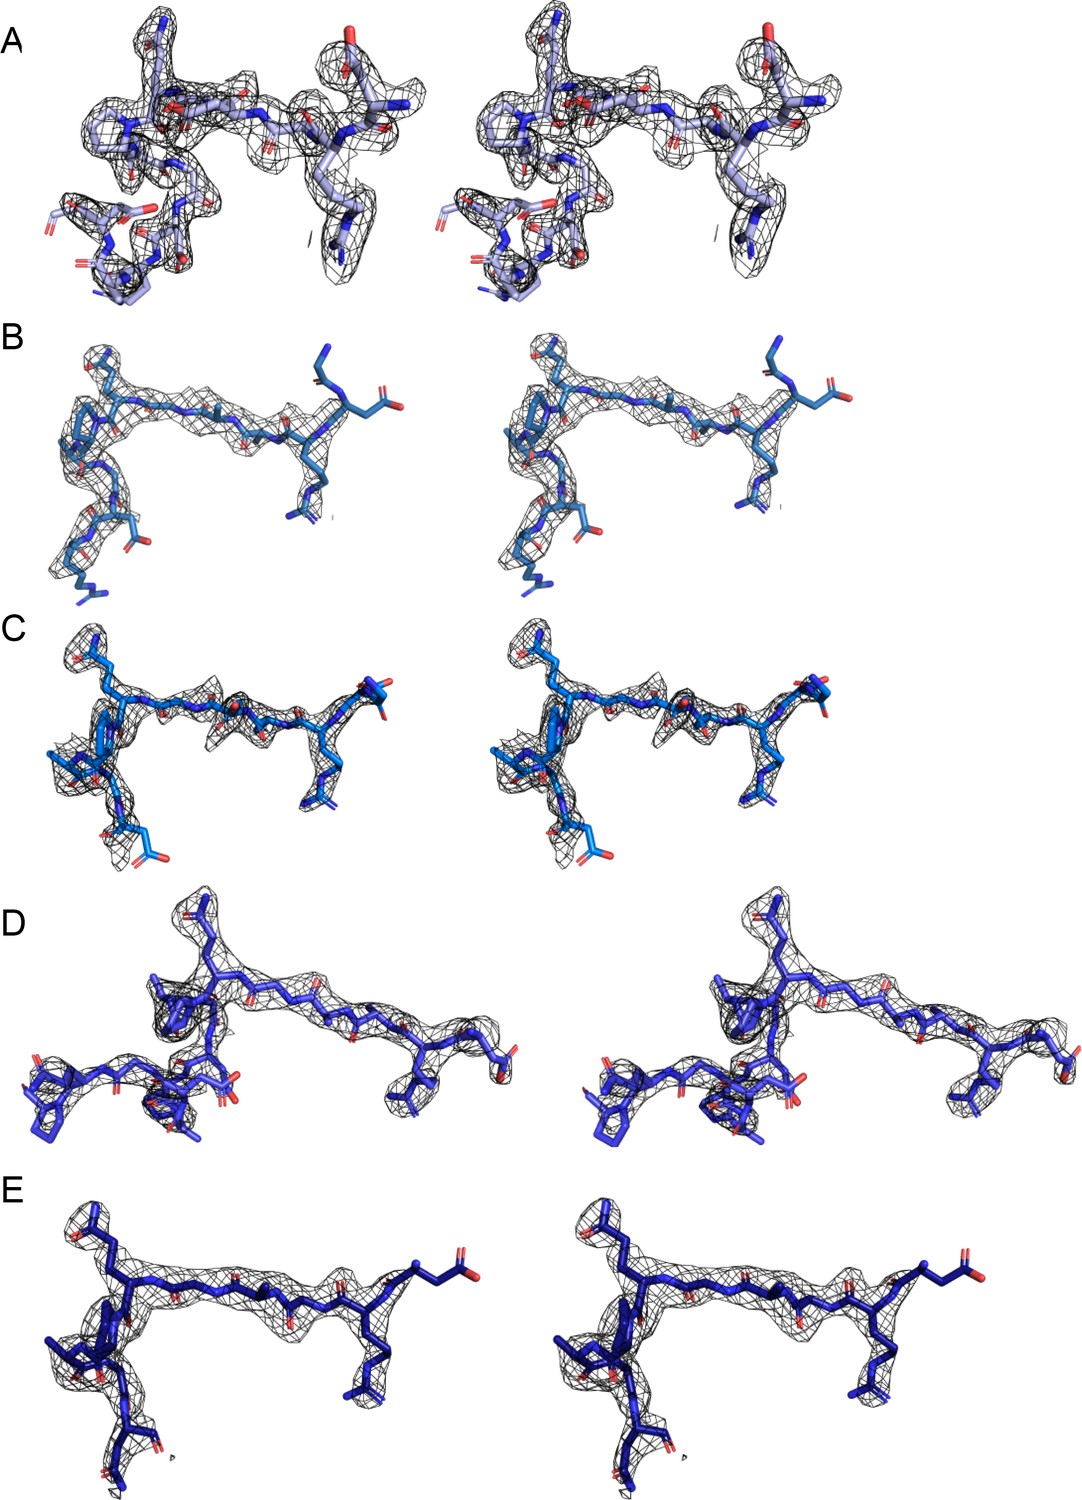
Stereo-image of the composite omit map electron density contoured at 1.0–1.2 sigma for peptides 210-1 (A), 210-2 (B), 210-3 (C), 210-4 (D), and 210-5 (E).
Figure 3—figure supplement 3
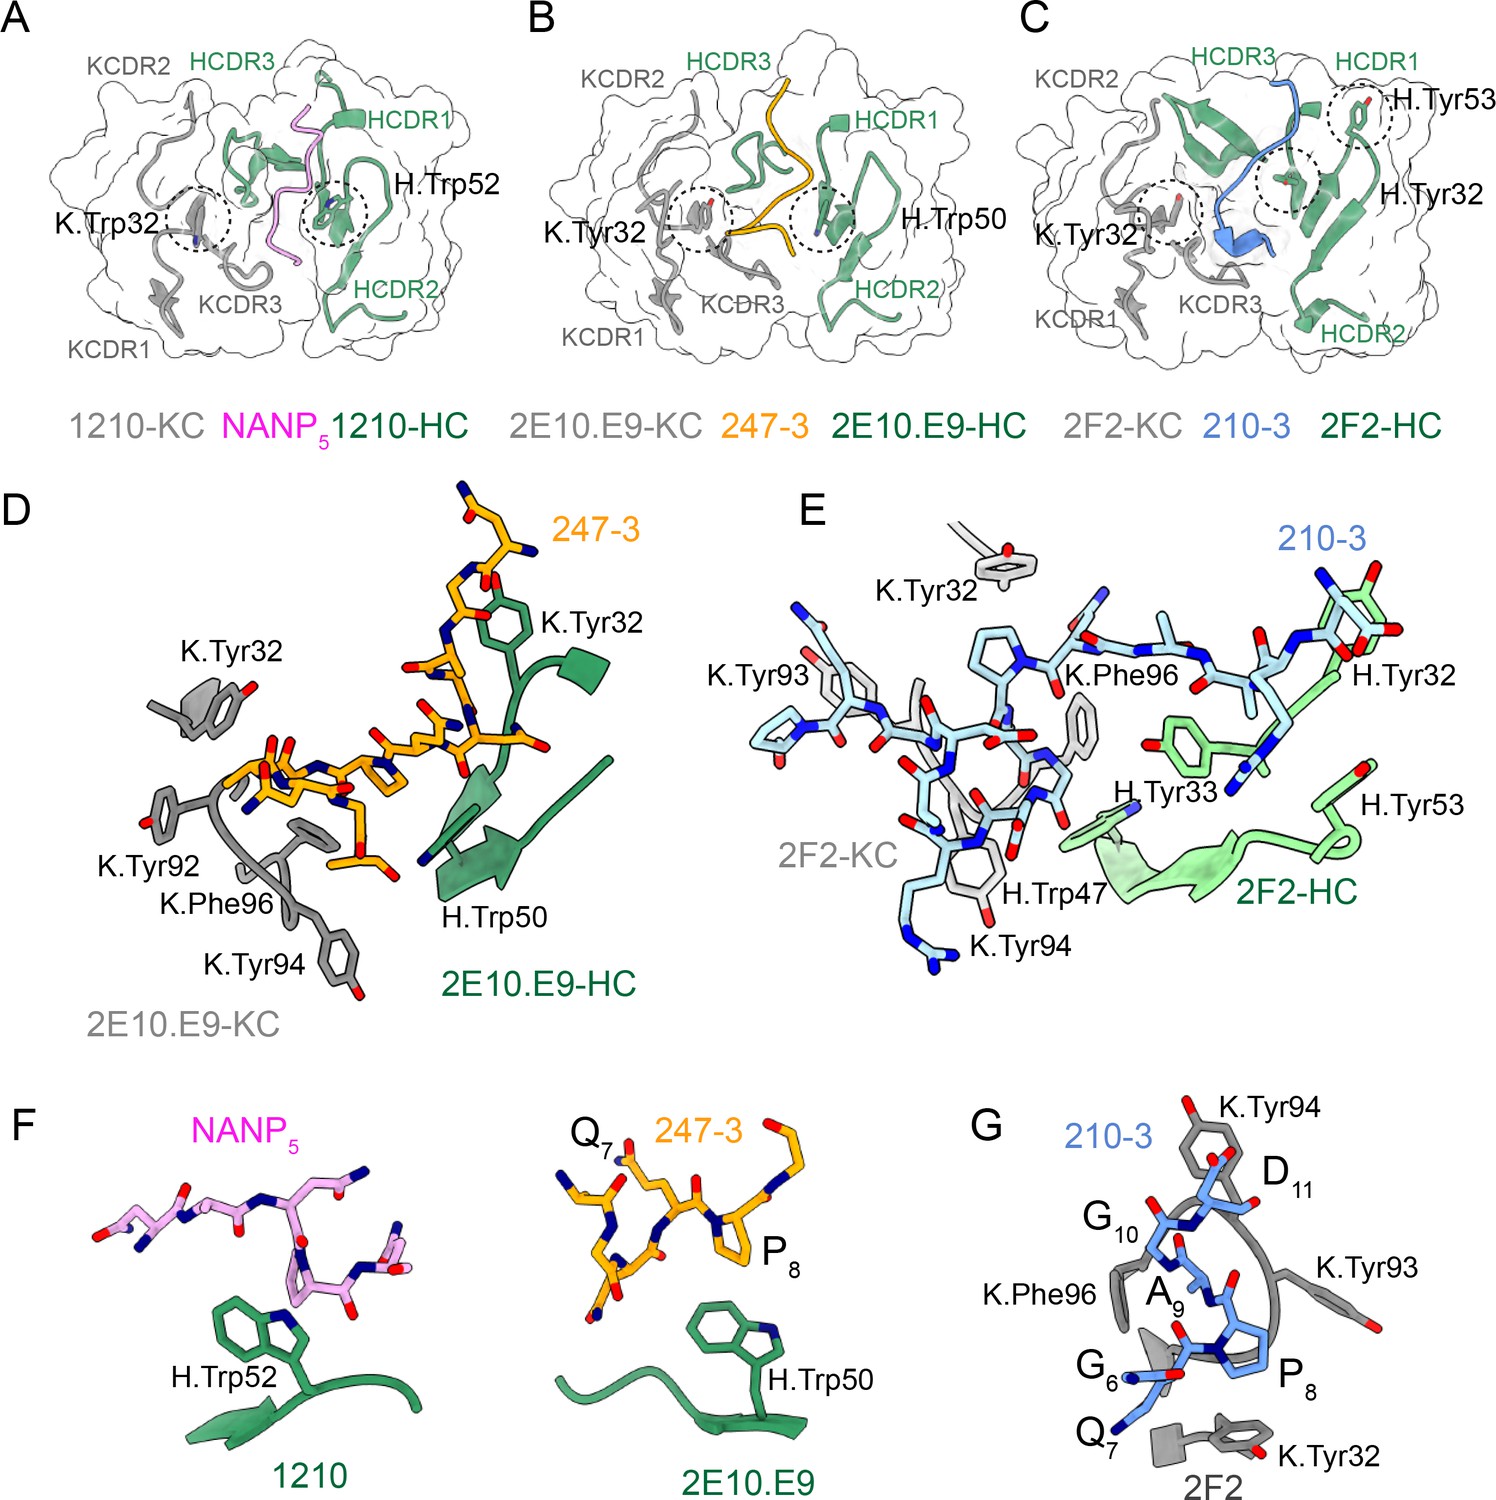
Interactions between germline-encoded aromatic residues in anti-CSP monoclonal antibodies (mAbs) and repeat peptides.
Heavy chain complementarity-determining region (HCDR) and kappa chain complementarity-determining region (KCDR) are colored green and gray, respectively. The positions of germline-encoded tryptophan and tyrosine residues interacting with the peptides are highlighted with black dashed circles. (A) 1210 Fab (Imkeller et al., 2018) and NANP5 peptide (pink); (B, D) 2E10.E9 Fab and 247-4 peptide (orange); (C, E) 2F2 Fab and 210-3 peptide (blue). (F) Interactions between peptide proline residues and H.Trp52 in 1210 Fab (left panel) and H.Trp50 in 2E10.E9 Fab (right panel). (G) Residues 8PAG10 of PvCSPvk210 peptides adopt one turn of a 310-helix, which is positioned in the pocket formed by aromatic residues of KCDR1 and 3.
Figure 3—figure supplement 4
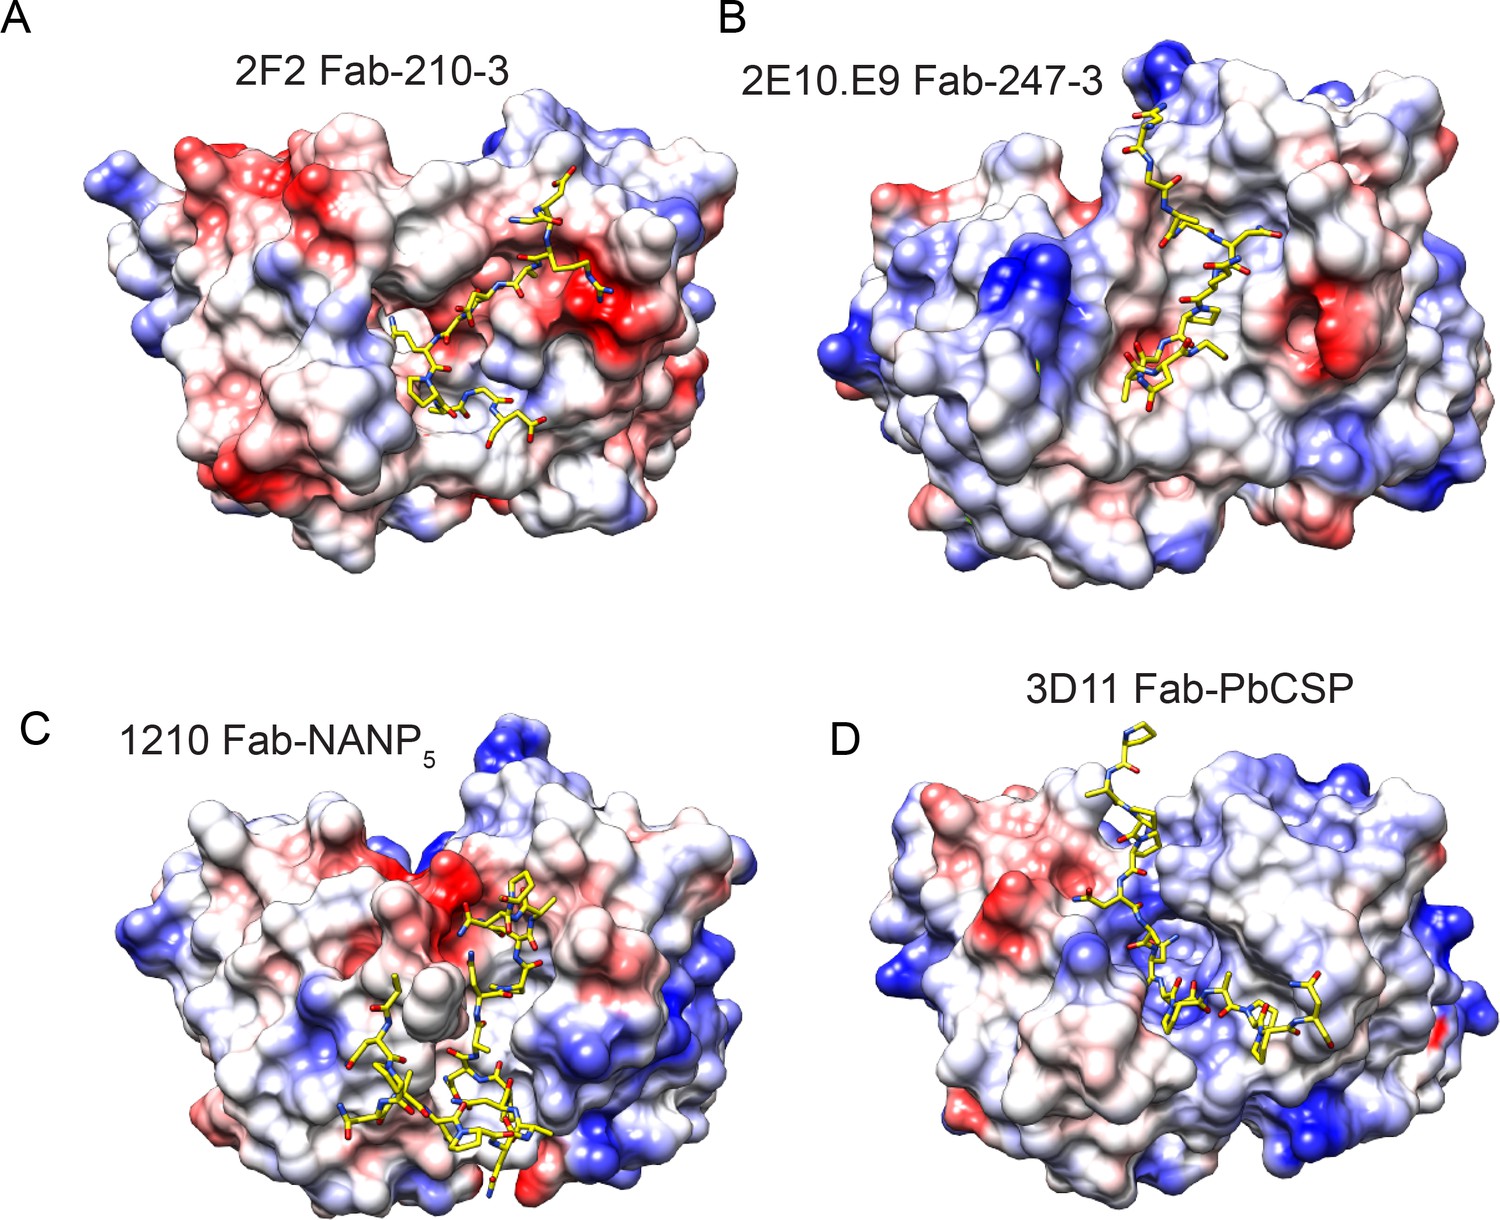
Electrostatic surface potential of monoclonal antibodies (mAbs) 2F2 (A), 2E10.E9 (B), 1210 (Imkeller et al., 2018) (C), and 3D11 (Kucharska et al., 2020) (D) bound to CSP peptides.
Scale: –5 kT e–1 (red) to +5 kT e–1 (blue).
Figure 4 with 2 supplements
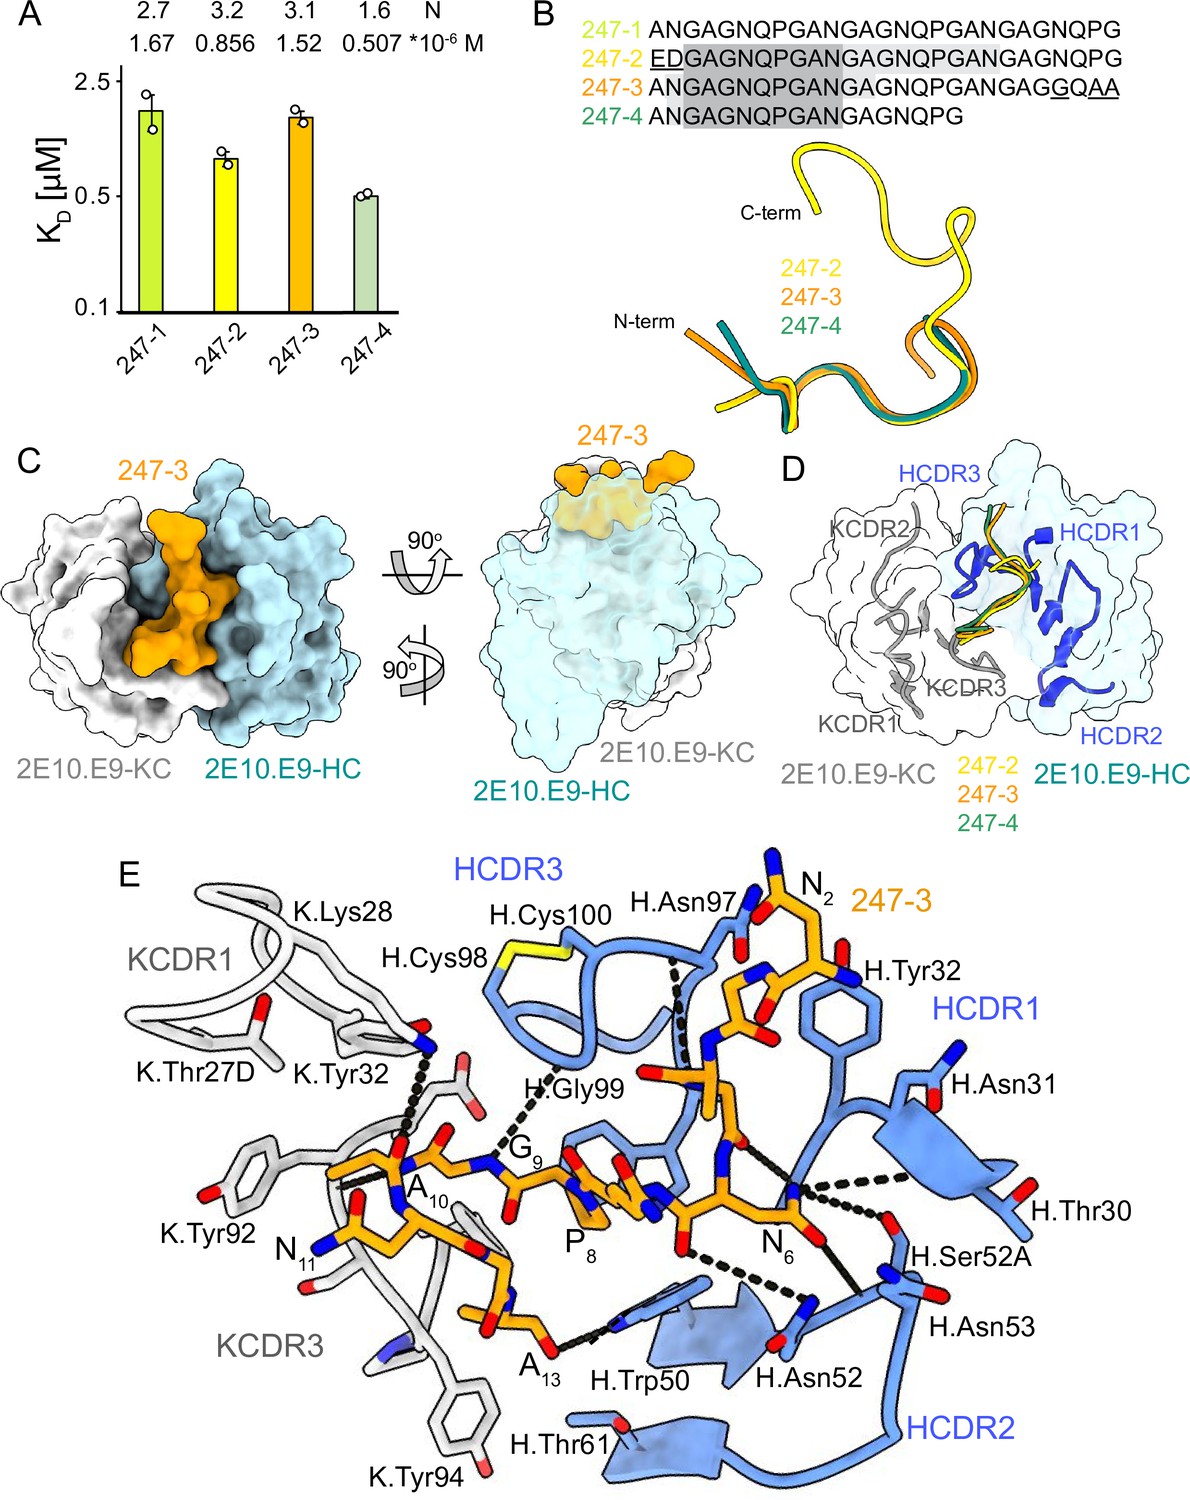
2E10.E9 Fab binding to PvCSPvk247 repeat peptides.
(A) Affinities of 2E10.E9 Fab for peptides 247-1, 247-2, 247-3, and 247-4 as measured by isothermal titration calorimetry (ITC). Open circles represent independent measurements. Mean binding constant (KD) and binding stoichiometry (N) values are shown above the corresponding bar. Error bars represent SEM. (B) Upper panel: sequences of peptides used in ITC with variable residues underlined. Dark gray denotes the core epitope of the peptide resolved in all X-ray crystal structures, and light gray shading indicates residues resolved in the corresponding X-ray crystal structures. Bottom panel: comparison of the conformations of PvCSP247 peptides in X-ray crystal structures, with peptides 247-2, 247-3, and 247-4 depicted in yellow, orange, and teal, respectively. (C) Top and side views of the 247-3 peptide (orange) in the binding groove of the 2E10.E9 Fab shown as surface representation (heavy chain [HC] shown in blue and kappa chain [KC] shown in white). (D) Comparison of the conformations adopted by the core epitope of peptides 247-2, 247-3, and 247-4 when bound to 2E10.E9. (E) Detailed interactions between Fab 2E10.E9 and peptide 247-3. H-bonds are shown as black dashes, peptide 247-3 is shown in orange, HC is shown in green, and KC is shown in gray. The Fab residues are annotated with H or K letters to indicate heavy and kappa light chain, respectively.
Figure 4—figure supplement 1
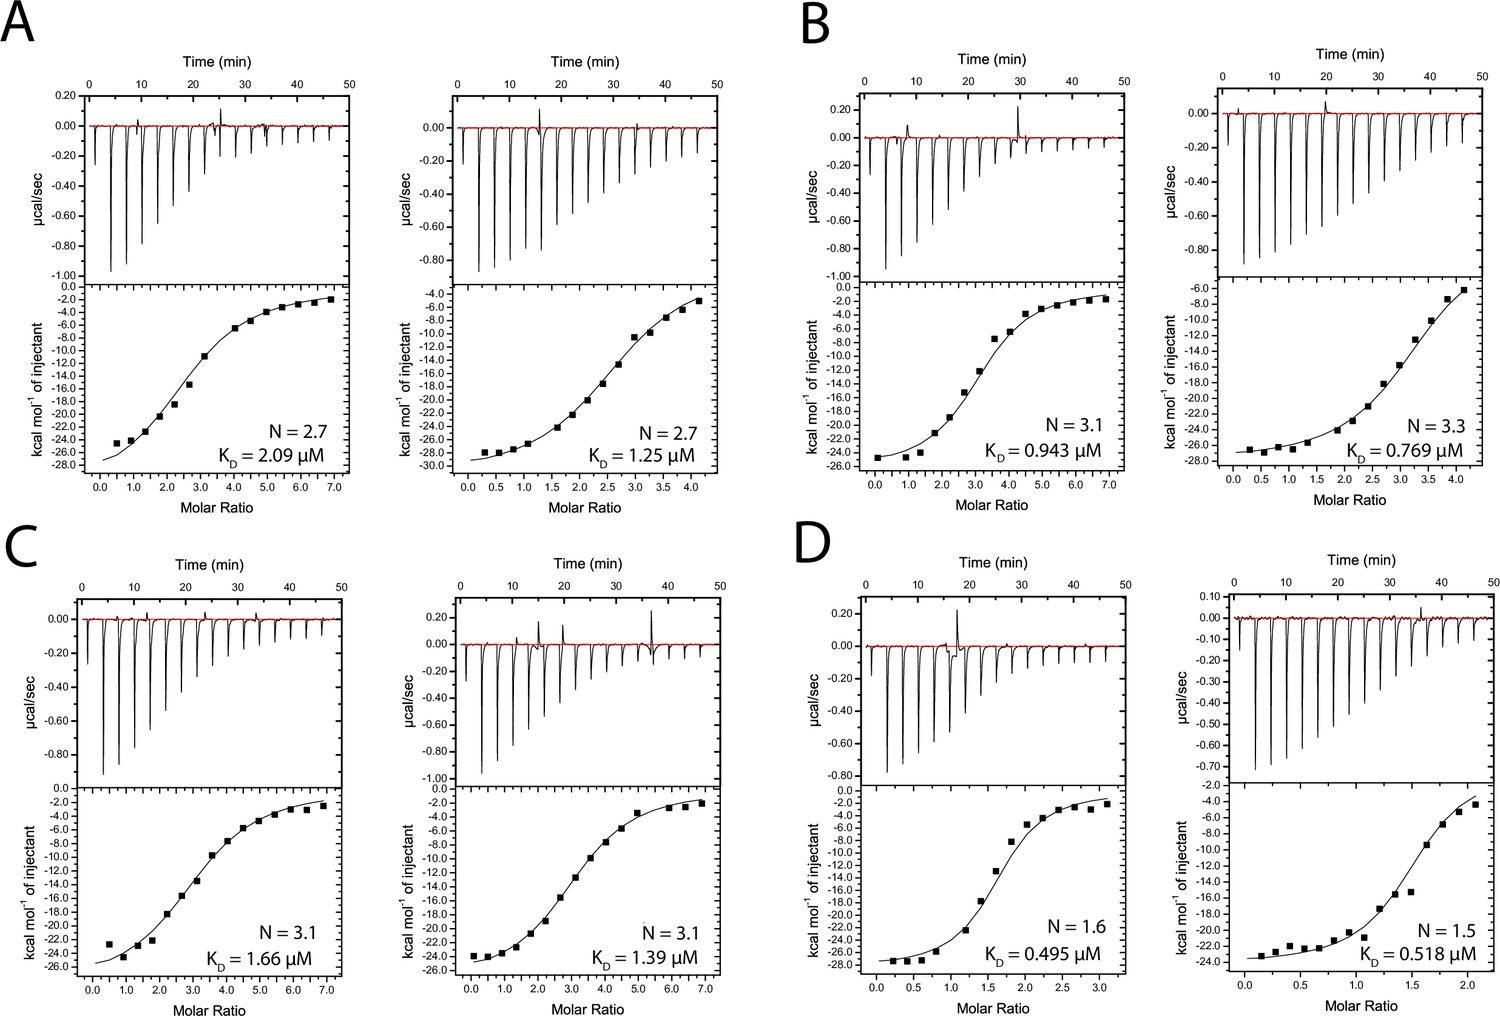
Isothermal titration calorimetry (ITC) measurements of 2E10.E9 Fab binding to peptides 247-1 (A), 247-2 (B), 24-3 (C), and 247-4 (D).
Figure 4—figure supplement 2
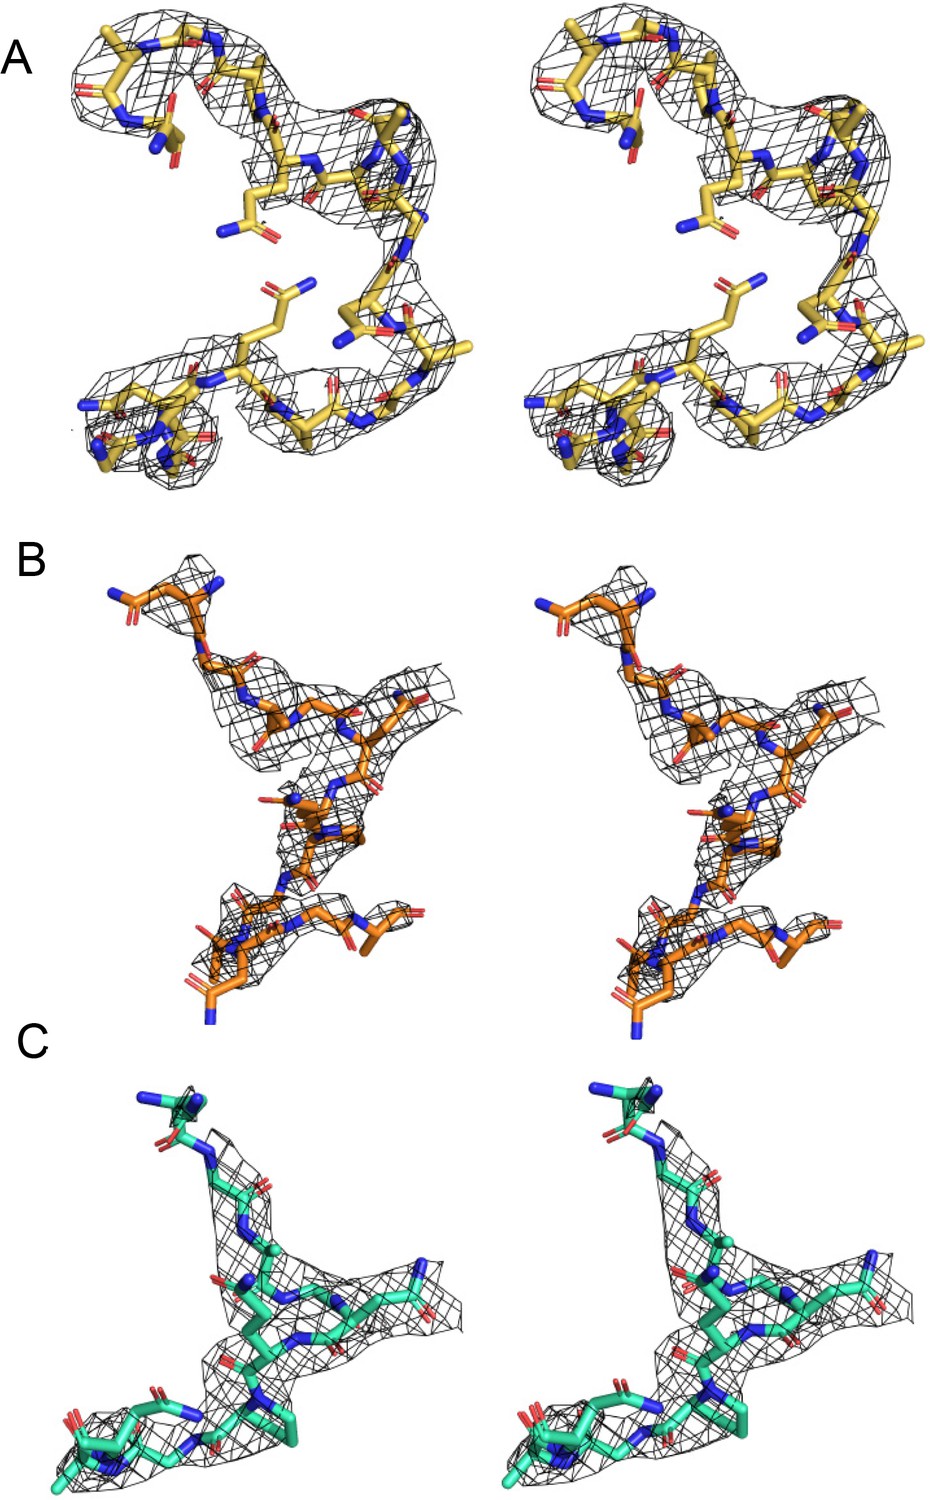
Stereo-image of the composite omit map electron density contoured at 1.2 sigma for peptides 247-2 (A), 247-3 (B), and 247-4 (C).
Figure 5
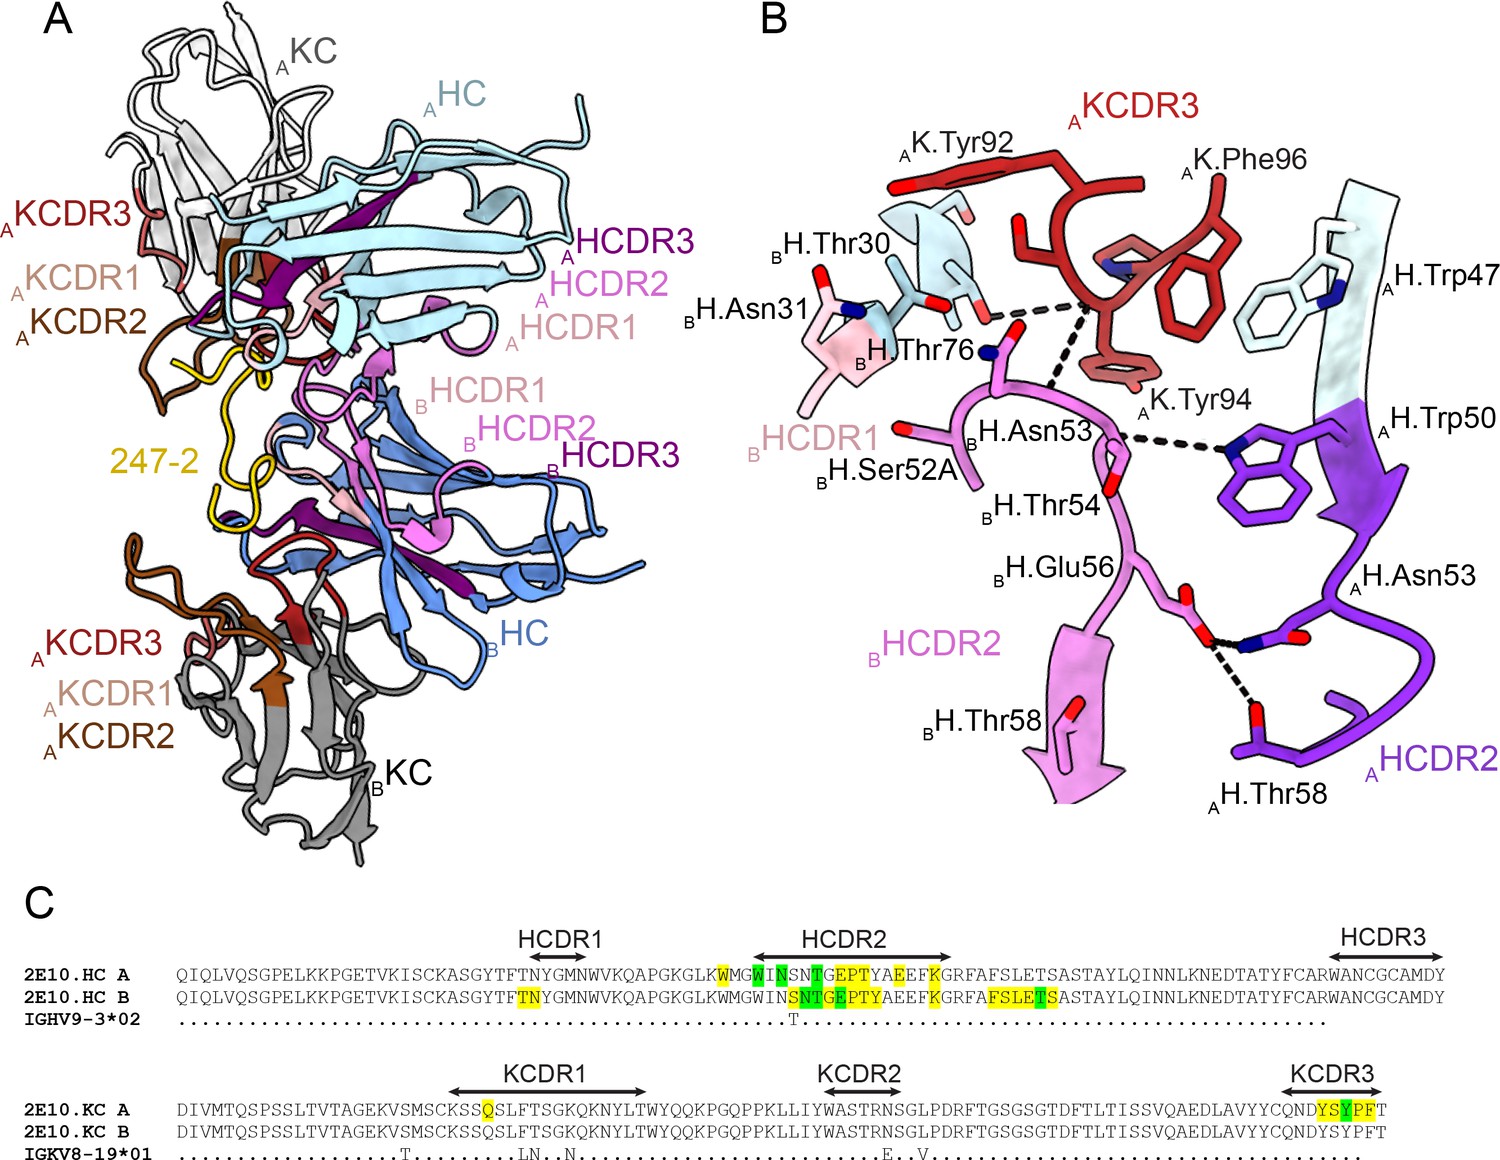
Homotypic Fab-Fab interactions in Fab 2E10.E9-247-2 peptide complex.
(A, B) 2E10.E9 Fabs that simultaneously recognize the 247-2 peptide contact each other through an interface consisting of mainly of heavy chain complementarity-determining region (HCDR)2 of both Fab A and B, as well as kappa chain complementarity-determining region (KCDR)3 of Fab A. The heavy chain (HC) of Fab A and B is colored light and dark blue, respectively. The kappa chain (KC) of Fab A and B is colored light and dark gray, respectively. HCDR1, 2, and 3 are colored light pink, dark pink, and purple, respectively. KCDR1, 2, and 3 are shown in light brown, dark brown, and red, respectively. The 247-2 peptide is depicted in yellow. Black dashed lines denote H-bonds. Residues forming Fab-Fab contacts are labeled with the position of the Fab (A or B) indicated in subscript. (C) Sequence alignment of monoclonal antibody (mAb) 2E10.E9 with its inferred germline precursor. Yellow highlight: residues involved in homotypic interactions; green highlight: residues involved in homotypic interactions that form H-bonds.
Figure 6 with 1 supplement
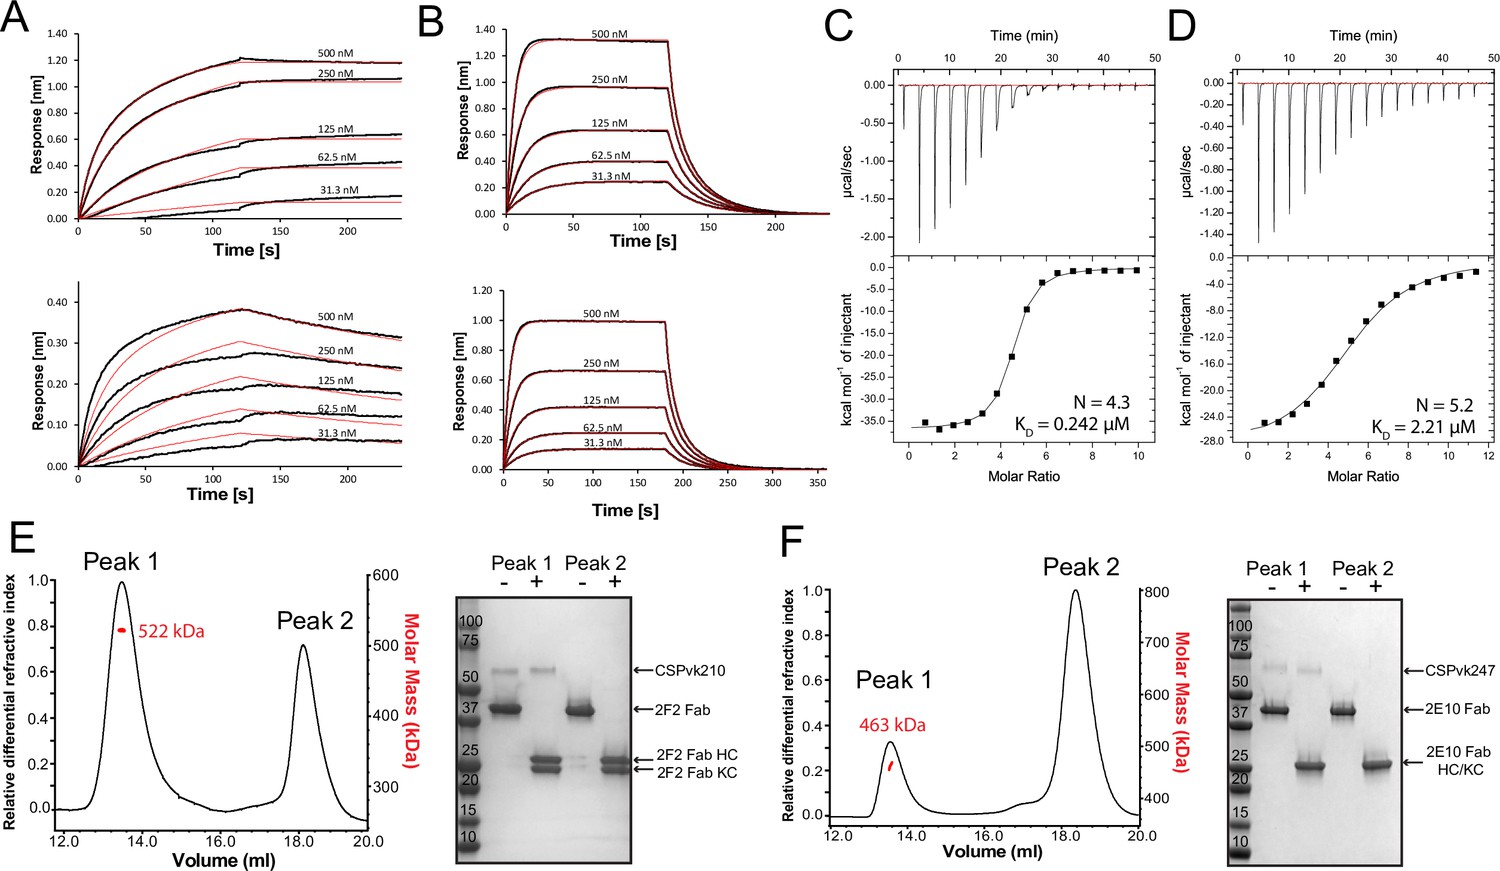
Binding of 2F2 and 2E10.E9 to full-length PvCSPvk210 and PvCSPvk247.
Binding kinetics of twofold dilutions of 2F2 IgG and Fab (A, upper panel and lower panel, respectively) to PvCSPvk210, and 2E10.E9 IgG and Fab (B, upper panel and lower panel, respectively) to PvCSPvk247, as measured by biolayer interferometry (BLI). Representative sensograms are shown in black and 2:1 model best fits in red. Data shown are representative of three independent measurements. Isothermal titration calorimetry (ITC) analysis of 2F2 Fab binding to PvCSPvk210 (C) and 2E10.E9 Fab binding to PvCSPvk247 (D) at 25°C. (C, top panels): raw data of PvCSPvk210 (5 µM) in the sample cell titrated with 2F2 Fab (240 µM) in the syringe. (D, top panels): raw data of PvCSPvk247 (5 µM) in the sample cell titrated with 2E10.E9 Fab (400 µM) in the syringe. (C, D, bottom panel): plot and trendline of heat of injectant corresponding to the raw data. Results from size-exclusion chromatography coupled with multiangle light scattering (SEC-MALS) for the Fab 2F2-PvCSPvk210 sample (E, left panel) and 2E10.E9 Fab-PvCSPvk247 (F, left panel) sample, where the Fabs are in molar excess. Measurement of the molar mass of the eluting complex is shown as a red line. Mean molar mass is indicated. SDS-PAGE analysis of resulting peaks 1 and 2 for 2F2 Fab-PvCSPvk210 (E, right panel) and 2E10.E9 Fab-PvCSPvk247 (F, right panel) samples from SEC-MALS. Each peak was sampled in reducing and nonreducing conditions as indicated by + and –, respectively.
-
Figure 6—source data 1
SDS-PAGE analysis of 2F2 Fab-PvCSPvk210 and 2E10.E9 Fab-PvCSPvk247 complexes.
- https://cdn.elifesciences.org/articles/72908/elife-72908-fig6-data1-v2.zip
Figure 6—figure supplement 1
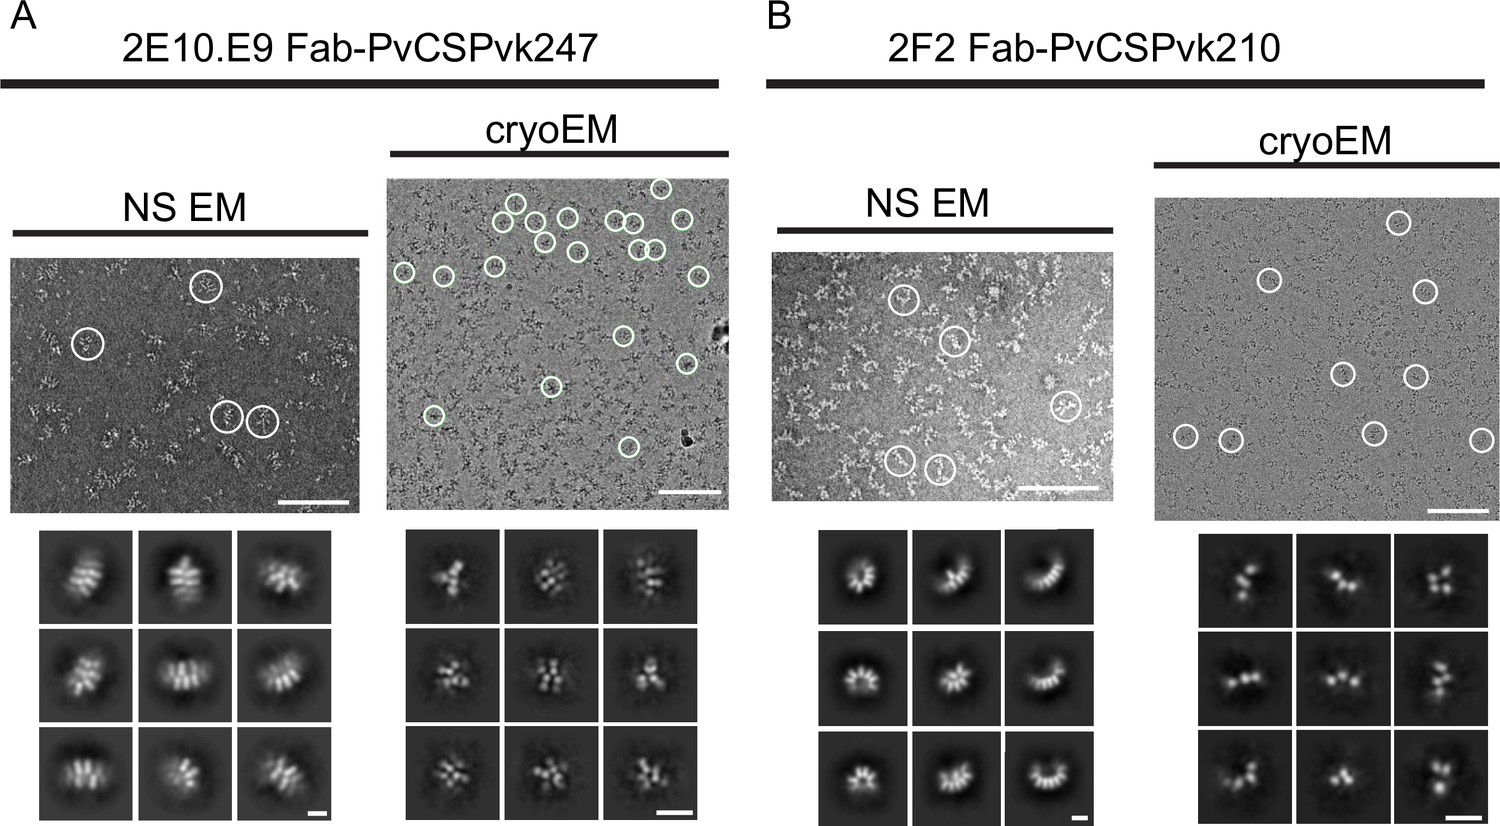
Negative stain electron microscopy (NS EM) and electron cryomicroscopy (cryo-EM) analysis of 2E10.E9 Fab-PvCSPvk247 (A) and 2F2 Fab-PvCSPvk210 (B) complexes.
Upper panels show representative NS EM (left panel) and cryo-EM (right panel) micrographs. Positions of representative individual particles are highlighted with white circles. Lower panels: representative NS EM (left panel) and cryo-EM (right panel) 2D class averages. Scale bars on micrographs: 100 nm. Scale bars on 2D classes: 10 nm.
Figure 7
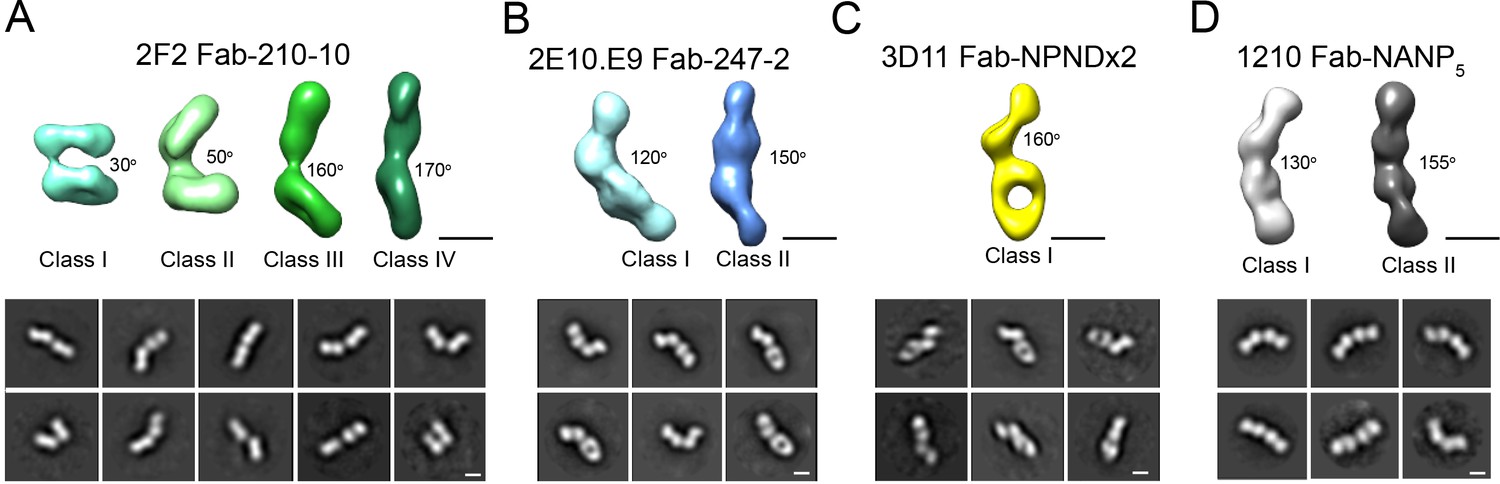
Evaluation of flexibility for various Fab-CSP peptide complexes by negative stain electron microscopy.
Refined 3D classes (upper panels) and representative 2D class averages (bottom panels) of (A) 2F2 Fab-210-10 peptide, (B) 2E10.E9 Fab-247-2 peptide, (C) 3D11 Fab-NPNDx2 peptide (PPPPNPND)3 (Kucharska et al., 2020), and (D) 1210 Fab-(NANP)5 peptide (Imkeller et al., 2018) complexes. The approximate angle between adjacent Fabs in each class is indicated. Scale bars on 3D and 2D classes: 50 nm.
Tables
Table 1
X-ray crystallography data collection and refinement statistics.
| 2F2-210-1 | 2F2-210-2 | 2F2-210-3 | 2F2-210-4 | 2F2-210-5 | 2E10-247-2 | 2E10-247-3 | 2E10-247-4 | |
|---|---|---|---|---|---|---|---|---|
| Beamline | APS 23-ID-B | APS 23-ID-D | APS 23-ID-B | APS 23-ID-B | APS 23-ID-D | APS 23-ID-B | APS 23-ID-B | APS 23-ID-D |
| Wavelength (Å) | 1.033167 | 1.033167 | 1.033167 | 1.033167 | 1.033167 | 1.033167 | 1.033167 | 1.033200 |
| Space group | P 1 | C 2 | C 2 | P 1 | C 2 | P 31 | P 21 | P 1 |
| Cell dimensions | 71.5, 81.4, 82.3 | 92.9, 60.4, 158.3 | 92.6, 60.8, 81.4 | 71.7, 82.3, 82.8 | 93.4, 60.5, 159.1 | 142.4, 142.4, 91.3 | 56.4, 144.4, 60.5 | 54.5, 66.3, 142.3 |
| α, β, γ (o) | 94.6, 114.1, 111.6 | 90, 101.5, 90 | 90, 101.6, 90 | 95.3, 113.8, 111.5 | 90, 101.2, 90 | 90, 90, 120 | 90, 102.8, 90 | 100.4, 92.3, 91.7 |
| Resolution (Å)* | 29.48–2.20 (2.25–2.20) | 29.21–2.54 (2.65–2.54) | 29.71–1.97(2.02–1.97) | 29.61–2.67 (2.77–2.67) | 29.69–2.27 (2.34–2.27) | 29.55–3.19 (3.30–3.19) | 29.48–2.68 (2.78–2.68) | 29.34–2.71 (2.81–2.71) |
| No. molecules in the asymmetric unit (ASU) | 3 | 2 | 1 | 3 | 2 | 2 | 2 | 4 |
| No. observations | 264,344 (16,542) | 181,285 (21,112) | 101,891 (4384) | 155,413 (16,123) | 471,275 (38,772) | 693,999 (70,530) | 184,740 (18,748) | 552,431 (55,667) |
| No. unique observations | 75,088 (4440) | 28,642 (3484) | 31,038 (1962) | 43,179 (4542) | 40,512 (3722) | 34,411 (3469) | 26,439 (2627) | 53,126 (5316) |
| Multiplicity | 3.5 (3.7) | 6.3 (6.1) | 3.3 (2.2) | 4.7 (1.5) | 11.6 (10.3) | 20.1 (20.3) | 7.0 (7.1) | 10.4 (10.5) |
| Rmerge (%)† | 15.5 (95.2) | 16.4 (144.5) | 6.5 (55.7) | 13.9 (62.8) | 34.2 (175.0) | 36.1 (370.6) | 21.6 (158.6) | 22.4 (123.5) |
| Rpim (%) ‡ | 7.5 (32.4) | 10.6 (97.6) | 6.1 (46.9) | 7.8 (30.8) | 15.3 (83.0) | 8.2 (84.0) | 8.8 (63.7) | 7.3 (39.8) |
| < I/σ I> | 5.2 (1.5) | 6.7 (1.5) | 8.3 (1.5) | 4.7 (1.5) | 9.4 (1.5) | 13.2 (1.7) | 9.2 (1.6) | 7.4 (1.6) |
| CC1/2 | 0.965 (0.527) | 0.994 (0.529) | 0.996 (0.603) | 0.987 (0.669) | 0.927 (0.435) | 0.998 (0.756) | 0.993 (0.578) | 0.995 (0.729) |
| Completeness (%) | 97.5 (97.1) | 99.8 (100.0) | 98.7 (90.5) | 98.3 (97.8) | 99.9 (100.0) | 99.8 (99.6) | 99.9 (100.0) | 100.0 (100.0) |
| Refinement statistics | ||||||||
| Reflections used in refinement | 74,672 | 28,604 | 31,030 | 43,160 | 40,501 | 34,411 | 26,439 | 53,126 |
| Reflections used for R-free | 3731 | 1432 | 1552 | 2162 | 2026 | 1732 | 1314 | 2067 |
| Non-hydrogen atoms | 10,580 | 6872 | 3595 | 10,504 | 6941 | 6818 | 6885 | 13,707 |
| Macromolecule | 10,123 | 6864 | 3418 | 10,344 | 6841 | 6818 | 6845 | 13,620 |
| Water | 433 | 8 | 177 | 160 | 100 | - | 34 | 87 |
| Heteroatom | - | - | - | - | - | - | 6 | - |
| R §work/R¶free | 17.9/22.0 | 20.2/24.9 | 18.6/23.5 | 18.6/22.8 | 19.2/23.8 | 18.0/21.0 | 20.7/23.9 | 20.9/24.6 |
| Rms deviations from ideality | ||||||||
| Bond lengths (Å) | 0.007 | 0.002 | 0.015 | 0.002 | 0.003 | 0.010 | 0.010 | 0.010 |
| Bond angle (°) | 0.87 | 0.51 | 1.33 | 0.57 | 0.71 | 1.39 | 1.25 | 1.22 |
| Ramachandran plot | ||||||||
| Favored regions (%) | 97.5 | 97.9 | 97.3 | 97.9 | 98.6 | 94.6 | 97.1 | 97.5 |
| Allowed regions (%) | 2.3 | 2.1 | 2.7 | 1.9 | 1.4 | 5.4 | 2.9 | 2.5 |
| B-factors (A2) | ||||||||
| Wilson B-value | 39.1 | 64.7 | 35.5 | 47.0 | 50.0 | 91.0 | 42.1 | 54.7 |
| Average B-factors | 45.7 | 75.0 | 45.7 | 51.0 | 53.7 | 111.0 | 71.0 | 77.0 |
| Average macromolecule | 45.7 | 75.9 | 45.9 | 51.1 | 53.7 | 111.0 | 71.4 | 77.2 |
| Average heteroatom | - | - | - | - | - | - | 69.8 | - |
| Average water molecule | 44.0 | 61.4 | 41.1 | 41.9 | 54.3 | - | 37.8 | 43.3 |
-
*
Values in parentheses refer to the highest resolution bin.
-
†
Rmerge = ∑hkl ∑i | Ihkl, i -< Ihkl > | / ∑hkl< Ihkl > .
-
‡
Rpim = ∑hkl [1/(N – 1)]1/2 ∑i | Ihkl, i -< Ihkl > | / ∑hkl< Ihkl > .
-
§
Rwork = (∑ | |Fo | - |Fc | |) / (∑ | |Fo |).
-
¶
5% of data were used for the Rfree calculation.
Key resources table
| Reagent type (species) or resource | Designation | Source or reference | Identifiers | Additional information |
|---|---|---|---|---|
| Recombinant DNA reagent | pcDNA3.4-2F2 Fab HC (plasmid) | This paper | N/A | 2F2 Fab heavy chain gene in pcDNA3.4 TOPO vector |
| Recombinant DNA reagent | pcDNA3.4-2F2 KC (plasmid) | This paper | N/A | 2F2 light chain gene in pcDNA3.4 TOPO vector |
| Recombinant DNA reagent | pcDNA3.4-2E10.E9 Fab HC (plasmid) | This paper | N/A | 2E10.E9 Fab heavy chain gene in pcDNA3.4 TOPO vector |
| Recombinant DNA reagent | pcDNA3.4-2E10.E9 KC (plasmid) | This paper | N/A | 2E10.E9 light chain gene in pcDNA3.4 TOPO vector |
| Recombinant DNA reagent | pcDNA3.4- PvCSPvk210- His6x (plasmid) | This paper | N/A | PvCSPvk210 gene with His tag in pcDNA3.4 TOPO vector |
| Recombinant DNA reagent | pcDNA3.4- PvCSPvk247- His6x (plasmid) | This paper | N/A | PvCSPvk247 gene with His tag in pcDNA3.4 TOPO vector |
| Cell line (Homo sapiens) | FreeStyle 293F cells | Thermo Fisher Scientific | Cat# R79007 | |
| Cell line (Mus musculus) | 2F2 hybridoma cell line | Nardin et al., 1982, Alan Cochrane, unpublished results | BEI Resources #MRA-184; RRID:CVCL_A7VR | |
| Cell line (M. musculus) | 2E10.E9 hybridoma cell line | Nardin et al., 1982, Alan Cochrane, unpublished results | BEI Resources #MRA-185; RRID:CVCL_A7VT | |
| Chemical compound, drug | Gibco FreeStyle 293 Expression Medium | Thermo Fisher Scientific | Cat# 12338026 | |
| Chemical compound, drug | Gibco Hybridoma-SFM | Thermo Fisher Scientific | Cat# 12045076 | |
| Chemical compound, drug | FectoPRO DNA Transfection Reagent | VWR | Cat# 10118-444 | |
| Chemical compound, drug | Fetal bovine serum | Thermo Fisher Scientific | Cat# 12483-020 | |
| Antibody | 2F2 IgG (mouse monoclonal) | Nardin et al., 1982, Alan Cochrane, unpublished results | N/A | Purified from 2F2 hybridoma cell line; see Materials and methods |
| Antibody | 2E10.E9 IgG (mouse monoclonal) | Nardin et al., 1982, Alan Cochrane, unpublished results | N/A | Purified from 2E10.E9 hybridoma cell line; see Materials and methods |
| Biological sample (Carica papaya) | Papain from papaya latex | Sigma-Aldrich | Cat# P4762 | |
| Peptide, recombinant protein | 1210 Fab | Imkeller et al., 2018 | N/A | See Materials and methods for concentrations and masses used, and buffer conditions |
| Peptide, recombinant protein | 3D11 Fab | Kucharska et al., 2020 | N/A | See Materials and methods for concentrations and masses used, and buffer conditions |
| Peptide, recombinant protein | 2F2 Fab | This paper | N/A | See Materials and methods for concentrations and masses used, and buffer conditions |
| Peptide, recombinant protein | 2E10.E9 Fab | This paper | N/A | See Materials and methods for concentrations and masses used, and buffer conditions |
| Peptide, recombinant protein | 210-1 (GDRADGQ PAGDRADGQPA) | This paper | N/A | Derived from PvCSPvk210 repeat region |
| Peptide, recombinant protein | 210-2 (GDRAAGQ PAGDRAAGQPA) | This paper | N/A | Derived from PvCSPvk210 repeat region |
| Peptide, recombinant protein | 210-3 (GDRADGQP AGDRAAGQPA) | This paper | N/A | Derived from PvCSPvk210 repeat region |
| Peptide, recombinant protein | 210-4 (GDRAAGQ PAGDRADGQP) | This paper | N/A | Derived from PvCSPvk210 repeat region |
| Peptide, recombinant protein | 210-5 (GDRAAGQ PAGNGAGGQAA) | This paper | N/A | Derived from PvCSPvk210 repeat region |
| Peptide, recombinant protein | 210-6 (GDRADGQ PAGDRADGQ PAGDRADGQPA) | This paper | N/A | Derived from PvCSPvk210 repeat region |
| Peptide, recombinant protein | 210-7 (GDRAAGQ PAGDRAAGQ PAGDRAAGQPA) | This paper | N/A | Derived from PvCSPvk210 repeat region |
| Peptide, recombinant protein | 210-8 (GDRADGQ PAGDRAAGQ PAGDRADGQPA) | This paper | N/A | Derived from PvCSPvk210 repeat region |
| Peptide, recombinant protein | 210-9 (GDRAAGQ PAGDRAAGQ PAGNGAGGQAA) | This paper | N/A | Derived from PvCSPvk210 repeat region |
| Peptide, recombinant protein | 210-10 (GDRADGQ PAGDRADGQ PAGDRADGQ PAGDRADGQPA) | This paper | N/A | Derived from PvCSPvk210 repeat region |
| Peptide, recombinant protein | 247-1 (ANGAGNQ PGANGAGNQ PGANGAGNQPG) | This paper | N/A | Derived from PvCSPvk247 repeat region |
| Peptide, recombinant protein | 247-2 (EDGAGNQ PGANGAGNQ PGANGAGNQPG) | This paper | N/A | Derived from PvCSPvk247 repeat region |
| Peptide, recombinant protein | 247-3 (ANGAGNQ PGANGAGNQ PGANGAGGQAA) | This paper | N/A | Derived from PvCSPvk247 repeat region |
| Peptide, recombinant protein | 247-4 (ANGAGNQ PGANGAGNQPG) | This paper | N/A | Derived from PvCSPvk247 repeat region |
| Peptide, recombinant protein | NPNDx2 (PPPPNPNDP PPPNPNDP PPPNPND) | Kucharska et al., 2020 | N/A | Derived from PbCSP ANKA repeat region |
| Peptide, recombinant protein | NANP5 (NANPNAN PNANPNA NPNANP) | Imkeller et al., 2018 | N/A | Derived from PfCSP NF54 repeat region |
| Software, algorithm | GROMACS 2016.5 | Abraham et al., 2015; Berendsen et al., 1995 | https://manual.gromacs.org/documentation/2016-current/index.html;RRID:SCR_014565 | |
| Software, algorithm | CHARMM22* | Best and Hummer, 2009; Best and Mittal, 2010; Lindorff-Larsen et al., 2012; MacKerell et al., 1998; Piana et al., 2011 | https://www.charmm.org/charmm/?CFID=66837e22-4ee5-47ba-bcbf-b4b385c2397e&CFTOKEN=0; RRID:SCR_014892 | |
| Software, algorithm | LINCS | Hess, 2008 | N/A | |
| Software, algorithm | Particle-Mesh Ewald algorithm | Darden et al., 1993; Essmann et al., 1995 | N/A | |
| Software, algorithm | Parrinello–Rahman algorithm | Parrinello and Rahman, 1981 | N/A | |
| Software, algorithm | VMD | Humphrey et al., 1996 | https://www.ks.uiuc.edu/Research/vmd/; RRID:SCR_001820 | |
| Software, algorithm | Matplotlib | Hunter, 2007 | https://matplotlib.org/; RRID:SCR_008624 | |
| Software, algorithm | MDTraj | McGibbon et al., 2015 | https://www.mdtraj.org/1.9.5/index.html | |
| Software, algorithm | Octet Data AnalysisSoftware 9.0.0.6 | ForteBio | https://www.fortebio.com/products/octet-systems-software | |
| Software, algorithm | MicroCal ITC Origin7.0 Analysis Software | Malvern | https://www.malvernpanalytical.com/ | |
| Software, algorithm | ASTRA | Wyatt | https://www.wyatt.com/products/software/astra.html; RRID:SCR_016255 | |
| Software, algorithm | GraphPad Prism 8 | GraphPad Software | https://www.graphpad.com/; RRID:SCR_002798 | |
| Software, algorithm | SBGrid | SBGrid Consortium | https://sbgrid.org/; RRID:SCR_003511 | |
| Software, algorithm | cryoSPARC v2 | Punjani et al., 2017 | https://cryosparc.com/; RRID:SCR_016501 | |
| Software, algorithm | Relion | Scheres, 2012 | https://www3.mrc-lmb.cam.ac.uk/relion/; RRID:SCR_016274 | |
| Software, algorithm | XDS | Kabsch, 2010 | http://xds.mpimf-heidelberg.mpg.de/; RRID:SCR_015652 | |
| Software, algorithm | Phaser | McCoy et al., 2007 | https://www.phenix-online.org/; RRID:SCR_014224 | |
| Software, algorithm | Phenix (phenix. refine; phenix.real_ space_refine) | Adams et al., 2010 | https://www.phenix-online.org/; RRID:SCR_014224 | |
| Software, algorithm | UCSF Chimera | Pettersen et al., 2004 | https://www.cgl.ucsf.edu/chimera/; RRID:SCR_004097 | |
| Software, algorithm | UCSF ChimeraX | Goddard et al., 2018 | https://www.cgl.ucsf.edu/chimerax/; RRID:SCR_015872 | |
| Software, algorithm | Coot | Emsley et al., 2010 | https://www2.mrc-lmb.cam.ac.uk/personal/pemsley/coot/; RRID:SCR_014222 | |
| Software, algorithm | PyMOL | The PyMOL Molecular Graphics System, version 1.8 Schrödinger, LLC. | https://pymol.org/2/#products; RRID:SCR_000305 | |
| Software, algorithm | PDBePISA | Krissinel and Henrick, 2007 | https://www.ebi.ac.uk/pdbe/pisa/; RRID:SCR_015749 | |
| Software, algorithm | Stride | Heinig and Frishman, 2004 | http://webclu.bio.wzw.tum.de/stride/ | |
| Other | Homemade holey gold grids | Marr et al., 2014 | N/A | |
| Other | Homemade carbon grids | Booth et al., 2011 | N/A |
Additional files
-
Supplementary file 1
Summary of CSP-derived peptides used in this study.
- https://cdn.elifesciences.org/articles/72908/elife-72908-supp1-v2.docx
-
Supplementary file 2
Intramolecular H-bonds (3.0 A cutoff) in PvCSP peptides observed in Fab-peptide co-crystal structures.
No intramolecular H-bonds were detected for peptide 247-4.
- https://cdn.elifesciences.org/articles/72908/elife-72908-supp2-v2.docx
-
Transparent reporting form
- https://cdn.elifesciences.org/articles/72908/elife-72908-transrepform1-v2.pdf
Download links
A two-part list of links to download the article, or parts of the article, in various formats.
Downloads (link to download the article as PDF)
Open citations (links to open the citations from this article in various online reference manager services)
Cite this article (links to download the citations from this article in formats compatible with various reference manager tools)
Structural basis of Plasmodium vivax inhibition by antibodies binding to the circumsporozoite protein repeats
eLife 11:e72908.
https://doi.org/10.7554/eLife.72908


