VTA-projecting cerebellar neurons mediate stress-dependent depression-like behaviors
- Center for Functional Connectomics, Brain Science Institute, Korea Institute of Science and Technology (KIST), Republic of Korea
- Division of Bio-Medical Science and Technology, KIST School, Korea University of Science and Technology (UST), Republic of Korea
Figures
Figure 1 with 2 supplements
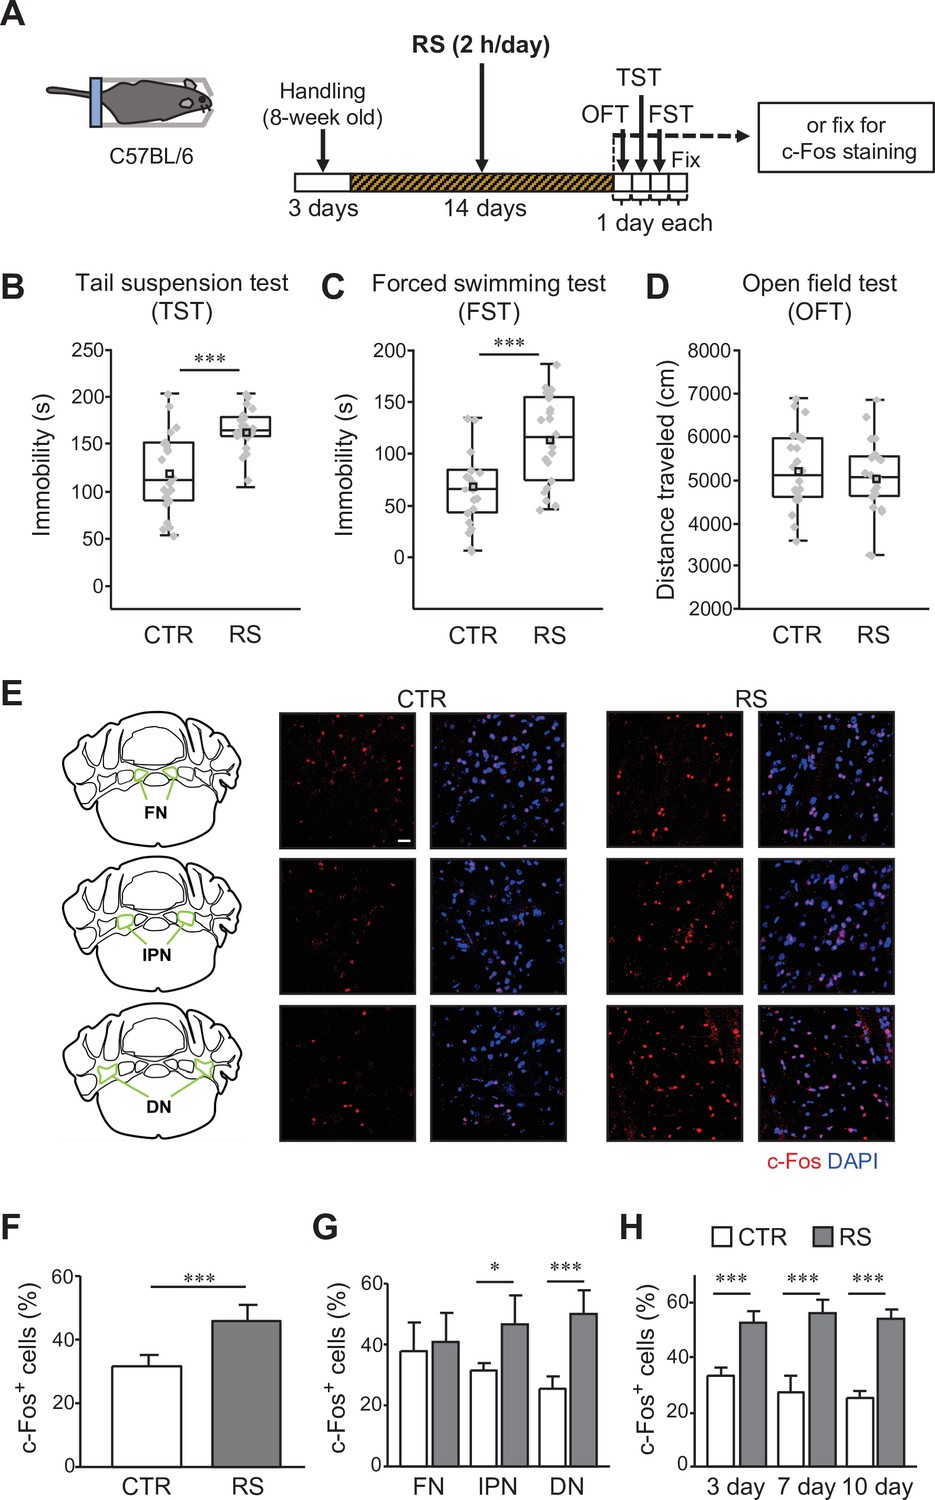
c-Fos expression in the DCN is increased by the chronic stress application.
(A) Schematic diagram of the RS (2 hr/day) application for 2 weeks, followed by 1 day each for the OFT, TST, and FST before fixation, or by fixation for c-Fos staining. (B–D) Immobility time in the TST (B) and FST (C), and total distance moved in the OFT (D), to analyze the effects of RS in C57BL/6 wild type mice. ***p < 0.001, Student’s t-test (n = 22 mice each for the CTR and RS groups). Behavioral data in this and subsequent figures are presented as boxplots with gray dots representing individual data points, center lines denoting the median, open square dots denoting the mean values, the lower and the upper bounds of the box corresponding to the 25th and 75th percentiles, respectively, and the whiskers denoting the minimum and maximum values. Effect sizes for behavioral data are available in Figure 1—source data 2. (E) 3D projection images of c-Fos expression and DAPI staining in the FN (top), the IPN (middle), and the DN (bottom) of the CTR (middle) and RS (right) groups. The overview diagrams on the left indicate the location of three nuclei. Scale bar: 20 μm. (F–H) Comparisons of the percentage of c-Fos-positive (c-Fos+) cells out of DAPI-positive cells between the CTR and RS groups in the whole DCN (F) or each nucleus (G) examined after 2-week RS application, or in the DN examined after 3-, 7-, and 10-day RS application (H). *p < 0.05, ***p < 0.001, Student’s t-test comparing between CTR and RS groups, (F and G), n = 8 images each in 3 nuclei of the CTR or RS group, from 4 mice each in the CTR or RS group; (H) n = 5 images each in the DN of the CTR or RS group, from 5 mice each in the CTR or RS group. Data are shown as the mean ± SEM. Exact p values and the statistical tests used are available in Figure 1—source data 1.
-
Figure 1—source data 1
p Values and statistical tests related to Figure 1.
- https://cdn.elifesciences.org/articles/72981/elife-72981-fig1-data1-v2.xlsx
-
Figure 1—source data 2
Effect sizes for behavior results related to Figure 1.
- https://cdn.elifesciences.org/articles/72981/elife-72981-fig1-data2-v2.xlsx
Figure 1—figure supplement 1
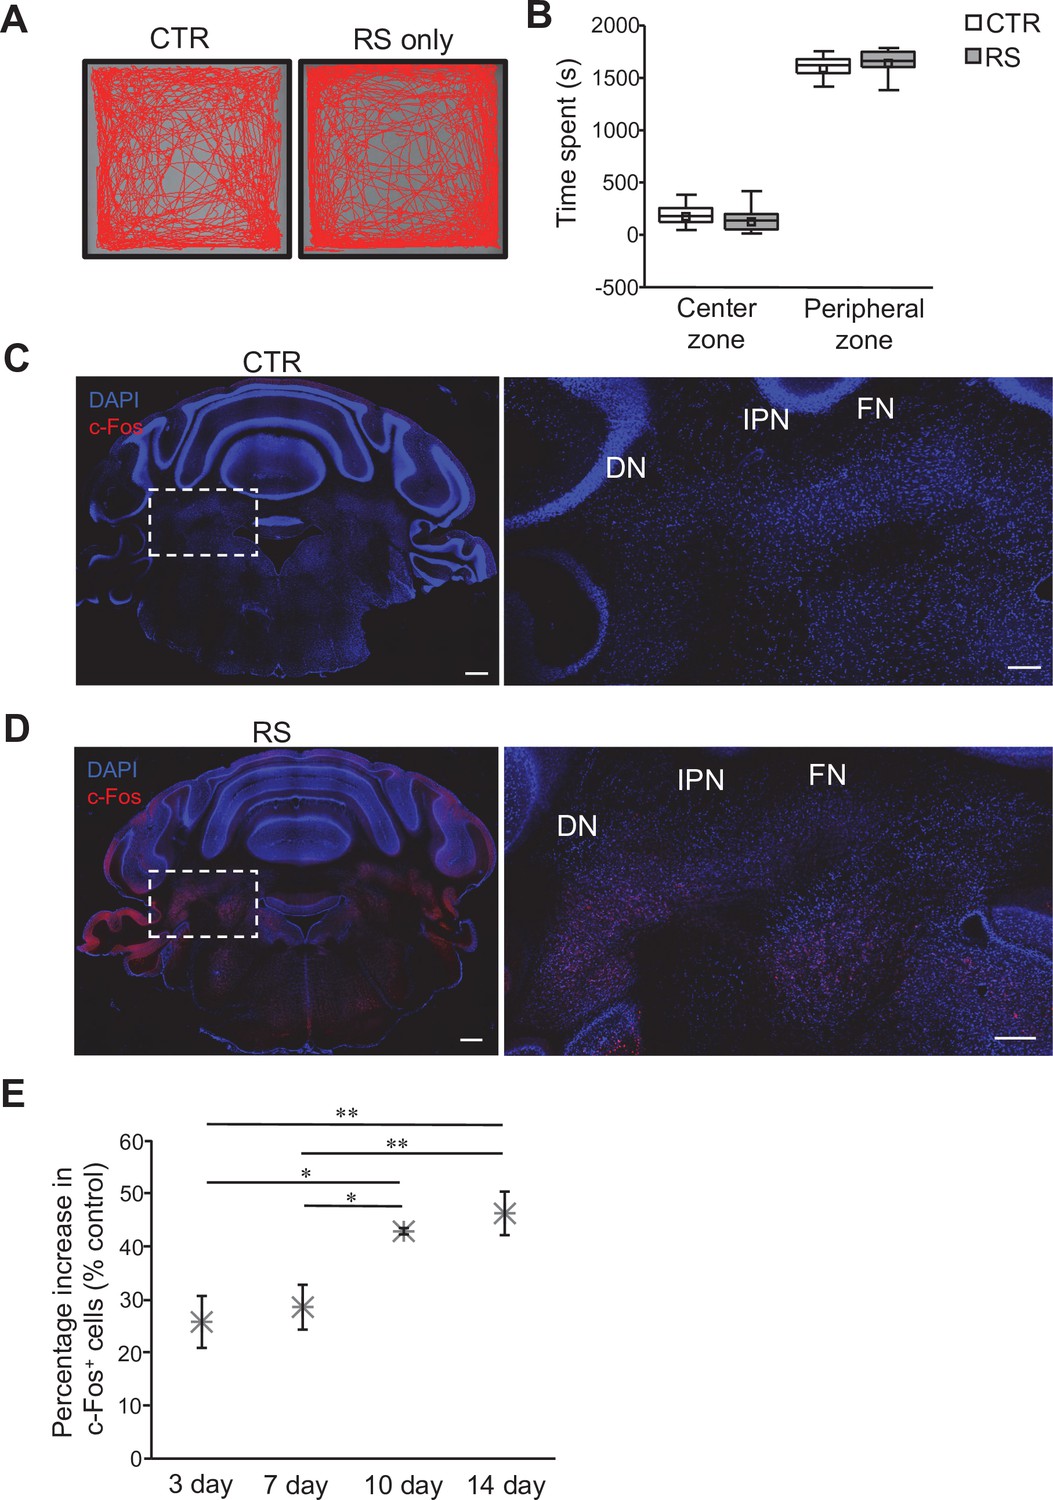
Conditioning of mice for the RS protocol.
(A) Examples of movement traces from the CTR and RS groups during 30 min of the OFT. (B) Measurement of the time spent in the center zone or the peripheral zone in the OFT. Data are presented as boxplots, as described in the legend to Figure 1. No significant difference was detected between CTR and RS in both center zone and peripheral zone by Student’s t-test. (C and D) Images of whole cerebellar coronal slices stained for c-Fos and with DAPI. Slices were obtained from mice of the CTR (C) and RS (D) groups. DCN areas in the white dotted squares are magnified in the right panels. Scale bars: 500 μm (left), 200 μm (right) (E) Analysis for the percentage increase in c-Fos-positive neurons over CTR group upon different durations of RS application. *p < 0.05, **p < 0.01, one-way ANOVA followed by the Fisher’s LSD post hoc test. Data are shown as the mean ± SEM.
Figure 1—figure supplement 2
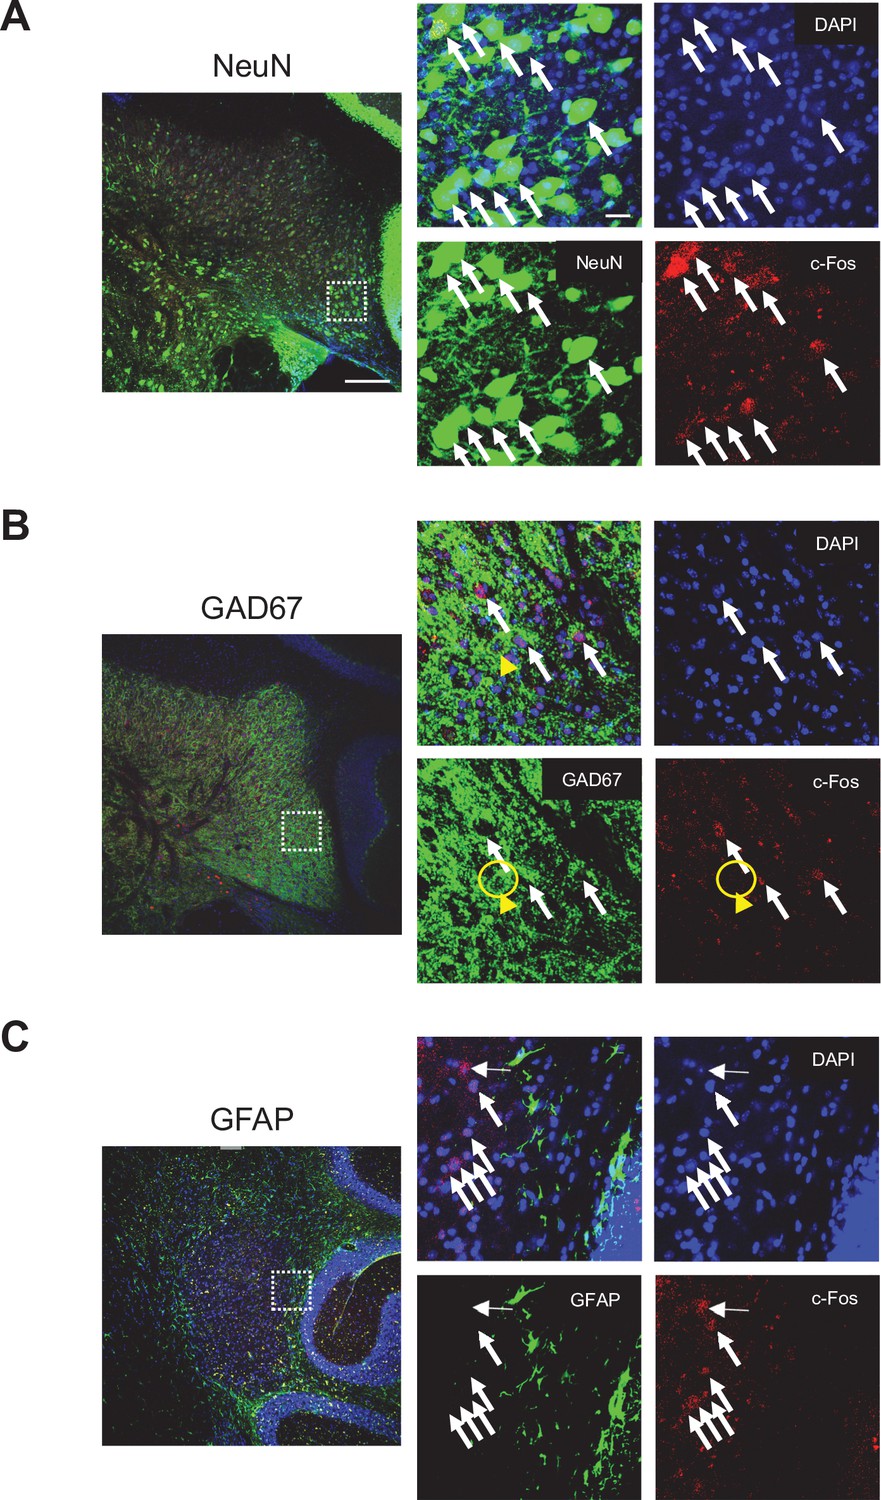
Cell types for c-Fos-positive DCN neurons in the DN following 14 days RS.
Images of DN-containing cerebellar slices co-stained for NeuN (A), GAD67 (B), or GFAP (C) and c-Fos with DAPI. Most of c-Fos-positive cells are NeuN-positive cells, as seen in (A). Yellow arrowheads in (B) indicate a GAD67-positive and c-Fos-negative cell. Enlarged 3D projections of DN areas in the white dotted squares on the left panels are shown in the right panels. White arrows indicate examples of c-Fos-positive cells. Scale bars: 100 μm (left), 20 μm (right).
Figure 2 with 2 supplements
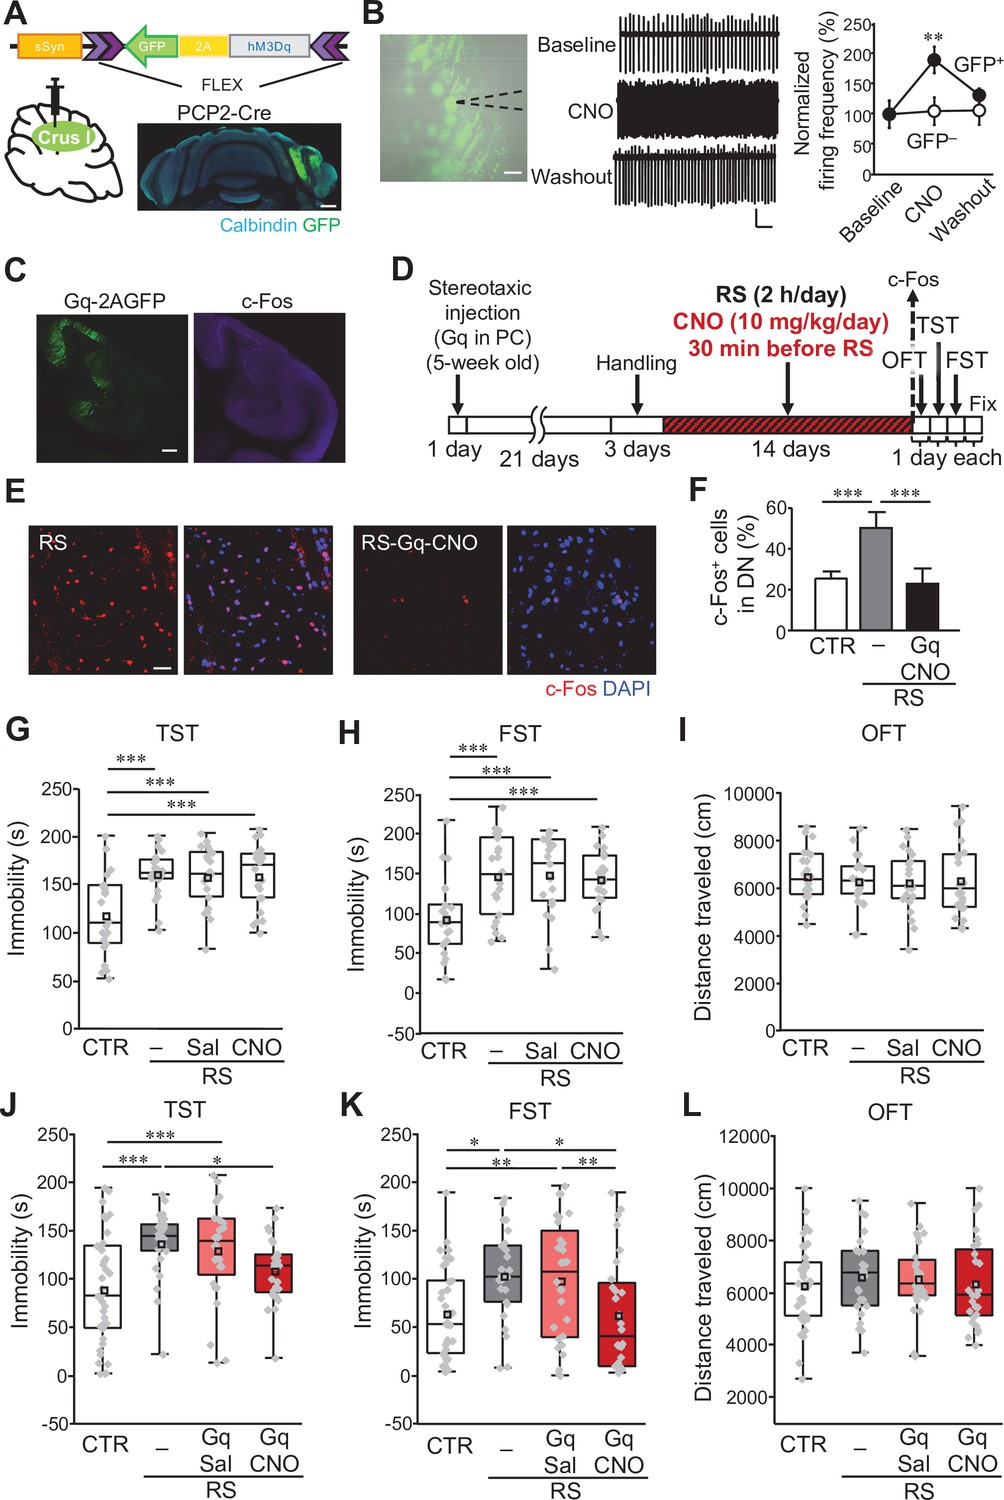
Manipulation of crus I PC activity improves depression-like behaviors.
(A) Top: a schematic of AAV-sSyn-FLEX-hM3Dq-2AGFP injection into crus I of PCP2-Cre mice. Bottom: confocal image of a whole cerebellar slice showing the expression of Gq-2AGFP. Scale bar: 500 μm. (B) Left: representative image showing Gq-2AGFP-positive PCs in crus I and a recording pipette (dotted line). Scale bar: 30 μm. Middle: representative traces of PC firing recorded by the loose cell-attached patch-clamp technique, before (top, baseline), during (middle, CNO), and after (bottom, washout) CNO treatment. Calibration: 50 pA, 200ms. Right: firing frequency at baseline, during CNO treatment, and at washout normalized by the average value of the baseline in GFP-positive (GFP+, closed circles) and GFP-negative (GFP–, open circles) PCs (n = 5 GFP+ PCs from 4 mice, n = 8 GFP– PCs from 3 mice). (C) Enhanced c-Fos expression in crus I PCs (right), upon CNO administration to a mouse expressing Gq-2AGFP in crus I PCs (left). Scale bar: 200 μm. (D) Schematic diagram of the experimental time course. RS application (2 hours/day, for 2 weeks) started 3 weeks after stereotaxic AAV injection, followed by 1 day each for the OFT, TST, and FST before fixation, or by fixation for c-Fos staining. CNO (10 mg/kg/day) was intraperitoneally administered 30 min before the RS. (E and F) Representative 3D projection images (E) and a summary graph (F) of c-Fos expression in the DN. Enhanced c-Fos expression in the RS group (left in E, gray bar in F) was reduced by chemogenetic excitation of crus I PCs using Gq expression and CNO administration (right in E, black bar in F, n = 5 images obtained from 4 mice). Scale bar in E: 20 μm. For direct comparison, results of the DN used in Figure 1E and G are shown in (E) (RS) and (F), respectively. Data are shown as the mean ± SEM. (G–I) Assessments by the TST (G), the FST (H), and the OFT (I), to analyze the effects of CNO administration itself on RS-dependent depression-like behaviors in C57BL/6 mice without stereotaxic AAV injection. For a direct comparison, data for the CTR and the RS groups, which were obtained from concurrently performed experiments and shown in Figure 1B–D, are reused in this figure. ***p < 0.001, one-way ANOVA followed by Fisher’s LSD post hoc test (n = 21 and 22 mice for the RS-Sal and RS-CNO groups, respectively). (J–L) Immobility time in the TST (J) and FST (K), and total distance moved in the OFT (L), performed to analyze the effects of chemogenetic excitation of crus I PC activity in PCP2-Cre;ICR mice. *p < 0.05, **p < 0.01, ***p < 0.001, one-way ANOVA followed by Fisher’s LSD post hoc test (n = 38, 25, 28, and 28 mice for the CTR, RS, RS-Gq-PC-Sal, and RS-Gq-PC-CNO groups, respectively). Data are presented as boxplots, as described in the legend to Figure 1. Exact p values and the statistical tests used are available in Figure 2—source data 1. Effect sizes for behavioral data are available in Figure 2—source data 2 and n numbers for behavioral tests are available in Figure 2—source data 3.
-
Figure 2—source data 1
p Values and statistical tests related to Figure 2.
- https://cdn.elifesciences.org/articles/72981/elife-72981-fig2-data1-v2.xlsx
-
Figure 2—source data 2
Effect sizes for behavior results related to Figure 2.
- https://cdn.elifesciences.org/articles/72981/elife-72981-fig2-data2-v2.xlsx
-
Figure 2—source data 3
Numbers of mice for each sex used in each behavioral test related to Figure 2.
- https://cdn.elifesciences.org/articles/72981/elife-72981-fig2-data3-v2.xlsx
Figure 2—figure supplement 1
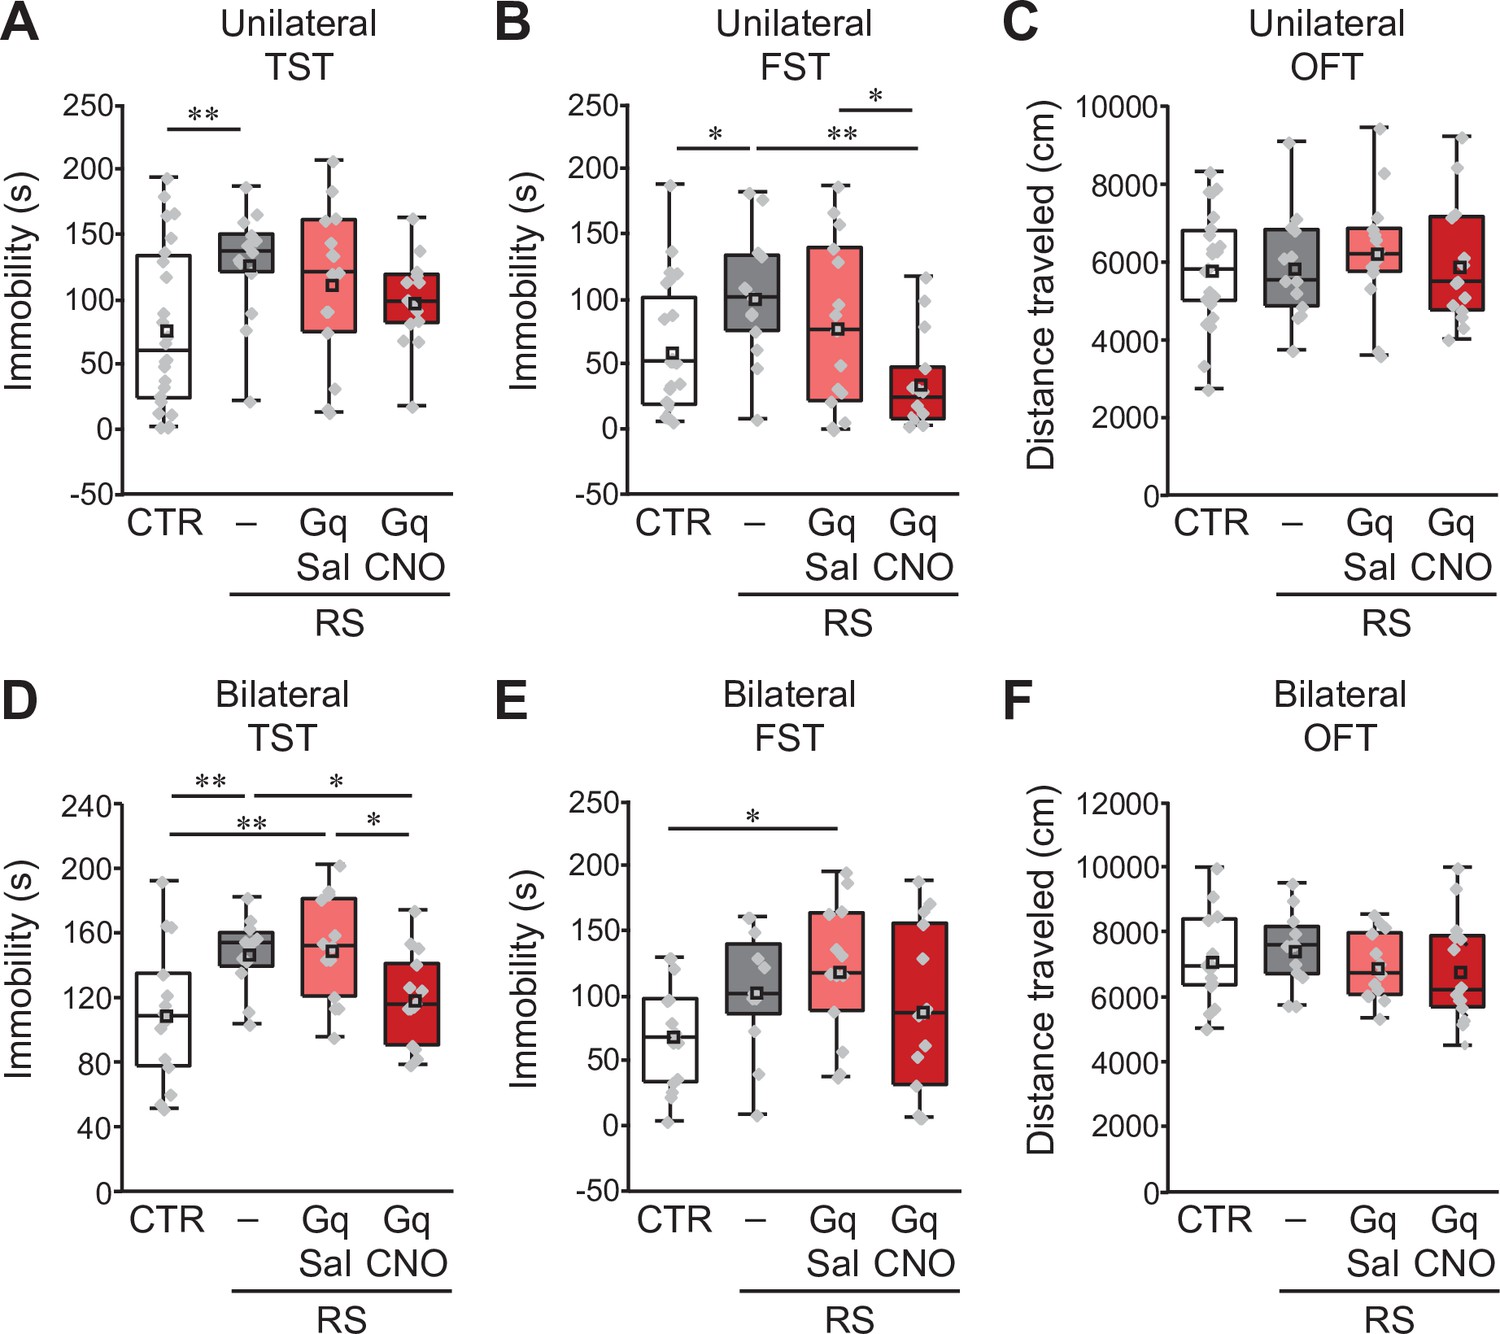
Similar effects of unilateral and bilateral induction of crus I PC activity on the development of depression-like behaviors.
(A, B, C) Effects of unilateral excitation of crus I PC activity in PCP2-Cre;ICR mice in the TST (A), the FST (B) and the OFT (C). (D, E, F) Effects of bilateral excitation of crus I PC activity in PCP2-Cre;ICR mice in the TST (D), the FST (E) and the OFT (F). *p < 0.05, **p < 0.01, one-way ANOVA followed by the Fisher’s LSD post hoc test (unilateral, n = 24, 13, 15, and 14 mice for the CTR, RS, RS-Gq-PC-Sal, and RS-Gq-PC-CNO groups, respectively; bilateral, n = 14, 12, 13, and 14 mice for the CTR, RS, RS-Gq-PC-Sal, and RS-Gq-PC-CNO groups, respectively). Data are presented as boxplots, as described in the legend to Figure 1.
Figure 2—figure supplement 2
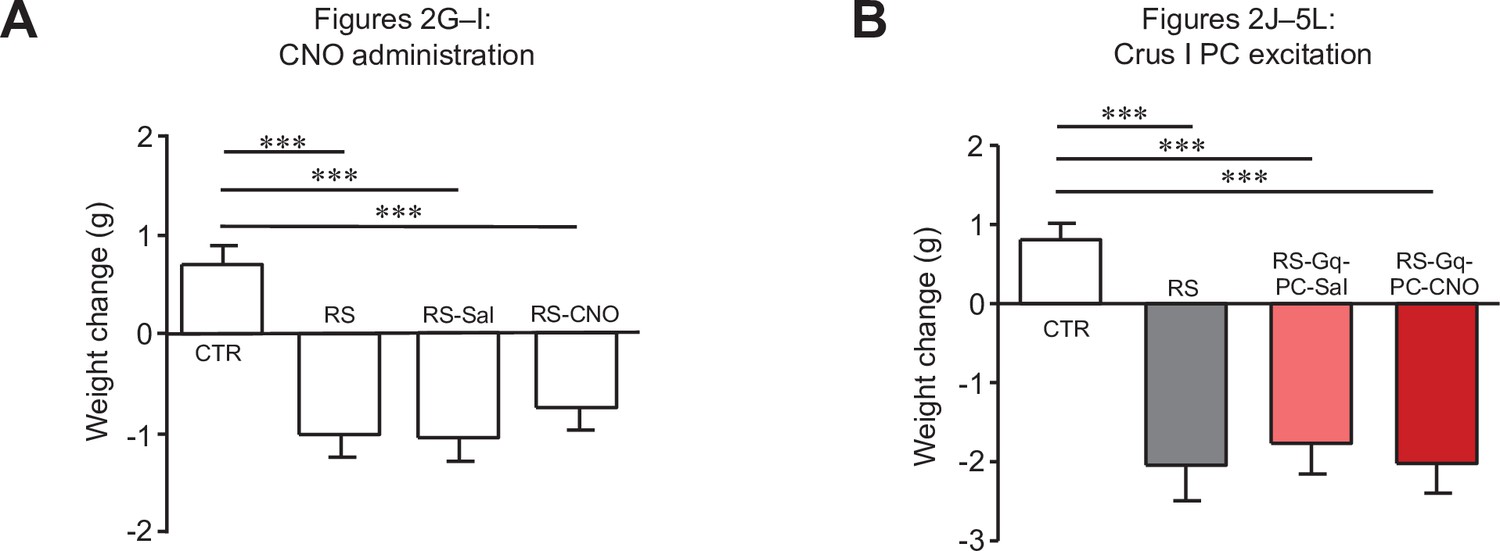
Changes in body weights of mice used for Figure 2.
Comparisons of body weight changes in mice used for Figure 2G–I (A) and Figure 2J–L (B). *** < 0.001, one-way ANOVA followed by the Fisher’s LSD post hoc test. Data are shown as the mean ± SEM.
Figure 3 with 1 supplement
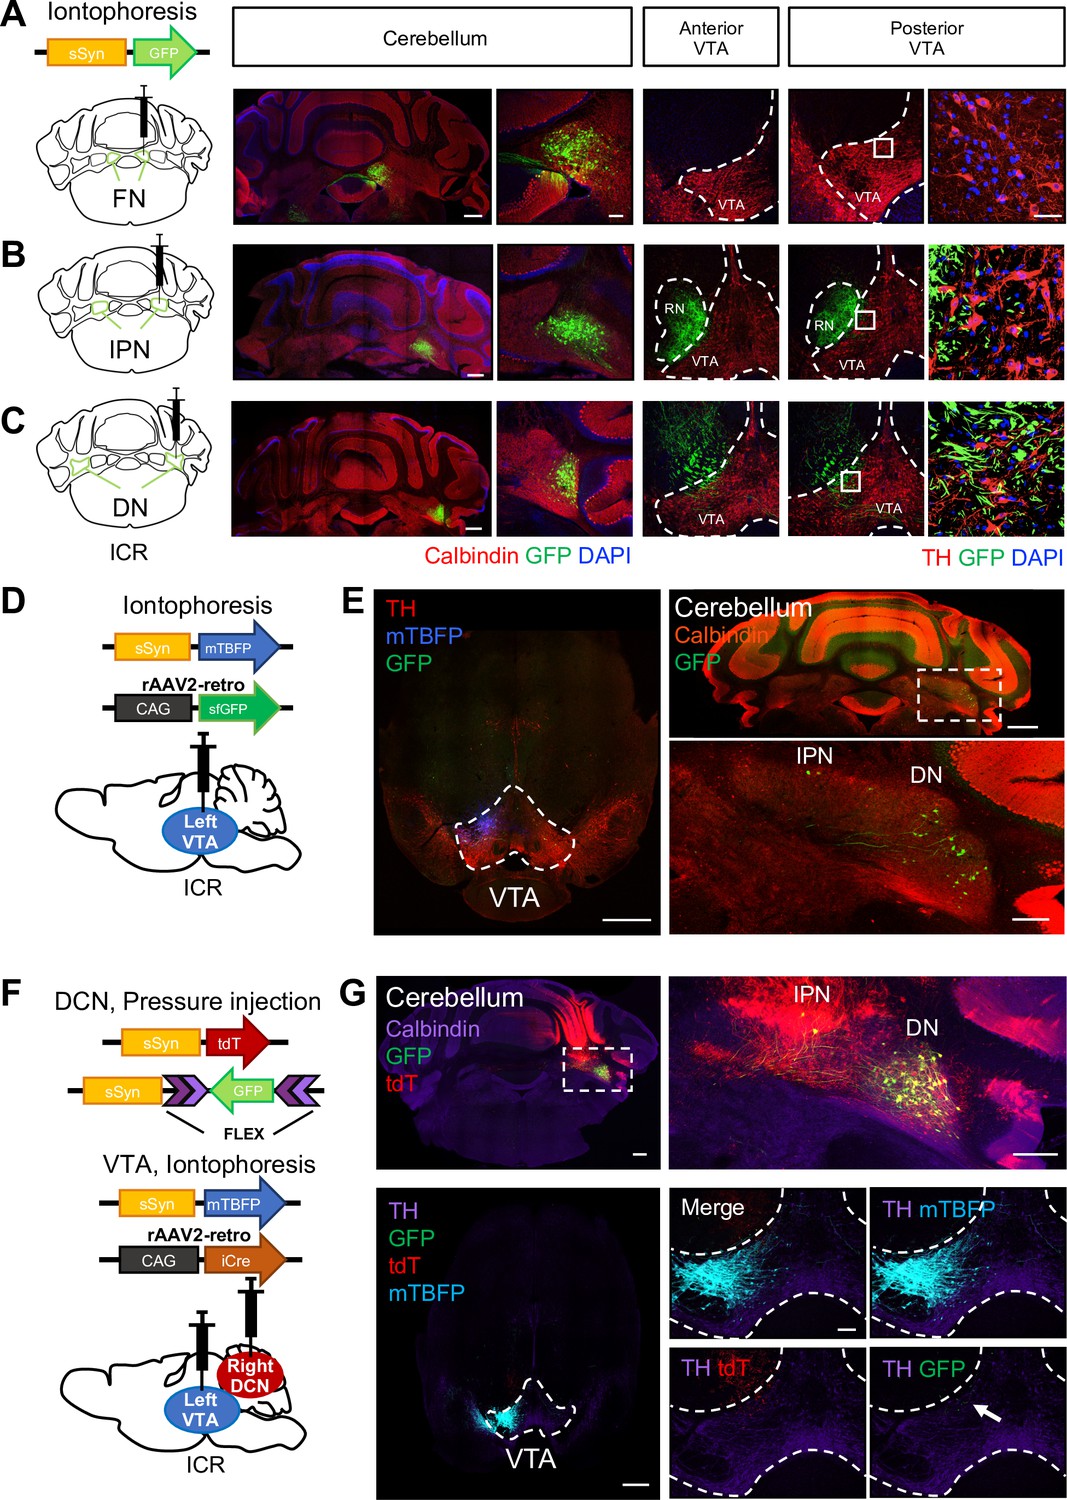
DCN neurons in the DN structurally project to the VTA.
(A–C) Left: schematic drawing of AAV-sSyn-GFP injection into the right side of the FN (A), the IPN (B), and the DN (C). Note that iontophoretic injection was used, to achieve confined injection of AAV in the individual nuclei. Right: confocal images showing the resulting GFP expression in cerebellar slices stained with a calbindin antibody and VTA slices stained with a tyrosine hydroxylase (TH) antibody. The rightmost panels are 3D projection views of the boxed areas. Scale bars: 500 μm (left), 50 μm (middle), and 20 μm (right). Similar image results are obtained from 7, 8, and 4 mice for fastigial, interposed and dentate nuclei respectively. (D) Schematic drawing of iontophoretic injection of rAAV2-retro-CAG-sfGFP and AAV-sSyn-mTagBFP (mTBFP) into the left side of the VTA. (E) Confocal images of a VTA-containing slice stained with a TH antibody (left) and a cerebellar slice stained with a calbindin antibody (right). Expression of GFP and mTBFP resulting from the injection shown in (D). The area within the white dotted rectangle shown in the top right panel is magnified in the bottom right panel. Scale bars: 500 μm (left and top right), and 200 μm (bottom right). For retrograde single injection, similar image results are obtained from 3 mice. (F) Schematic diagram of combined AAV injection. AAV-sSyn-tdT and AAV-sSyn-FLEX-GFP were injected into the right side of the DCN by pressure injection, whereas AAV-sSyn-mTBFP and rAAV2-retro-CAG-iCre were injected into the left side of the VTA by iontophoresis. (G) Representative confocal images of a cerebellar slice stained with a calbindin antibody (top) and a VTA-containing midbrain slice stained with a TH antibody (bottom). Expression of GFP, tdT, and mTBFP resulting from the injection shown in (F). The right panels show magnified images of the DCN (the white dotted rectangle) and VTA, including GFP-positive axons of DCN neurons (arrow). Scale bars: 500 μm (left), 250 μm (top right), and 100 μm (bottom right). For double injections, similar image results are obtained from 10 mice. White dotted rectangles shown in (E) and (G) indicate location of magnified images for DCN areas.
Figure 3—figure supplement 1
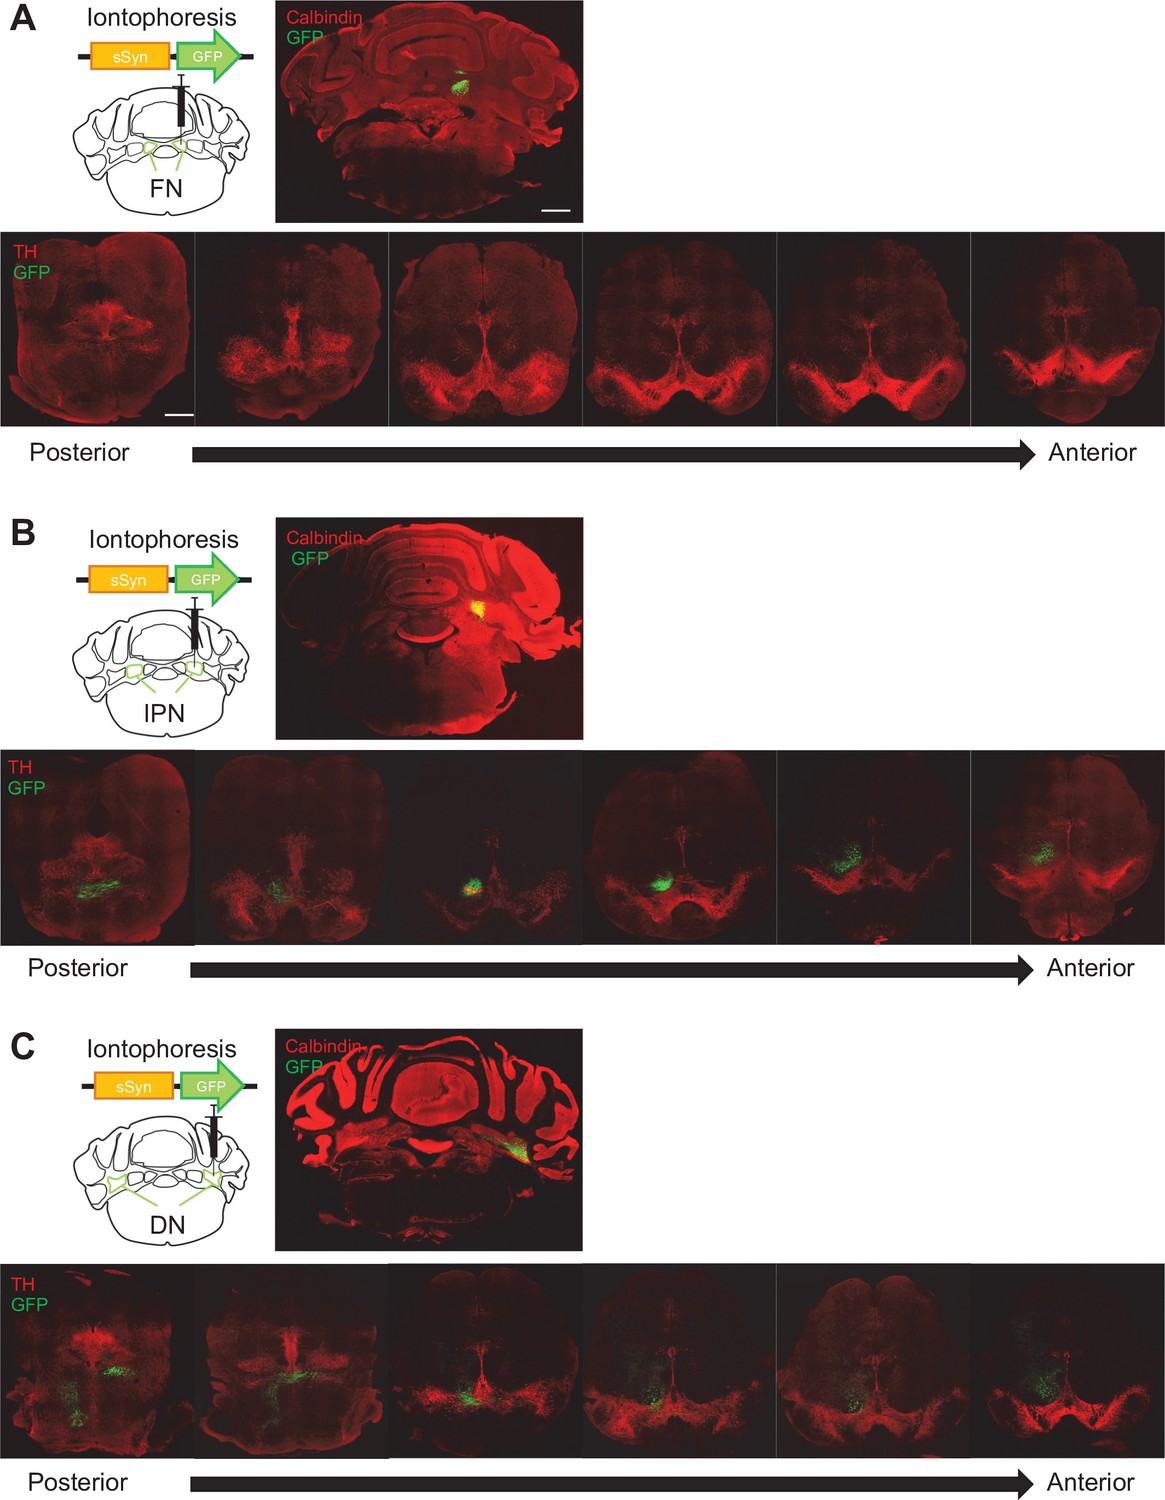
Anatomical connectivity from each subregion of the DCN to the VTA.
(A–C) Screening of GFP-positive axons in the whole VTA (bottom) followed by an iontophoretic injection of AAV-sSyn-GFP into the FN (A), the IPN (B), or the DN (C). Scale bar: 500 μm.
Figure 4 with 1 supplement
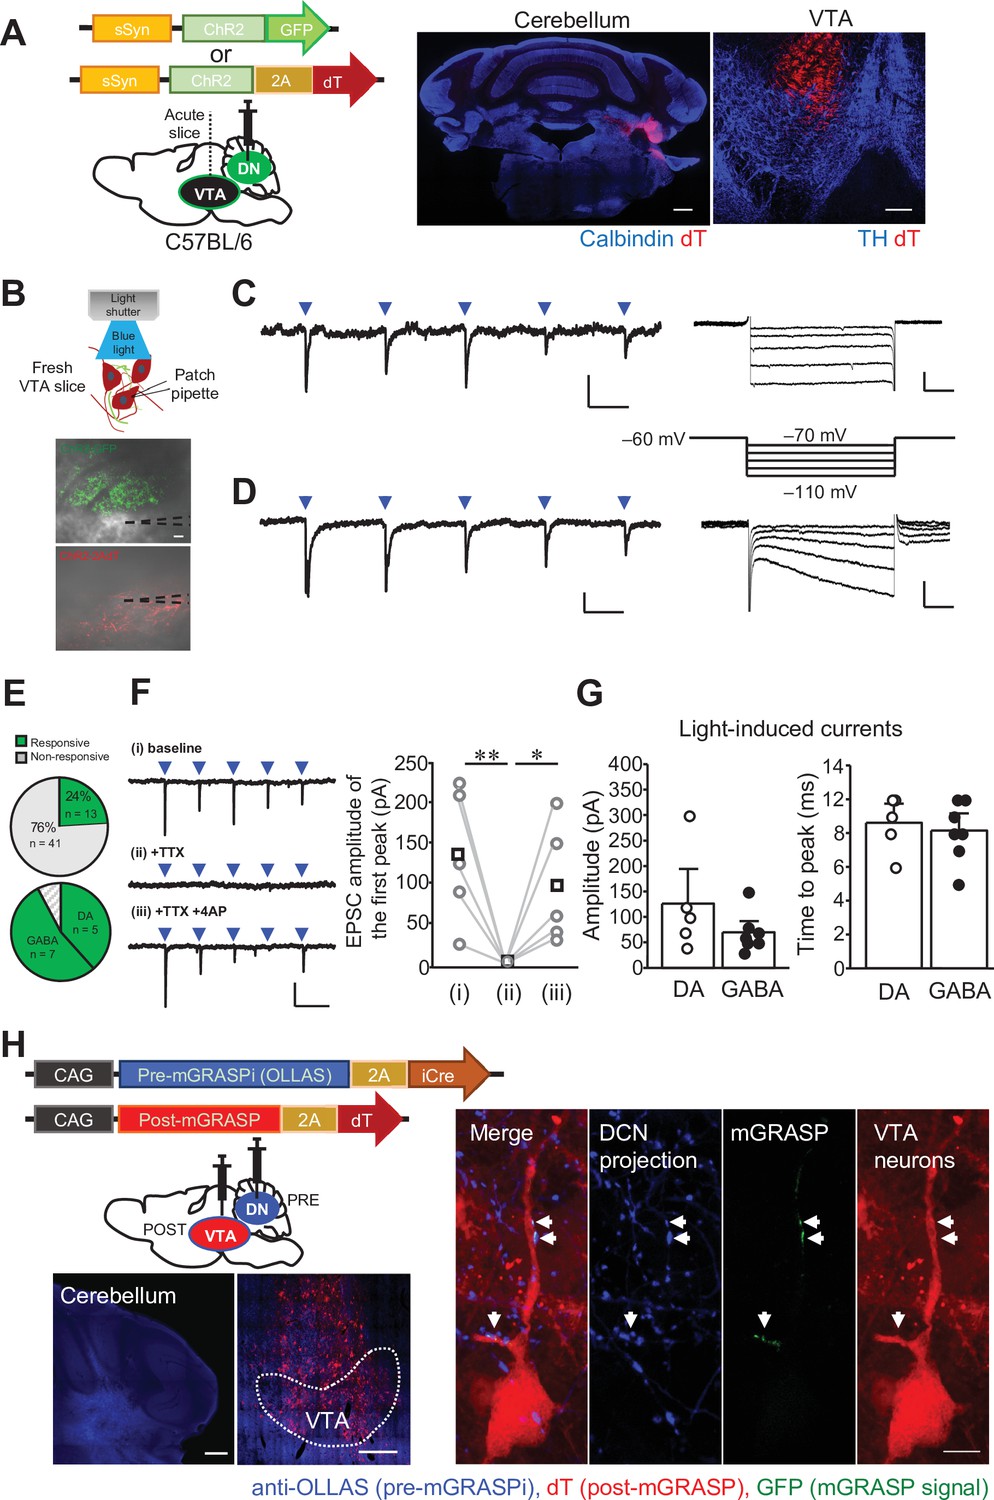
The DCN neurons in the DN make functional synaptic connections to the VTA.
(A) Left: schematic drawing of the injection of AAV-sSyn-ChR2-GFP or AAV-sSyn-ChR2-2AdT into the DN, for whole-cell patch clamp recording from VTA neurons. Right: confocal images of ChR2-2AdT expression in a calbindin-stained cerebellar slice (left) and a TH-stained VTA slice (right). Scale bars: 500 μm (left), and 200 μm (right). (B) Schematic diagram of whole-cell patch clamp recording to detect light-evoked EPSCs in VTA neurons, and images of fresh midbrain slices containing the VTA with ChR2-GFP- or ChR2-2AdT-positive axons projecting from the DN. Dotted lines in the images indicate the recording pipettes. Scale bar: 20 μm. (C and D) Representative traces of EPSCs evoked by 10 Hz photostimulation at a holding potential of −70 mV. To measure Ih currents, voltage steps varying from −70 mV to −110 mV were applied from a holding potential of −60 mV. Calibration: 20 pA, 50ms for light-evoked EPSC; 50 pA, 100ms for Ih currents. (E) Pie charts showing the proportion of VTA neurons responding to photostimulation among all VTA neurons recorded (top, 54 cells obtained from 9 mice), and the ratio of DA and GABA neurons among VTA neurons demonstrating light-evoked EPSCs (bottom). (F) Representative traces (left) and peak amplitude (right) of light-evoked EPSCs before (baseline) and after extracellular application of TTX (+ TTX) followed by further addition of 4-AP (+ TTX + 4 AP). *p < 0.05, **p < 0.01, One-way repeated measures ANOVA followed by Fisher’s least significant difference (LSD) post hoc test. Calibration: 100 pA, 100ms. Averaged (squares) and individual (circles) EPSC amplitudes are shown on the right (n = 5 from 3 mice). (G) Peak amplitudes (left) and time to peak (right) of light-evoked EPSCs recorded from DA and GABA neurons. Data are shown as the mean ± SEM. Exact p values and the statistical tests used are available in Figure 4—source data 1. (H) Detection of synaptic connections from the DN to the VTA using mGRASPi. Left: schematic diagram showing injections of AAVs expressing pre-mGRASPi(OLLAS)–2AiCre and post-mGRASPi-2AdT into the DN and the VTA, respectively (top), and subsequent observation of immunostained OLLAS signals in the DN and dT signals in the VTA (bottom). Scale bar: 200 μm. Right: magnified images of a VTA neuron surrounded by DCN axons expressing the pre-mGRASP component. Note that mGRASP signals (arrows) were clearly observed where button-like structures of the DCN axons intersect the VTA neuron dendrites. Scale bar: 10 μm.
-
Figure 4—source data 1
p Values and statistical tests related to Figure 4.
- https://cdn.elifesciences.org/articles/72981/elife-72981-fig4-data1-v2.xlsx
Figure 4—figure supplement 1
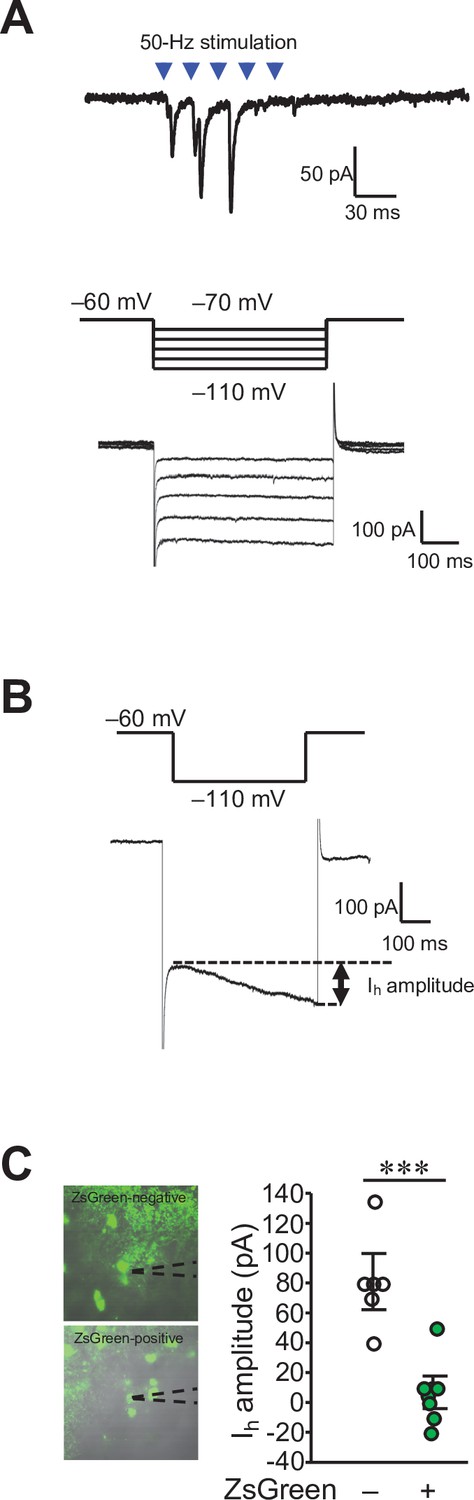
Functional synaptic connections of the DCN-VTA circuit.
(A) A trace of EPSCs (top) evoked by 50 Hz photostimulation at a holding potential of −70 mV, and Ih currents (bottom) recorded in the same VTA neuron by applying voltage steps varying from −70 mV to −110 mV, from a holding potential of −60 mV (middle). (B) Calculation of Ih current amplitudes (arrow) by subtracting the minimum values from the maximum values during the 500ms voltage step to −110 mV. (C) Amplitude of Ih currents measured from ZsGreen-negative (−) and positive cells (+) in the VTA. Representative images of these cells with recording pipettes (dotted lines) are shown on the left. ***p < 0.001, Student’s t-test (n = 6 and 8 cells for ZsGreen-negative and positive cells, respectively, from 6 mice). Scale bar: 20 μm.
Figure 5 with 1 supplement
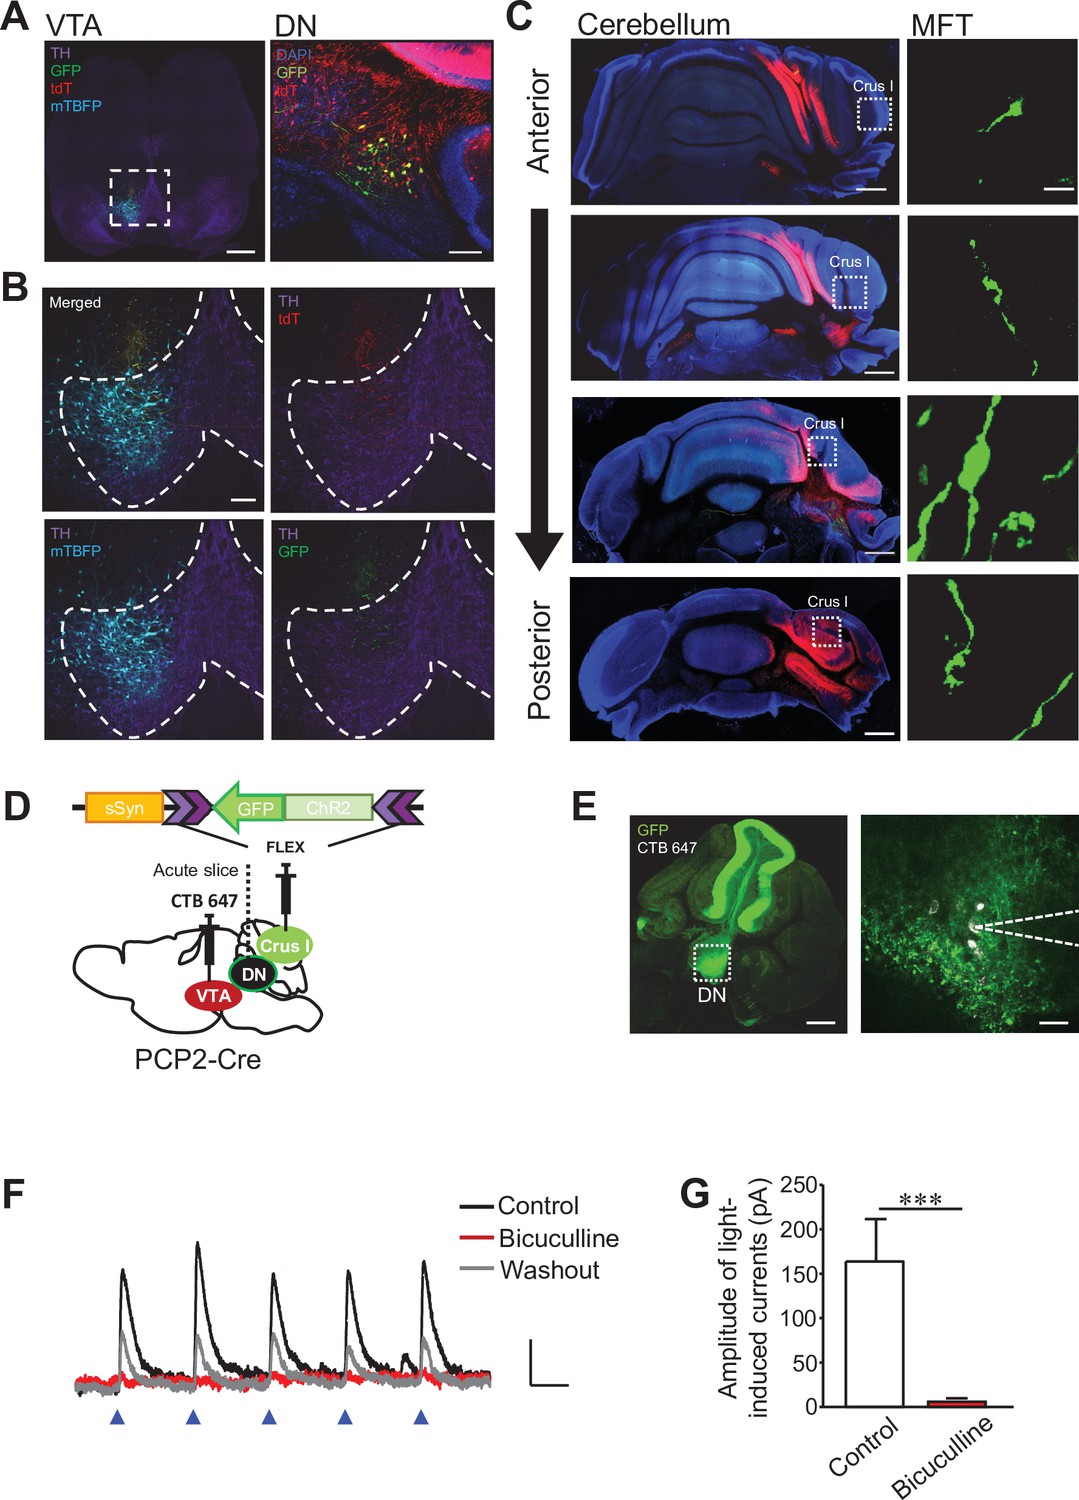
Corticonuclear and nucleocortical connections between crus I and VTA-projecting DCN neurons in the DN.
(A and B) Representative images of a midbrain slice (left) and a cerebellar slice (right) in (A). In the left panel, the area within the white dotted square is magnified in (B), and dotted lines in (B) indicate the boundary of the VTA region. Expression of tdT, mTBFP, and GFP was triggered by the AAV injection shown in Figure 3F. Scale bars: 500 μm (left in A), 100 μm (right in A and B). (C) Screening of collateral axons of VTA-projecting DCN neurons in the cerebellar cortex. Cerebellar slices were obtained from the same mouse used for the images in (A) and (B). A MFT within the white dotted square of each panel on the left is magnified on the right. Scale bars: 500 μm (left), 10 μm (right). (D) Diagram of the injection of AAV-sSyn-FLEX-ChR2-GFP into crus I and CTB 647 into the VTA of PCP2-Cre mice. Fresh cerebellar slices were then prepared to record the synaptic transmission from VTA-projecting DCN neurons in the DN upon the photostimulation of ChR2-positive PC axons. (E) Resultant expression of ChR2-GFP in PCs and CTB 647 labeling in the DN of a cerebellar slice in sagittal section. The area within the white dotted square of the left panel is magnified in the right panel. Whole-cell patch-clamp recording (dotted lines on the right) was performed from CTB 647-positive neurons, as seen in the magnified image on the right. Scale bars: 250 μm (left), 40 μm (right). (F) Representative traces of IPSCs evoked by 10 Hz photostimulation at a holding potential of −50 mV, before (control), during (bicuculline), and after (washout) bath application of bicuculline. Calibration: 20 pA, 50ms. (G) Peak amplitudes of light-evoked IPSCs. ***p < 0.001, Student’s t-test (n = 9 and 5 for control and bicuculline, respectively). Data are shown as the mean ± SEM. Exact p values and the statistical tests used are available in Figure 5—source data 1.
-
Figure 5—source data 1
p Values and statistical tests related to Figure 5.
- https://cdn.elifesciences.org/articles/72981/elife-72981-fig5-data1-v2.xlsx
Figure 5—figure supplement 1
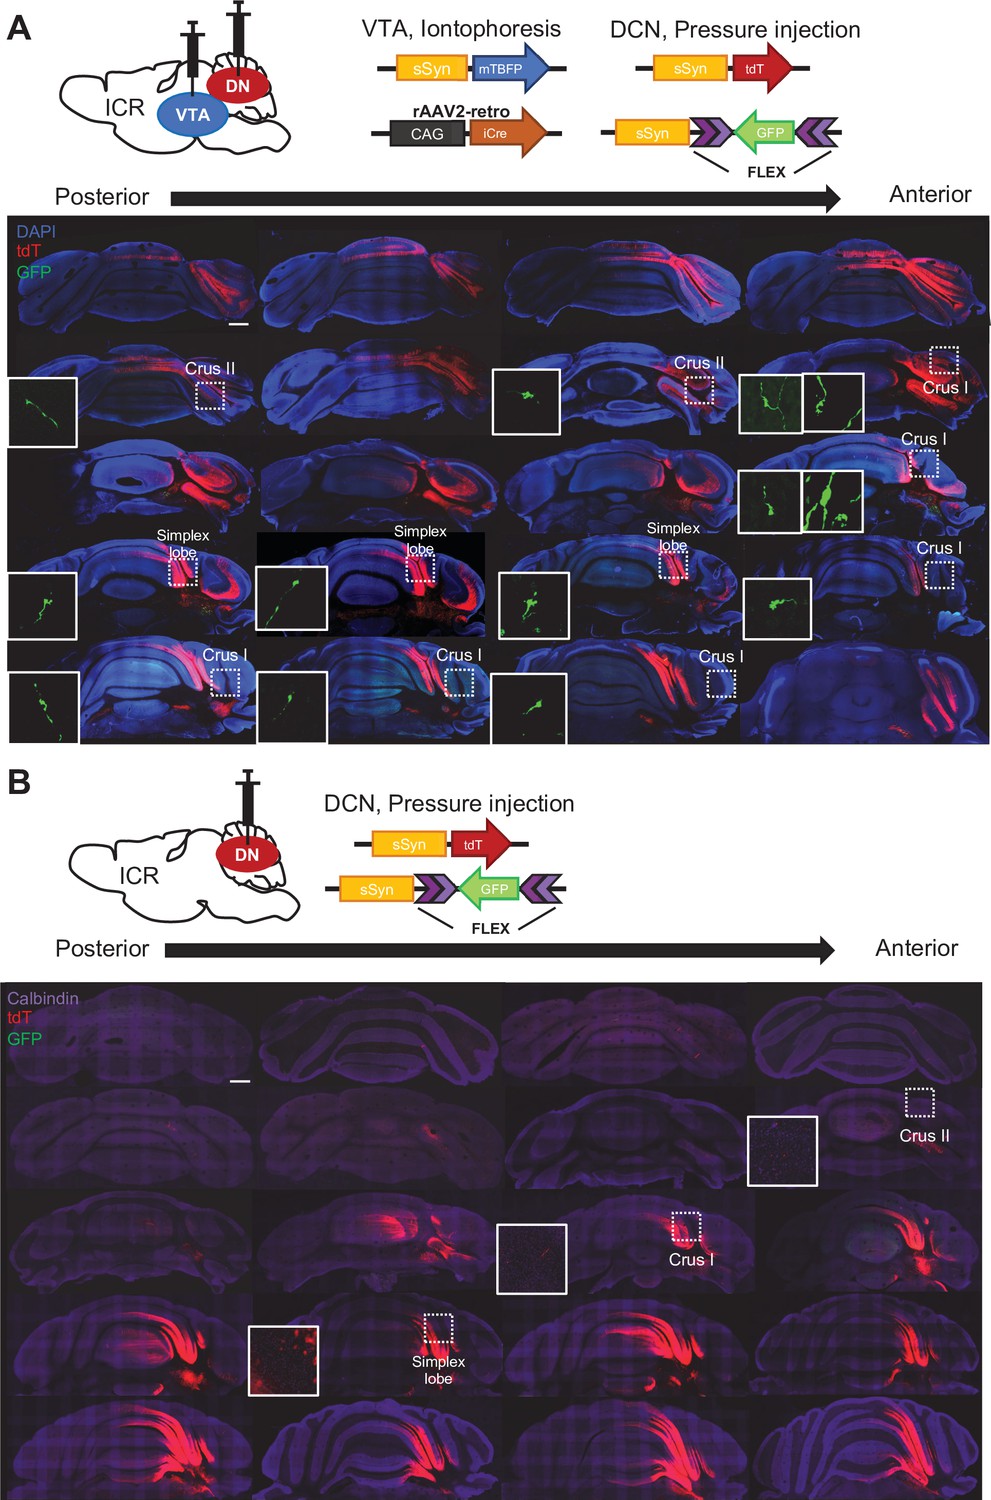
Nucleocortical connections of the VTA-projecting DCN neurons.
(A) Screening of GFP-positive collateral axons of VTA-projecting DCN neurons in the whole cerebellar cortex, following double injections into the DCN and the VTA, as shown at the top. The rosette-shaped MFTs in crus I, crus II, and the simplex lobe, indicated by the dotted squares, are magnified in the insets. (B) No GFP-positive MFTs were detected by injection into the DCN alone, confirming that GFP signals in MFTs arise from the VTA-projecting DCN neurons. Scale bar: 500 μm.
Figure 6 with 1 supplement
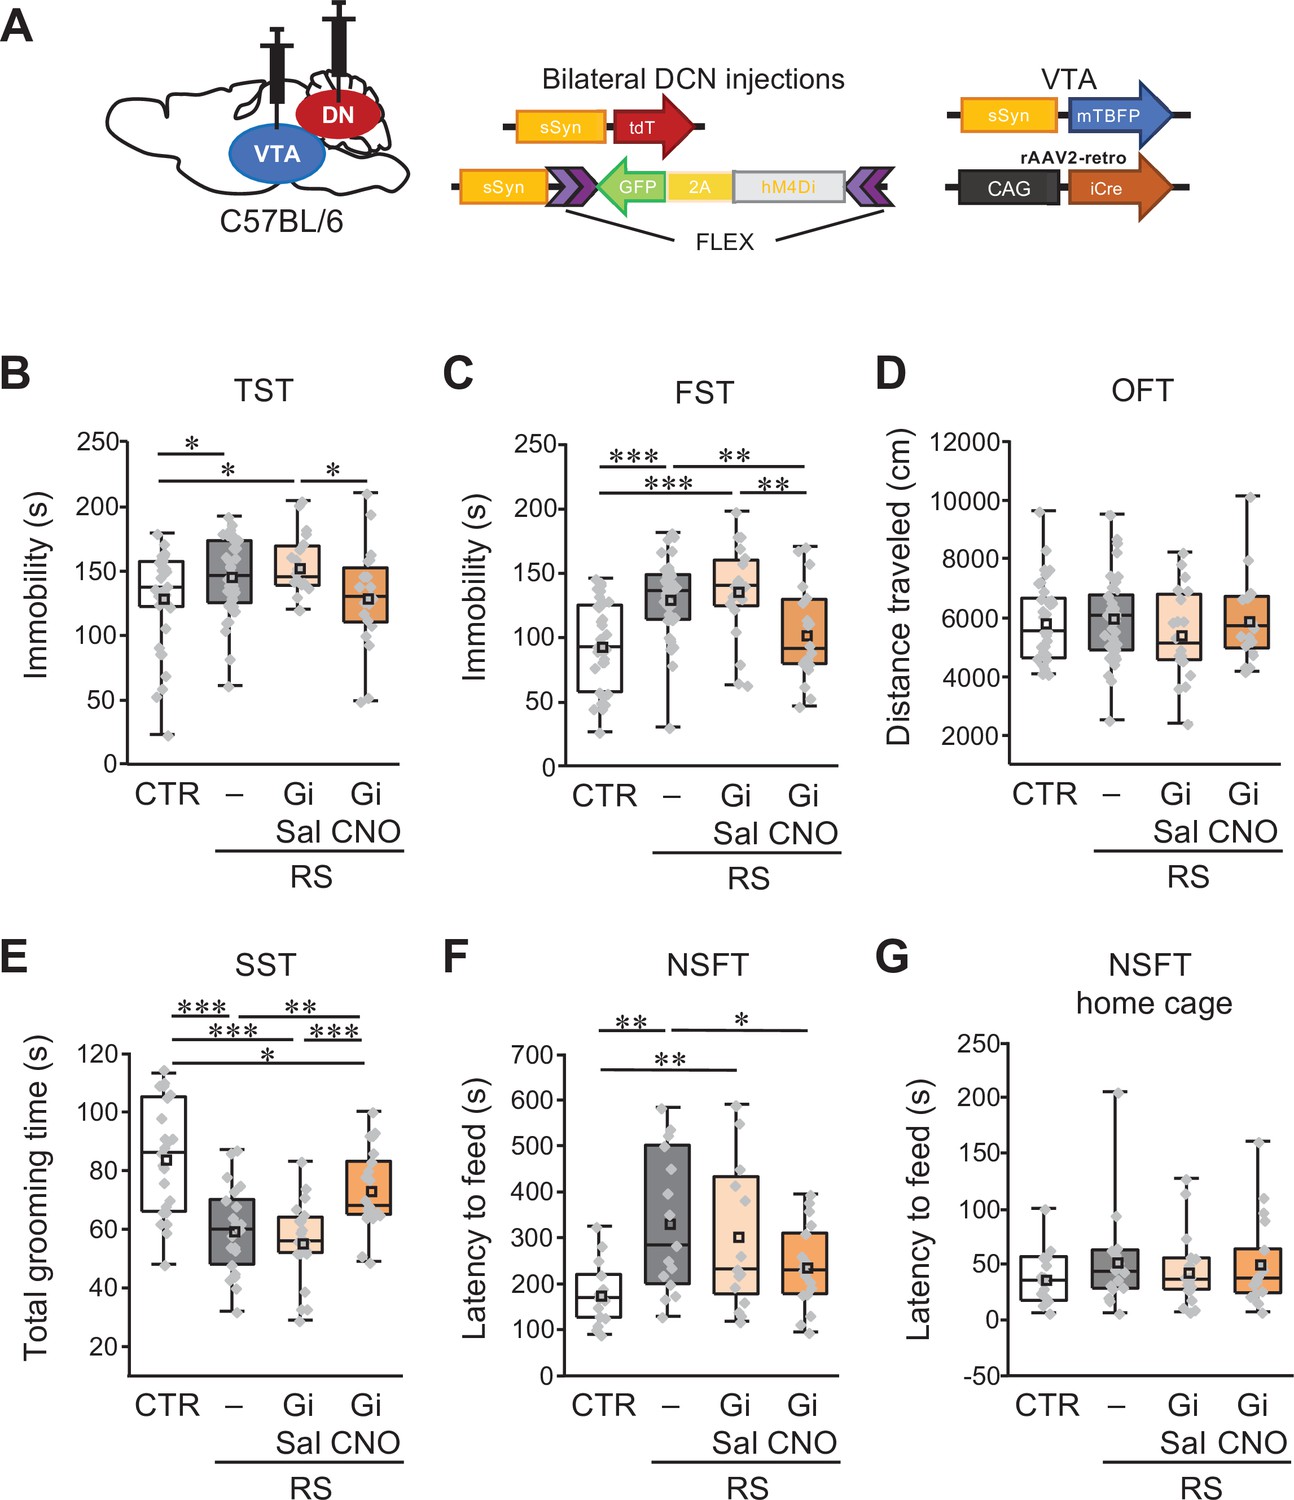
Specific inhibition of VTA-projecting DCN neurons in the DN ameliorates depression-like behaviors.
(A) Diagram of combined AAV injection. Bilateral injections of AAV-sSyn-tdT and AAV-sSyn-FLEX-hM4Di(Gi)–2AGFP was carried out into the DCN and a mixture of AAV-sSyn-mTBFP and retroAAV-CAG-Cre was injected into the VTA. (B–G) Immobility time in the TST (B) and the FST (C), total distance moved in the OFT (D), grooming time in the SST (E), and latency to feed in the NSFT (F) and in the home cage (G), to see the effects of the chronic inhibition of VTA-projecting DCN neurons using Gi during RS application in C57BL/6 mice. *p < 0.05, **p < 0.01, ***p < 0.001, one-way ANOVA followed by the Fisher’s LSD post hoc test (numbers of mice used for the CTR, RS, RS-Gi-DN-Sal, and RS-Gi-DN-CNO groups; n = 34, 42, 20, and 20 mice in the TST, FST, and OFT; n = 23, 21, 20, and 21 mice in the SST; n = 15, 15, 16, and 17 in the NSFT). Data are presented as boxplots, as described in the legend to Figure 1. Exact p values and the statistical tests used are available in Figure 6—source data 1. Effect sizes for behavioral data are available in Figure 6—source data 2 and n numbers for behavioral tests are available in Figure 6—source data 3.
-
Figure 6—source data 1
p Values and statistical tests related to Figure 6.
- https://cdn.elifesciences.org/articles/72981/elife-72981-fig6-data1-v2.xlsx
-
Figure 6—source data 2
Effect sizes for behavior results related to Figure 6.
- https://cdn.elifesciences.org/articles/72981/elife-72981-fig6-data2-v2.xlsx
-
Figure 6—source data 3
Numbers of mice for each sex used in each behavioral test related to Figure 6.
- https://cdn.elifesciences.org/articles/72981/elife-72981-fig6-data3-v2.xlsx
Figure 6—figure supplement 1
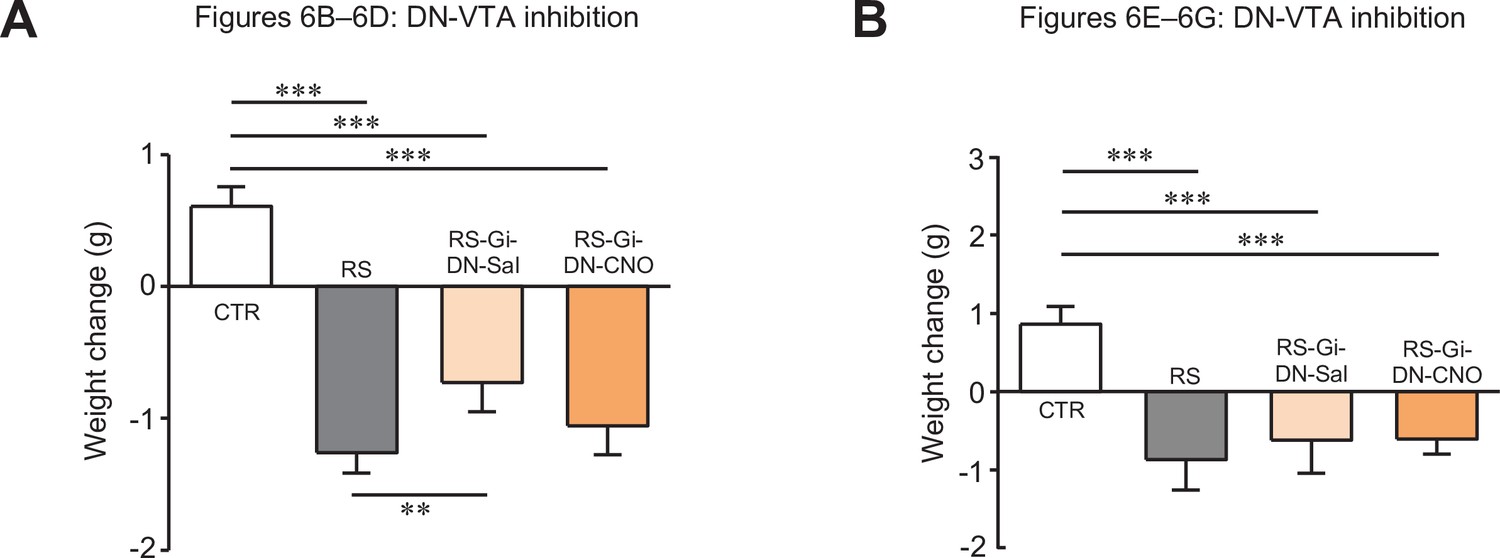
Changes in body weights of mice used for Figure 6.
Comparisons of body weight changes in mice used for Figure 6B–D (A) and Figure 6E–G (B). ** < 0.01, *** < 0.001, one-way ANOVA followed by the Fisher’s LSD post hoc test. Data are shown as the mean ± SEM.
Figure 7 with 2 supplements
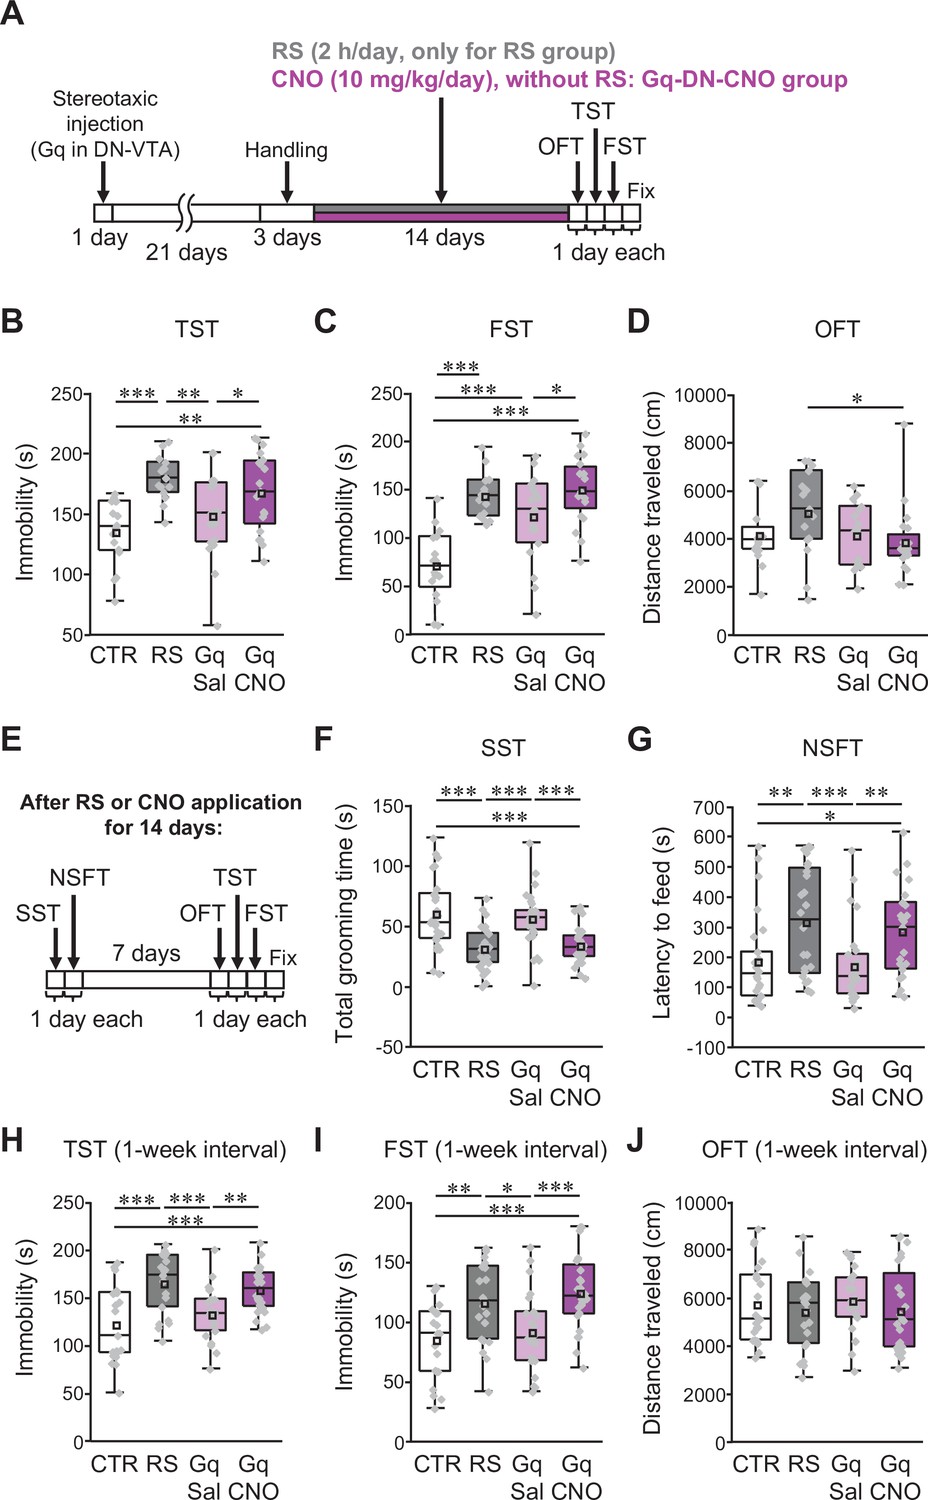
Excitation of VTA-projecting DCN neurons in the DN is sufficient to trigger depression-like behaviors in the absence of stress.
(A and E) Diagram of the experimental time course to check the effects of the excitation of VTA-projecting DCN neurons alone on depression-like behaviors. The OFT, TST, and FST were performed after 2 weeks of chronic administration of CNO into C57BL/6 mice expressing Gq in VTA-projecting DCN neurons without RS application (A). In the separate series of experiments, the SST and NSFT were performed after 2 weeks of CNO administration, and the OFT, TST, and FST were then performed a week after the last CNO administration (E). The combined AAV injection was carried out, as shown in Figure 7—figure supplement 1A. (B–D and F–J) Effects of the chronic excitation of VTA-projecting DCN neurons alone in C57BL/6 mice. The TST (B), FST (C), and OFT (D) were performed by following the time course shown in A (n = 16, 15, 19, and 20 mice for the CTR, RS, Gq-DN-Sal, and Gq-DN-CNO groups, respectively). In the separate series of experiments, the SST (F), NSFT (G), TST (H), FST (I), and OFT (J) were performed by following the time course shown in E (numbers of mice used for the CTR, RS, Gq-DN-Sal, and Gq-DN-CNO groups; n = 27, 27, 29, and 30 mice in the SST; n = 26, 24, 27, and 23 mice in the NSFT; n = 21, 21, 23, and 24 mice in the TST, FST, and OFT). *p < 0.05, **p < 0.01, ***p < 0.001, one-way ANOVA followed by the Fisher’s LSD post hoc test. Data are presented as boxplots, as described in the legend to Figure 1. Exact p values and the statistical tests used are available in Figure 7—source data 1. Effect sizes for behavioral data are available in Figure 7—source data 2 and n numbers for behavioral tests are available in Figure 7—source data 3.
-
Figure 7—source data 1
p Values and statistical tests related to Figure 7.
- https://cdn.elifesciences.org/articles/72981/elife-72981-fig7-data1-v2.xlsx
-
Figure 7—source data 2
Effect sizes for behavior results related to Figure 7.
- https://cdn.elifesciences.org/articles/72981/elife-72981-fig7-data2-v2.xlsx
-
Figure 7—source data 3
Numbers of mice for each sex used in each behavioral test related to Figure 7.
- https://cdn.elifesciences.org/articles/72981/elife-72981-fig7-data3-v2.xlsx
Figure 7—figure supplement 1
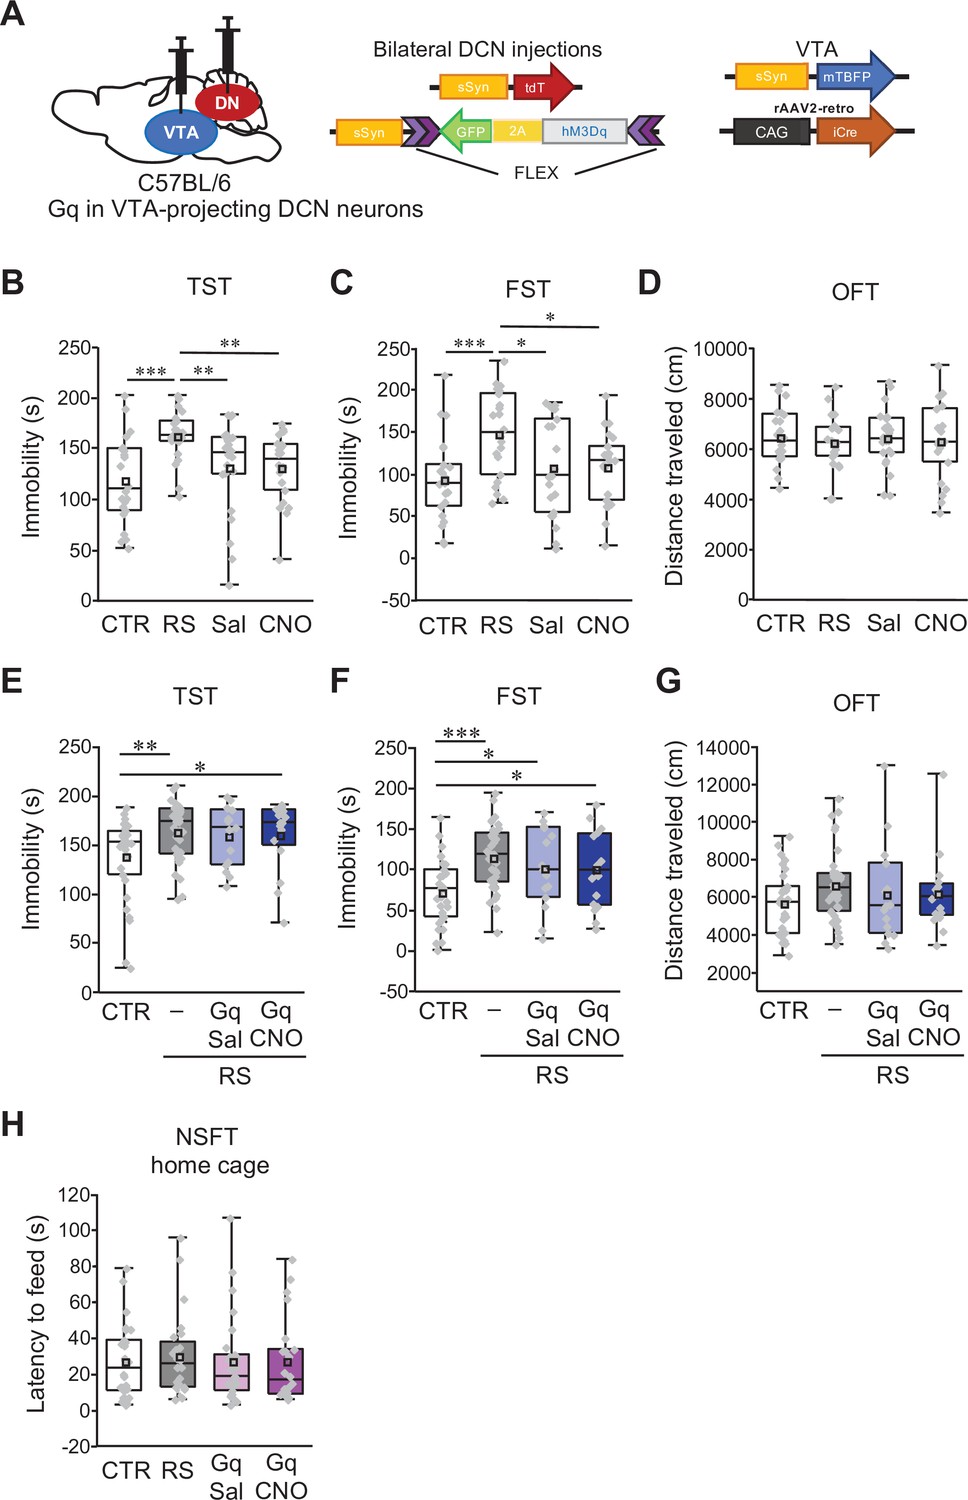
No additive effects of chemogenetic excitation on RS-dependent depression-like behaviors.
(A) Diagram of combined AAV injection. Bilateral injections of AAV-sSyn-tdT and AAV-sSyn-FLEX-hM3Dq(Gq)–2AGFP was carried out into the DCN and a mixture of AAV-sSyn-mTBFP and retroAAV-CAG-Cre was injected into the VTA. (B–D) Assessment by the TST (B), the FST (C), and the OFT (D), to analyze the effects of CNO administration itself in C57BL/6 mice without RS application and stereotaxic AAV injection. For a direct comparison, data for the CTR and the RS groups, which were obtained from concurrently performed experiments and were shown in Figure 1B–D, are reused in this figure. **p < 0.01, ***p < 0.001, one-way ANOVA followed by the Fisher’s LSD post hoc test (n = 22 mice each for the Sal and CNO groups). (E–G) Immobility time in the TST (E) and the FST (F), and total distance moved in the OFT (G), to see the effects of chronic excitation of VTA-projecting DCN neurons using Gq during RS in C57BL/6 mice. *p < 0.05, **p < 0.01, ***p < 0.001, one-way ANOVA followed by the Fisher’s LSD post hoc test (n = 31, 25, 15, and 16 mice for the CTR, RS, RS-Gq-DN-Sal, and RS-Gq-DN-CNO groups, respectively). (H) Latency to feed in the home cage measured after the NSFT (Figure 7G), to see the effects of the chronic excitation of VTA-projecting DCN neurons alone in C57BL/6 mice. No significant difference was detected by one-way ANOVA followed by the Fisher’s LSD post hoc test (n = 26, 24, 27, and 23 mice for the CTR, RS, Gq-DN-Sal, and Gq-DN-CNO groups, respectively). Data are presented as boxplots, as described in the legend to Figure 1.
Figure 7—figure supplement 2
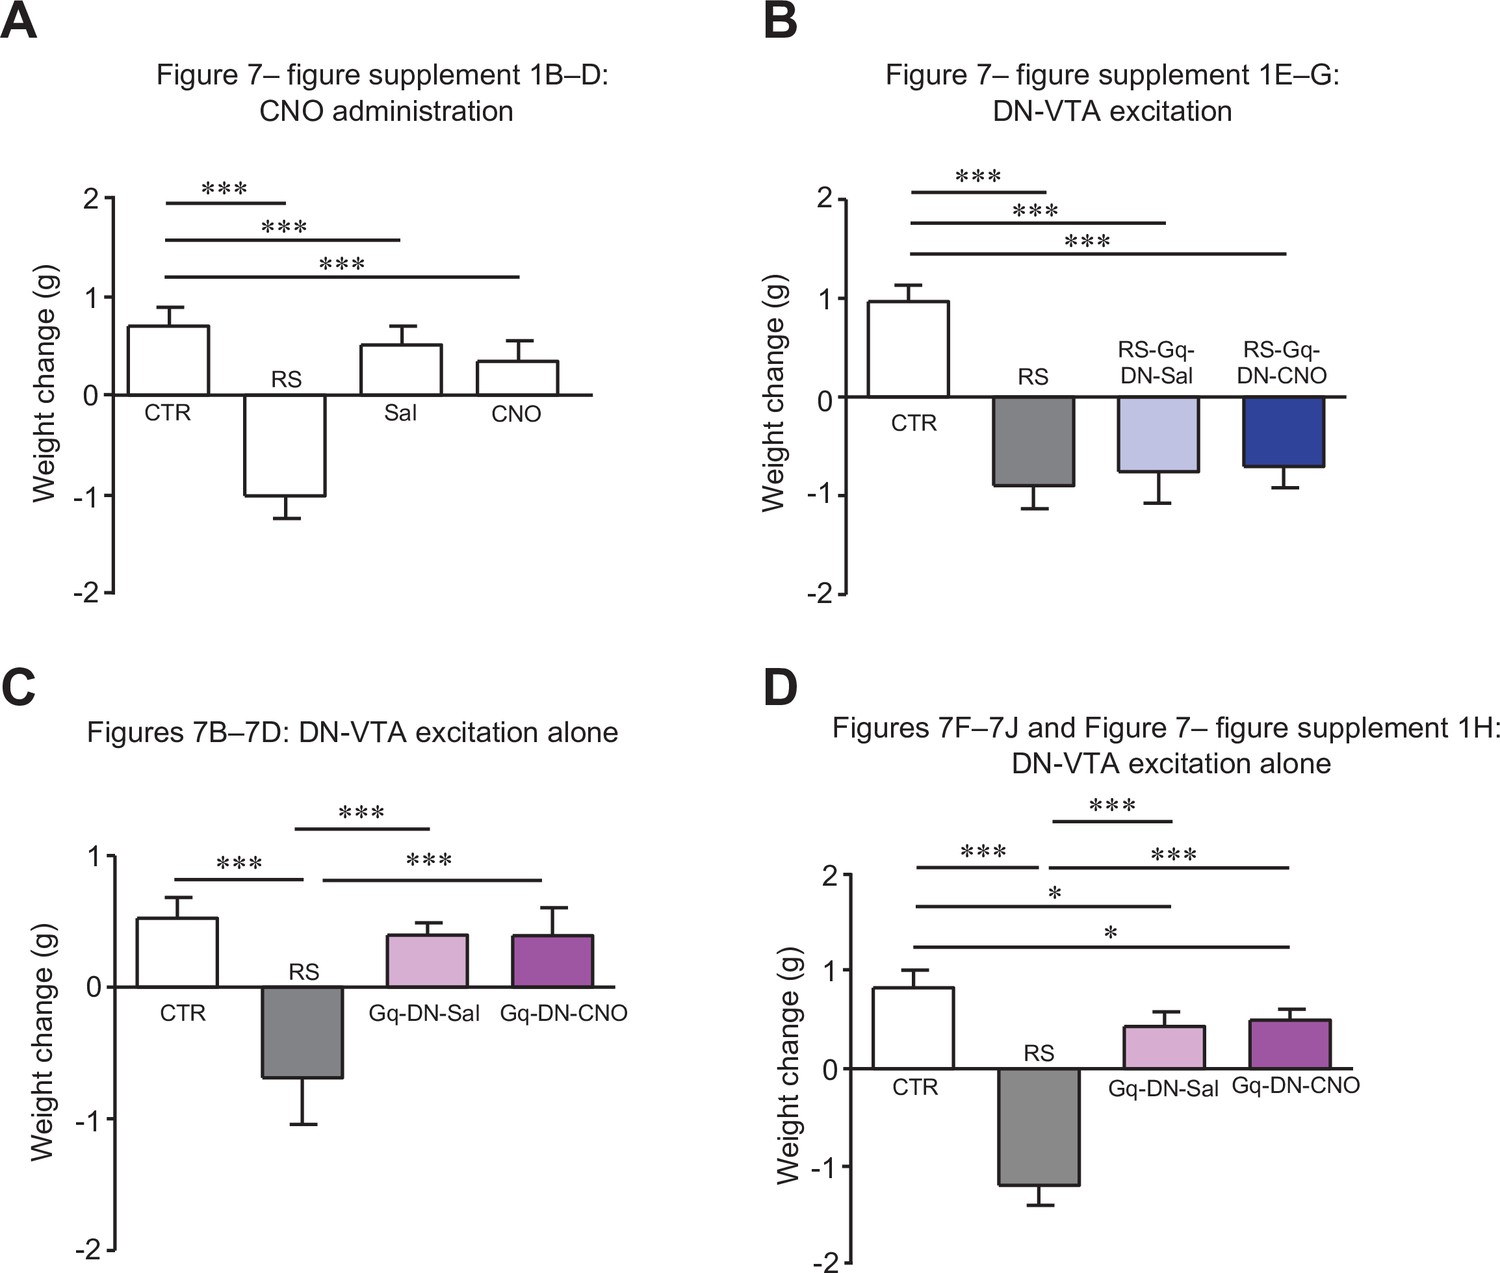
Changes in body weights of mice used for Figure 7.
Comparisons of body weight changes in mice used for Figure 7—figure supplement 1B–D (A), Figure 7—figure supplement 1E–G (B), Figure 7B–D (C) and Figure 7F–J and Figure 7—figure supplement 1H (D). For a direct comparison, data for the CTR and the RS groups in (A), which were obtained from concurrently performed experiments and were shown in Figure 2—figure supplement 2A, are reused in (A). * < 0.05, *** < 0.001, one-way ANOVA followed by the Fisher’s LSD post hoc test. Data are shown as the mean ± SEM.
Figure 8
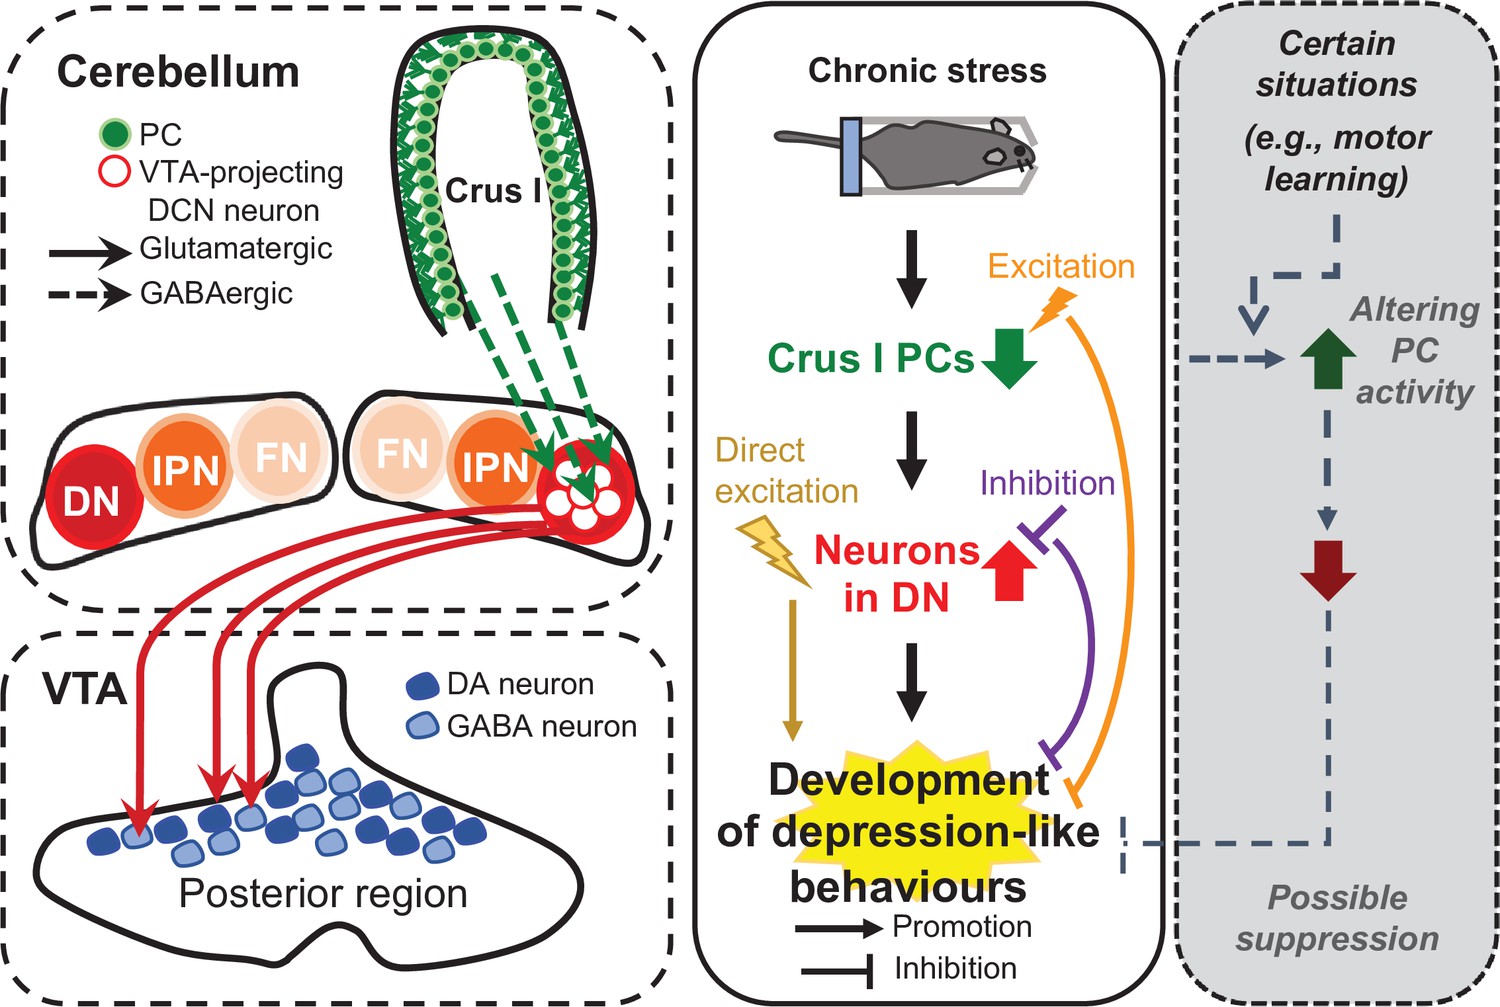
Diagram summarizing the results of this study.
In this study, we demonstrated that the neural circuit from crus I of the cerebellar cortex to the DN and then to the VTA is functionally connected (left), and that the neuronal circuit composed of VTA-projecting DCN neurons in the DN is crucial for controlling the chronic stress-mediated development of depression-like behaviors (middle), which is possibly prevented under certain situations that may increase PC activity (right).
Videos
Video 1
TST of the CTR group.
Video 2
TST of the RS group.
Video 3
FST of the CTR group.
Video 4
FST of the RS group.
Tables
Table 1
Pearson correlation coefficient analysis between TST and FST, TST and OFT, and FST and TST.
The correlation was calculated from data of all mice used in each series of experiments for Figure 2J–L, Figure 6B–D, or Figure 7B–D.
| Figure | Test | Sample numbers | Comparison | Coefficient (r) | p value | Significance |
|---|---|---|---|---|---|---|
| Figure 2J-L | Effects of excitation of crus I PCs on RS | 119 | TST vs FST | 0.464 | 1.17 × 10⁻⁷ | *** |
| TST vs OFT | 0.153 | 0.0961 | ||||
| FST vs OFT | 0.0303 | 0.743 | ||||
| Figure 6B-D | Effects of inhibition of VTA-projecting DCN neurons on RS | 116 | TST vs FST | 0.327 | 3.42 × 10⁻⁴ | *** |
| TST vs OFT | –0.119 | 0.204 | ||||
| FST vs OFT | 0.0474 | 0.0613 | ||||
| Figure 7B-D | Only excitation of VTA-projecting DCN neurons | 70 | TST vs FST | 0.439 | 1.43 × 10⁻⁴ | *** |
| TST vs OFT | –0.0308 | 0.8 | ||||
| FST vs OFT | –0.0143 | 0.907 |
Key resources table
| Reagent type (species) or resource | Designation | Source or reference | Identifiers | Additional information |
|---|---|---|---|---|
| Strain, strain background (Mus musculus) | C57BL/6 J mice | Orient Bio | N/A | |
| Strain, strain background (Mus musculus) | ICR mice; CrljOri:CD1 | Orient Bio | N/A | |
| Genetic reagent (Mus musculus) | Gad2-IRES-Cre mice; Gad2tm2(cre)Zjh/J | Jackson Laboratories | Stock No: 010802; RRID:IMSR_JAX:010802 | |
| Genetic reagent (Mus musculus) | Pcp2-cre mice; B6.129-Tg(Pcp2-cre)2Mppin/J | Jackson Laboratories | Stock No: 004146; RRID:IMSR_JAX:004146 | |
| Genetic reagent (Mus musculus) | Ai six reporter mice; B6.Cg-Gt(ROSA)26Sortm6(CAG-ZsGreen1)Hze/J | Jackson Laboratories | Stock No: 007906; RRID:IMSR_JAX:007906 | |
| Antibody | Mouse monoclonal anti-calbindin | Sigma-Aldrich | Cat#C9848; RRID:AB_476894 | (1:200) |
| Antibody | Rabbit polyclonal anti-TH | Millipore | Cat#AB152; RRID: AB_390204 | (1:400) |
| Antibody | Rabbit monoclonal anti-c-Fos | Cell Signalling Technology | Cat#2250; RRID: AB_2247211 | (1:300) |
| Antibody | Mouse monoclonal anti-NeuN | Millipore | Cat#MAB377; RRID: AB_2298772 | (1:200) |
| Antibody | Mouse monoclonal anti-GAD67 | Millipore | Cat#MAB5406; RRID:AB_2278725 | (1:1000) |
| Antibody | Mouse monoclonal anti-GFAP | Millipore | Cat#MAB360; RRID:11212597 | (1:200) |
| Antibody | Goat anti-mouse IgG(H + L) alexa fluor@647 | Invitrogen | Cat#A21235; RRID: AB_2535804 | (1:200) |
| Antibody | Goat anti-rabbit IgG(H + L) alexa fluor@647 | Invitrogen | Cat#A21245; RRID: AB_141775 | (1:200) |
| Antibody | Rabbit polyclonal anti-OLLAS | Antibodies-online | ABIN1842163 | (1:1000) |
| Chemical compound, drug | Clozapine N-oxide | Hello Bio | Cat#HB1807 | 10 mg/kg, i.p. |
| Chemical compound, drug | Bicuculline methochloride | Tocris Bioscience | Cat#0131 | |
| Chemical compound, drug | Mounting medium | Vector Laboratories | Cat#H-1400 | |
| Chemical compound, drug | Mounting medium with DAPI | Vector Laboratories | Cat#H-1500 | |
| Chemical compound, drug | Prolong diamond antifade mountant | Thermo Fisher Scientific | Cat#P36961 | |
| Chemical compound, drug | Cholera toxin subunit B, Alexa flour 647 conjugate | Thermo Fisher Scientific | Cat#C34778 | |
| Chemical compound, drug | Tetrodotoxin | Tocris Bioscience | Cat#1,069 | |
| Chemical compound, drug | 4-Aminopyridine | Tocris Bioscience | Cat#0940 | |
| Recombinant DNA reagent | pAAV-hSyn-DIO-hM3Dq(Gq)-mCherry | Addgene | Addgene plasmid #44,361 | |
| Recombinant DNA reagent | pAAV-hSyn-DIO-hM4Di(Gi)-mCherry | Addgene | Addgene plasmid #44,362 | |
| Recombinant DNA reagent | pAAV-CaMKIIa-hChR2(H134R)-EYFP | Addgene | Addgene plasmid #26,969 | |
| Recombinant DNA reagent | AAV-CaMKIIa- GCaMP6f-P2A-nls-dTomato | Addgene | Addgene plasmid #51,087 | |
| Recombinant DNA reagent | pBAD-mTagBFP2 | Addgene | Addgene plasmid #34,632 | |
| Recombinant DNA reagent | ptdTomato-N1 | Clontech | Cat#632,532 | |
| Recombinant DNA reagent | paavCAG-iCre | Addgene | Addgene plasmid #51,904 | |
| Recombinant DNA reagent | paavCAG-sfGFP | Addgene | Will be deposited | |
| Recombinant DNA reagent | paavCAG-pre- mGRASPi- mCerulean | Addgene | Will be deposited | |
| Recombinant DNA reagent | paavCAG-post-mGRASPi-2AdT | Addgene | Addgene plasmid #34,912 | |
| Recombinant DNA reagent | rAAV2-retro helper | Addgene | Addgene plasmid #81,070 | |
| Biological sample (AAV) | AAV-sSyn-GFP | Kim et al., Kim et al., 2015a | ||
| Biological sample (AAV) | AAV-sSyn-tdT | This paper | Further information will be provided by the Lead Contact upon request. | |
| Biological sample (AAV) | AAV-sSyn-mTBFP | This paper | Further information will be provided by the Lead Contact upon request. | |
| Biological sample (AAV) | AAV-sSyn-ChR2-GFP | This paper | Further information will be provided by the Lead Contact upon request. | |
| Biological sample (AAV) | AAV-sSyn-ChR2-2AdT | This paper | Further information will be provided by the Lead Contact upon request. | |
| Biological sample (AAV) | AAV-sSyn-FLEX-GFP | This paper | Further information will be provided by the Lead Contact upon request. | |
| Biological sample (AAV) | AAV-sSyn-FLEX-ChR2-GFP | This paper | Further information will be provided by the Lead Contact upon request. | |
| Biological sample (AAV) | AAV-sSyn-FLEX-hM3Dq(Gq)–2AGFP | This paper | Further information will be provided by the Lead Contact upon request. | |
| Biological sample (AAV) | AAV-sSyn-FLEX-hM4Di(Gi)–2AGFP | This paper | Further information will be provided by the Lead Contact upon request. | |
| Software, algorithm | pClamp 10 | Axon instruments | RRID:SCR_011323 | |
| Software, algorithm | NIS-Element | Nikon | RRID:SCR_014329 | |
| Software, algorithm | Fiji | NIH | RRID:SCR_002285 | |
| Software, algorithm | Ethovision | Noldus | RRID:SCR_000441 | |
| Software, algorithm | Origin | Origin Lab | RRID:SCR_014212 |
Table 2
Numbers of DAPI- and c-Fos-positive cells in each subregion of DCN at different time periods of RS.
| RS duration | DCN sub-region | Control | Stress | RS-Gq-CNO | ||||||
|---|---|---|---|---|---|---|---|---|---|---|
| DAPI | c-Fos | N | DAPI | c-Fos | N | DAPI | c-Fos | N | ||
| 3 day | DN | 94.6 ± 8 | 31.4 ± 4.2 | 5 | 97.2 ± 28.5 | 50.8 ± 14.6 | 5 | - | - | - |
| 7 day | DN | 152 ± 15 | 41.8 ± 14.2 | 5 | 152 ± 21.7 | 96.4 ± 20.2 | 5 | - | - | - |
| 10 day | DN | 128.2 ± 18.7 | 32.6 ± 8.7 | 5 | 119.6 ± 20.3 | 67 ± 11.2 | 5 | - | - | - |
| 14 day | DN | 147.6 ± 46.5 | 36.4 ± 12.9 | 8 | 109.3 ± 53.9 | 54.8 ± 22.3 | 8 | 95.8 ± 11.1 | 21.4 ± 10.7 | 5 |
| IPN | 114.3 ± 30.5 | 35.5 ± 9.5 | 8 | 99.6 ± 32 | 47 ± 24 | 8 | - | - | - | |
| FN | 103.8 ± 29 | 35.5 ± 9.9 | 8 | 112.1 ± 33.2 | 47.5 ± 21 | 8 | - | - | - | |
Additional files
Download links
A two-part list of links to download the article, or parts of the article, in various formats.
Downloads (link to download the article as PDF)
Open citations (links to open the citations from this article in various online reference manager services)
Cite this article (links to download the citations from this article in formats compatible with various reference manager tools)
VTA-projecting cerebellar neurons mediate stress-dependent depression-like behaviors
eLife 11:e72981.
https://doi.org/10.7554/eLife.72981


