Dual signaling via interferon and DNA damage response elicits entrapment by giant PML nuclear bodies
- Institute of Virology, Ulm University Medical Center, Germany
- Central Facility for Electron Microscopy, Ulm University, Germany
- Institute of Analytical and Bioanalytical Chemistry, Ulm University, Germany
- Institute of Clinical and Molecular Virology, Friedrich Alexander Universität Erlangen-Nürnberg, Germany
Figures
Figure 1
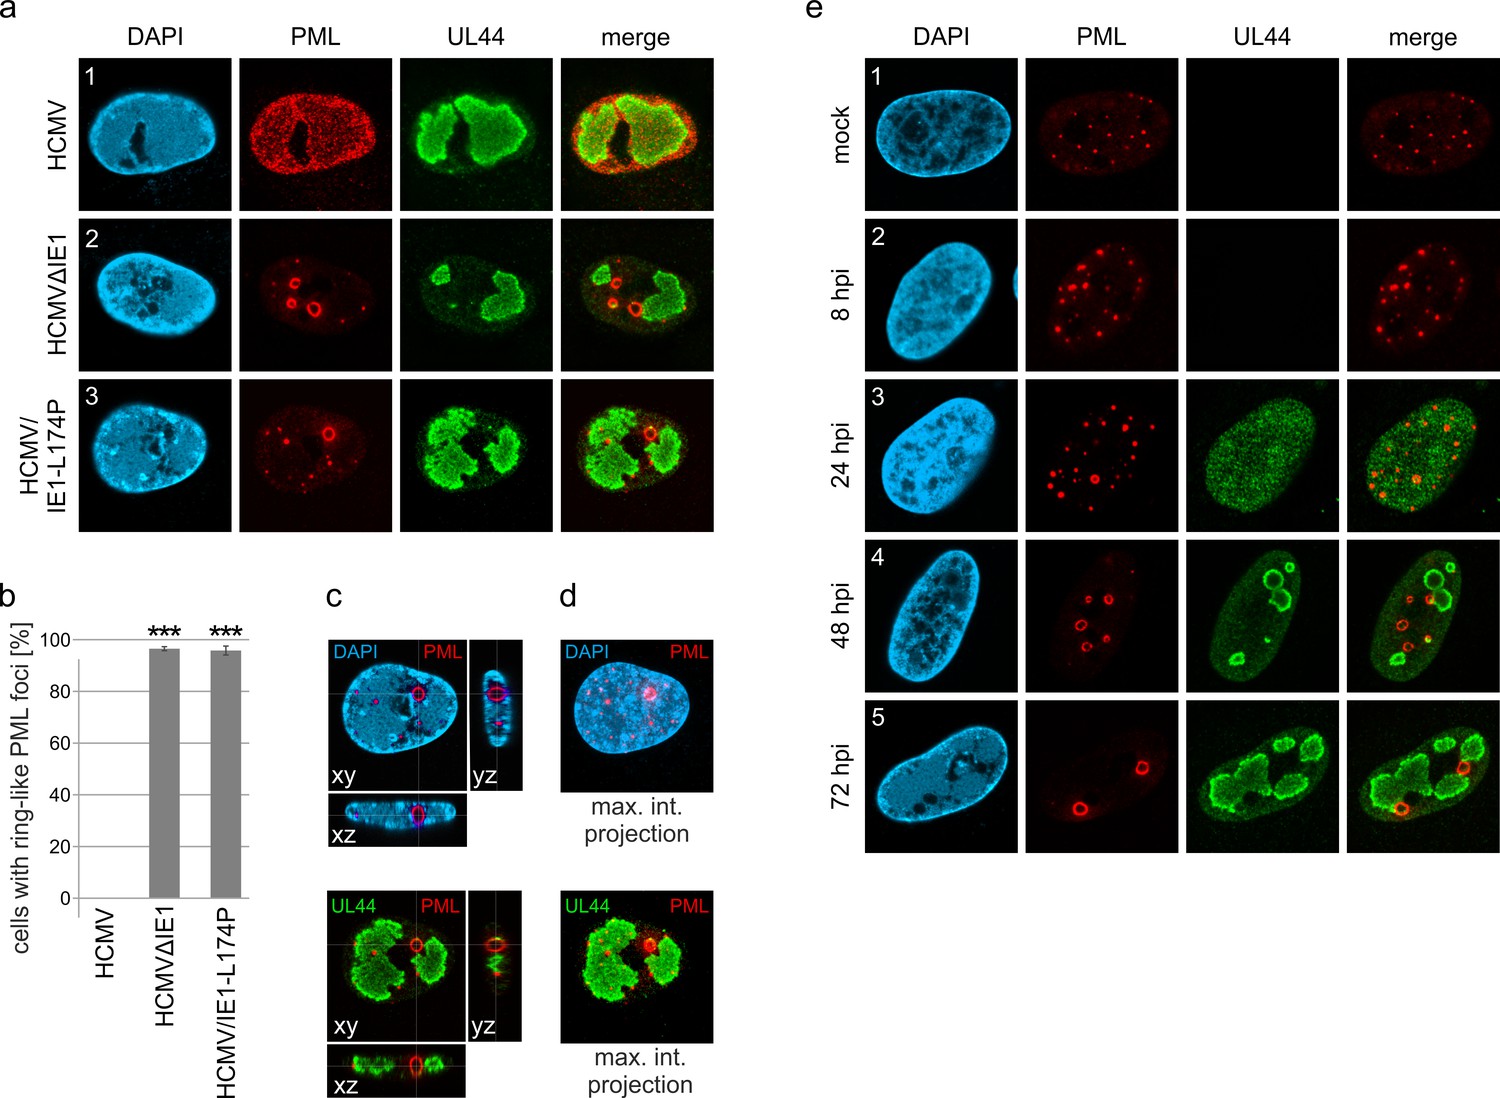
Formation of PML cages during infection with IE1-deficient HCMV.
(a–e) HFF were infected with HCMV strain AD169, IE1-deleted AD169 (HCMVΔIE1) or AD169 encoding IE1 mutant L174P (HCMV/IE1-L174P) at a MOI of 5 IEU/cell. Cells were harvested at 72 hpi for immunofluorescence staining of endogenous PML and UL44 (a). Infected cells with ring-like PML structures were quantified in a population of >900 cells derived from three independent experiments (b). Mean values ± SD are shown and asterisks indicate significant differences; ***, p < 0.001 (see also Figure 1—source data 1). Orthogonal projections (c) and maximum intensity projection (d) from confocal z-series images of an HCMV/IE1-L174P-infected cell are shown. (e) HFF were infected with HCMV/IE1-L174P (MOI 5 IEU/cell) or not infected (mock) and harvested at indicated times for immunofluorescence analysis of endogenous PML and UL44 localization. Cell nuclei were stained with DAPI.
-
Figure 1—source data 1
Numerical data that are represented as a graph in Figure 1b.
- https://cdn.elifesciences.org/articles/73006/elife-73006-fig1-data1-v2.xlsx
Figure 2
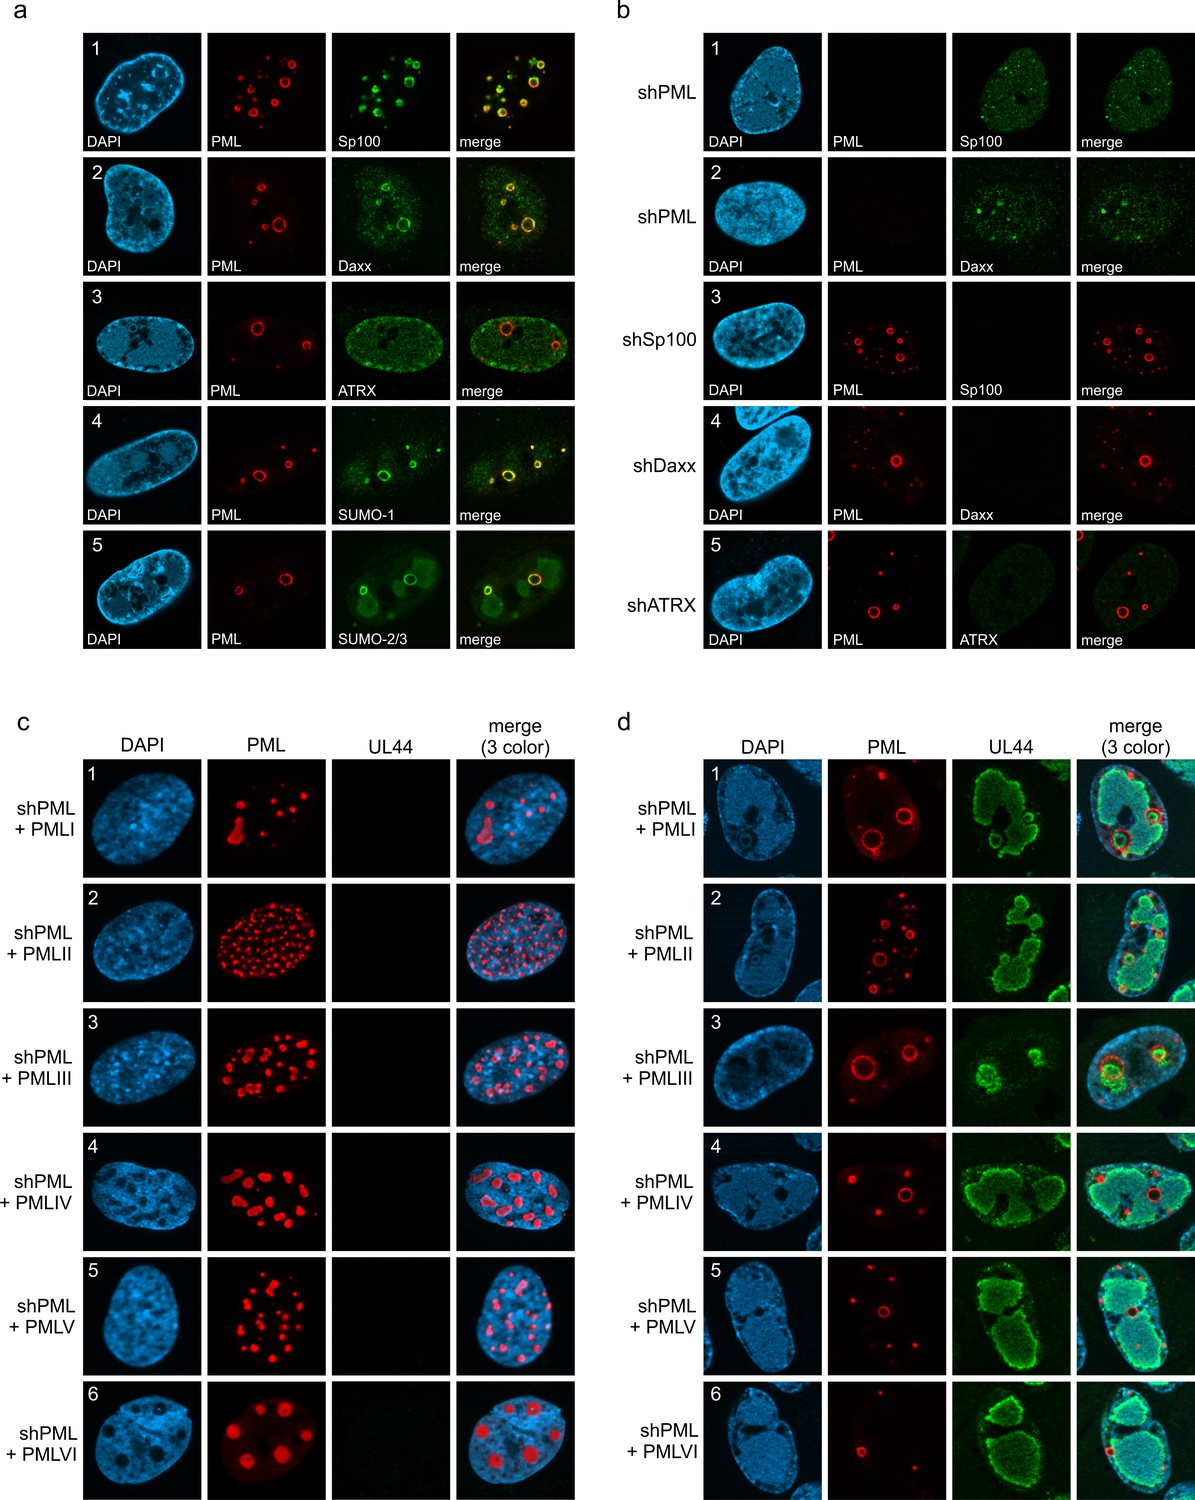
Protein composition of PML cages.
(a) Recruitment of nuclear body proteins to PML cages. HFF were infected with HCMV/IE1-L174P, based on strain AD169, at a MOI of 5 IEU/cell and harvested at 72 hpi for immunofluorescence staining of PML together with NB components Sp100, Daxx, ATRX, SUMO-1, and SUMO-2 as indicated. (b) PML as key organizer of PML cages. HFF depleted for PML (shPML), Sp100 (shSp100), Daxx (shDaxx) or ATRX (shATRX) were infected with HCMVΔIE1, based on strain AD169, at a MOI of 5 IEU/cell and harvested at 72 hpi for staining of PML-NB proteins. (c, d) PML isoform-independent formation of PML cages. Flag-tagged PML isoforms I-VI were reintroduced into PML-knockdown HFF by lentiviral transduction. Newly generated cells were non-infected (c) or infected with HCMVΔIE1 at MOI 10 (IEU/cell) for 72 h (d) and were stained with antibodies directed against FLAG and PML. DAPI staining was performed to visualize cell nuclei.
Figure 3

Impact of virus dose and viral DNA replication on formation of PML cages.
(a–d) MOI-dependent induction of PML cages. HFF were infected with HCMVΔIE1, based on strain AD169, at MOIs ranging from 0.1 to 10 IEU/cell or not infected (mock) and were harvested after 72 hr. Immunofluorescence analysis was performed to analyze number and size of PML foci; scale bar, 10 µm (a). ImageJ-based quantification of the PML foci number and size, determined as perimeter, was performed using maximum intensity projections of confocal z-series images of >150 cells derived from three independent experiments. At MOIs < 1, only infected cells were included in the analysis, which were identified by co-staining of immediate-early protein 2 (IE2) (not shown). PML foci were separated into three groups of normal sized PML-NBs (perimeter <3 µm), enlarged PML foci (perimeter 3–10 µm), and highly enlarged PML cages (perimeter >10 µm). Shown are the mean values of PML foci numbers per cell nucleus (b) and the percentage total PML-NBs (c). Green and dark green asterisks indicate statistically significant higher numbers of enlarged PML and highly enlarged PML foci, respectively, in infected as compared to not infected cells. (d) Western blot detection of viral immediate-early (IE2p86), early (UL44, UL84), and late (IE2p60) proteins. Staining of β-actin was included as internal control. Full blots are shown in Figure 3—source data 2. (e, f) Formation of PML cages in absence of viral DNA replication. HFF were infected with HCMVΔIE1 at a MOI of 5 IEU/cell and were treated with 250 µM PFA in parallel with virus inoculation or were left untreated. At 72 hpi, cells were fixed for immunofluorescence staining of PML, UL44 as marker for viral replication centers, and of cell nuclei with DAPI (e), followed by quantification of PML foci size in >160 cells derived from three independent experiments as described above. Significant differences in the occurrence of highly enlarged PML cages are indicated by asterisks. **, p < 0.01; ***, p < 0.001. PFA, phosphonoformic acid. See also Figure 3—source data 1.
-
Figure 3—source data 1
Numerical data that are represented as graphs in Figure 3b, c and f.
- https://cdn.elifesciences.org/articles/73006/elife-73006-fig3-data1-v2.xlsx
-
Figure 3—source data 2
Uncropped western blot images for Figure 3d.
- https://cdn.elifesciences.org/articles/73006/elife-73006-fig3-data2-v2.zip
Figure 4 with 1 supplement
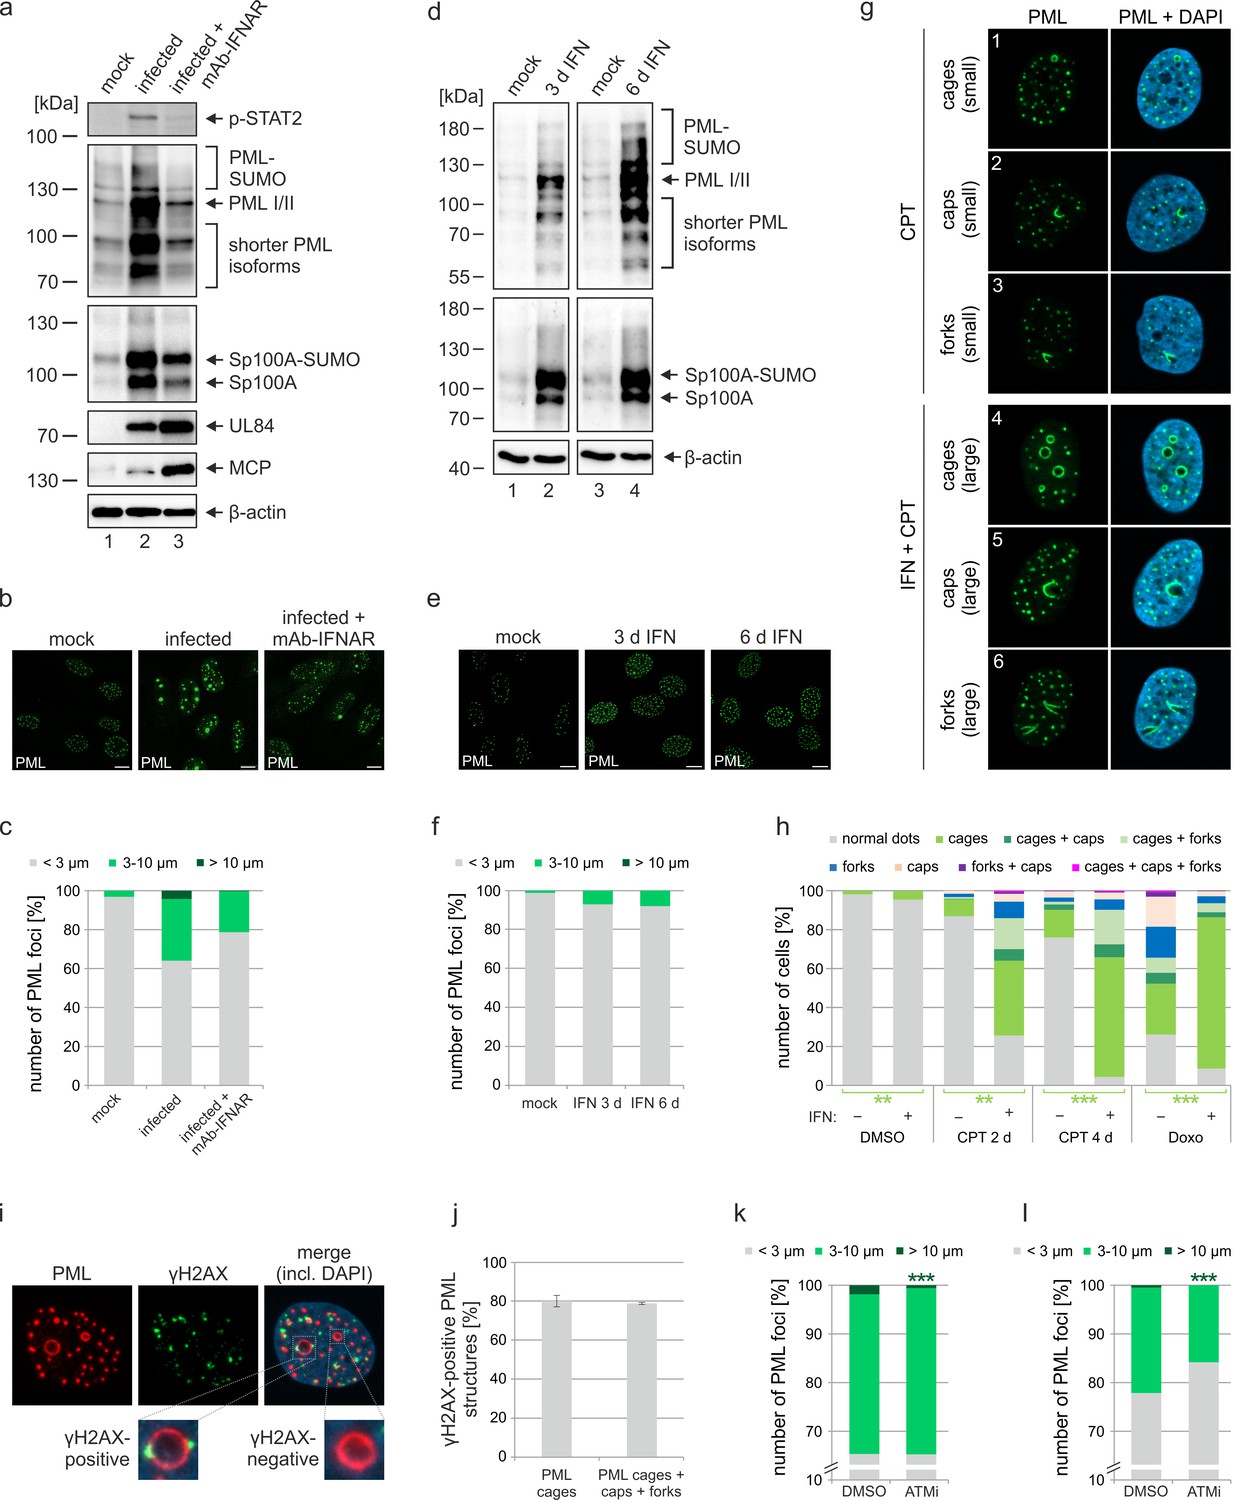
Role of IFN and DNA damage signaling for induction of PML cages.
(a–c) Reduced formation of PML cages in infected cells upon inhibition of the IFN pathway. HFF were infected with HCMV/IE1-L174P, based on strain AD169, at a MOI of 5 IEU/ml or were not infected (mock). Monoclonal anti-IFNα/β receptor antibody (mAb-IFNAR) was added 25 min prior to infection at a concentration of 5 μg/ml. Cells were harvested at 72 hpi for Western blot detection using antibodies directed against phosphorylated STAT2, PML, Sp100, viral early protein UL84, viral late protein MCP, and β-actin as control (a) (see Figure 4—source data 1 for full blots) or for immunofluorescence analysis of PML foci (b). Maximum intensity projections of confocal z-series images were used to quantify number and size of PML foci in ≥50 cell nuclei per sample (c). (d-f) No formation of PML cages by IFN treatment alone. HFF were treated with IFN-β (1,000 U/ml) for 3 d or 6 d or were left untreated (mock). Cells were subjected to Western blot analysis of PML, Sp100, and β-actin as loading control (d) (see Figure 4—source data 1 for full blots) or were harvested for immunofluorescence staining of PML (e); scale bar, 10 µm. Maximum intensity projections of confocal z-series images were used to quantify number and size of PML foci in ≥160 cell nuclei derived from three independent experiments (f). Scale bars, 10 µm. (g–h) Formation of PML cages after stimulation of IFN and DNA damage signaling. (g) Overview of PML structures (cages, caps, and forks) forming upon induction of DNA damage in HFF cells. HFF cells were seeded at low density (30,000 cells / well in 12-well plates) and were then mock treated (panels 1–3) or treated with 1000 U/ml IFN-β for 3 days (panels 4–6), followed by addition of CPT at a final concentration of 1 µM for 2 days. Cells were stained for endogenous PML. (h) Quantification of PML structures in HFF cells treated with DNA damage-inducing chemicals CPT and Doxo. HFF cells were seeded at low density (30,000 cells / well in 12-well plates) and, the next day, were mock treated (-) or treated with 1000 U/ml IFN-β (+) for 3 days, followed by addition of CPT or Doxo at final concentrations of 1 µM and 0.5 µM, respectively, or DMSO as control. Cells were harvested 2 days later (DMSO, Doxo, CPT 2 d) or 4 days later (CPT 4 d) and subjected to immunofluorescence staining of PML. Cell nuclei were visualized with DAPI. Formation of PML structures (cages, forks, circles as well as combinations of these structures as indicated) was assessed in >1300 cells derived from three independent experiments. Statistically significant differences in the occurance of cells with PML circles in IFN-treated groups compared to not IFN-treated groups are indicated by asterisks. **, p < 0.01; ***, p < 0.001. (i, j) Association of PML structures with sites of DNA damage. HFF cells were treated with Doxo and IFN as described in (h), followed by immunofluorescence staining of PML and γH2AX. (i). The numbers of γH2AX-positive PML cages, as shown in the insets, as well as all enlarged PML structures (cages, caps, and forks) were determined in >160 cells derived from three independent experiments (j). (k, l) Reduced formation of PML cages upon inhibition of DNA damage signaling. HFF were infected with HCMVΔIE1 at a MOI of 3 IEU/cell (k) or a MOI of 0.5 IEU/cell (l) and were treated with ATM inhibitor Ku-55933 (30 µM) 10 min prior to virus inoculation, or were treated with DMSO as control. At 72 hpi, cells were fixed for immunofluorescence staining of PML followed by quantification of PML foci size in >160 cells derived from three independent experiments. Statistically significant differences in the number of highly enlarged PML cages are indicated by asterisks. ***, p < 0.001. IFN, interferon; CPT, camptothecin; Doxo, doxorubicin; ATMi, ATM inhibitor. See also Figure 4—source data 2.
-
Figure 4—source data 1
Uncropped western blot images for Figure 4a and b.
- https://cdn.elifesciences.org/articles/73006/elife-73006-fig4-data1-v2.zip
-
Figure 4—source data 2
Numerical data that are represented as graphs in Figure 4c, f, h, j, k and l.
- https://cdn.elifesciences.org/articles/73006/elife-73006-fig4-data2-v2.xlsx
Figure 4—figure supplement 1
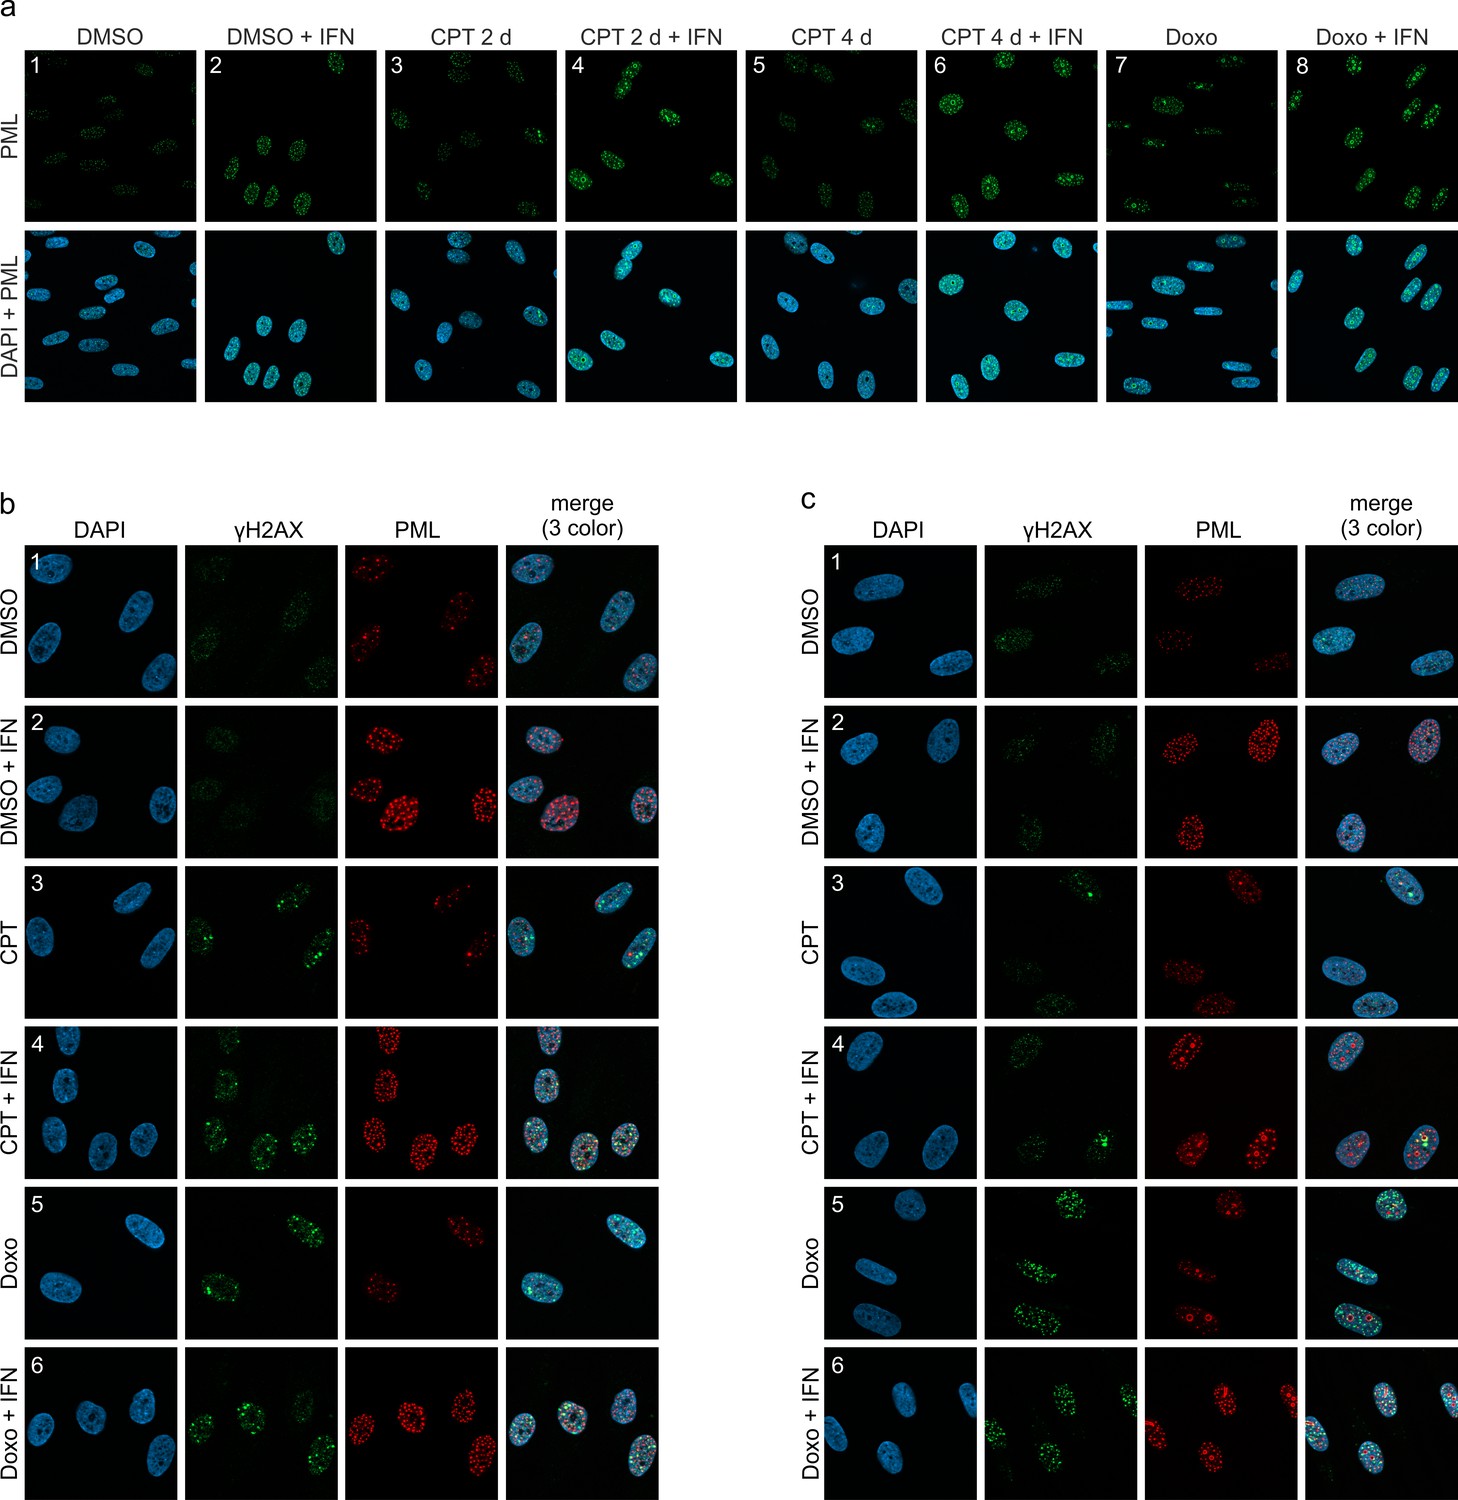
Effect of IFN and DNA damage on PML localization.
(a) PML structures forming upon induction of DNA damage in HFF cells. HFF cells were seeded at low density (30,000 cells / well in 12-well plates) and were left untreated or treated with IFN (IFN-β, 1000 U/ml) and subsequently with CPT (1 µM), Doxo (0.5 µM), or DMSO as control. Cells were harvested 2 days later (panel 1–4, 7, 8) or 4 days later (panels 5, 6) and subjected to immunofluorescence staining of PML. (b, c) DNA repair foci in HFF treated with CPT or Doxo. HFF cells were treated as described in (a) and harvested at 3 hr (b) or 2 days (c) after induction of DNA damage for staining of PML and γH2AX.
Figure 5 with 2 supplements
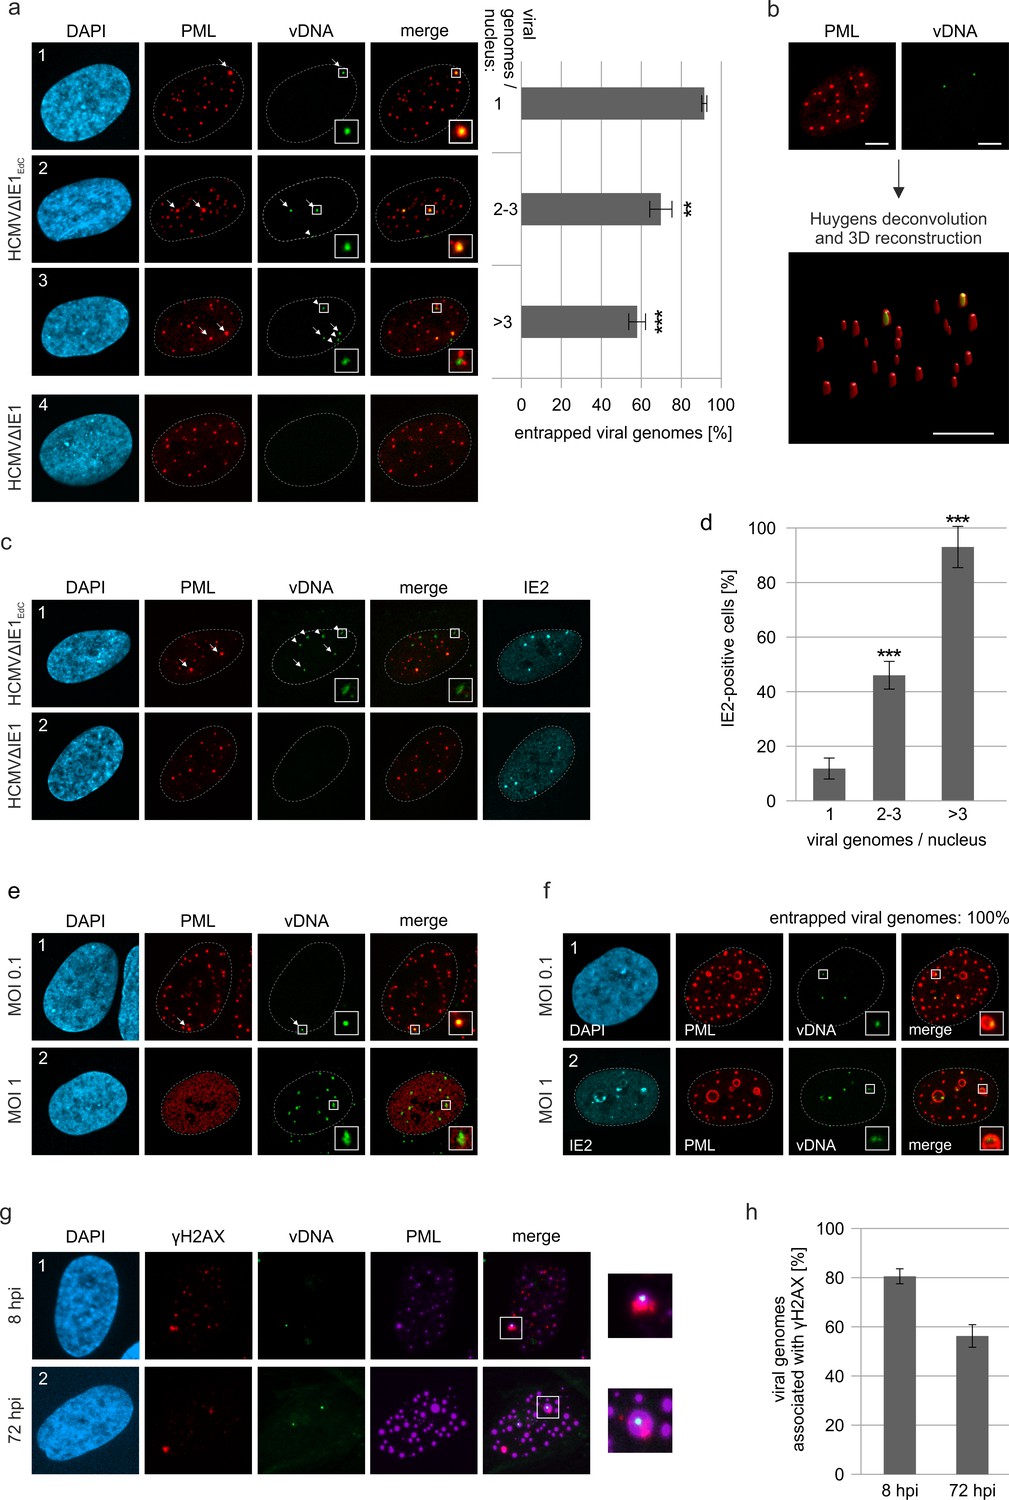
Entrapment of HCMV input genomes by PML cages.
HFF were infected with EdC-labeled (HCMVΔIE1EdC) and unlabeled HCMVΔIE1 or respective wild-type viruses (HCMVEdC, HCMV), which are all based on strain AD169. At different times after infection, cells were fixed for antibody staining to detect IE2 and/or PML in combination with click chemistry to visualize HCMV input genomes (vDNA). (a) HFF were infected with HCMVΔIE1EdC or unlabeled HCMVΔIE1 at a MOI of 0.1 IEU/cell and stained for PML and vDNA at 8 hpi. According to the number of genomes detected in the nucleus, cells were divided in three groups. Colocalization of PML and vDNA (entrapment) within these groups was determined in ≥160 cells derived from three independent experiments. Genomes encased by PML are marked by arrows, not entrapped genomes by arrowheads. Cell nuclei were visualized by DAPI staining. Asterisks indicate significant differences as compared to the group of cells with 1 viral genome/nucleus (**, p-value < 0.01; ***, p-value < 0.001). (b) 3D reconstruction of a confocal image stack showing PML-NBs in red and HCMV genomes in green. Scale bar, 5 µm. (c) HFF were infected with HCMVΔIE1EdC or HCMVΔIE1 at a MOI of 1 IEU/cell for 8 hr, before they were fixed for immunofluorescence analysis of PML and IE2 combined with click chemistry. (d) HFF were infected, stained, and grouped as described in (a). IE2-positive cells were determined by immunofluorescence staining in ≥200 cells derived from three independent experiments and are shown as percentages of each group. Asterisks indicate significant differences as compared to the group of cells with 1 viral genome / nucleus (***, p-value < 0.001) (e) Infection of HFF was performed with HCMVEdC at a MOI of 0.1 or 1 IEU/cell as indicated. PML and vDNA were stained at 8 hpi. (f) HFF were infected with HCMVΔIE1EdC at a MOI of 0.1 or 1 IEU/cell as indicated and 72 hpi, cells were fixed for co-staining of PML, IE2, and vDNA. vDNA entrapment after infection with MOI 0.1 was determined in >190 cells derived from three independent experiments. (g, h) Association of entrapped vDNA with DNA damage sites. HFF were infected with HCMVΔIE1EdC at a MOI of 0.1 IEU/cell and were fixed at 8 hpi or 72 hpi for staining of vDNA, γH2AX, and PML as indicated (g). Entrapped HCMV genomes were analyzed for an association with γH2AX in >160 cells derived from three independent experiments and the percentages of γH2AX-positive structures are presented as mean values ± SD (h). See also Figure 5—source data 1.
-
Figure 5—source data 1
Numerical data that are represented as graphs in Figure 5a, d, f and h.
- https://cdn.elifesciences.org/articles/73006/elife-73006-fig5-data1-v2.xlsx
Figure 5—figure supplement 1
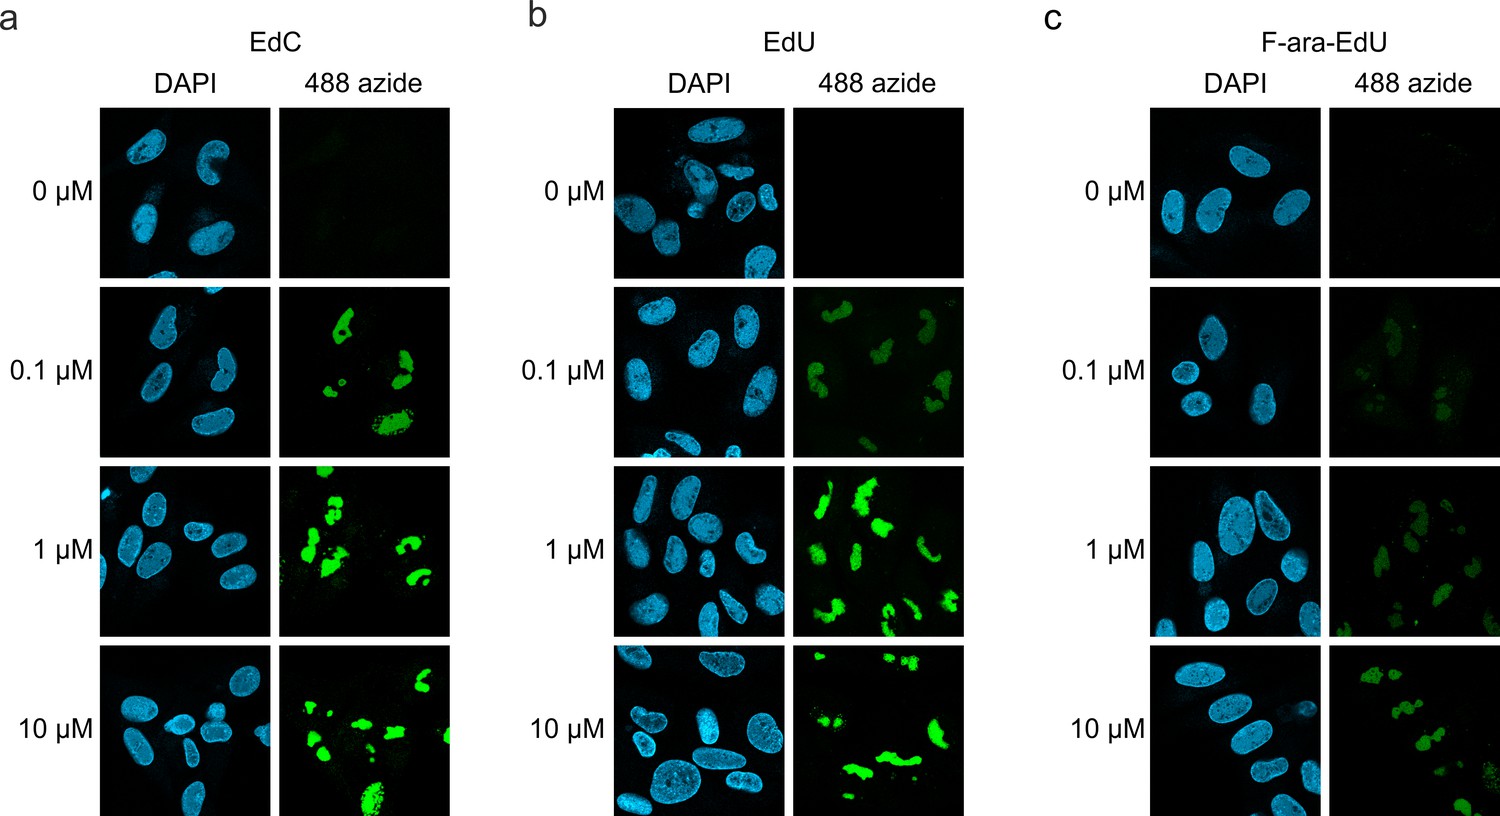
Detection of HCMV replication centers using alkyne-modified nucleosides.
HFF cells were infected HCMV strain AD169 (MOI of 1) and, 44 hr later, were either left untreated (0 µM) or were treated with different concentrations (0.1 µM, 1 µM, or 10 µM) of EdC (a), EdU (b) or F-ara-EdU (c). At 72 hr post-infection, cells were fixed and subjected to click chemistry to visualize newly synthesized HCMV DNA. Cell nuclei were stained with DAPI. EdC, ethynyl-deoxycytidine; EdU, ethynyl-deoxyuridine; F-ara-Edu, deoxy-fluoro-ethynyluridine.
Figure 5—figure supplement 2
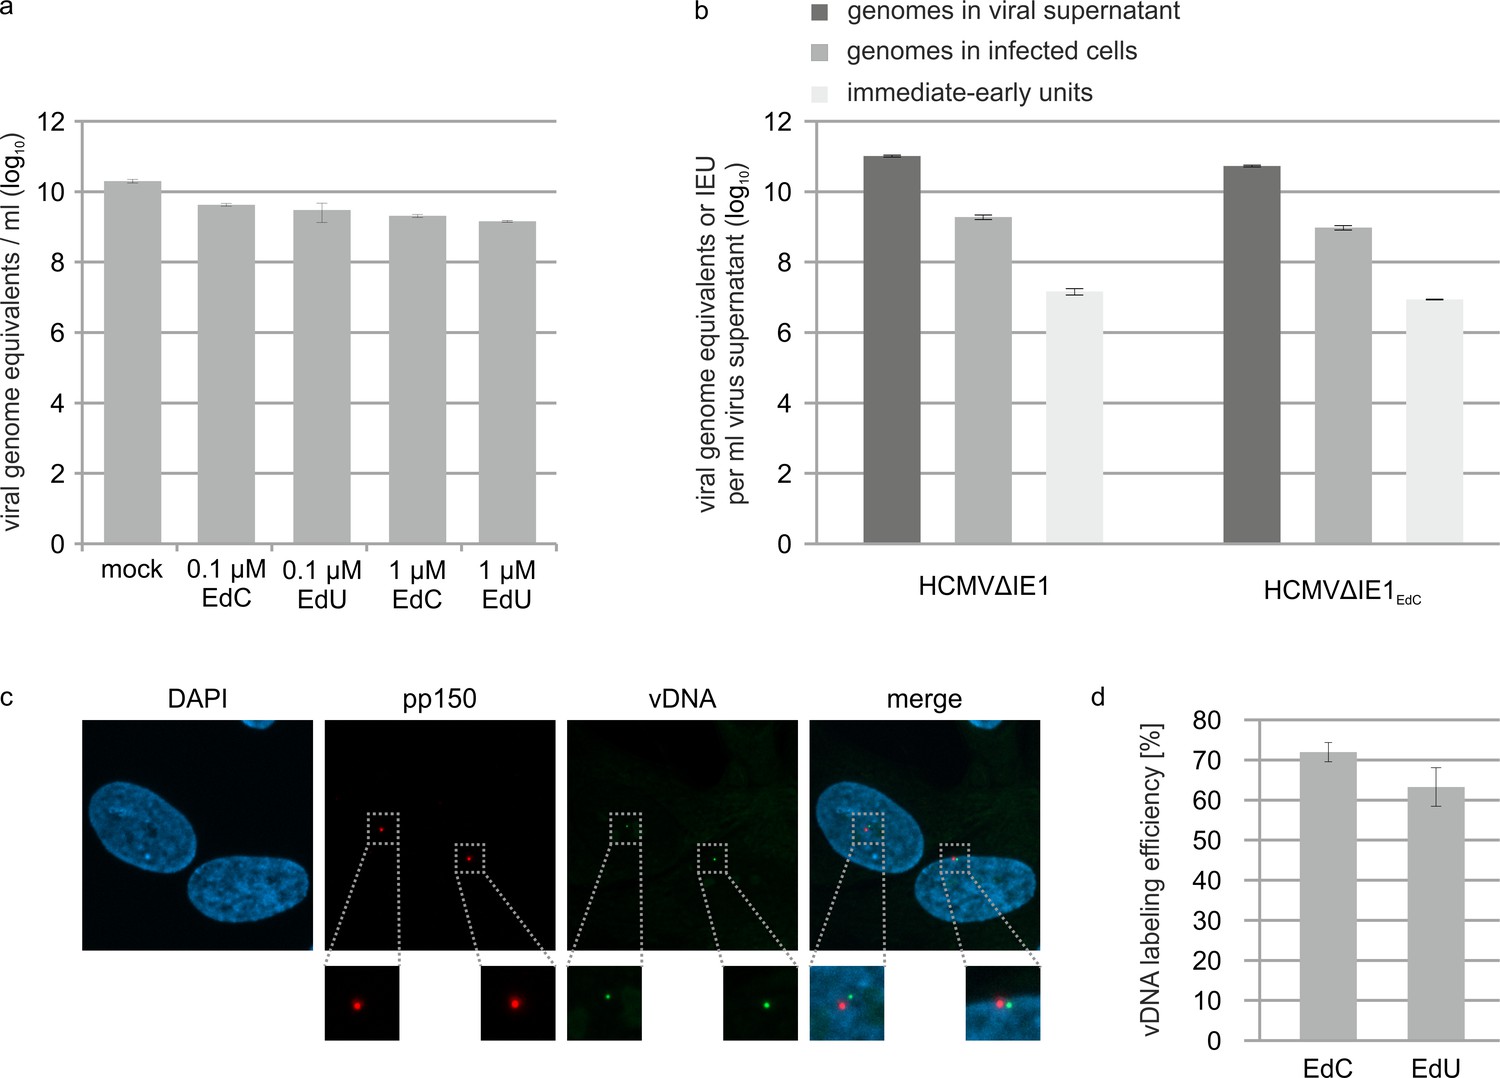
Effect of alkyne-modified nucleosides on HCMV growth and IE gene expression.
(a) IE1-deleted HCMV (strain AD169) was grown on HFF cells that stably express IE1 either in absence of nucleoside-analogs (mock) or in the presence of EdC or EdU (0.1 µM or 1 µM). Viral supernatants were subjected to protease K treatment followed by HCMV gB-specific real-time PCR to determine HCMV genome numbers. Values are derived from triplicate samples and represent mean values ± SD. (b) IE1-deleted HCMV, strain AD169, was grown on HFF-IE1 in the absence (HCMV∆IE1) or presence (HCMV∆IE1EdC) of 0.1 µM EdC. After purification of viral supernatants by centrifugation, viral genome copies were quantified by protease K treatment and HCMV gB-specific real-time PCR (genomes in viral supernatant). To determine intracellular viral genome copies, HFFs were infected with HCMV∆IE1 or HCMV∆IE1EdC followed by extraction of total DNA at 16 hpi and HCMV gB-specific real-time PCR (genomes in infected cells). To measure the influence of EdC labeling on IE gene expression, HFF were infected with dilutions of HCMV∆IE1 or HCMV∆IE1EdC. 24 hr after infection, cells were stained for IE2 and the number of IE2-positive cells was determined to calculate viral titers (immediate-early units). All values were extrapolated to 1 ml of input virus. Unlabeled and labeled viral supernatants showed similar ratios of extra- and intracellular genome equivalents (110–120 x) as well as similar ratios of intracellular genome equivalents and immediate-early units (~ 55x). (c, d) Efficiency of viral DNA labeling. HFF cells were infected with HCMV∆IE1EdC or HCMV∆IE1EdU at an MOI of 0.1 for 6 hr, followed by staining of the HCMV tegument protein pp150 and visualization of viral DNA (vDNA) by click chemistry. A representative image of HCMV∆IE1EdC-infected cells is shown. Calculation of the number of vDNA signals per nucleus resulted in a mean value of 1.2 viral genomes/nucleus (c). Pp150 signals at the cell nuclei as well as signals of viral genomes that were released into the nuclei were assessed in three independent experiments (EdC labeling: > 500 pp150 signals, EdU labeling: > 350 p150 signals) to determine the vDNA labeling efficiencies (vDNA/pp150 ratio), which are shown as mean values ± SD. See also Figure 5—figure supplement 2—source data 1.
-
Figure 5—figure supplement 2—source data 1
Numerical data that are represented as graphs in Figure 5—figure supplement 2a, b and d.
- https://cdn.elifesciences.org/articles/73006/elife-73006-fig5-figsupp2-data1-v2.xlsx
Figure 6
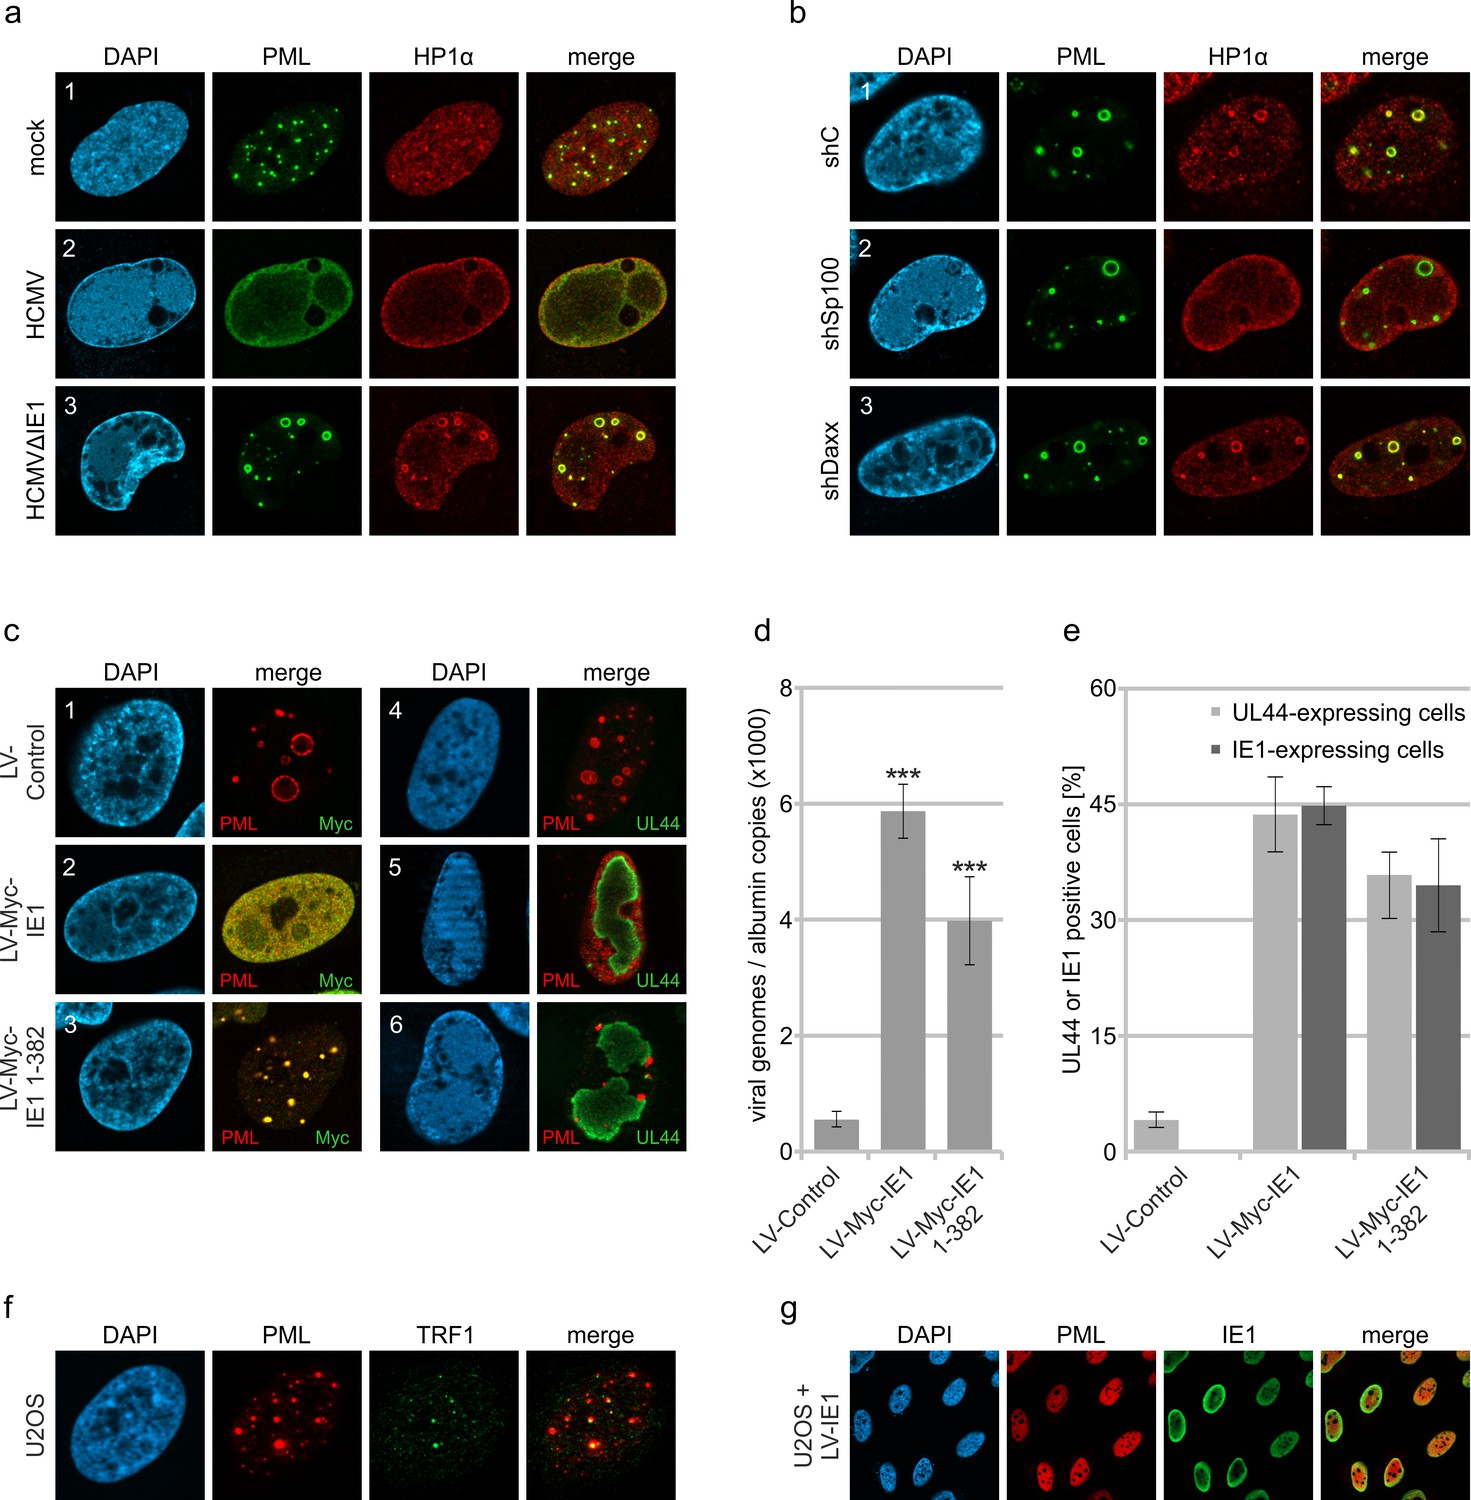
Abrogation of HCMV genome repression by disruption of PML cages.
(a) Recruitment of heterochromatin protein HP1α to PML cages. HFF were non-infected or infected at a MOI of 5 IEU/cell with HCMV or HCMVΔIE1, based on strain AD169. After 72 hr, cells were fixed and stained with antibodies directed against PML and HP1α. (b) Recruitment of HP1α by Sp100. Control HFF (shC), Sp100-knockdown cells (shSp100), and Daxx-knockdown cells (shDaxx) were infected with HCMVΔIE1 (MOI of 5), followed by immunofluorescence analysis of PML and HP1α at 72 hpi. (c) Disruption of PML cages by lentiviral expression of IE1. HFF were infected with HCMVΔIE1 at a MOI of 1 IEU/cell for 72 hr, before they were transduced with lentiviruses encoding Myc-tagged IE1 (LV-Myc-IE1), Myc-tagged IE1 1–382 (LV-Myc-IE1 1–382) or control lentiviruses (LV-control). Four days after transduction, cells were analyzed by immunofluorescence staining of either PML and Myc-IE1 (subpanels 1–3) or PML and UL44 (subpanels 4–6). Nuclei were counterstained with DAPI. (d, e) Increase of viral DNA replication upon disruption of PML cages. HFF were treated as described in (c), followed by isolation of total DNA and quantification of viral genome copy numbers by real-time PCR (d) or by immunofluorescence staining of Myc-IE1 or UL44 followed by quantification of protein expression in >500 cells per sample (e). Values are derived from biological quadruplicates (d) or triplicates (e) and represent mean values ± SD. Asterisks indicate statistically significant differences. ***, p < 0.001. (f, g) Disruption of ALT-associated PML-NBs (APBs) by IE1. (f) U2OS cells were stained for endogenous PML and telomere-binding protein TRF1. (g) U2OS cells were transduced with lentiviruses expressing IE1 followed by immunofluorescence analysis of endogenous PML and IE1. See also Figure 6—source data 1.
-
Figure 6—source data 1
Numerical data that are represented as graphs in Figure 6d and e.
- https://cdn.elifesciences.org/articles/73006/elife-73006-fig6-data1-v2.xlsx
Figure 7 with 3 supplements
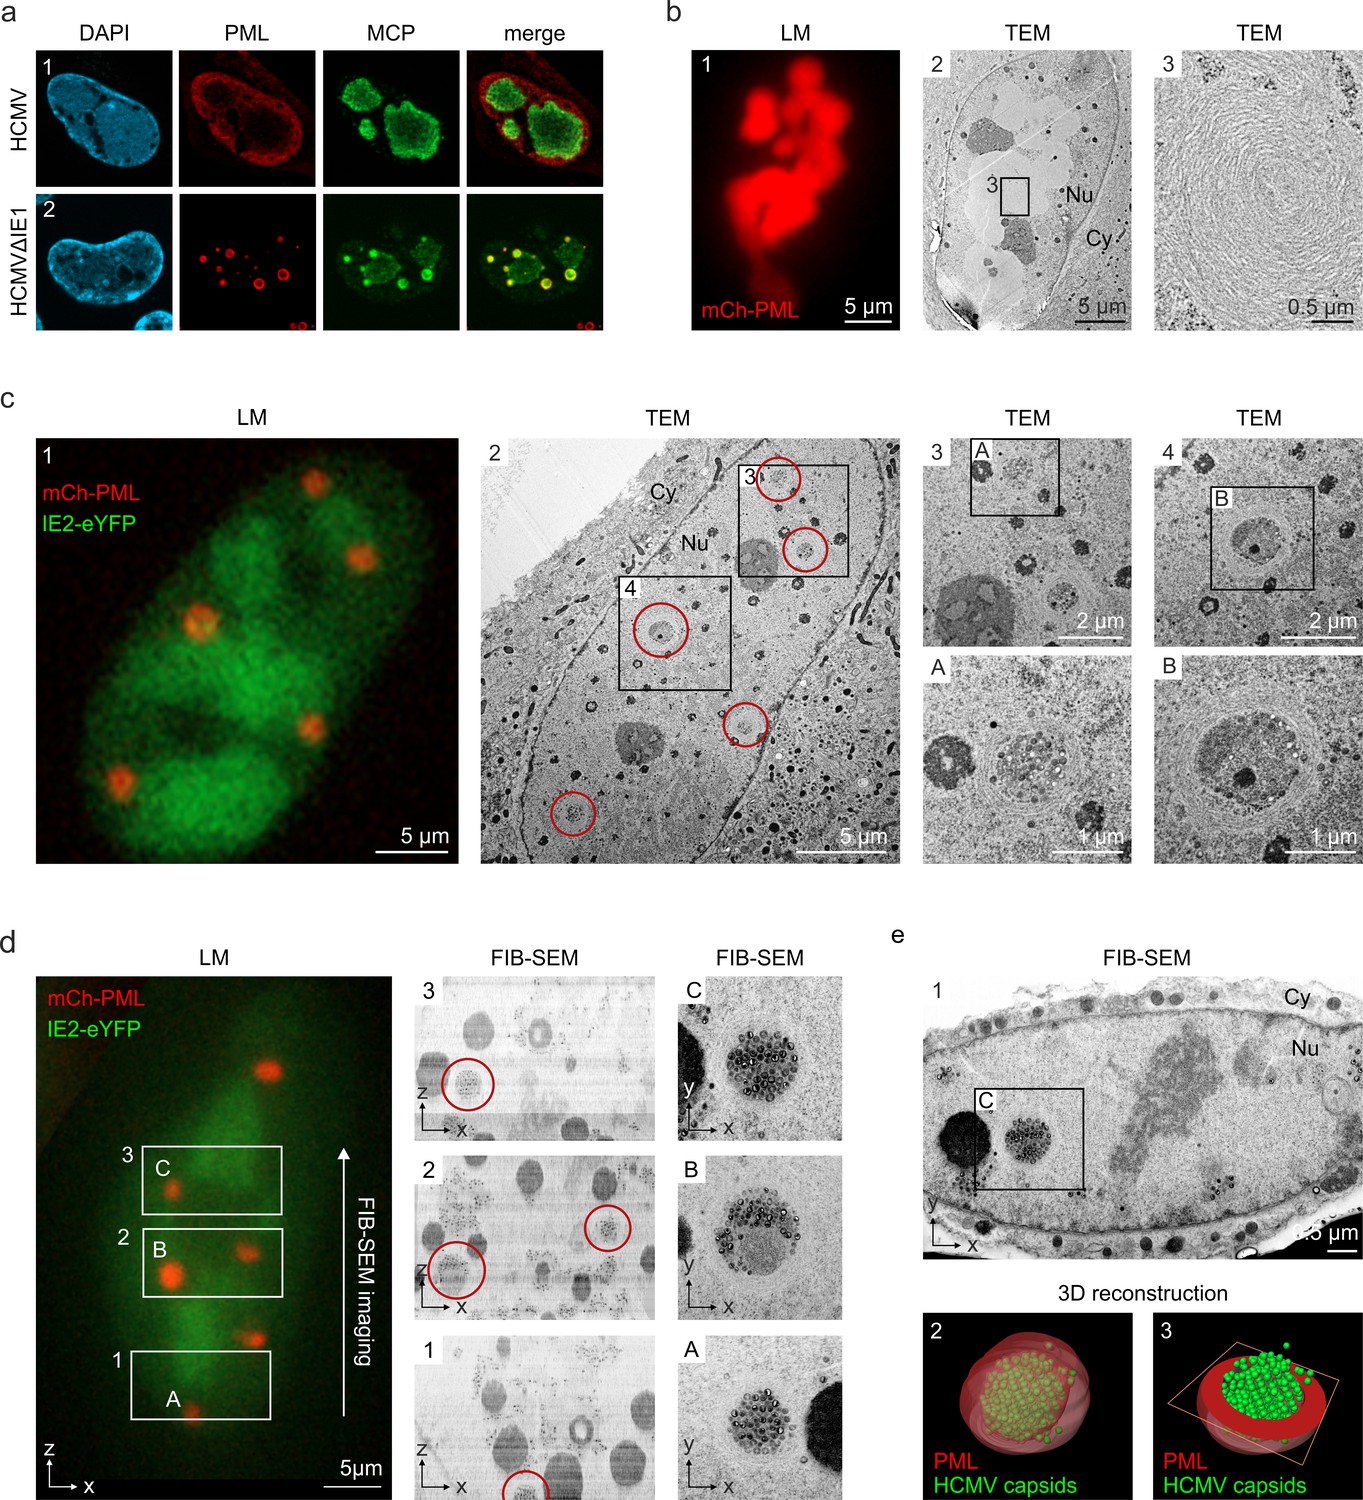
Entrapment of HCMV nuclear capsids by PML cages.
(a) Localization of major capsid protein MCP to PML cages. HFF were infected with HCMV (MOI of 0.5) or HCMVΔIE1 (MOI of 5), based on strain AD169, and harvested at 3 or 6 days after infection, respectively. Endogenous PML and the HCMV protein MCP were detected by immunofluorescence staining; cell nuclei were counterstained with DAPI. (b–e) Visualization of HCMV capsid entrapment in PML cages by correlative light and electron microscopy (CLEM). HFF expressing mCherry-PML were seeded on carbon-patterned sapphire discs and, 1 day later, were infected with a TB40E-based recombinant HCMV lacking IE1 and encoding eYFP-tagged IE2 (MOI >30). 6 days after infection, cells were imaged by fluorescence microscopy (LM) and subjected to EM sample preparation. Selected non-infected (b) or infected (c, d) cells were subsequently analyzed by TEM (b, c) or FIB-SEM tomography (d, see also Video 2). Red circles indicate PML cages that were identified in TEM images (c, panel 2) or in overview pictures generated from aligned FIB-SEM images (d, panels 1–3). (e) 3D reconstruction of a HCMV capsid-containing PML cage. Panel 1: FIB-SEM image from the 2nd imaging series containing the PML cage shown in d, panel C. Panel 2: 3D model showing HCMV capsids in green and surrounding PML in red transparent (see also Video 3). Panel 3: 3D model showing HCMV capsids in green and a cross-section of the PML envelope in red. TEM, transmission electron microscopy; FIB-SEM, focused ion beam-scanning electron microscopy; Nu, nucleus; Cy, cytoplasm.
Figure 7—figure supplement 1
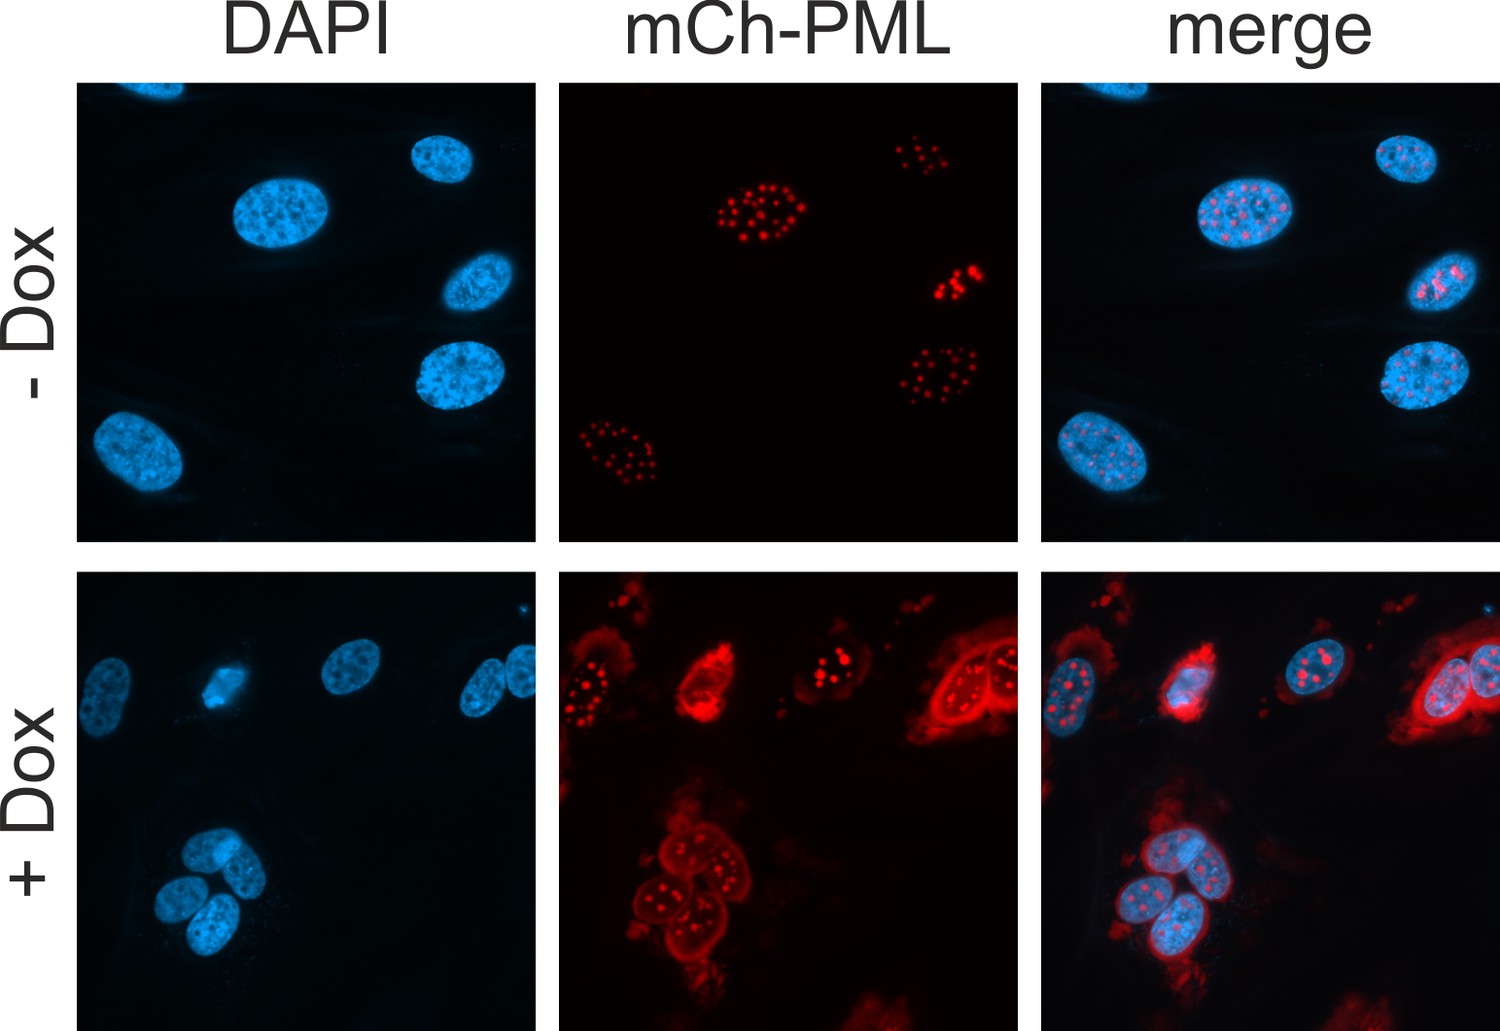
Characterization of HFF with doxycycline-inducible expression of mCherry-PML.
HFF expressing mCherry-tagged PML, isoform VI, were cultured in complete medium containing 10% FCS and were either mock treated (upper panel) of treated with 0.5 µg/ml doxycycline (lower panel). Twenty-four hr later, cells were fixed, stained with DAPI and analyzed for mCherry-PML, which was sufficiently expressed without the addition of doxycycline.
Figure 7—figure supplement 2
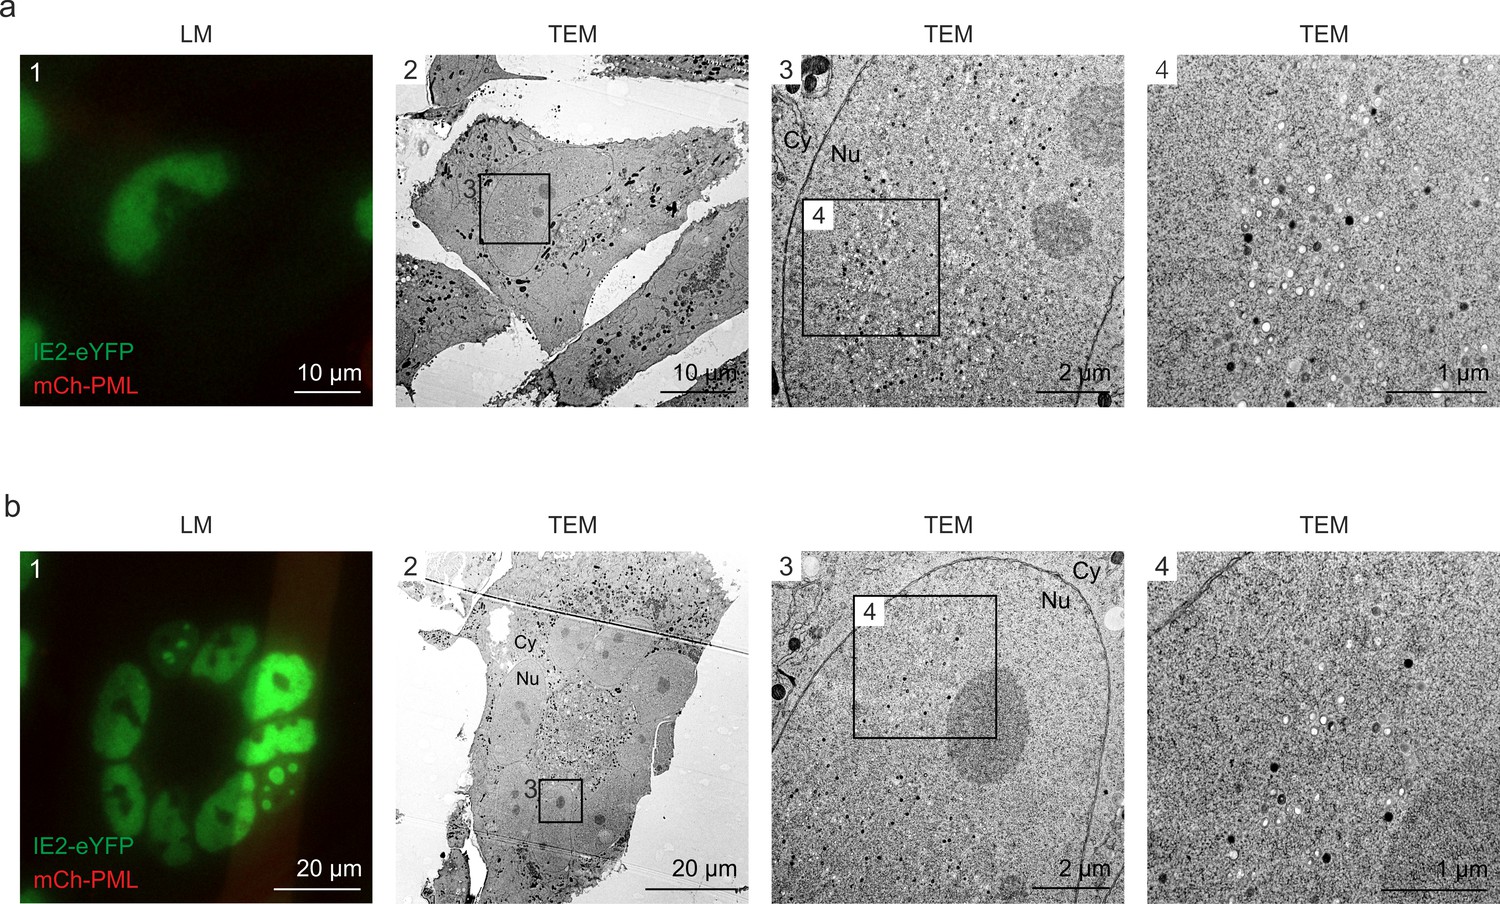
Even distribution of viral capsids in HCMV-IE2eYFP-infected cell nuclei.
For CLEM analysis, HFF expressing mCherry-PML were seeded on carbon-patterned sapphire discs and, 1 day later, were infected with recombinant HCMV encoding IE2-eYFP, based von strain TB40E (MOI of 3). Four days after infection, cells were imaged by fluorescence microscopy (LM) and subjected to EM sample preparation. Selected single cells (a) or syncytia (b) were analyzed by TEM. Due to the disruption of PML foci by HCMV-IE2eYFP and the resulting low signal intensity on carbon-coated sapphire disks, mCherry-PML signals are not visible in LM images. LM, light microscopy; TEM, transmission electron microscopy; Nu, nucleus; Cy, cytoplasm.
Figure 7—figure supplement 3
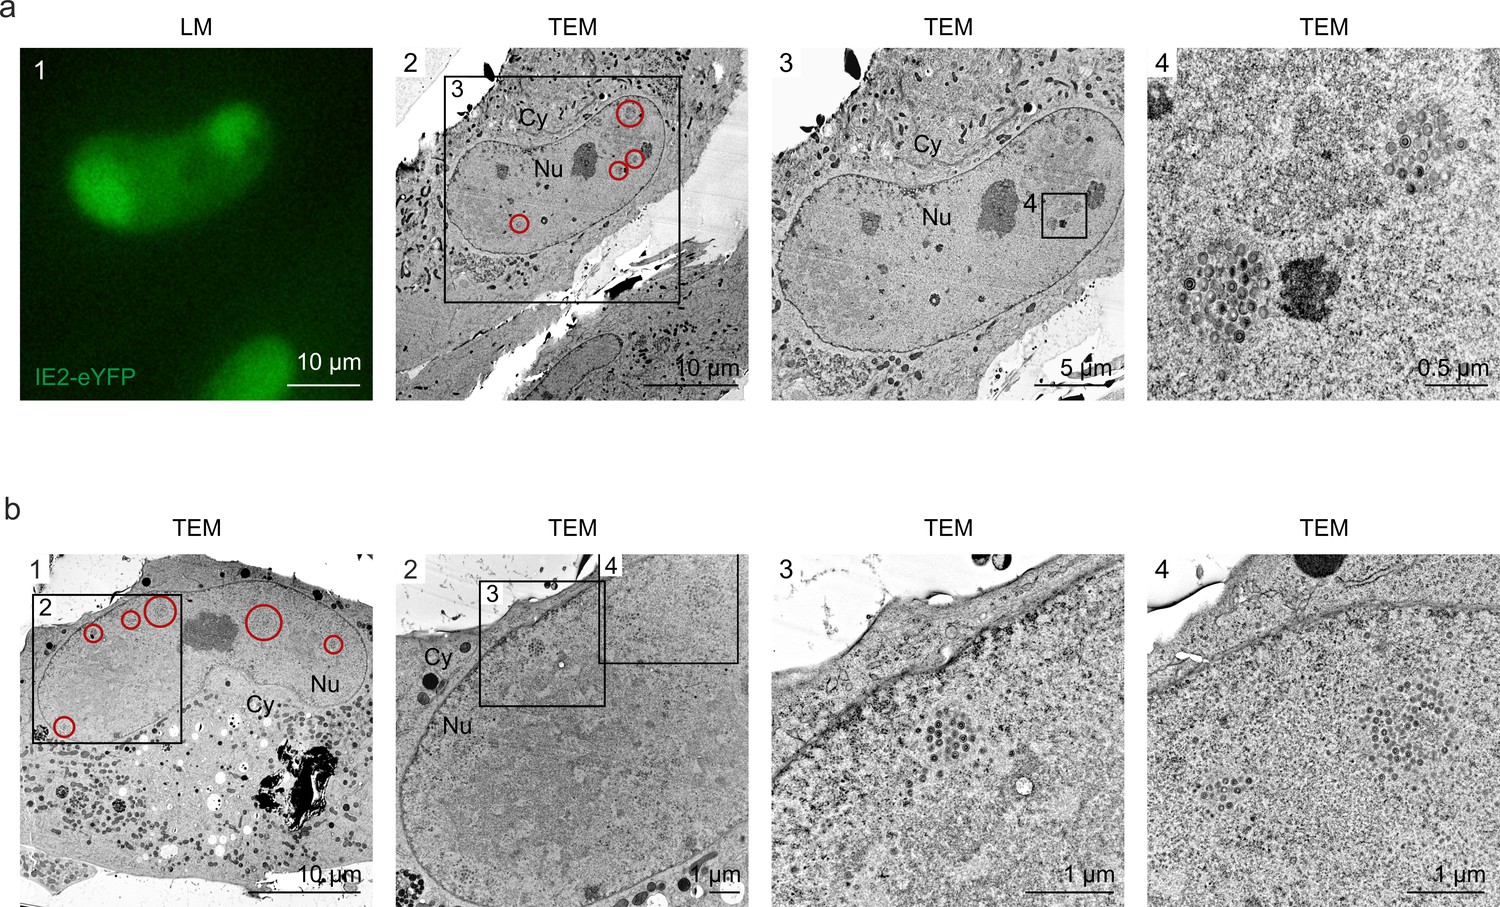
Clustering of viral capsids in HCMV∆IE1-infected cell nuclei.
(a) For CLEM analysis, HFF cells on carbon-patterned sapphire discs were infected with a TB40E-based recombinant HCMV lacking IE1 and encoding IE2-eYFP at a high MOI (MOI >30). 6 days after infection, cells were imaged by fluorescence microscopy (LM) and subsequently analyzed by TEM. Red circles in panel 2 indicate HCMV capsid accumulations in the cell nucleus. (b) HFF cells on sapphire disks were infected HCMV deleted for IE1, based on strain AD169 (MOI of 10). 6 days after infection, cells were subjected to EM sample preparation and subsequently analyzed by TEM. Red circles in panel 1 indicate HCMV capsid accumulations in the cell nucleus. LM, light microscopy; TEM, transmission electron microscopy; Nu, nucleus; Cy, cytoplasm.
Author response image 1
Videos
Video 1
Formation of PML cages after infection with HCMV-IE1-L174P.
3D reconstruction of a cell nucleus after infection with HCMV-IE1-L174P and immunofluorescence staining as described in Figure 1a. The cell nucleus is shown in blue, PML cages in red, and viral replication centers in green.
Video 2
FIB-SEM tomography showing HCMV capsid entrapment by PML cages.
FIB-SEM tomography was applied to analyze three volumes within a mCherry-PML expressing cell that was infected with HCMVΔIE1-IE2eYFP as described in Figure 7d. All regions had the same dimensions (5 µm in z direction) resulting in datasets of 250 subsequent slices with an increment of 20 nm, which were selected and assembled with ImageJ.
Video 3
3D reconstruction of a PML cage containing HCMV capsids.
3D reconstruction of a PML cage within a cell nucleus infected with HCMVΔIE1-IE2eYFP (see Figure 7d and e, panel c). FIB-SEM images containing the PML cage were assembled and cropped using ImageJ, aligned with IMOD, and segmented in Avizo. HCMV capsids are shown in green, the PML envelope is shown in transparent red.
Tables
Key resources table
| Reagent type (species) or resource | Designation | Source or reference | Identifiers | Additional information |
|---|---|---|---|---|
| Strain, strain background (Human cytomegalovirus) | AD169 | Hobom et al., J. Virol. 2000PMID:10933677 | based on BAC HB15 | |
| Strain, strain background (Human cytomegalovirus) | TB40E | Sinzger et al., J. Gen. Virol. 2008PMID:18198366 | based on TB40E-Bac4 | |
| Genetic reagent (Human cytomegalovirus) | AD169ΔIE1 | Scherer et al., J Virol. 2016PMID:26559840 | based on BAC HB15 | |
| Genetic reagent (Human cytomegalovirus) | AD169/IE1-L174P | Scherer et al., J Virol. 2016PMID:26559840 | based on BAC HB15 | |
| Genetic reagent (Human cytomegalovirus) | TB40E-IE2-EYFP | Wagenknecht et al., 2015PMID:26057166 | based on TB40E-Bac4 | |
| Genetic reagent (Human cytomegalovirus) | TB40E-ΔIE1-IE2-EYFP | this paper | Deletion of IE1 from TB40E-IE2-EYFP | |
| Cell line (Homo-sapiens) | U2OS | ATCC | HTB-96 | |
| Cell line (Homo sapiens) | HEK293T | DMSZ | ACC 635 | |
| Antibody | mAb-PML G8 (Mouse monoclonal) | Santa Cruz Biotechnology | Cat# sc-377340 | IF (1:500) |
| Antibody | pAb-PML #4 (Rabbit polyclonal) | Peter Hemmerich, Jena, Germany | IF (1:500) | |
| Antibody | pAb-PML A301-167A (Rabbit polyclonal) | Bethyl Laboratories | Cat# A301-167ARRID: AB_873108 | IF (1:1000),WB (1:5000) |
| Antibody | pAb-PML A301-168A (Rabbit polyclonal) | Bethyl Laboratories | Cat# A301-168ARRID: AB_2284081 | IF (1:1000),WB (1:5000) |
| Antibody | pAb-Sp100 B01 (Mouse polyclonal) | Abnova | Cat# H00006672-B01, RRID:AB_982933 | IF (1:1000) |
| Antibody | pAb-Sp100 GH3 (Rabbit polyclonal) | Hans Will, Hamburg, Germany | WB (1:10000) | |
| Antibody | mAb-Daxx MCA2143 (Mouse monoclonal) | Bio-Rad | Cat# MCA2143, RRID:AB_2088900 | IF (1:400) |
| Antibody | pAb-ATRX H300 (Rabbit polyclonal) | Santa Cruz Biotechnology | sc-15408 (discontinued) | IF (1:500) |
| Antibody | Ab-HP1α 2,616 (Rabbit polyclonal) | Cell Signaling Technology | Cat# 2,616 | IF (1:200) |
| Antibody | pAb-SUMO2/3 ab22654 (Rabbit polyclonal) | Abcam | Cat# ab22654, RRID:AB_2198415 | IF (1:500) |
| Antibody | mAb-SUMO1 (Mouse monoclonal) | Gerrit Praefcke, Langen, Germany | IF (1:100) | |
| Antibody | pAb-phospho-Histone H2A.X 20E3 (Rabbit monoclonal) | Cell Signaling Technology | Cat# 9718, RRID:AB_2118009 | IF (1:500) |
| Antibody | mAB-TRF1 TRF78 (Mouse monoclonal) | Santa Cruz Biotechnology | Cat# sc-56807, RRID:AB_793407 | IF (1:250) |
| Antibody | mAb-IE1 p63-27 (Mouse monoclonal) | Andreoni et al., J. Virol. Methods 1989PMID:2542350 | WB (1:100), IF (1:5) | |
| Antibody | mAb-UL44 BS 510 (Mouse monoclonal) | Plachter et al., Virus Res. 1992PMID:1329369 | WB (1:5000), IF(1:1000) | |
| Antibody | mAb-MCP 28–4 (Mouse monoclonal) | Waldo et al., Lancet 1989PMID:2463443 | WB (1:2), IF (1:2) | |
| Antibody | pAb-IE2 pHM178 (Rabbit polyclonal) | Hofmann et al., J Virol 2000PMID:10684265 | WB (1:5000),IF (1:1500) | |
| Antibody | pAb-UL84 (Rabbit polyclonal) | Hofmann et al., J Virol 2000PMID:10684265 | WB (1:5000),IF (1:1500) | |
| Antibody | anti-FLAG (Mouse monoclonal) | Sigma-Aldrich | Cat# F1804, RRID:AB_262044 | IF (1:1000) |
| Antibody | anti-Myc (Mouse monoclonal) | produced in hybridoma cells, ATCC | MYC 1-9E10.2 [9E10] | WB (1:10), IF (1:2) |
| Antibody | anti-beta-Actin (Mouse monoclonal) | Sigma-Aldrich | Cat# A5441, RRID:AB_476744 | WB (1:10000) |
| Antibody | anti-phospho-STAT2 (Tyr689) | Millipore | Cat# 07–224 | WB (1: 500) |
| Antibody | anti-Interferon-alpha/beta Receptor Chain 2 (Mouse monoclonal) | Millipore | Cat# MAB1155, RRID:AB_2122758 | (5 µg/ml) |
| Recombinant DNA reagent | pLVX-shRNA1 (plasmid) | Clontech | lentiviral construct for stable knockdown | |
| Recombinant DNA reagent | pLVX-shPML (plasmid) | Wagenknecht et al., 2015PMID:26057166 | lentiviral construct for stable knockdown | |
| Recombinant DNA reagent | pLVX-shSp100 (plasmid) | Wagenknecht et al., 2015PMID:26057166 | lentiviral construct for stable knockdown | |
| Recombinant DNA reagent | pLVX-shDaxx (plasmid) | Wagenknecht et al., 2015PMID:26057166 | lentiviral construct for stable knockdown | |
| Recombinant DNA reagent | pLVX-shATRX (plasmid) | this paper | cloning of shRNA directed against ATRX into pLVX-shRNA1 | |
| Recombinant DNA reagent | pLKO-FLAG-PML I to VI (plasmid) | Cuchet et al., J Cell Sci 2011PMID:21172801 | lentiviral constructs for stable expression | |
| Recombinant DNA reagent | pInducer20-CRSmut (plasmid) | Schilling et al., PLoS Pathog. 2021PMID:33770148 | lentiviral construct for inducible expression, mutated cis-repression signal | |
| Recombinant DNA reagent | pInducer20-CRSmut-mCherry-PML VI (plasmid) | this paper | lentiviral construct for inducible expression, mutated cis-repression signal | |
| Recombinant DNA reagent | pLKO-Myc-IE1 (plasmid) | Scherer et al., PLoS Pathog 2014PMID:25412268 | lentiviral construct for stable expression | |
| Recombinant DNA reagent | pLKO-Myc-IE1 1–382 (plasmid) | Scherer et al., PLoS Pathog 2011PMID:26559840 | lentiviral construct for stable expression | |
| Chemical compound, drug | Camptothecin; CPT | Santa Cruz Biotechnology | Cat# sc-200871 | |
| Chemical compound, drug | Doxorubicin hydrochloride; Doxo | Cayman Chemical | Cat# Cay15007 | |
| Chemical compound, drug | ATM inhibitor KU 55933; ATMi | Tocris Bioscience | Cat# 3,544 | |
| Chemical compound, drug | 5-Ethynyl-2′-deoxycytidine; EdC | Sigma-Aldrich | Cat# T511307 | |
| Chemical compound, drug | 5-Ethynyl-2′-deoxyuridine; EdU | Sigma-Aldrich | Cat# 900,584 | |
| Chemical compound, drug | (2′S)–2′-Deoxy-2′-fluoro-5-ethynyluridine; F-ara-EdU | Sigma-Aldrich | Cat# T511293 |
Additional files
-
Supplementary file 1
Sequences of oligonucleotides used in this study.
- https://cdn.elifesciences.org/articles/73006/elife-73006-supp1-v2.docx
-
Transparent reporting form
- https://cdn.elifesciences.org/articles/73006/elife-73006-transrepform1-v2.docx
Download links
A two-part list of links to download the article, or parts of the article, in various formats.
Downloads (link to download the article as PDF)
Open citations (links to open the citations from this article in various online reference manager services)
Cite this article (links to download the citations from this article in formats compatible with various reference manager tools)
Dual signaling via interferon and DNA damage response elicits entrapment by giant PML nuclear bodies
eLife 11:e73006.
https://doi.org/10.7554/eLife.73006


