ExSTED microscopy reveals contrasting functions of dopamine and somatostatin CSF-c neurons along the lamprey central canal
- Department of Applied Physics and Science for Life Laboratory, KTH Royal Institute of Technology, Sweden
- Department of Neuroscience, Karolinska Institutet, Sweden
Figures
Figure 1 with 1 supplement
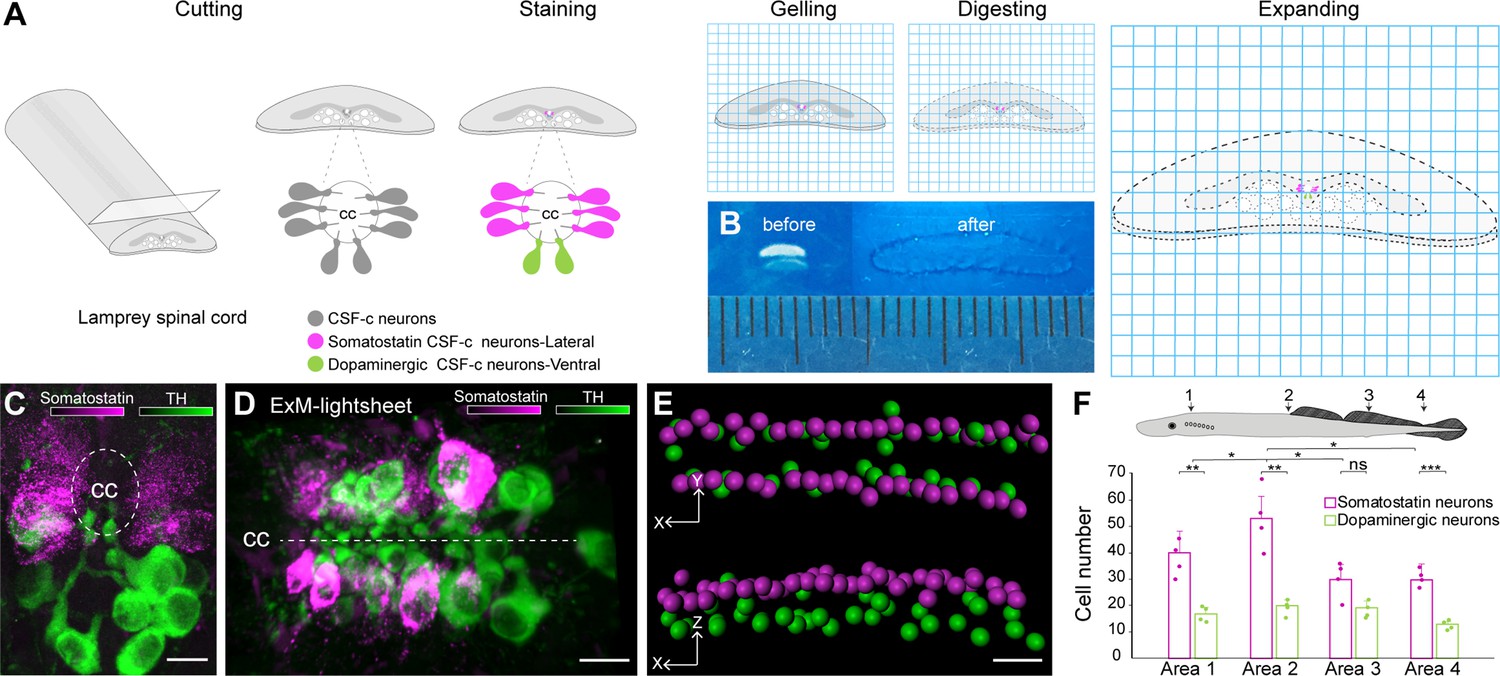
Somatostatin and dopaminergic cerebrospinal fluid-contacting (CSF-c) neurons distribution along the spinal cord by expansion and light-sheet microscopy.
(A) A schematic illustration of the lamprey spinal cord treated for expansion microscopy (ExM). The spinal cords were immunostained for somatostatin and tyrosine hydroxylase (TH) prior to the ExM steps (MA-NHS treatment, gelation, proteinase K treatment, and expansion in water). (B) The spinal cord slices are shown before and after expansion. (C, D) Expanded samples imaged by light-sheet microscopy along the spinal cord. (C) Transverse and (D) horizontal images of somatostatin (magenta) and dopaminergic (green) CSF-c neurons shown by ExM-light-sheet microscopy. Scale bar, 30 µm. (E) Segmentation of the three-dimensional (3D) data from CSF-c neurons. Scale bar, 30 µm. (F) Quantification of somatostatin- and dopamine-expressing CSF-c neurons in four different areas of the spinal cord. The data are represented as the mean of number of cells in volume of each area; the error bar represents SD; Student’s paired t-test: *p ˂ 0.05 significant difference of somatostatin CSF-c neurons area 1 vs area 2 (p = 0.016, t3 = −4.84), area 2 vs area 3 (p = 0.016, t3 = 5.72) and vs area 4 (p = 0.04, t3 = 3.38), **p ˂ 0.01 and ***p ˂ 0.001 significant difference of somatostatin and dopamine CSF-c neurons at area 1 (p = 5.8 × 10⁻³, t3 = 7.06), at area 2 (p = 4 × 10⁻³, t3 = 7.67), at area 4 (p = 7.9 × 10⁻⁴, t3 = 13.9), and non-significant difference (n.s.) at area 3 (p = 0.09, t3 = 2.40). cc, central canal.
-
Figure 1—source data 1
Distribution of somatostatin and dopaminergic cerebrospinal fluid-contacting (CSF-c) neurons along the spinal cord.
Quantification of the somatostatin and dopaminergic CSF-c neurons in four areas (areas 1–4) of spinal cord.
- https://cdn.elifesciences.org/articles/73114/elife-73114-fig1-data1-v1.xlsx
Figure 1—video 1
Three-dimensional (3D) light-sheet with expansion microscopy (ExLSM) explores spatial organization of somatostatin and dopaminergic cerebrospinal fluid-contacting (CSF-c) neurons in the spinal cord.
Z-stack recorded with a light-sheet of an expanded sample of a lamprey spinal cord tissue. The reconstruction highlights the specific location of somatostatin (magenta) and dopamine (green) expressing CSF-c neurons in the 3D architecture along the spinal cord.
Figure 2

Somatostatin and dopamine in cerebrospinal fluid-contacting (CSF-c) neurons are stored in dense-core vesicles.
(A–C) Somatostatin (magenta) and α-tubulin (green) immunostaining in CSF-c neurons. Scale bar in A, 5 µm. (B, C) Selected Region of interest (ROIs) of somatostatin dense-core vesicles (DCVs) in the bulb of somatostatin-expressing CSF-c neurons imaged with confocal and stimulated emission depletion (STED) microscopy, respectively. Scale bar, 500 nm. (D) Analysis of the size of somatostatin DCVs measured with confocal and STED microscopy (n = 46). (E–G) Dopamine (magenta) and phalloidin (green) immunostaining in CSF-c neurons. Scale bar in (E), 5 µm. (F, G) Selected ROIs of dopamine DCVs in the bulb of dopamine CSF-c neurons with confocal and STED microscopy, respectively. Scale bar, 500 nm. (H) Analysis of the size of dopamine DCVs with confocal and STED (n = 44). cc, central canal.
-
Figure 2—source data 1
Somatostatin in cerebrospinal fluid-contacting (CSF-c) neurons store in dense-core vesicles (DCVs).
Analysis of somatostatin DCVs diameter measured with confocal and stimulated emission depletion (STED) microscopy.
- https://cdn.elifesciences.org/articles/73114/elife-73114-fig2-data1-v1.xlsx
-
Figure 2—source data 2
Dopamine in cerebrospinal fluid-contacting (CSF-c) neurons store in dense-core vesicles (DCVs).
Analysis of dopamine DCVs diameter measured with confocal and stimulated emission depletion (STED) microscopy.
- https://cdn.elifesciences.org/articles/73114/elife-73114-fig2-data2-v1.xlsx
Figure 3 with 1 supplement
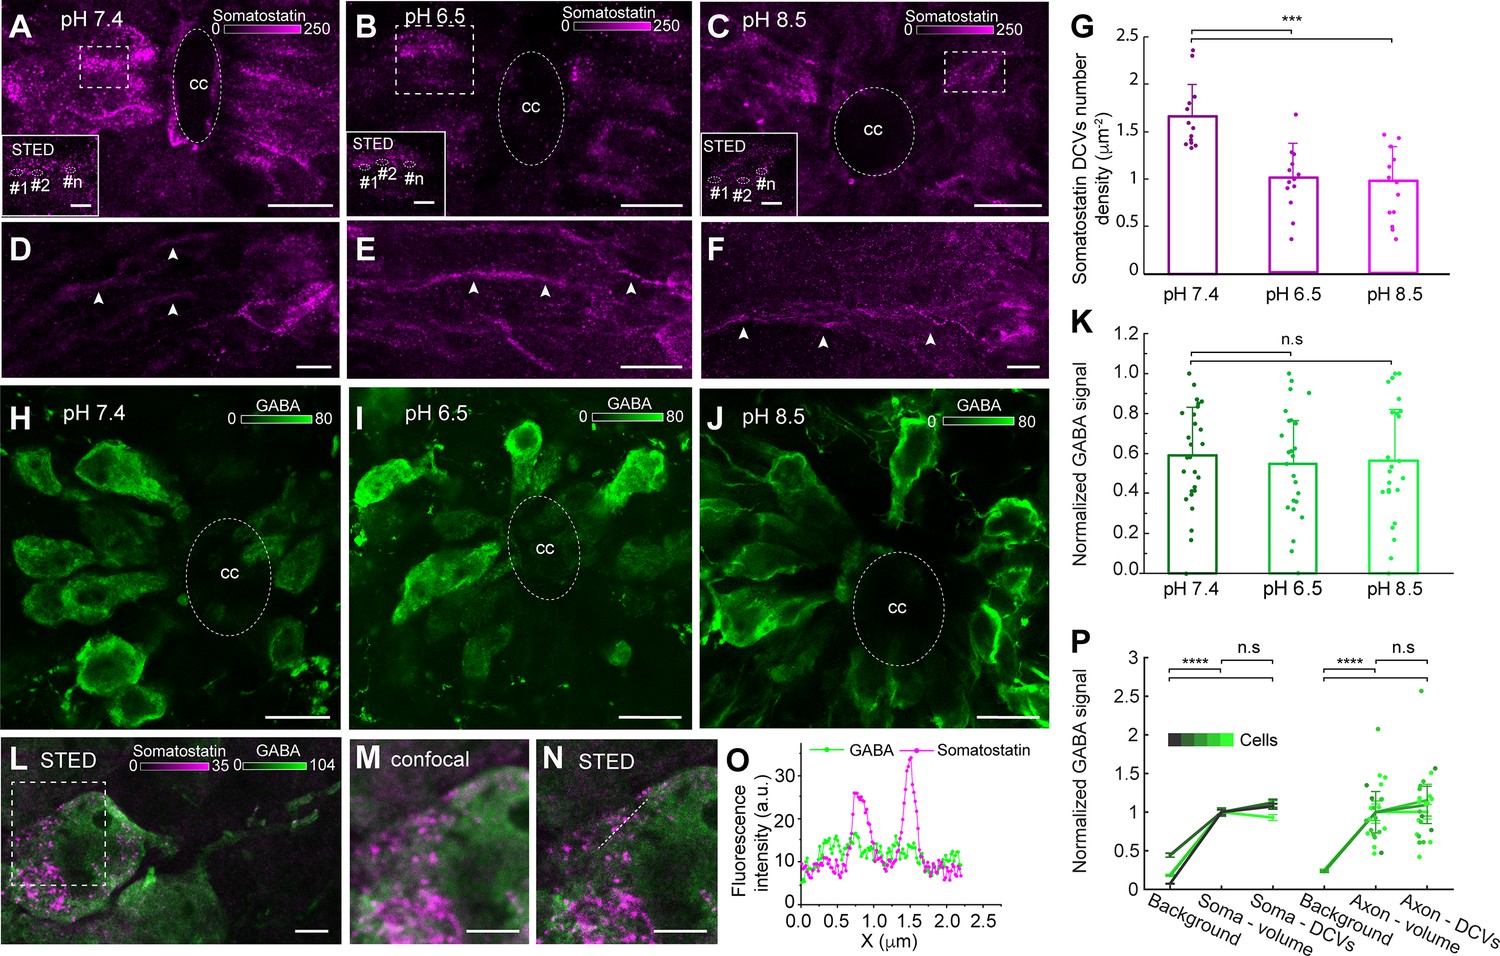
Acidic and alkaline pH decreased the number of somatostatin dense-core vesicles (DCVs) in the soma but did not affect gamma-Aminobutyric acid (GABA) intensity.
(A–F) Spinal cord slices in normal (pH 7.4), acidic (pH 6.5), and alkaline (pH 8.5) extracellular solution stained with an anti-somatostatin antibody (magenta). (A–C) Confocal and stimulated emission depletion (STED) images (selected ROIs) of somatostatin DCVs in the soma. Scale bar in (A–C), 10 µm; in ROIs, 1 µm. (D–F) The axons of the somatostatin-expressing cerebrospinal fluid-contacting (CSF-c) neurons (arrowheads). Scale bar, 10 µm. (G) Quantification of somatostatin DCVs number density in cell area (µm−2) in the different conditions (n = 13). Student’s paired t-test: ***p ˂ 0.001 significant difference between pH 7.4 and 6.5 (p = 5.26 × 10⁻⁵, t12 = 4.9), and 7.4 and 8.5 (p = 1.79 × 10⁻⁵, t12 = 5.3). (H–J) The spinal cord slices in normal, acidic and alkaline extracellular solution, stained with an anti-GABA antibody (green). Scale bar, 10 µm. (K) Comparison of normalized GABA signals at pH 7.4 (n = 26), 6.5 (n = 24), and 8.5 (n = 22), respectively. Student’s t-test: non-significant difference (n.s.) between pH 7.4 and 6.5 (p = 0.62, t47 = 0.48), and 7.4 and 8.5 (p = 0.80, t43 = 0.25). (L–O) STED and confocal images of spinal cord slices stained for somatostatin (magenta) and GABA (green). (L) STED image of a CSF-c neuron. Scale bar, 1 µm. (M, N) Selected ROI from the soma in (l) shown at higher magnification with confocal and STED microscopy, respectively. Scale bar, 1 µm. (O) Line profile graph in image N. (P) Mean GABA signal in cellular compartments and compared to extracellular background (n = 5), normalized to volume intensity in soma (n = 5) and axons (n = 3), respectively. Repetitions are different cells. Student’s t-test between means of cellular means: ****p < 0.0001 significant difference between soma-volume and background (p = 1.0 × 10⁻⁵, t8 = −9.7), soma-DCVs and background (p = 1.0 × 10⁻⁵, t8 = −9.6), axon-volume and background (p = 8.0 × 10⁻⁸, t4 = −93), and axon-DCVs and background (p = 4.4 × 10⁻⁵, t4 = −19), non-significant differences (n.s.) between soma-volume and DCVs (p = 0.090, t8 = −1.9), and axon-volume and DCVs (p = 0.12, t4 = 1.9). Data (G, K, P) are represented as means, with error bars representing standard deviation (SD) (G, K) or standard error of the mean (SEM) (P). cc, central canal.
-
Figure 3—source data 1
Effect of acidic or alkaline pH on somatostatin dense-core vesicles (DCVs) number density in cell area of somatostatin-expressing cerebrospinal fluid-contacting (CSF-c) neurons.
Quantification of somatostatin DCVs number density in cell area of somatostatin-expressing CSF-c neurons (µm–2) in the different pH.
- https://cdn.elifesciences.org/articles/73114/elife-73114-fig3-data1-v1.xlsx
-
Figure 3—source data 2
Effect of acidic or alkaline pH on GABA signal in somatostatin-expressing cerebrospinal fluid-contacting (CSF-c) neurons.
Analysis of the GABA intensity signal in somatostatin-expressing CSF-c neurons in the different pH.
- https://cdn.elifesciences.org/articles/73114/elife-73114-fig3-data2-v1.xlsx
-
Figure 3—source data 3
No correlation between GABA and somatostatin signals in somatostatin-expressing cerebrospinal fluid-contacting (CSF-c) neurons.
Analysis of GABA signal in and outside of somatostatin dense-core vesicles (DCVs) in soma and axon of somatostatin-expressing CSF-c neurons.
- https://cdn.elifesciences.org/articles/73114/elife-73114-fig3-data3-v1.xlsx
Figure 3—figure supplement 1
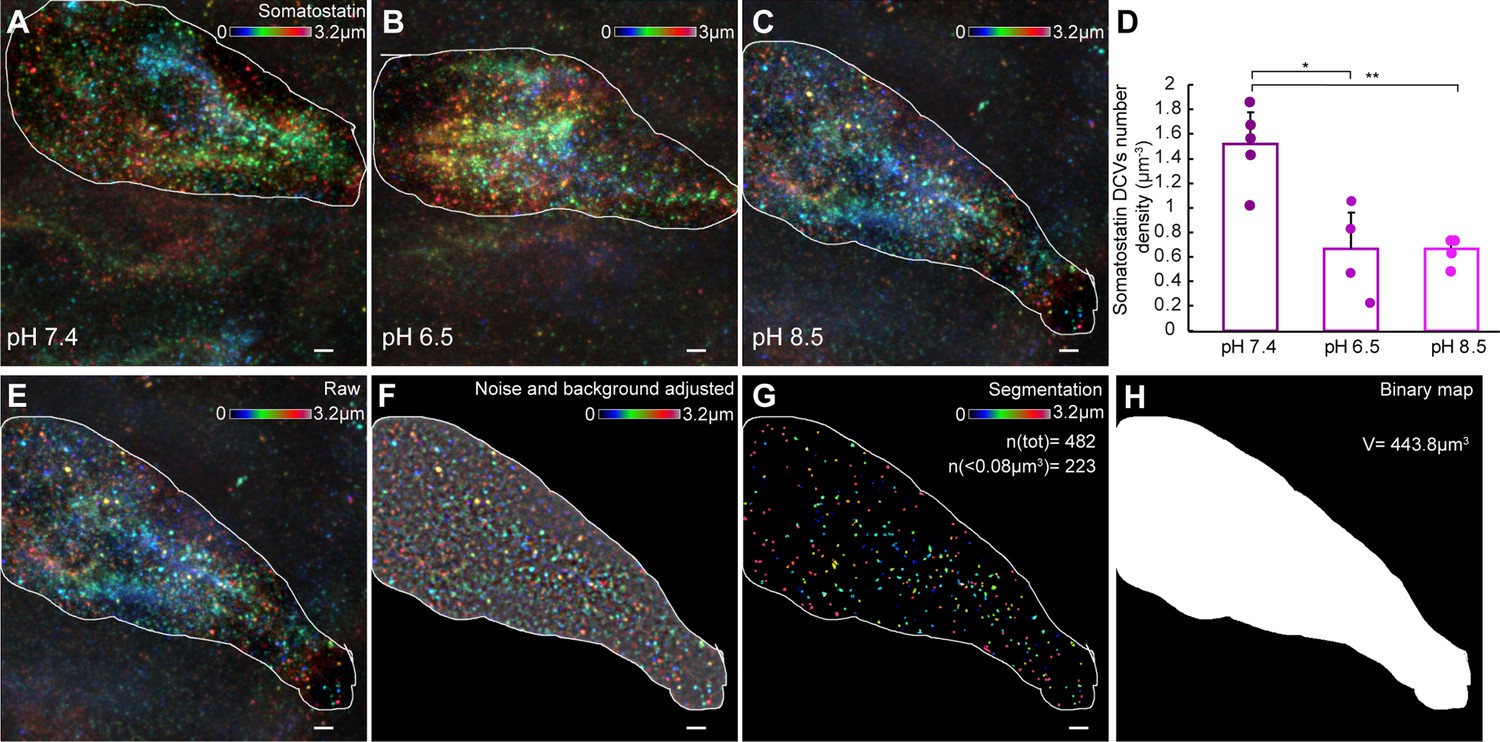
Effect of acidic or alkaline pH on somatostatin dense-core vesicles (DCVs) number density in cell volume of somatostatin-expressing cerebrospinal fluid-contacting (CSF-c) neurons.
(A–C) Representative volumetric imaging of somatostatin DCVs in the soma of the identified cell, shown as an axially colour-coded projection in the different conditions (n = 5, pH 7.4; n = 4, pH 6.5; n = 4, pH 8.5). (D) Quantification of the somatostatin DCVs number density in cell volume (µm−3) in the different conditions (n = 5, pH 7.4; n = 4, pH 6.5; n = 4, pH 8.5). Student’s paired t-test: *p ˂ 0.05 and **p ˂ 0.01 significant difference between pH 7.4 and 6.5 (p = 0.011, t6 = 2.44), and 7.4 and 8.5 (p = 0.002, t5 = 2.57). (E–H) Workflow of the analysis: raw image where the cell soma is selected. (E) Processed image after noise and background filtering. (F) Vesicle segmentation. (G) Binary map used to measure the cell soma-volume (H). Scale bar, 1 µm.
-
Figure 3—figure supplement 1—source data 1
Effect of acidic or alkaline pH on somatostatin dense-core vesicles (DCVs) number density in cell volume of somatostatin-expressing cerebrospinal fluid-contacting (CSF-c) neurons.
Quantification of somatostatin DCVs number density in cell volume (µm–3) of somatostatin-expressing CSF-c neurons in the different pH.
- https://cdn.elifesciences.org/articles/73114/elife-73114-fig3-figsupp1-data1-v1.xlsx
Figure 4 with 2 supplements
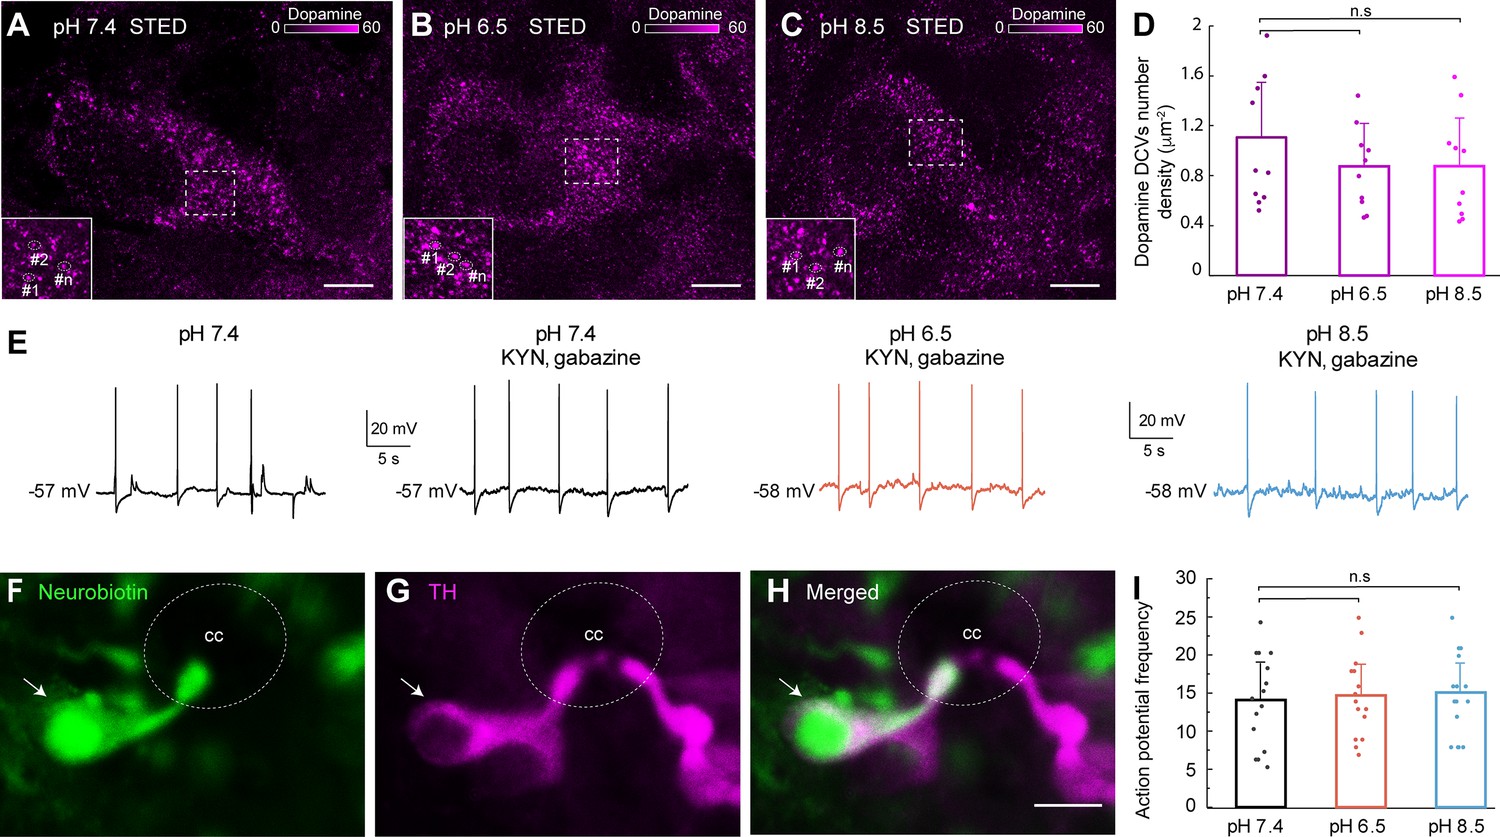
Dopaminergic cerebrospinal fluid-contacting (CSF-c) neurons did not respond to acidic and alkaline pH.
(A–C) Stimulated emission depletion (STED) images of dopamine-containing dense-core vesicles (DCVs) in the soma of CSF-c neurons in normal (pH 7.4), acidic (pH 6.5), and alkaline (pH 8.5) extracellular solution. Scale bar, 1 µm. (D) Quantification of the number of dopamine DCVs number density in cell area (µm−2) in the different conditions (n = 10). Student’s t-test: non-significant (n.s.) between pH 7.4 and 6.5 (p = 0.27, t9 = 1.12), and 7.4 and 8.5 (p = 0.29, t9 = 1.08). (E) Whole-cell patch recording of a CSF-c neuron, showing firing spontaneous action potentials in control (pH 7.4), acidic (p H 6.5), and alkaline (pH 8.5) conditions in the presence of gabazine (20 mM) and kynurenic acid (2 mM). (F–H) Photomicrographs of the CSF-c neurons recorded in (E) intracellularly filled with Neurobiotin (arrow) during recording. The labelled cell showed immunoreactivity to tyrosine hydroxylase (TH, arrow). Scale bar, 10 µm. (I) Action potential frequency during 1 min in CSF-c neurons at pH 7.4, 6.5, and 6.8, respectively (n = 15). Student’s paired t-test: non-significant difference (n.s.) between pH 7.4 and 6.5 (p = 0.24, t14 = −1.22), and 7.4 and 8.5 (p = 0.1, t14 = −1.75). The bar graph data are represented as the means, with error bars representing standard deviation (SD). cc, central canal.
-
Figure 4—source data 1
Effect of acidic or alkaline pH on dopamine dense-core vesicles (DCVs) number density in cell area of dopaminergic cerebrospinal fluid-contacting (CSF-c) neurons.
Quantification of dopamine DCVs number density in cell area (µm−2) in dopaminergic CSF-c neurons in the different pH.
- https://cdn.elifesciences.org/articles/73114/elife-73114-fig4-data1-v1.xlsx
-
Figure 4—source data 2
Effect of acidic and alkaline pH on action potential frequency in dopaminergic cerebrospinal fluid-contacting (CSF-c) neurons.
Quantification of action potential frequency in dopaminergic CSF-c neurons at different pH conditions during 1 min.
- https://cdn.elifesciences.org/articles/73114/elife-73114-fig4-data2-v1.xlsx
Figure 4—figure supplement 1
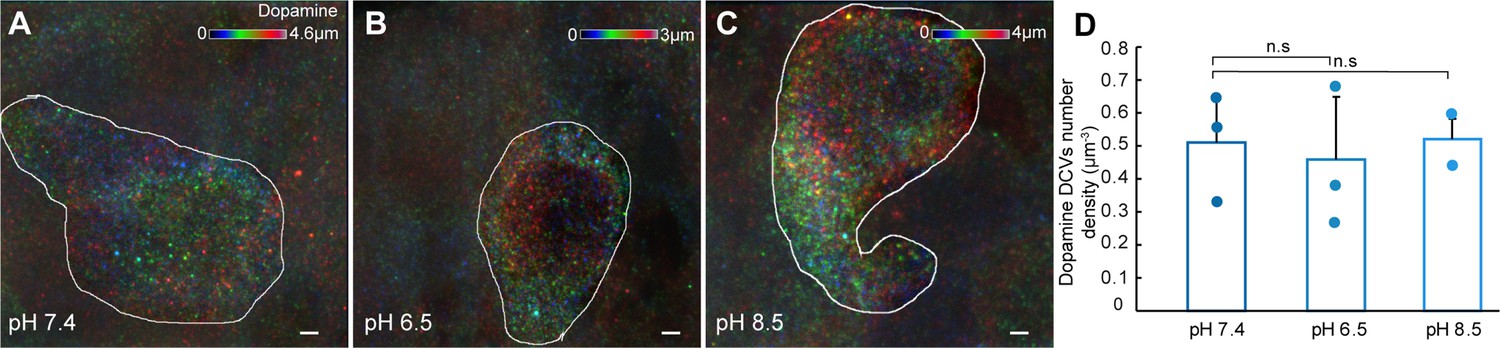
Effect of acidic or alkaline pH on dopamine dense-core vesicles (DCVs) number density in cell volume of dopaminergic cerebrospinal fluid-contacting (CSF-c) neurons.
(A–C) Representative volumetric imaging of dopamine DCVs in the soma of the identified cell, shown as an axially colour-coded projection in the different conditions (n = 3, pH 7.4; n = 3, pH 6.5; n = 2, pH 8.5). (D) Quantification of the dopamine DCVs number density (µm−3) in the different conditions (n = 3, pH 7.4; n = 3, pH 6.5; n = 2, pH 8.5). Student’s paired t-test: non-significant difference (n.s.) between pH 7.4 and 6.5 (p = 0.77, t4 = 2.77), and 7.4 and 8.5 (p = 0.93, t3 = 3.18). Scale bar, 1 µm.
-
Figure 4—figure supplement 1—source data 1
Effect of acidic or alkaline pH on dopamine dense-core vesicles (DCVs) number density in the cell volume of dopaminergic cerebrospinal fluid-contacting (CSF-c) neurons.
Quantification of dopamine DCVs number density in cell volume (µm−3) of dopaminergic CSF-c neurons in the different pH conditions.
- https://cdn.elifesciences.org/articles/73114/elife-73114-fig4-figsupp1-data1-v1.xlsx
Figure 4—figure supplement 2
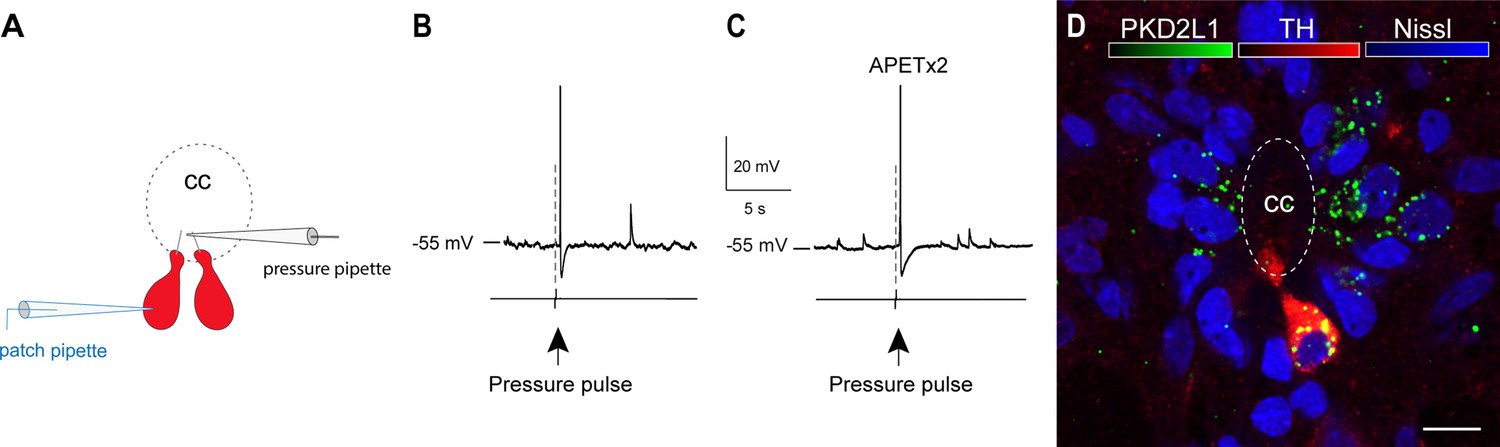
Dopaminergic cerebrospinal fluid-contacting (CSF-c) neurons are sensitive to fluid movement.
(A) A schematic illustration showing a dopaminergic CSF-c neuron (red) was patched and a pressure pipette was placed close to its bulb-like ending. (B) A short pressure pulse (20 p.s.i., 80 ms) elicited action potential responses in a dopaminergic CSF-c neuron. (C) Elicited action potential responses in a dopaminergic CSF-c neuron by pressure pulse in present of the acid-sensing ion channel 3 (ASIC3) blocker APETx2 (2 µM). (D) In situ hybridization image showing ventrally located CSF-c neurons co-expressing the polycystic kidney disease 2-like 1 (PKD2L1) channel (green), tyrosine hydroxylase (TH, red), and Nissl (blue). Scale bar, 10 µm. cc, central canal.
Figure 5 with 3 supplements

Primary and motile cilia symmetry are present in the lamprey spinal cord.
(A, B) Confocal and stimulated emission depletion (STED) images of a cerebrospinal fluid-contacting (CSF-c) neuron cilium in a non-expanded spinal cord pre-stained with anti-α-tubulin antibodies. Scale bar, 0.5 µm. (C, D) Confocal (expansion microscopy, ExM) and STED (ExSTED) images of a cilium in the expanded spinal cord. Scale bar, 0.5 µm. (E, F) Quantification of the cilium diameter (arrowheads) in confocal and STED images in a non-expanded spinal cord. (G, H) Quantification of the cilium diameter (arrowheads) in confocal (ExM) and STED (ExSTED) in the expanded spinal cord. (I–M) Confocal (ExM, I, J) and STED (ExSTED, K, L) deconvoluted images of a primary cilium with 9 + 0 symmetry in the expanded spinal cord. Scale bar, I, 2 µm and J–L, 1 µm. (M) Quantification of the cilium diameter from image (l) (arrowheads). (N–R) Confocal (ExM, N, O) and STED (ExSTED, P, Q) deconvoluted images of a motile cilium with 9 + 2 symmetry in the expanded spinal cord. Scale bar, N, 2 µm and O–Q, 1 µm. (R) Quantification of the cilium diameter from image (Q) (arrowheads). Cilia diameters in blue were divided by the expansion factor.
-
Figure 5—source data 1
Quantification of a cilium diameter of cerebrospinal fluid-contacting (CSF-c) neuron with confocal microscopy in non-expanded spinal cord.
- https://cdn.elifesciences.org/articles/73114/elife-73114-fig5-data1-v1.xlsx
-
Figure 5—source data 2
Quantification of a cilium diameter of cerebrospinal fluid-contacting (CSF-c) neuron with stimulated emission depletion (STED) microscopy in non-expanded spinal cord.
- https://cdn.elifesciences.org/articles/73114/elife-73114-fig5-data2-v1.xlsx
-
Figure 5—source data 3
Quantification of a cilium diameter of cerebrospinal fluid-contacting (CSF-c) neuron with confocal microscopy in expanded spinal cord (expansion microscopy, ExM).
- https://cdn.elifesciences.org/articles/73114/elife-73114-fig5-data3-v1.xlsx
-
Figure 5—source data 4
Quantification of a cilia diameter of cerebrospinal fluid-contacting (CSF-c) neuron with stimulated emission depletion (STED) microscopy in expanded spinal cord (ExSTED).
- https://cdn.elifesciences.org/articles/73114/elife-73114-fig5-data4-v1.xlsx
-
Figure 5—source data 5
Quantification of a primary cilium diameter of cerebrospinal fluid-contacting (CSF-c) neuron with 9 + 0 symmetry with stimulated emission depletion (STED) microscopy in expanded spinal cord (ExSTED).
- https://cdn.elifesciences.org/articles/73114/elife-73114-fig5-data5-v1.xlsx
-
Figure 5—source data 6
Quantification of a motile cilium diameter of cerebrospinal fluid-contacting (CSF-c) neuron with 9 + 2 symmetry with stimulated emission depletion (STED) microscopy in expanded spinal cord (ExSTED).
- https://cdn.elifesciences.org/articles/73114/elife-73114-fig5-data6-v1.xlsx
Figure 5—figure supplement 1
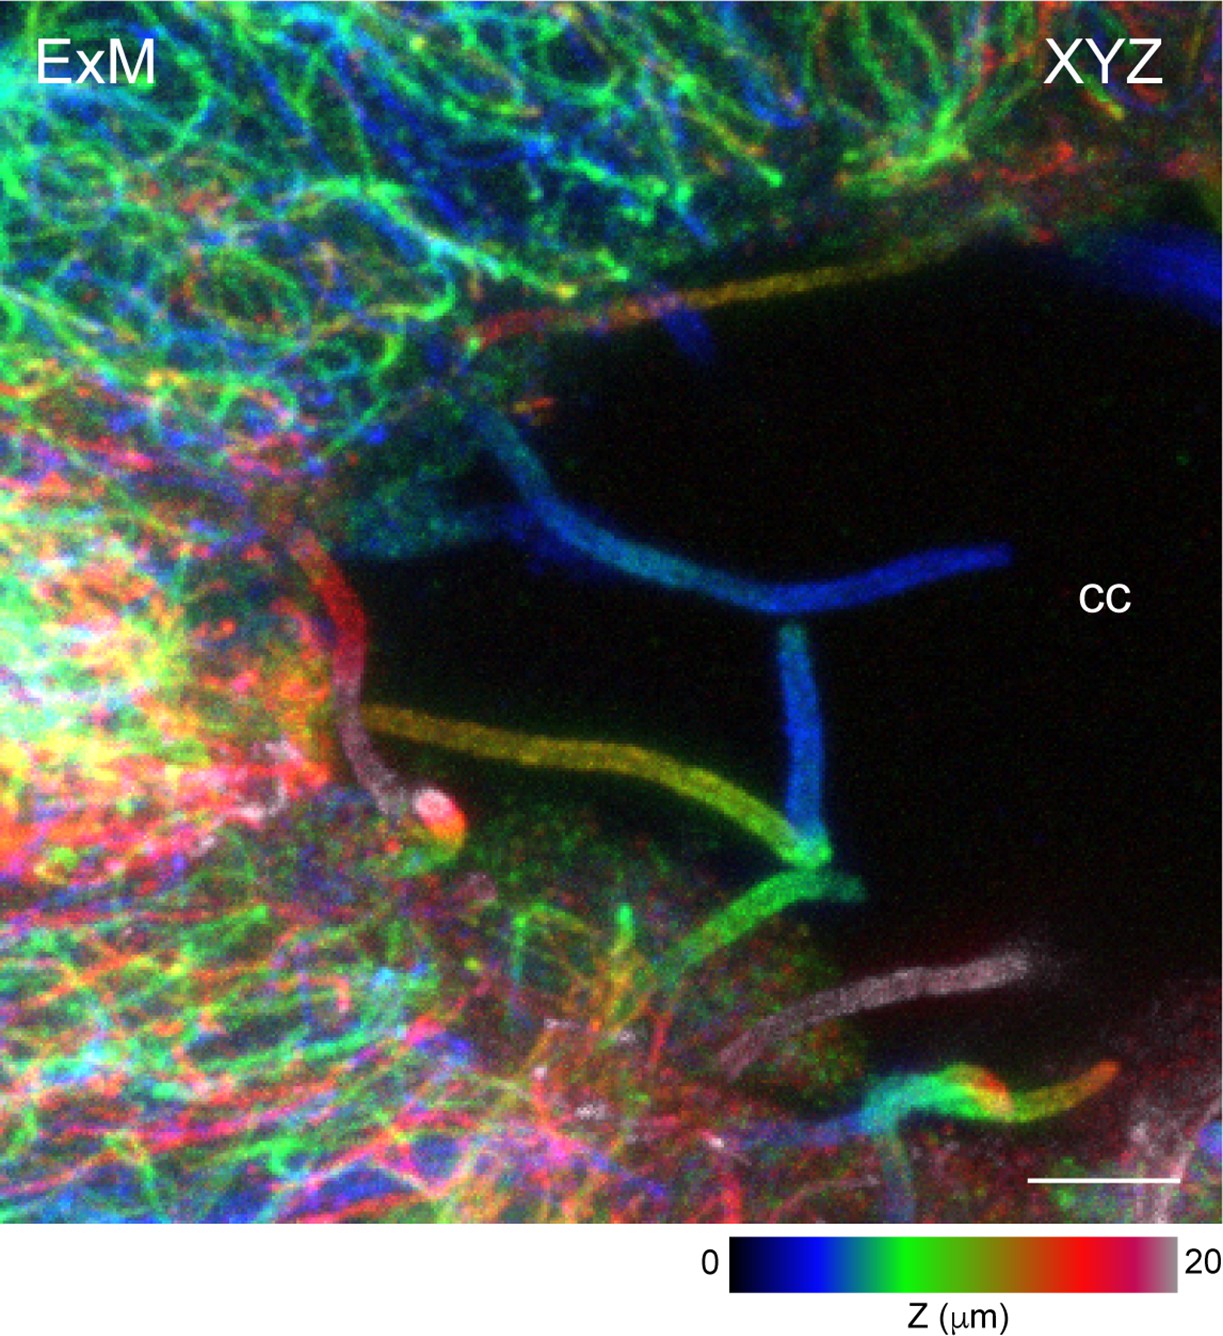
Three-dimensional (3D) expansion microscopy (ExM) of expanded cilia protruding to the central canal.
Representative volumetric imaging of expanded cilia (stained with α-tubulin) protruding into the central canal from cerebrospinal fluid-contacting (CSF-c) neurons, shown as an axially colour-coded projection. Scale bar, 5 µm. cc, central canal.
Figure 5—figure supplement 2
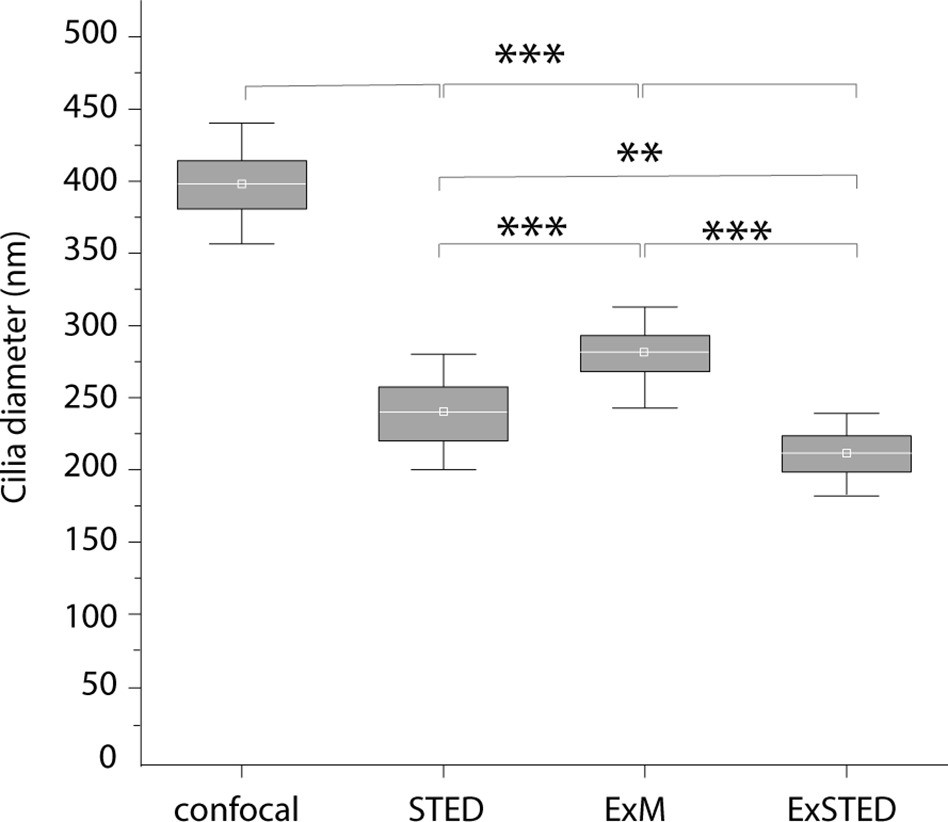
Cilia diameter with different techniques: Box plot representation of cilia diameters, measured in the different conditions, confocal, stimulated emission depletion (STED), expansion microscopy (ExM), and ExSTED.
Averages and ± SD are 402 ± 25, 240 ± 20, 266 ± 17, and 218 ± 18 nm, respectively. Student’s paired t-test: ***p < 0.001 significant difference between cilia diameter in confocal and ExSTED (p = 2.8 × 10⁻²⁴, t19 = 24.8), and ExM and ExSTED (p = 1.32 × 10⁻⁹, t19 = 8.08), STED and ExM (p = 2.8 × 10⁻⁴, t19 = –4,02), **p < 0.01 significant difference between cilia diameter in STED and ExSTED (p = 1.7 × 10⁻³, t18 = 3.38).
-
Figure 5—figure supplement 2—source data 1
Cilia diameters measured in cerebrospinal fluid-contacting (CSF-c) neurons with the different techniques: confocal, stimulated emission depletion (STED), expansion microscopy (ExM), and ExSTED microscopy.
- https://cdn.elifesciences.org/articles/73114/elife-73114-fig5-figsupp2-data1-v1.xlsx
Figure 5—video 1
Three-dimensional (3D) ExSTED visualizes cerebrospinal fluid-contacting (CSF-c) neurons and their cilia within the 3D geometry of the central canal.
Z-stack recorded with stimulated emission depletion (STED) of an expanded lamprey spinal cord tissue showing cilia (stained with α-tubulin) protrusion to central canal from CSF-c neurons with high resolution.
Figure 6 with 1 supplement
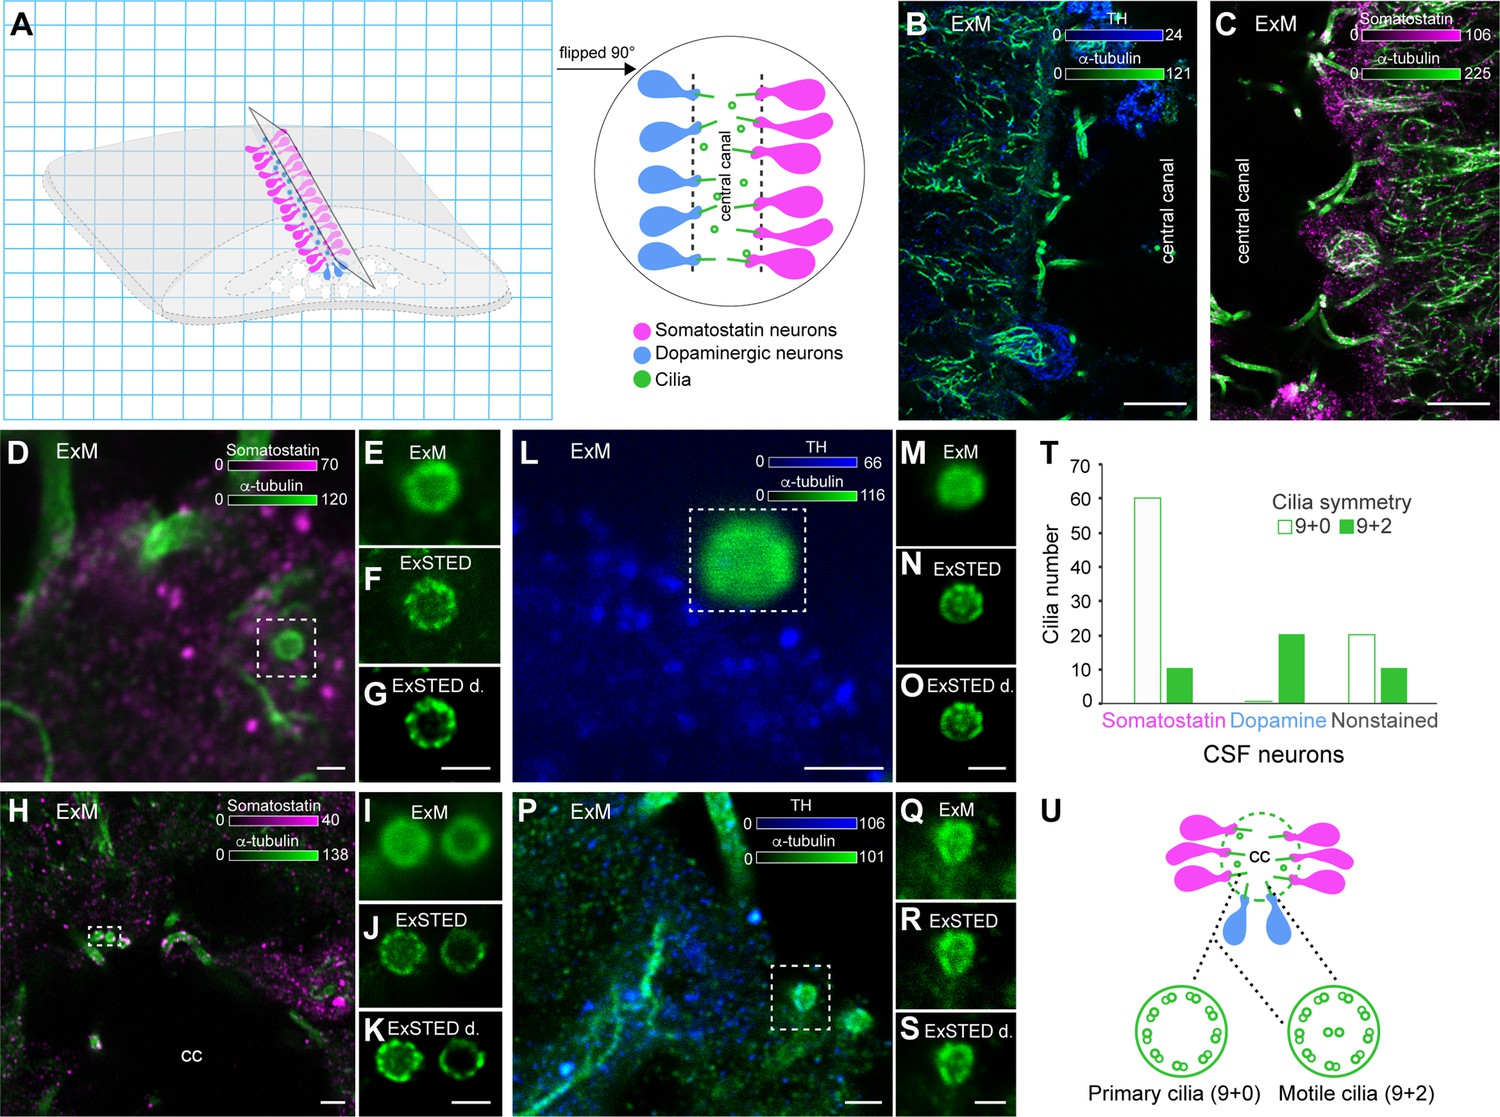
Cilia symmetries in somatostatin and dopaminergic cerebrospinal fluid-contacting (CSF-c) neurons.
(A) A schematic illustration of an expanded spinal cord stained for somatostatin (magenta), dopamine (blue), and α-tubulin (green). The gel was cut through the central canal and flipped 90° on the side on the coverslip. (B, C) Longitudinal images of the expanded spinal cord (expansion microscopy, ExM) stained with α-tubulin, TH, and somatostatin antibodies, respectively. Scale bar, 10 µm. (D–K) ExM and ExSTED images of two somatostatin CSF-c neurons with their cilia. Scale bar, D, 1 µm and H, 3 µm. (F, G) showing 9 + 0 symmetry and (J, K) showing both 9 + 0 and 9 + 2 symmetries. Scale bar, 1 µm. (L–S) ExM and ExSTED images of two dopaminergic CSF-c neurons (TH staining) with 9 + 2 symmetry. Scale bar, L–O, Q–S, 1 µm and P, 2 µm. (T) Quantification of cilium types in somatostatin and dopaminergic CSF-c neurons. (U) A schematic illustration of the central canal with somatostatin and dopaminergic CSF-c neurons and their possible cilia symmetries. cc, central canal.
Figure 6—figure supplement 1
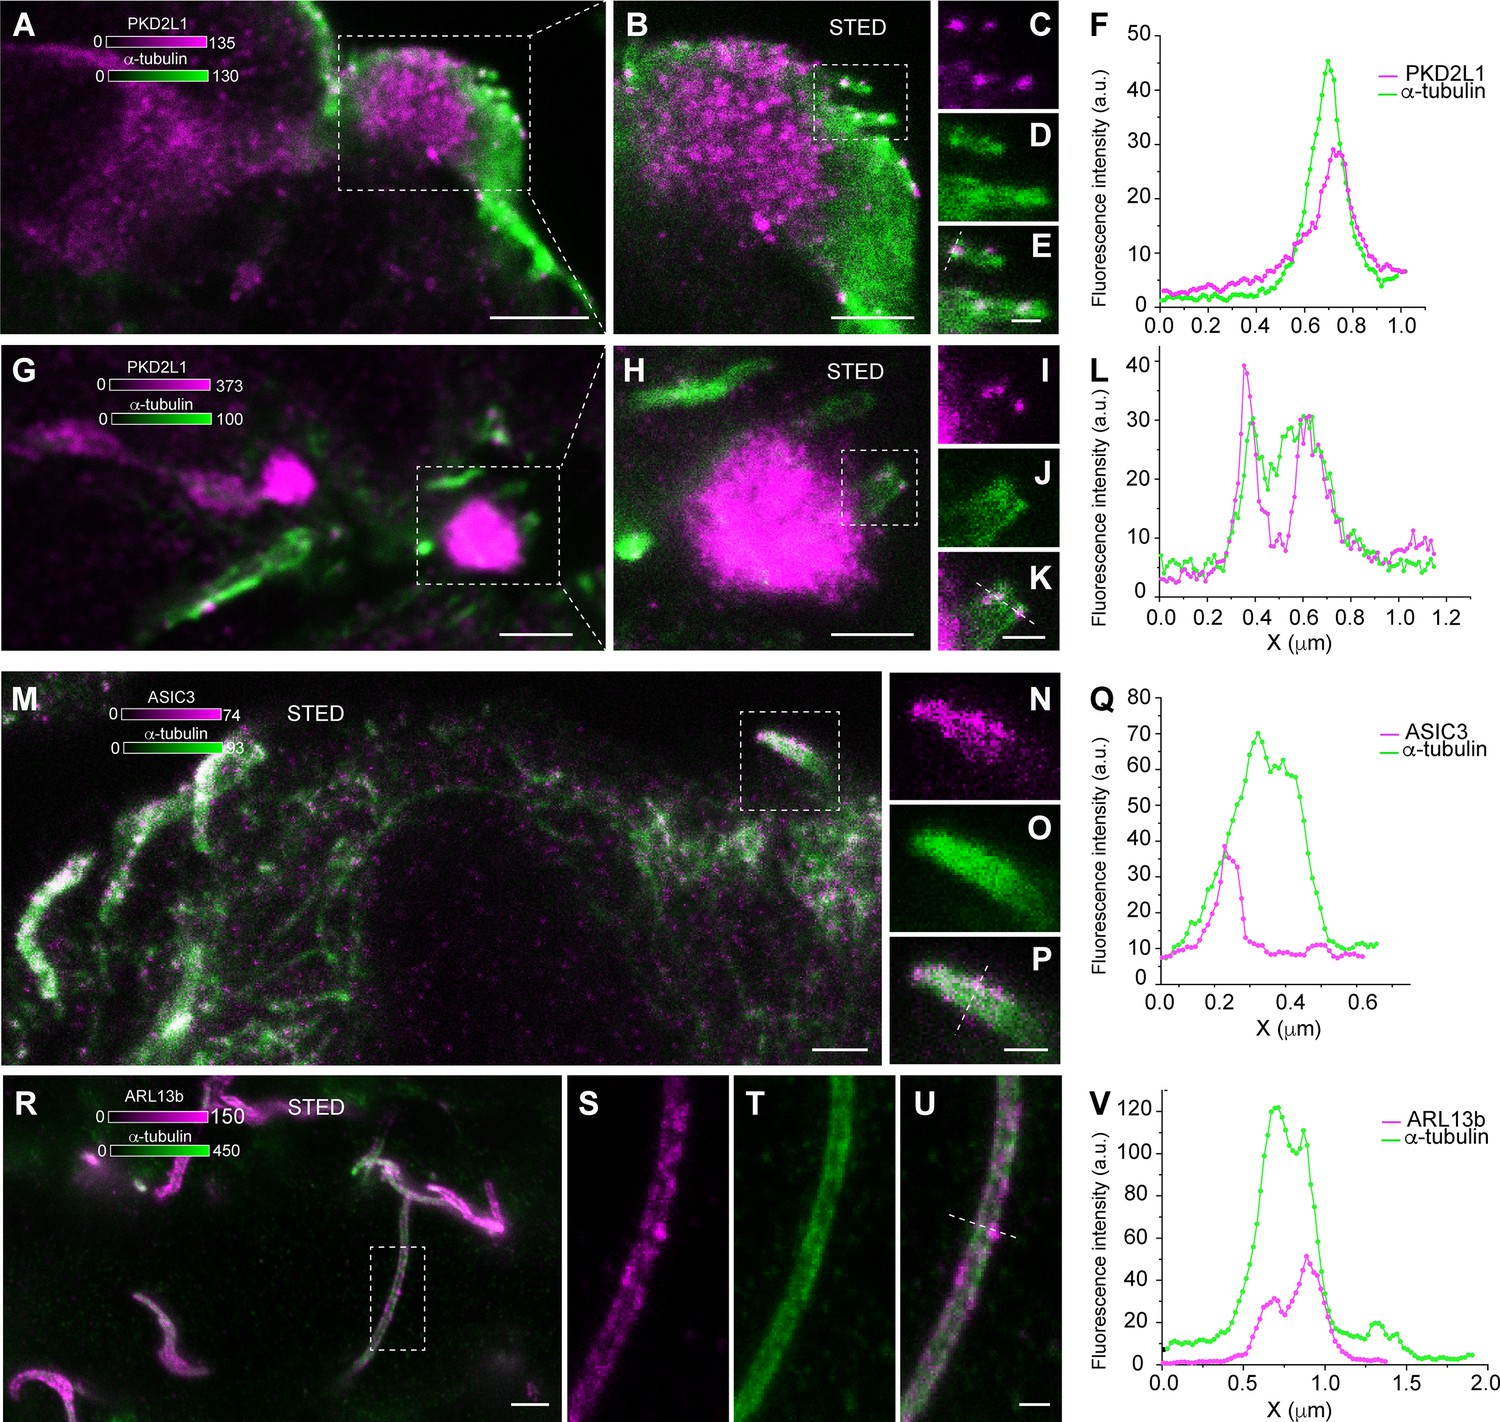
Polycystic kidney disease 2-like 1 (PKD2L1), acid-sensing ion channel 3 (ASIC3), and ARL13b expression on cerebrospinal fluid-contacting (CSF-c) neurons on mouse spinal cord.
(A–L) Two different CSF-c neurons showing immunoreactivity to the PKD2L1 channel (magenta) on their cilium stained with α-tubulin (green). Scale bar, A, G, 2 µm and B, H, 1 µm. (C–E) Selected ROI from (B, I–K), selected ROI from (H) is shown at higher magnification with stimulated emission depletion (STED) microscopy with their corresponding line profiles (F, L), respectively. Scale bar, C–E, I–K, 300 nm. (M–P) ASIC3 (magenta) expression on cilia of CSF-c neurons imaged with STED microscopy. Scale bar, M, 1 µm. (N–P) Selected ROI from (M) is shown at higher magnification with a corresponding line profile in (Q). Scale bar, 300 nm. (R–U) Cilia in the mouse central canal stained with α-tubulin (green) and ARL13b (magenta). Scale bar, R, 1 µm. (S–U) STED images of a ROI from (R) showing ARLB13b expression on a cilium with corresponding line profile in (V). Scale bar, 500 nm.
Figure 7 with 1 supplement
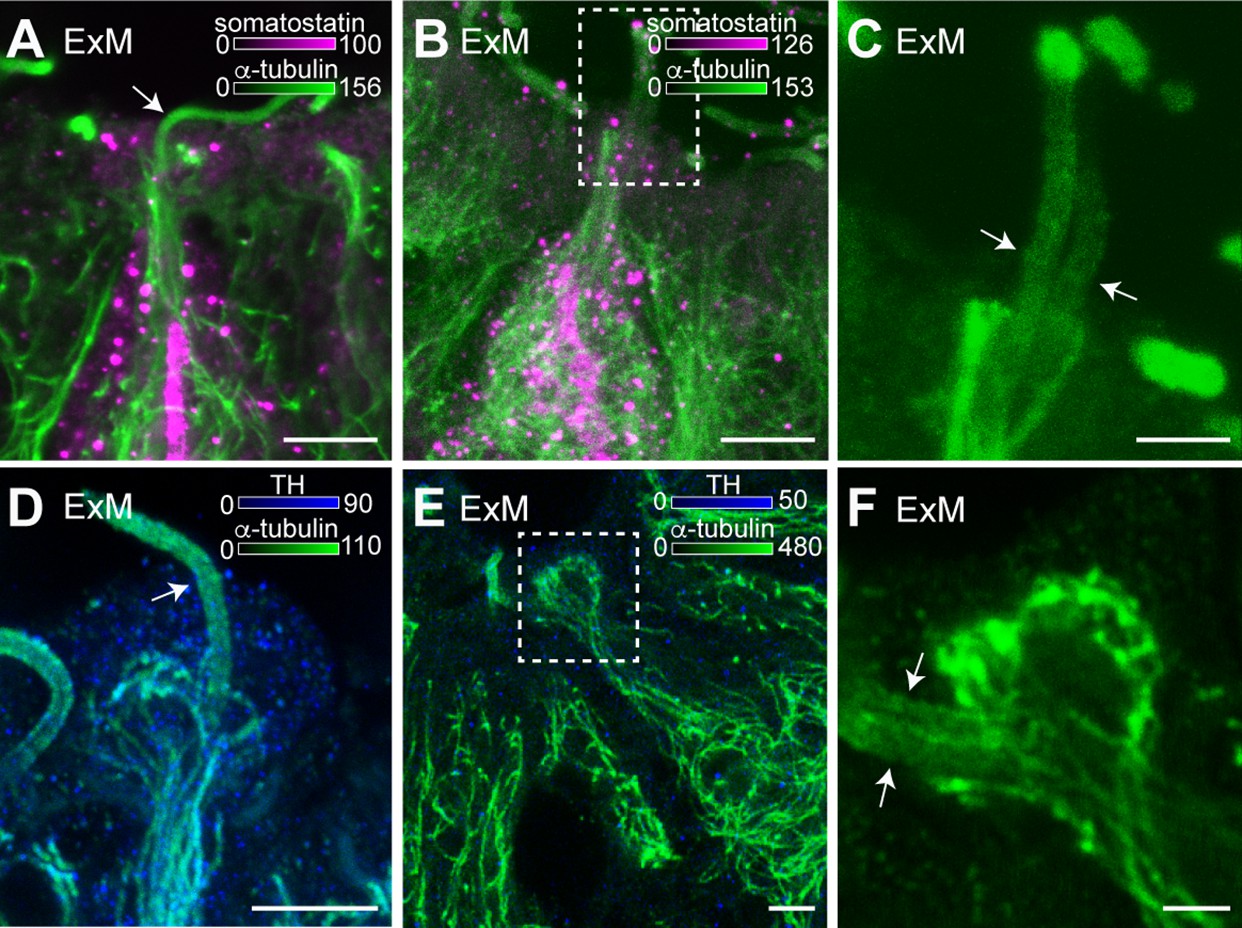
Cerebrospinal fluid-contacting (CSF-c) neurons have one or two cilia on their bulb protrusions.
(A) An expansion microscopy (ExM) image of an expanded somatostatin CSF-c neuron showing one cilium on its bulb (arrow). Scale bar, 5 µm. (B, C) A somatostatin CSF-c neuron with two cilia (arrow) (C) selected ROI from (B). Scale bar B, 5 µm and C, 2 µm. (D) A dopaminergic CSF-c neuron (tyrosine hydroxylase [TH] expressing) with one cilium (arrow). Scale bar, 5 µm. (E, F) A dopaminergic CSF-c neuron with two cilia (arrows) (F) selected ROI from (E). Scale bar, E, 5 µm and F, 2 µm. cc, central canal.
Figure 7—video 1
Cerebrospinal fluid-contacting (CSF-c) neurons might contain two cilia.
Z-stack recorded with confocal microscopy of an expanded lamprey spinal cord tissue (three-dimensional [3D] expansion microscopy [ExM]) showing a CSF-c neuron with two cilia on its bulb. Cilia were stained with α-tubulin.
Figure 8
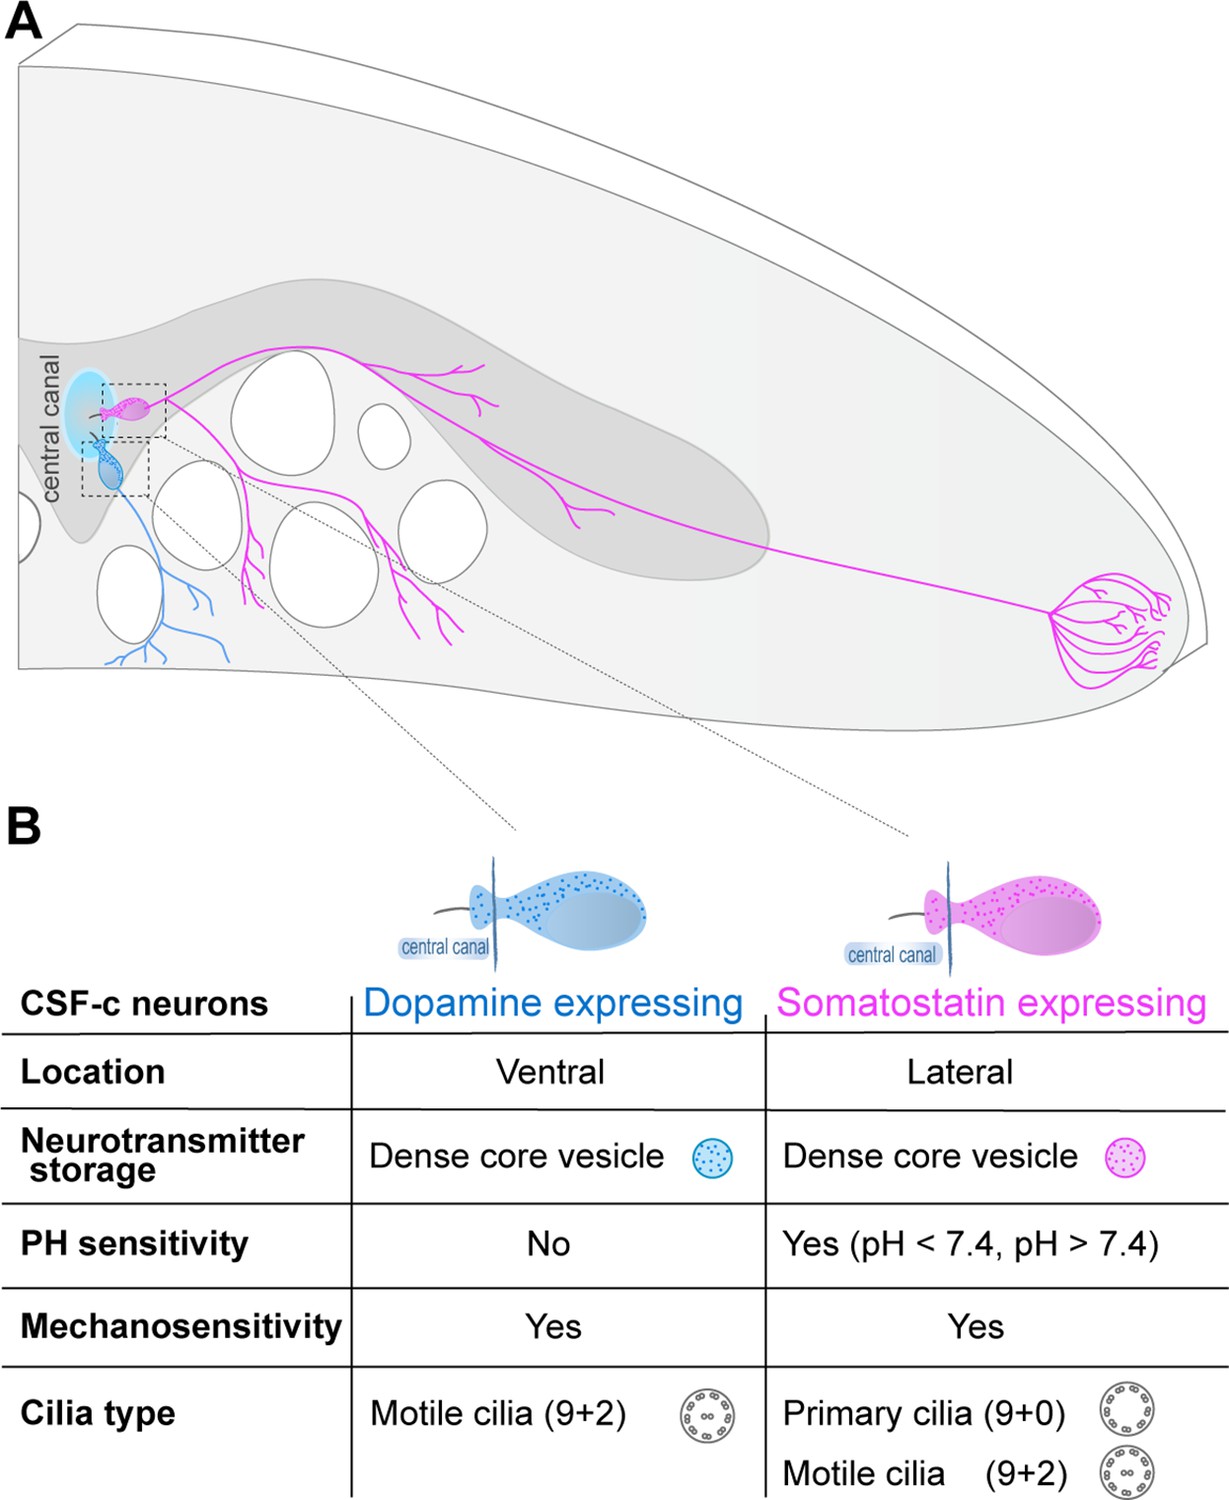
Somatostatin and dopaminergic cerebrospinal fluid-contacting (CSF-c) neurons are two distinct cell types with contrasting function along the spinal cord.
(A) Schematic illustration of a cross-section of the lamprey spinal cord, with a somatostatin- and dopamine-expressing CSF-c neuron at the central canal and their axonal projections. (B) Summary of phenotypes, organelles, and physiological properties of dopaminergic and somatostatin CSF-c neurons.
Tables
Key resources table
| Reagent type (species) or resource | Designation | Source or reference | Identifiers | Additional information |
|---|---|---|---|---|
| Biological sample (Lampetra fluviatilis) | Spinal cord | Collected from the Ljusnan River, Hälsingland, Sweden | Freshly isolated from Lampetra fluviatilis | |
| Biological sample (Mus musculus) | Spinal cord | Janvier Labs, C57BL/6 | Freshly isolated from C57BL/6 | |
| Antibody | Anti-acetylated tubulin (mouse monoclonal) | Sigma-Aldrich | Cat# T6793, RRID:AB_477585 | IF (1:500) |
| Antibody | Anti-somatostatin (rat monoclonal) | Millipore | MAB354, RRID:AB_2255365 | IF (1:100) |
| Antibody | Anti-somatostatin 14-IgG (rabbit polyclonal) | Peninsula laboratories | Cat# T-4102.0400, RRID:AB_518613 | IF (1:1000) |
| Antibody | Anti-TH (mouse monoclonal) | Millipore | Cat# MAB318, RRID:AB_2201528 | IF (1:200) |
| Antibody | Anti-TH (rabbit polyclonal) | Millipore | Cat# AB152, RRID:AB_390204 | IF (1:500) |
| Antibody | Anti-dopamine (mouse monoclonal) | Millipore | Cat# MAB5300, RRID:AB_94817 | IF (1:400) |
| Antibody | Anti-GABA (mouse monoclonal) | Swant | Cat# Mab 3A12, RRID:AB_2314454 | IF (1:2000) |
| Antibody | Anti-polycystin-L (rabbit polyclonal) | Millipore | Cat# AB9084, RRID:AB_571091 | IF (1:500) |
| Antibody | Anti-ASIC3 (rabbit polyclonal) | Thermo Fisher Scientific | Cat# PA5-41022, RRID:AB_2576713 | IF (1:400) |
| Antibody | Anti-ARL13B (rabbit polyclonal) | Proteintech | Cat# 17711-1-AP, RRID:AB_2060867 | IF (1:500) |
| Antibody | Donkey-anti-rat-IgG-AF594 | Jackson ImmunoResearch Labs | Cat# 712-585-153, RRID:AB_2340689 | IF (1:500) |
| Antibody | Donkey-anti-rat-IgG-AF488 | Jackson ImmunoResearch Labs | Cat# 712-545-153, RRID:AB_2340684 | IF (1:200) |
| Antibody | Goat-anti-mouse-STAR635P | Abberrior | Cat# ST635P-1001-500 UG, RRID:AB_2893232 | IF (1:500) |
| Antibody | Goat-anti-rabbit-AF594 | Thermo Fisher Scientific | Cat# A-11037, RRID:AB_2534095 | IF (1:500) |
| Antibody | Donkey-anti-mouse-IgG-Cy3 | Jackson ImmunoResearch Labs | Cat# 715-165-150, RRID:AB_2340813 | IF (1:500) |
| Antibody | Donkey-anti-mouse-IgG-AF488 | Jackson ImmunoResearch Labs | Cat# 715-545-150, RRID:AB_2340846 | IF (1:200) |
| Other | NeuroTrace530/615 | Thermo Fisher Scientific | Cat# N21482, RRID:AB_2620170 | IF (1:1000) |
| Other | NeuroTrace640/660 | Thermo Fisher Scientific | Cat# N21483, RRID:AB_2572212 | IF (1:1000) |
| Other | Phalloidin-STAR635P | Abberior | IF (1:200) | |
| Peptide, recombinant protein | Neurobiotin | Vector Laboratories | Cat# SP-1120, RRID:AB_2313575 | Injection of 0.5% solution for intracellular labelling |
| Peptide, recombinant protein | Streptavidin-AF488 | Jackson ImmunoResearch | Cat# 016-540-084, RRID:AB_2337249 | IF (1:1000) |
| Chemical compound, drug | Glutamate receptor antagonist kynurenic acid | Tocris Ellisville, MO, USA | Bath perfusion, 2 mM | |
| Chemical compound, drug | GABAA receptor antagonist gabazine | Tocris Ellisville, MO, USA | Bath perfusion, 20 mM | |
| Software, algorithm | Fiji | Schindelin et al., 2012 | RRID:SCR_002285 | |
| Software, algorithm | MATLAB | The Mathworks | RRID:SCR_001622 | |
| Software, algorithm | Impsector | Max-Planck Innovation | RRID:SCR_015249 | |
| Software, algorithm | Origin | OriginLab | RRID:SCR_014212 | |
| Software, algorithm | Imaris 9.1 | Bitplane | RRID:SCR_007370 | |
| Software, algorithm | Clampex and Clampfit | Molecular Devices, CA, USA | RRID:SCR_011323 | |
| Commercial assay or kit | Digoxigenin RNA Labeling kit | Roche Diagnostics | Catalog #11 277 073 910 | In situ hybridization |
| Commercial assay or kit | TSA Cy3 Plus Evaluation Kit | PerkinElmer | NEL763E001 | In situ hybridization |
| Antibody | Anti-DIG antibody coupled to HRP (sheep polyclonal) | Roche Diagnostics | RRID: AB_514497 | IF (1:2000) |
Additional files
Download links
A two-part list of links to download the article, or parts of the article, in various formats.
Downloads (link to download the article as PDF)
Open citations (links to open the citations from this article in various online reference manager services)
Cite this article (links to download the citations from this article in formats compatible with various reference manager tools)
ExSTED microscopy reveals contrasting functions of dopamine and somatostatin CSF-c neurons along the lamprey central canal
eLife 11:e73114.
https://doi.org/10.7554/eLife.73114


