Overexpression screen of interferon-stimulated genes identifies RARRES3 as a restrictor of Toxoplasma gondii infection
- Department of Molecular Microbiology, Washington University in St. Louis, United States
- Department of Microbiology, University of Texas Southwestern, United States
Figures
Figure 1

Screen for interferon-stimulated genes (ISGs) impacting Toxoplasma gondii infection.
A549 cells were treated with indicated concentrations of IFNγ for 24 hr and subsequently infected with the type III strain CTG expressing GFP (CTG-GFP) for 36 hr. (A–C) Cells were fixed, stained with anti-GFP and anti-RFP antibodies, and imaged using a Cytation3 Imager. (A–C) Average parasitophorous vacuole (PV) size (A), PVs per field (B), and the percentage of vacuoles containing ≥8 parasites (C) was quantitated for data from 36 hr image sets. (D) Illustration of the method used to conduct the screen presented in (E). (E) A549 cells were transduced with a lentiviral expression cassette co-transcriptionally expressing tagRFP and an ISG of interest in a one gene per well format. After 72 hr, cells were infected with CTG-GFP for 36 hr, fixed, stained with anti-GFP and anti-RFP antibodies, and imaged with a Cytation3 Imager. Statistical significance was determined using a two-way ANOVA with Tukey’s test for post hoc analysis. ISGs enhancing or restricting infection >20% relative to control with p<0.0001 were classified as hits. Hits are shown in red and labeled. (F) WT and IDO1−/− A549 cells were infected with CTG-GFP for 96 hr. Cells were fixed, stained with anti-SAG1 antibody, and imaged with a Cytation3 Imager. Average total infected area per well is shown. Loss of IDO1 in IDO1−/− A549 cells was confirmed via western blot. Briefly, cells were treated with or without 1000 U/ml IFNγ for 24 hr before samples were harvested and IDO1 expression was determined. (A–C, F) Data represent the deviation of three biological replicates conducted in technical triplicate. (E) Data represent deviation of two biological replicates conducted in technical duplicate. Statistical significance was determined using two-way ANOVA with Tukey’s test for post hoc analysis. ns, not significant; p>0.05, **p<0.01, ****p<0.0001.
-
Figure 1—source data 1
Vacuole size quantitation following CTG-GFP infection of IFN pretreated A549 cells.
- https://cdn.elifesciences.org/articles/73137/elife-73137-fig1-data1-v3.zip
-
Figure 1—source data 2
Vacuole number quantitation following CTG-GFP infection of IFN pretreated A549 cells.
- https://cdn.elifesciences.org/articles/73137/elife-73137-fig1-data2-v3.zip
-
Figure 1—source data 3
Quantitation of the percentage of vacuoles containing eight or more parasites following CTG-GFP infection of IFN pretreated A549 cells.
- https://cdn.elifesciences.org/articles/73137/elife-73137-fig1-data3-v3.zip
-
Figure 1—source data 4
Numerical value summary for the results of the ISG screen.
The complete data set is presented in Supplementary file 1.
- https://cdn.elifesciences.org/articles/73137/elife-73137-fig1-data4-v3.zip
-
Figure 1—source data 5
Quantitation of the total image area infected after CTG-GFP infection of WT or IDO1−/− A549 cells.
- https://cdn.elifesciences.org/articles/73137/elife-73137-fig1-data5-v3.zip
-
Figure 1—source data 6
Contrast enhanced and labeled actin western blot.
- https://cdn.elifesciences.org/articles/73137/elife-73137-fig1-data6-v3.zip
-
Figure 1—source data 7
Unmodified actin western blot.
- https://cdn.elifesciences.org/articles/73137/elife-73137-fig1-data7-v3.zip
-
Figure 1—source data 8
Contrast enhanced and labeled IDO1 western blot.
- https://cdn.elifesciences.org/articles/73137/elife-73137-fig1-data8-v3.zip
-
Figure 1—source data 9
Unmodified IDO1 western blot.
- https://cdn.elifesciences.org/articles/73137/elife-73137-fig1-data9-v3.zip
Figure 2
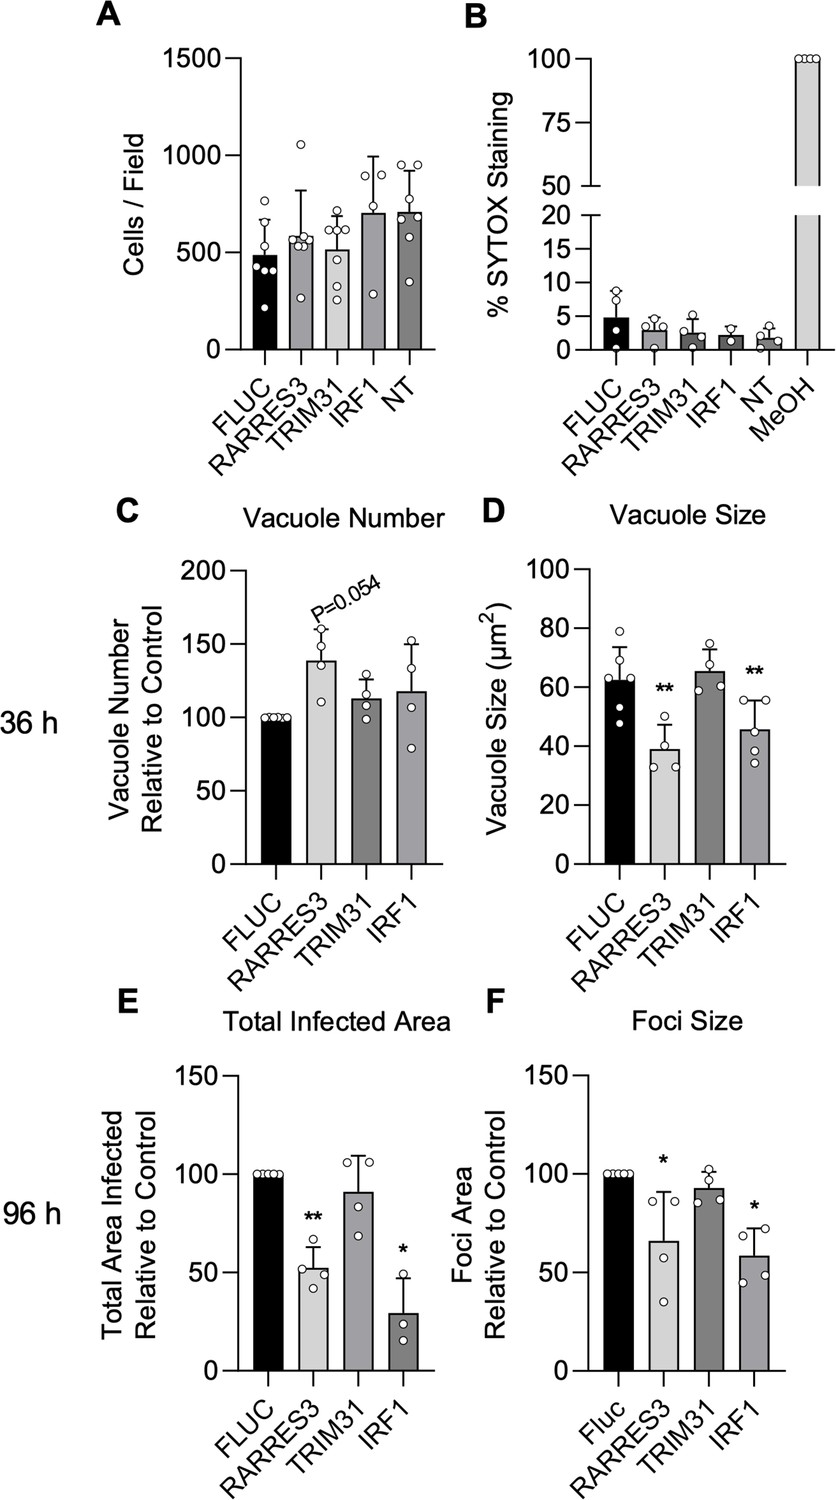
IRF1 and RARRES3 restrict Toxoplasma infection.
(A, B) Wild-type (WT) A549 cells were either not transduced (NT) or transduced with TRIP.RARRES3 or TRIP.FLUC control and split 48 hr later. After 60 hr, cells were stained with Hoechst 33342, SYTOX green, and imaged with a Cytation3 Imager. As a positive control, cells were permeabilized by treatment with methanol (MeOH) for 5 min prior to staining. Average cell number (A) and the percentage of SYTOX staining cells (B) were determined. (C–F) WT A549 cells were transduced with TRIP.RARRES3 or TRIP.FLUC control and infected 72 hr later with CTG-GFP for 36 (C, D) or 96 (E, F) hr. Cells were fixed, stained with anti-GFP and anti-RFP antibodies, and imaged using a Cytation3 Imager. Average PV number per field (C) and PV size (D) were quantitated for 36 hr infections while total area infected per sample (E) and average foci size (F) were quantitated for 96 hr infections. Data in (A) represent four to seven biological replicates conducted in technical triplicate. Data in (B) represent two to four biological replicates conducted in technical triplicate. Data in (C–F) represent three to four biological replicates conducted in technical triplicate. Statistical significance was determined using a Brown-Forsythe and Welch ANOVA (A, B) or a two-way ANOVA with Tukey’s test for post hoc analysis (C–F). *p≤0.05, **p<0.01.
-
Figure 2—source data 1
Cell counts per field for cells ectopically expressing ISG screen hits.
- https://cdn.elifesciences.org/articles/73137/elife-73137-fig2-data1-v3.zip
-
Figure 2—source data 2
Percentage of A549s ectopically expressing ISG screen hits that stained positive for SYTOX Green.
- https://cdn.elifesciences.org/articles/73137/elife-73137-fig2-data2-v3.zip
-
Figure 2—source data 3
Number of vacuoles counted after infection of A549s ectopically expressing ISG screen hits with CTG-GFP for 36 hr.
- https://cdn.elifesciences.org/articles/73137/elife-73137-fig2-data3-v3.zip
-
Figure 2—source data 4
Quantitation of vacuole size after infection of A549s ectopically expressing ISG screen hits with CTG-GFP for 36 hr.
- https://cdn.elifesciences.org/articles/73137/elife-73137-fig2-data4-v3.zip
-
Figure 2—source data 5
Quantitation of total area infected per sample after infection of A549s ectopically expressing ISG screen hits with CTG-GFP for 96 hr.
- https://cdn.elifesciences.org/articles/73137/elife-73137-fig2-data5-v3.zip
-
Figure 2—source data 6
Quantitation of average infection foci size formed after infection of A549s ectopically expressing ISG screen hits with CTG-GFP for 96 hr.
- https://cdn.elifesciences.org/articles/73137/elife-73137-fig2-data6-v3.zip
Figure 3

Comparison of genes induced by IRF1 and IFNγ in A549 cells.
Cells were transduced with TRIP.IRF1 or TRIP.FLUC control lentivirus. Cells transduced with FLUC were further treated 72 hr later with or without 1000 U/ml IFNγ for 24 hr. All cell populations were subsequently harvested and analyzed by RNA-Seq. (A, B) Changes in gene expression relative to FLUC control expressing cells for cells treated with IFNγ (A) or ectopically expressing IRF1 (B). Genes upregulated in both IRF1 expressing and IFNγ treated cells are defined as ‘Shared’ while genes only upregulated in one of these two cell populations are defined as ‘Unique.’ (C) Comparison of genes induced ≥2-fold with a false discovery rate cutoff of 0.05 by each condition and their overlap with the ISG library used in the screen described in Figure 1. (D–E) Lists of induced genes were analyzed with PANTHER gene ontology analysis. The top 10 most enriched processes amongst genes induced by IFNγ (D) and IRF1 (E) are shown. Redundant terms were excluded from these lists with only the most enriched version of each term remaining.
-
Figure 3—source data 1
Differential expression of genes after IFNγ treatment relative to mock control.
- https://cdn.elifesciences.org/articles/73137/elife-73137-fig3-data1-v3.xlsx
-
Figure 3—source data 2
Differential expression of genes in IRF1 overexpressing cells relative to FLUC expressing control cells.
- https://cdn.elifesciences.org/articles/73137/elife-73137-fig3-data2-v3.xlsx
-
Figure 3—source data 3
Gene ontology term enrichment for genes significantly induced by IFNγ treatment.
- https://cdn.elifesciences.org/articles/73137/elife-73137-fig3-data3-v3.xlsx
-
Figure 3—source data 4
Gene ontology term enrichment for genes significantly induced by IRF1 overexpression.
- https://cdn.elifesciences.org/articles/73137/elife-73137-fig3-data4-v3.xlsx
Figure 4
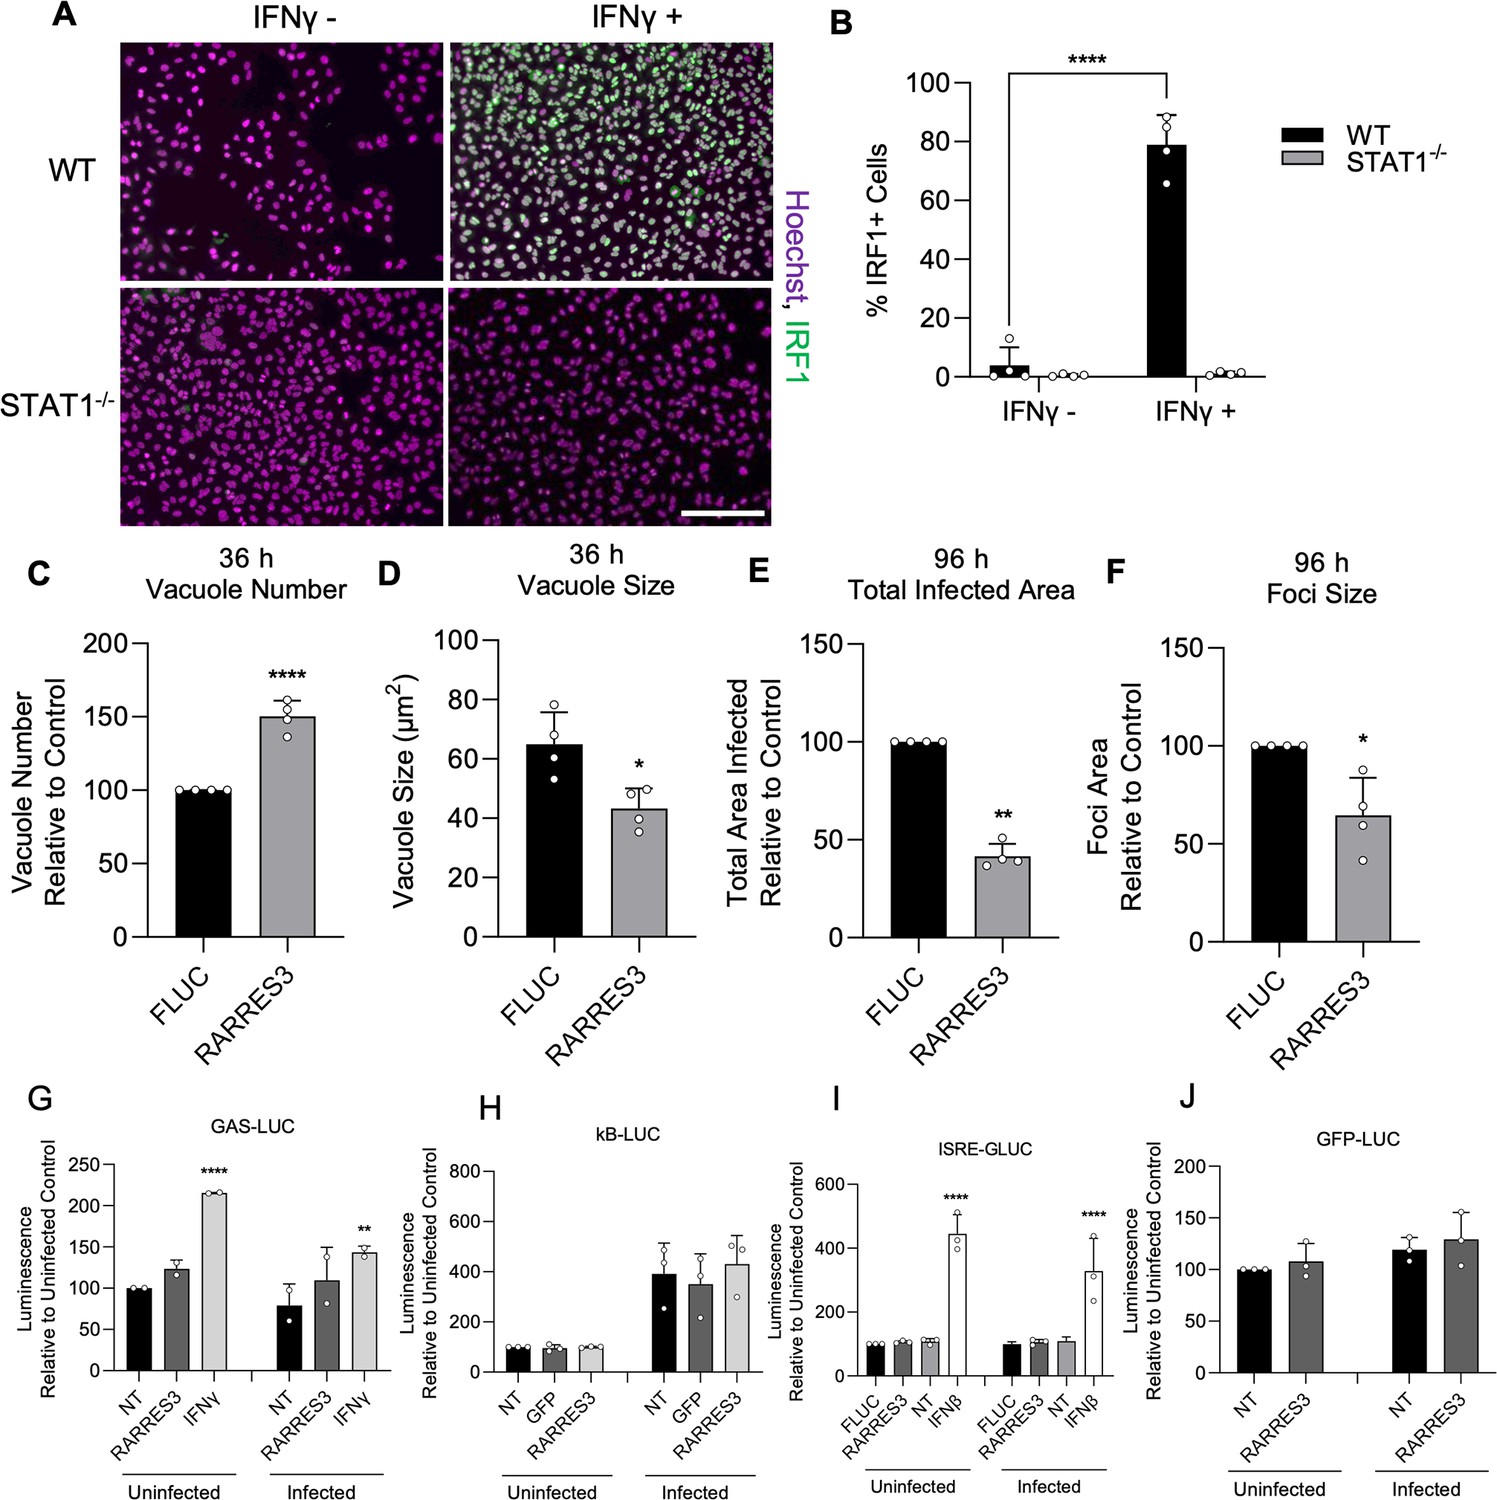
RARRES3 restricts Toxoplasma infection in a STAT1 independent manner.
To determine if restriction of T. gondii growth was STAT1 dependent, STAT1−/− A549 cells were generated. To confirm complete insensitivity to interferon treatment, WT or STAT1−/− A549 cells were treated with or without 4000 U/ml IFNγ for 6 hr, fixed, stained with anti-IRF1 antibodies, and imaged with a Cytation3 Imager. (A) Representative images and (B) quantitation are shown. Scale bar=50 µm. (C–F) STAT1−/− A549 cells were transduced with TRIP.RARRES3 or TRIP.FLUC control and infected 72 hr later with CTG-GFP for 36 (C, D) or 96 (E, F) hr. Cells were fixed, stained with anti-GFP and anti-RFP antibodies, and imaged using a Cytation3 Imager. Average PV number per field (C) and PV size (D) were quantitated for 36 hr infections while total area infected per sample (E) and average foci size (F) were quantitated for 96 hr infections. HeLa reporter cell lines expressing GAS-LUC (G), kB-LUC (H), ISRE-GLUC (I), and GFP-LUC (J) were either not transduced (NT) or transduced with TRIP.RARRES3, TRIP.FLUC, or TRIP.GFP. After 72 hr, cells were mock treated or treated with 100 U/ml IFNβ or IFNγ as indicated and infected with CTG-GFP for 36 hr. Cells were harvested for luciferase assay. Data in (B) represent means ± SD of four biological replicates conducted in technical duplicate. Data in (C–F) represent means ± standard deviation of four biological replicates conducted in technical triplicate. Data represent means ± SD of two (G) or three (H–I) biological replicates conducted in technical duplicate. Statistical significance was determined using two-way ANOVA with Tukey’s test for post hoc analysis except for (D) where Mann-Whitney’s U-test was used. *p≤0.05, **p<0.01, ***p<0.001, ****p<0.0001.
-
Figure 4—source data 1
Quantitation of the percentage of IRF1 staining cells after IFNγ treatment of WT or STAT1−/− A549 cells.
- https://cdn.elifesciences.org/articles/73137/elife-73137-fig4-data1-v3.zip
-
Figure 4—source data 2
Quantitation of the number of vacuoles formed following CTG-GFP infection of RARRES3 or FLUC ectopically expressing STAT1−/− A549 cells.
- https://cdn.elifesciences.org/articles/73137/elife-73137-fig4-data2-v3.zip
-
Figure 4—source data 3
Vacuole size quantitation following CTG-GFP infection of RARRES3 or FLUC ectopically expressing STAT1−/− A549 cells.
- https://cdn.elifesciences.org/articles/73137/elife-73137-fig4-data3-v3.zip
-
Figure 4—source data 4
Quantitation of total infected area per sample after infection of STAT1−/− A549s ectopically expressing RARRES3 or FLUC with CTG-GFP for 96 hr.
- https://cdn.elifesciences.org/articles/73137/elife-73137-fig4-data4-v3.zip
-
Figure 4—source data 5
Quantitation of average infection foci size formed after infection of STAT1−/− A549s ectopically expressing RARRES3 or FLUC with CTG-GFP for 96 hr.
- https://cdn.elifesciences.org/articles/73137/elife-73137-fig4-data5-v3.zip
-
Figure 4—source data 6
Luminescence values from luciferase assays conducted on lysates from cells expressing a GAS-LUC reporter and RARRES3.
- https://cdn.elifesciences.org/articles/73137/elife-73137-fig4-data6-v3.zip
-
Figure 4—source data 7
Luminescence values from luciferase assays conducted on lysates from cells expressing a κB-LUC reporter and RARRES3.
- https://cdn.elifesciences.org/articles/73137/elife-73137-fig4-data7-v3.zip
-
Figure 4—source data 8
Luminescence values from luciferase assays conducted on cell supernatant from cells expressing an ISRE-GLUC reporter and RARRES3.
- https://cdn.elifesciences.org/articles/73137/elife-73137-fig4-data8-v3.zip
-
Figure 4—source data 9
Luminescence values from luciferase assays conducted on lysates from cells expressing a GFP-LUC reporter control and RARRES3.
- https://cdn.elifesciences.org/articles/73137/elife-73137-fig4-data9-v3.zip
Figure 5 with 1 supplement

RARRES3 deficiency partially reverses IFNγ-mediated restriction of Toxoplasma infection.
(A, B) A549s were transduced with V5 tagged WT RARRES3 or the catalytically inactive mutants C113A or C133S for 72 hr. (A) Cells were infected with CTG-GFP for 96 hr. Cells were harvested, stained with anti-GFP and anti-RFP antibodies, and imaged with a Cytation3 Imager. The total area infected per sample is shown. (B) Western blot from lysates prepared with above RARRES3 expressing cells. Membranes were probed with mouse anti-actin and mouse anti-V5 antibodies overnight followed by goat anti-mouse 680RD and imaged with a LI-COR Odyssey scanner. RARRES3−/− A549s or wild-type cells transduced with a nontargeting CRISPR/Cas9 sgRNA were transduced with Cas9 resistant TRIP.RARRES3 or TRIP.FLUC as indicated. After 72 hr, cells were treated with or without 100 U/ml IFNγ for 24 hr as indicated and subsequently infected with CTG-GFP for 96 hr. Cells were harvested, stained with anti-GFP and anti-RFP antibodies, and imaged with a Cytation3 Imager. (C) Representative images and (D) quantitation are shown. Scale bar=500 µm. (E) RARRES3−/− or RARRES3+/+ A549 cells transduced with a nontargeting CRISPR/Cas9 control sgRNA were transduced with TRIP.FLUC or TRIP.IRF1 derived lentivirus. After 72 hr, cells were infected with CTG-GFP for 96 hr, harvested, stained with anti-GFP and anti-RFP antibodies, and imaged with a Cytation3 Imager. Average total infected area per well is shown. Data represent means ± standard deviation of three (A) or four (D, E) biological replicates conducted in technical triplicate. Statistical significance was determined using two-way ANOVA with Tukey’s test for post hoc analysis. ns, not significant; *p>0.05, **p<0.01, ****p<0.0001.
-
Figure 5—source data 1
Quantitation of total infected area per sample after infection of A549s ectopically expressing WT RARRES3 and mutants with CTG-GFP for 96 hr.
- https://cdn.elifesciences.org/articles/73137/elife-73137-fig5-data1-v3.zip
-
Figure 5—source data 2
Contrast enhanced and labeled actin western blot.
- https://cdn.elifesciences.org/articles/73137/elife-73137-fig5-data2-v3.zip
-
Figure 5—source data 3
Unmodified actin western blot.
- https://cdn.elifesciences.org/articles/73137/elife-73137-fig5-data3-v3.zip
-
Figure 5—source data 4
Contrast enhanced and labeled V5 tag western blot.
- https://cdn.elifesciences.org/articles/73137/elife-73137-fig5-data4-v3.zip
-
Figure 5—source data 5
Unmodified V5 tag western blot.
- https://cdn.elifesciences.org/articles/73137/elife-73137-fig5-data5-v3.zip
-
Figure 5—source data 6
Quantitation of total infected area per sample after infection of IFNγ pretreated WT or RARRES3−/− A549s with CTG-GFP for 96 hr.
- https://cdn.elifesciences.org/articles/73137/elife-73137-fig5-data6-v3.zip
-
Figure 5—source data 7
Quantitation of total infected area per sample after infection of WT or RARRES3−/− A549s ectopically expressing IRF1 with CTG-GFP for 96 hr.
- https://cdn.elifesciences.org/articles/73137/elife-73137-fig5-data7-v3.zip
Figure 5—figure supplement 1
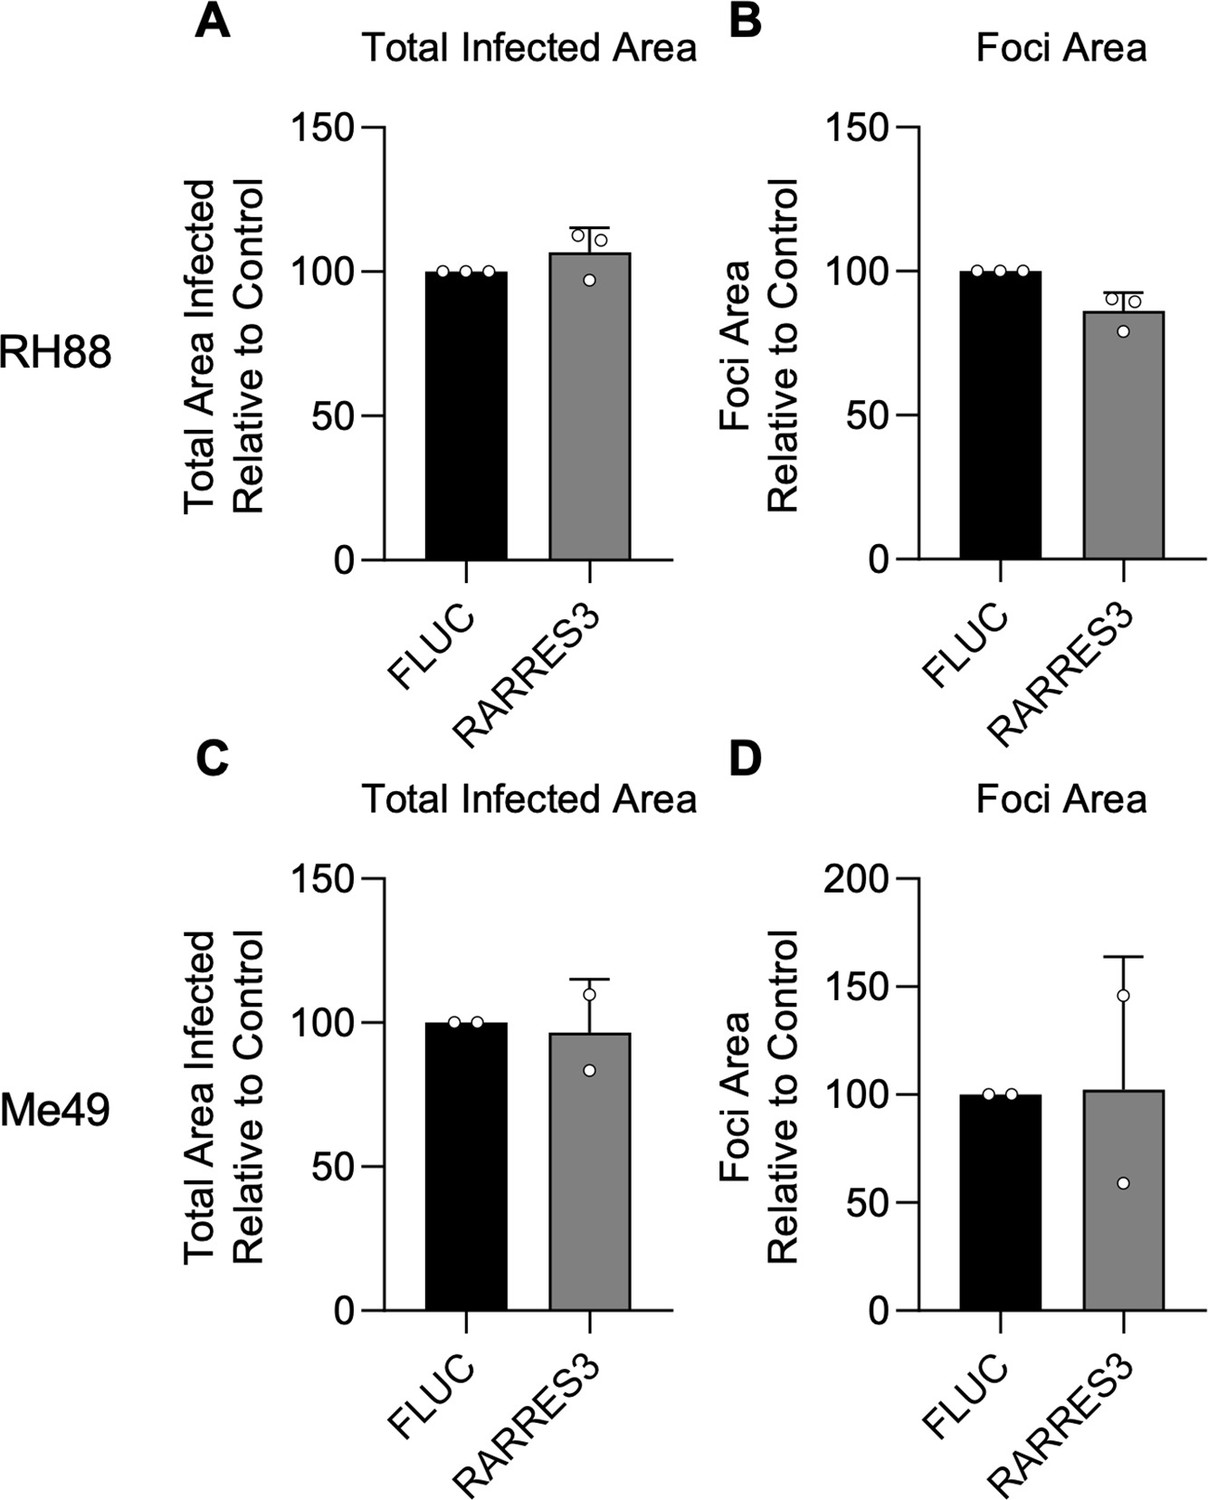
RARRES3 does not restrict infection of type I or II strains of Toxoplasma gondii.
A549 cells were transduced with TRIP.RARRES3 and infected 72 hr later with a type I strain expressing GFP (RH88-GFP) (A, B) or a type II strain expressing GFP (Me49-GFP) (C, D) for 4 or 6 days, respectively. Cells were fixed, stained with anti-GFP and anti-RFP antibodies, and imaged using a Cytation3 Imager. Average total infected area per well (A, C) and average area of infection foci (B, D) are shown. Data represent means ± standard deviation of two to three biological replicates conducted in technical triplicate. Statistical significance was determined using two-way ANOVA with Tukey’s test for post hoc analysis.
-
Figure 5—figure supplement 1—source data 1
Quantitation of total infected area per sample after infection of A549s ectopically expressing RARRES3 or FLUC with RH88-GFP.
- https://cdn.elifesciences.org/articles/73137/elife-73137-fig5-figsupp1-data1-v3.zip
-
Figure 5—figure supplement 1—source data 2
Quantitation of average infection foci size formed after infection of A549s ectopically expressing RARRES3 or FLUC with RH88-GFP.
- https://cdn.elifesciences.org/articles/73137/elife-73137-fig5-figsupp1-data2-v3.zip
-
Figure 5—figure supplement 1—source data 3
Quantitation of total infected area per sample after infection of A549s ectopically expressing RARRES3 or FLUC with Me49-GFP.
- https://cdn.elifesciences.org/articles/73137/elife-73137-fig5-figsupp1-data3-v3.zip
-
Figure 5—figure supplement 1—source data 4
Quantitation of average infection foci size formed after infection of A549s ectopically expressing RARRES3 or FLUC with Me49-GFP.
- https://cdn.elifesciences.org/articles/73137/elife-73137-fig5-figsupp1-data4-v3.zip
Figure 6 with 1 supplement
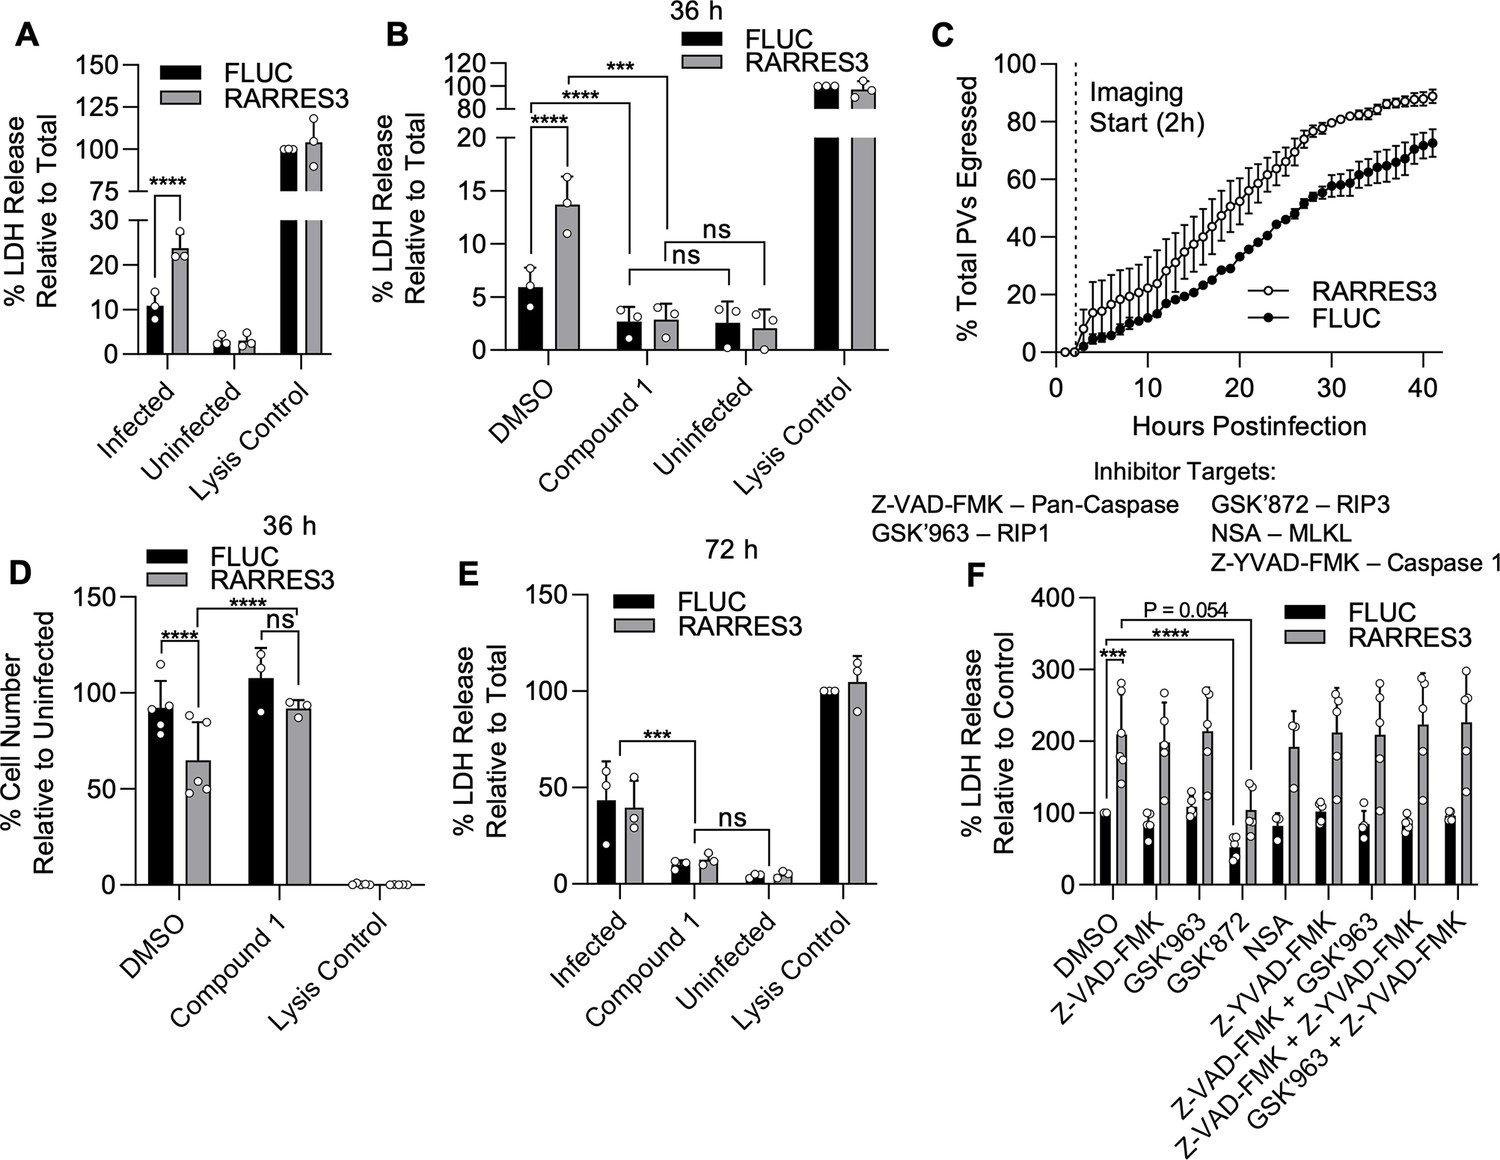
RARRES3 promotes premature egress of Toxoplasma gondii.
A549 cells were transduced with TRIP.RARRES3 or TRIP.FLUC control and infected 72 hr later with CTG-GFP for 36 (A, B, D, F), 50 (C), or 72 (E) hr. Cells were treated with the cell death inhibitors Z-VAD-FMK (50 µM), GSK’963 (1 µM), GSK’872 (5 µM), NSA (10 µM), and Z-YVAD-FMK (10 µM) or the parasite egress inhibitor compound 1 (5 µM) as indicated during infection. (A, B, E, F) Cell supernatant was collected after infection and lactate dehydrogenase (LDH) activity was determined to measure cell lysis. As a control to measure maximal LDH release, cells were lysed before supernatant collection. (C) Live infection was imaged every 15 min starting 2 hr postinfection until 50 hr postinfection. Time of parasite egress was recorded for at least 100 PVs per condition per replicate. Percentage of total parasites egressed by the end of each hour is indicated. (D) Cells were fixed, stained with anti-RFP and anti-GFP antibodies, and imaged with a Cytation3 Imager. Average cells per field are shown. Data represent the means ± standard deviation (A, B, D–F) or standard error of the mean (C) of three to five biological replicates conducted in technical duplicate (A, B, D–F), or singlet (C). Statistical significance was determined using two-way ANOVA with Tukey’s test for post hoc analysis. ns, not significant; P>0.05, *p≤0.05, ***p<0.001, ****p<0.0001.
-
Figure 6—source data 1
Absorbance values for lactate dehydrogenase activity assays using supernatants from RARRES3 or FLUC ectopically expressing A549 cells infected with CTG-GFP for 36 hr.
- https://cdn.elifesciences.org/articles/73137/elife-73137-fig6-data1-v3.zip
-
Figure 6—source data 2
Absorbance values for lactate dehydrogenase activity assays using supernatants from RARRES3 or FLUC ectopically expressing A549 cells infected with CTG-GFP for 36 hr in the presence of Compound 1.
- https://cdn.elifesciences.org/articles/73137/elife-73137-fig6-data2-v3.zip
-
Figure 6—source data 3
Quantitation of the time of egress in hours for parasites egressing from RARRES3 or FLUC ectopically expressing A549s.
- https://cdn.elifesciences.org/articles/73137/elife-73137-fig6-data3-v3.zip
-
Figure 6—source data 4
Cell count per field after infection of RARRES3 or FLUC ectopically expressing A549s with CTG-GFP in the presence of Compound 1.
- https://cdn.elifesciences.org/articles/73137/elife-73137-fig6-data4-v3.zip
-
Figure 6—source data 5
Absorbance values for lactate dehydrogenase activity assays using supernatants from RARRES3 or FLUC ectopically expressing A549 cells infected with CTG-GFP for 72 hr in the presence of Compound 1.
- https://cdn.elifesciences.org/articles/73137/elife-73137-fig6-data5-v3.zip
-
Figure 6—source data 6
Absorbance values for lactate dehydrogenase activity assays using supernatants from RARRES3 or FLUC ectopically expressing A549 cells infected with CTG-GFP in the presence of cell death inhibitors.
- https://cdn.elifesciences.org/articles/73137/elife-73137-fig6-data6-v3.zip
Figure 6—figure supplement 1
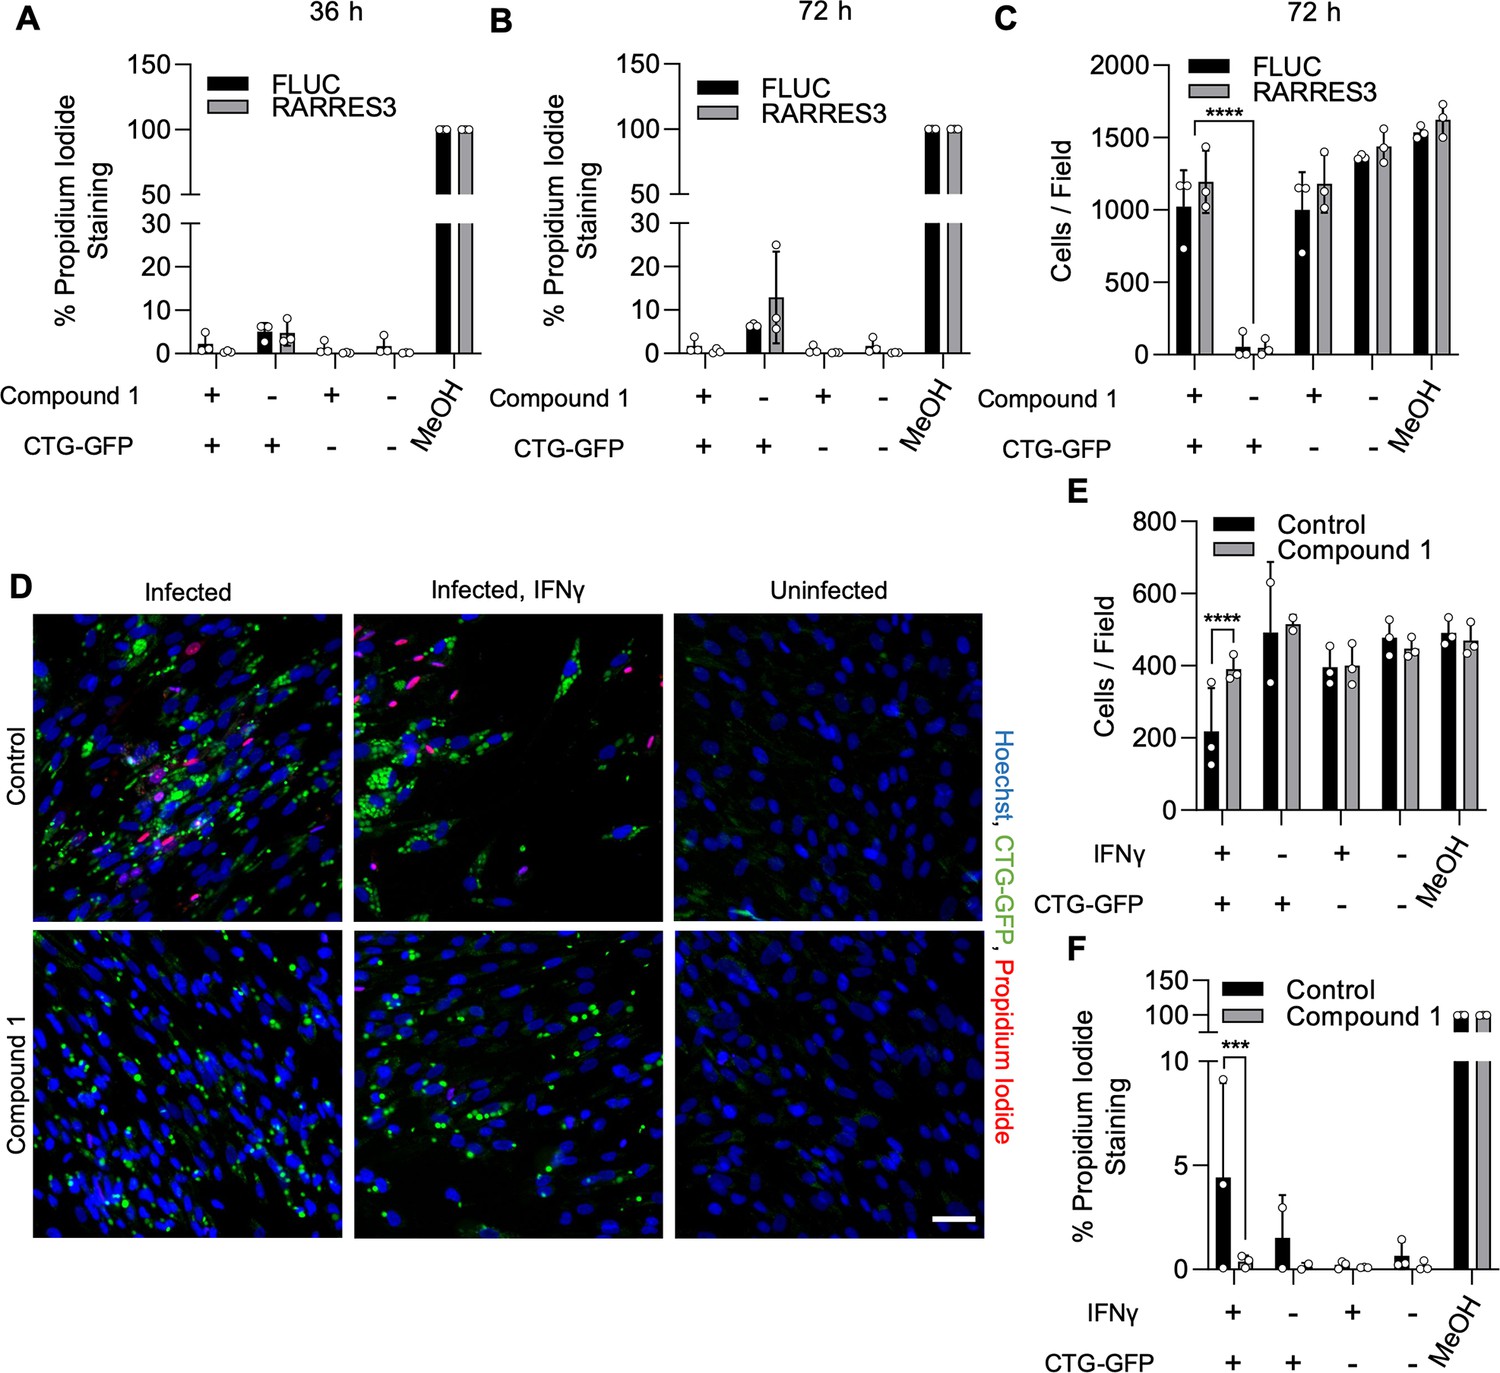
Compound 1 prevents host cell death during infection.
(A–C) A549 cells were transduced with TRIP.RARRES3 or TRIP.FLUC control and infected 72 hr later with CTG-GFP for 36 hr (A) or 72 hr (B, C). Cells were stained with Hoechst 33342, propidium iodide, and imaged with a Cytation3 imager. As a positive control, cells were permeabilized by treatment with methanol (MeOH) for 5 min prior to staining. The percentage of propidium iodide staining cells (A, B) and average cell number per field (C) were determined. (D–F) HFF cells were pretreated with or without IFNγ for 24 hr and subsequently infected with CTG-GFP for 36 hr. Cells were stained with Hoechst 33342, propidium iodide, and imaged with a Cytation3 imager. As a positive control, cells were permeabilized by treatment with methanol (MeOH) for 5 min prior to staining. (D) Representative images are shown. Scale bar=50 µm. Average cell number (E) and the percentage of propidium iodide staining cells (F) were determined. Data represent means ± standard deviation of two or three biological replicates conducted in technical duplicate. Statistical significance was determined using two-way ANOVA with Tukey’s test for post hoc analysis. ***p<0.001, ****p<0.0001.
-
Figure 6—figure supplement 1—source data 1
Percentage of cells staining with propidium iodide after infection of RARRES3 or FLUC ectopically expressing A549s with CTG-GFP for 36 hr in the presence of Compound 1.
- https://cdn.elifesciences.org/articles/73137/elife-73137-fig6-figsupp1-data1-v3.zip
-
Figure 6—figure supplement 1—source data 2
Percentage of cells staining with propidium iodide after infection of RARRES3 or FLUC ectopically expressing A549s with CTG-GFP for 72 hr in the presence of Compound 1.
- https://cdn.elifesciences.org/articles/73137/elife-73137-fig6-figsupp1-data2-v3.zip
-
Figure 6—figure supplement 1—source data 3
Cell count per field after infection of RARRES3 or FLUC ectopically expressing A549s with CTG-GFP for 72 hr in the presence of Compound 1.
- https://cdn.elifesciences.org/articles/73137/elife-73137-fig6-figsupp1-data3-v3.zip
-
Figure 6—figure supplement 1—source data 4
Cell count per field after infection of IFNγ pretreated HFFs with CTG-GFP for 36 hr in the presence of Compound 1.
- https://cdn.elifesciences.org/articles/73137/elife-73137-fig6-figsupp1-data4-v3.zip
-
Figure 6—figure supplement 1—source data 5
Percentage of cells staining with propidium iodide after infection of IFNγ pretreated HFFs with CTG-GFP for 36 hr in the presence of Compound 1.
- https://cdn.elifesciences.org/articles/73137/elife-73137-fig6-figsupp1-data5-v3.zip
Figure 7
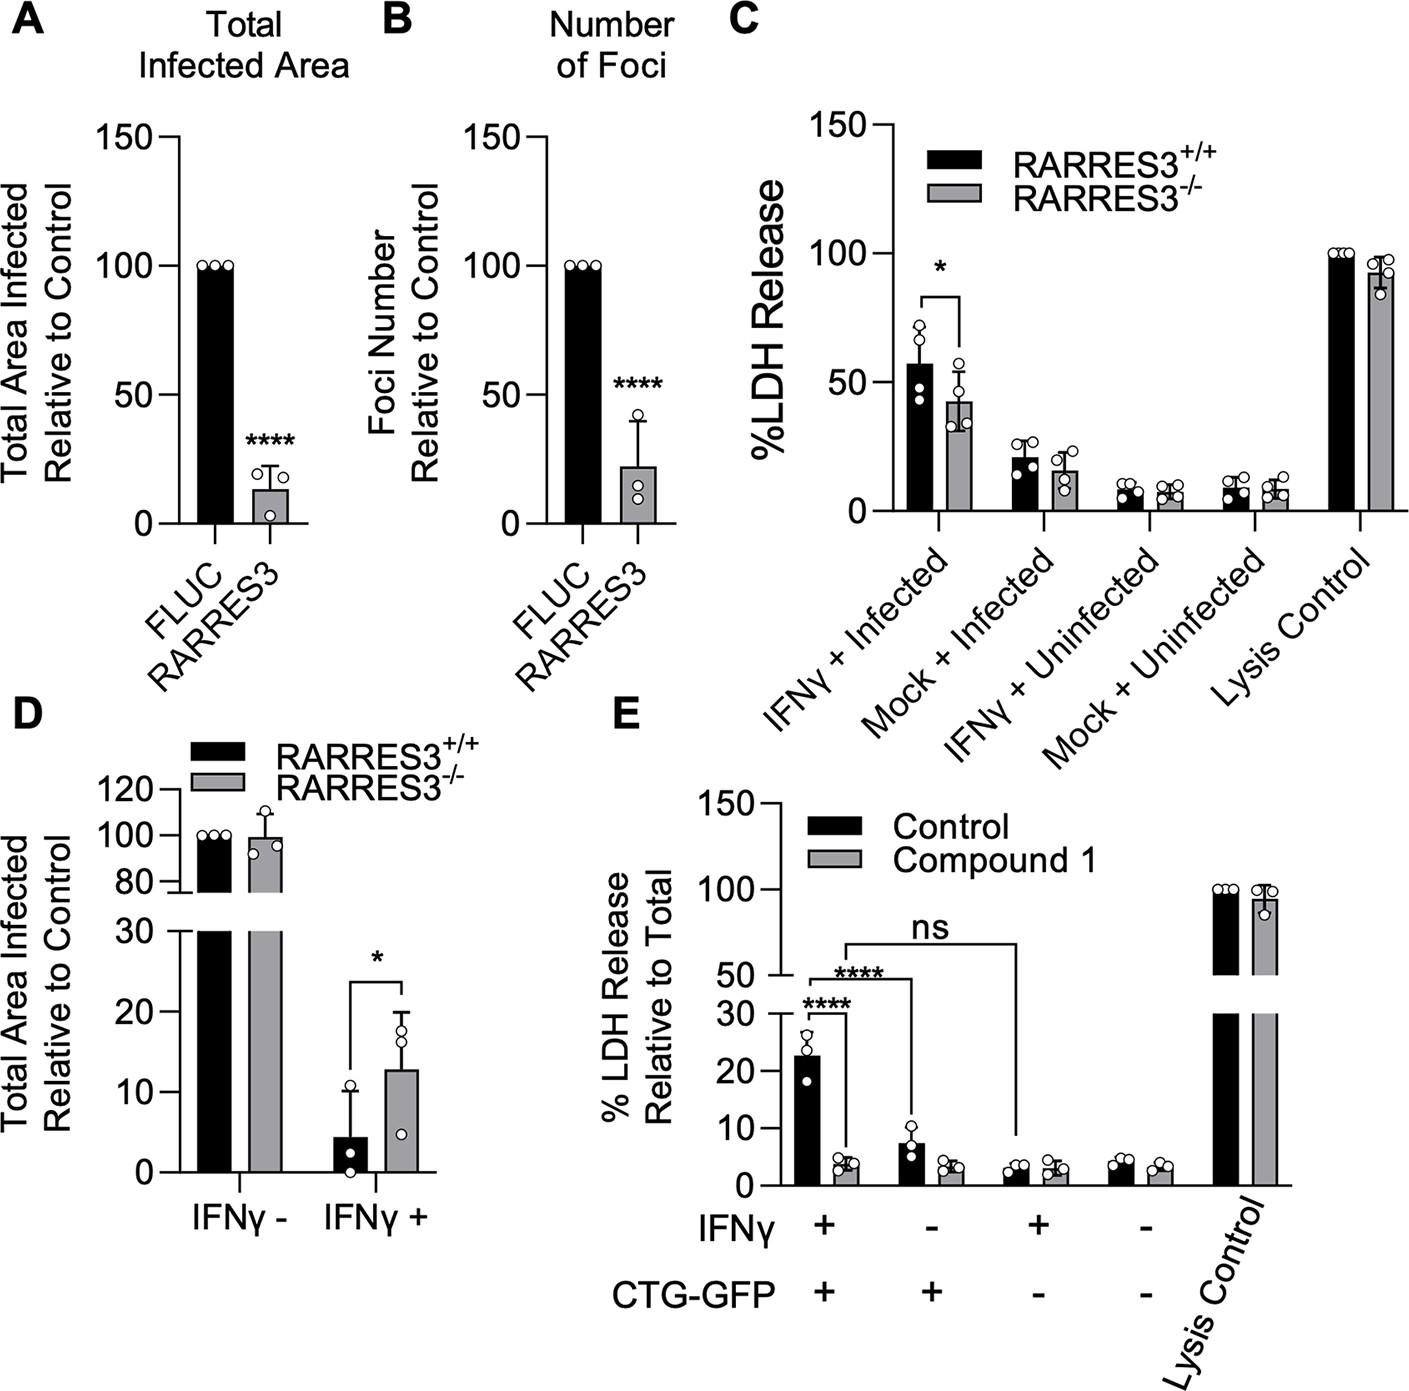
IFNγ-dependent host cell death during infection in HFFs is partially RARRES3 dependent.
(A, B) HFF cells were transduced with TRIP.RARRES3 or TRIP.FLUC control and infected 72 hr later with CTG-GFP for 96 hr. Cells were fixed, stained with anti-GFP and anti-RFP antibodies, and imaged using a Cytation3 Imager. Total infected area per well (A) and average number of infection foci (B) are shown. (C–D) WT HFFs expressing a nontargeting sgRNA control or RARRES3 deficient HFFs were pretreated with or without 1000 U/ml IFNγ for 24 hr. (C) Cells were infected with CTG-GFP for 36 hr. Supernatant was collected and lactate dehydrogenase (LDH) activity was determined. As a control to measure maximal LDH release, cells were lysed before supernatant collection. (D) Cells were infected with CTG-GFP for 96 hr. Samples were treated as in (A). Total infected area per sample is shown. (E) HFFs were infected with CTG-GFP for 36 hr in the presence or absence of 5 µM Compound 1. Supernatant was collected and LDH activity was determined. Data represent means ± standard deviation of three (A, B, D, E) or four (C) biological replicates conducted in technical duplicate (A, B, D, E) or singlet (C). Statistical significance was determined using two-way ANOVA with Tukey’s test for post hoc analysis. *p≤0.05, ***p<0.001, ****p<0.0001.
-
Figure 7—source data 1
Quantitation of total infected area per sample after infection of HFFs ectopically expressing RARRES3 or FLUC with CTG-GFP for 96 hr.
- https://cdn.elifesciences.org/articles/73137/elife-73137-fig7-data1-v3.zip
-
Figure 7—source data 2
Quantitation of average number of infection foci formed after infection of HFFs ectopically expressing RARRES3 or FLUC with CTG-GFP for 96 hr.
- https://cdn.elifesciences.org/articles/73137/elife-73137-fig7-data2-v3.zip
-
Figure 7—source data 3
Absorbance values for lactate dehydrogenase activity assays using supernatants from IFNγ pretreated WT or RARRES3−/− HFF cells infected with CTG-GFP.
- https://cdn.elifesciences.org/articles/73137/elife-73137-fig7-data3-v3.zip
-
Figure 7—source data 4
Quantitation of total infected area per sample after infection of IFNγ pretreated WT or RARRES3−/− HFFs ectopically expressing RARRES3 or FLUC with CTG-GFP for 96 hr.
- https://cdn.elifesciences.org/articles/73137/elife-73137-fig7-data4-v3.zip
-
Figure 7—source data 5
Absorbance values for lactate dehydrogenase activity assays using supernatants from IFNγ pretreated HFF cells infected with CTG-GFP in the presence of Compound 1.
- https://cdn.elifesciences.org/articles/73137/elife-73137-fig7-data5-v3.zip
Videos
Video 1
Live imaging of FLUC control ectopically expressing A549s infected with CTG-GFP in 15 min intervals.
A549 cells were transduced with TRIP.FLUC control and infected 72 hr later with CTG-GFP. Live infection was imaged every 15 min starting 12 hr postinfection until 50 hr postinfection.
Video 2
Live imaging of RARRES3 ectopically expressing A549s infected with CTG-GFP in 15 min intervals.
A549 cells were transduced with TRIP.RARRES3 and infected 72 hr later with CTG-GFP. Live infection was imaged every 15 min starting 12 hr postinfection until 50 hr postinfection.
Tables
Key resources table
| Reagent type (species) or resource | Designation | Source or reference | Identifiers | Additional information |
|---|---|---|---|---|
| Cell line (Homo sapiens) | A549 | ATCC | CCL-185; RRID:CVCL_0023 | |
| Cell line (H. sapiens) | 293T | ATCC | CRL-3216; RRID:CVCL_0063 | |
| Cell line (H. sapiens) | HFF | ATCC | SCRC-1041; RRID:CVCL_3285 | |
| Cell line (H. sapiens) | HeLa | ATCC | CCL-2; RRID:CVCL_0030 | |
| Genetic reagent (H. sapiens) | HeLa reporter cell line expressing ISRE-GLUC | PMID:31413201 | 11×-ISRE-Gaussia Luciferase reporter line | |
| Genetic reagent (H. sapiens) | HeLa reporter cell line expressing GAS-FLUC | PMID:27091930 | HeLa reporter cell line expressing GAS-FLUC | |
| Genetic reagent (H. sapiens) | RARRES3−/− Lung adenocarcinoma (A549) | This paper | See Materials and methods | |
| Genetic reagent (H. sapiens) | IDO1−/− Lung adenocarcinoma (A549) | This paper | See Materials and methods | |
| Strain, strain background (Toxoplasma gondii) | RH88 | ATCC | 50853 | |
| Strain, strain background (T. gondii) | Me49 | ATCC | 50611 | |
| Strain, strain background (T. gondii) | CTG | ATCC | 50842 | |
| Genetic reagent (T. gondii) | RH88-GFP | This paper | See Materials and methods | |
| Genetic reagent (T. gondii) | Me49-GFP | This paper | See Materials and methods | |
| Genetic reagent (T. gondii) | CTG-GFP | This paper | See Materials and methods | |
| Antibody | Anti-RFP (rabbit polyclonal) | Thermo Fisher Scientific | Cat#: R10367; RRID:AB_2315269 | (1:2000) |
| Antibody | Anti-GFP (mouse monoclonal) | Thermo Fisher Scientific | Cat#: A-11120; RRID:AB_221568 | (1:2000) |
| Antibody | Anti-mouse Alexa Fluor 488 (goat polyclonal) | Life Technologies | Cat#: A-11029; RRID:AB_138404 | (1:1000) |
| Antibody | Anti-rabbit Alexa Fluor 568 (goat polyclonal) | Life Technologies | Cat#: A-11011; RRID:AB_143157 | (1:1000) |
| Antibody | Anti-rabbit Alexa Fluor 488 (goat polyclonal) | Invitrogen | Cat#: A-11034; RRID:AB_2576217 | (1:1000) |
| Antibody | Anti-V5 (mouse monoclonal) | Invitrogen | Cat#: R960-25; AB_2556564 | (1:5000) |
| Antibody | Anti-mouse 680RD (goat polyclonal) | LI-COR Biotechnology | Cat#: 926-68070; RRID:AB_10956588 | (1:5000) |
| Antibody | Anti-rabbit 800CW (goat polyclonal) | LI-COR Biotechnology | Cat#: 926-32211; RRID:AB_621843 | (1:5000) |
| Antibody | Anti-actin (mouse monoclonal) | Sigma-Aldrich | Cat#: MAB1501; RRID:AB_2223041 | (1:5000) |
| Antibody | Anti-IDO1 (rabbit monoclonal) | Cell Signaling Technology | Cat#: 86630S; RRID:AB_2636818 | (1:1000) |
| Antibody | Anti-IRF1 D5E4 (rabbit monoclonal) | Cell Signaling Technology | Cat#: 8478S; RRID:AB_10949108 | (1:500) |
| Chemical compound, drug | Necrosulfonamide; NSA | Tocris Biotechnology | Cat#: 5025 | (10 µM) |
| Chemical compound, drug | GSK’872 | Selleck Chemicals | Cat#: S8465 | (5 µM) |
| Chemical compound, drug | Z-YVAD-FMK | Sigma-Aldrich | Cat#: 218,746 | (10 µM) |
| Chemical compound, drug | Z-VAD-FMK | R&D Systems | Cat#: fmk001 | (50 µM) |
| Chemical compound, drug | GSK’963 | Selleck Chemicals | Cat#: S8642 | (1 µM) |
| Chemical compound, drug | Compound 1 | MedChemExpress | Cat#: HY-101525 | (5 µM) |
| Chemical compound, drug | Hoechst stain; Hoechst 33342 | Invitrogen | Cat#: H3570 | (1 µg/ml) |
| Chemical compound, drug | SYTOX Green | Invitrogen | Cat#: S7020 | (5 µM) |
| Chemical compound, drug | XtremeGene9 DNA Transfection Reagent | Roche | Cat#: XTG9-RO | |
| Recombinant DNA reagent | pHAGE NFkB-TA-LUC-UBC-GFP-W (plasmid) | Addgene | 49,343 | |
| Recombinant DNA reagent | plentiCRISPRv2 (plasmid) | Addgene | 52,961 | |
| Recombinant DNA reagent | pLenti-Cas9-GFP (plasmid) | Addgene | 86,145 | |
| Recombinant DNA reagent | pTRIP.RARRES3 (plasmid) | PMID:21478870 | pTRIP.CMV.IVSb.RARRES3.ires.TagRFP | |
| Recombinant DNA reagent | pTRIP.V5-RARRES3 WT (plasmid) | This paper | See Materials and methods | |
| Recombinant DNA reagent | pTRIP.V5-RARRES3 C113A (plasmid) | This paper | See Materials and methods | |
| Recombinant DNA reagent | pTRIP.V5-RARRES3 C113S (plasmid) | This paper | See Materials and methods | |
| Recombinant DNA reagent | pDONR221 (plasmid) | Invitrogen | Cat#: 12536017 | |
| Recombinant DNA reagent | pTRIP.FLUC (plasmid) | PMID:21478870 | pTRIP.CMV.IVSb.FLUC.ires.TagRFP | |
| Recombinant DNA reagent | pTRIP.IRF1 (plasmid) | PMID:21478870 | pTRIP.CMV.IVSb.IRF1.ires.TagRFP | |
| Recombinant DNA reagent | pTRIP.GBP2 (plasmid) | PMID:21478870 | pTRIP.CMV.IVSb.GBP2.ires.TagRFP | |
| Recombinant DNA reagent | pVSVg (plasmid) | PMID:21478870 | Plasmid expressing the vesicular stomatitis virus glycoprotein (VSVg) | |
| Recombinant DNA reagent | pGag-pol (plasmid) | PMID:21478870 | Plasmid expressing HIV gag-pol | |
| Recombinant DNA reagent | pGRA1.GFP.GRA2.DHFR (plasmid) | This paper | See Materials and methods | |
| Commercial assay or kit | CyQuant LDH Cytotoxicity Assay Kit | Invitrogen | Cat#: C20300 | |
| Commercial assay or kit | Luciferase cell culture lysis reagent (5×) | Promega | Cat#: E1531 | |
| Commercial assay or kit | Luciferase Assay System | Promega | Cat#: E1500 | For firefly luciferase |
| Commercial assay or kit | Pierce Gaussia Luciferase Glow Assay Kit | Thermo Fisher Scientific | Cat#: 16160 | For Gaussia luciferase |
| Peptide, recombinant protein | Q5 High Fidelity DNA Polymerase | NEB | Cat#: M0491 | Recombinant fragment and plasmid amplification |
| Peptide, recombinant protein | PrimeSTAR GXL DNA Polymerase | Tocris Biotechnology | Cat#: R050 | Genomic DNA amplification |
| Peptide, recombinant protein | BsmBI-v2 | NEB | Cat#: R0739 | |
| Peptide, recombinant protein | BP Clonase II | Thermo Fisher Scientific | Cat#: 11789-020 | |
| Peptide, recombinant protein | LR Clonase II | Thermo Fisher Scientific | Cat#: 11791-020 | |
| Software, algorithm | CellProfiler | BROAD Institute | RRID:SCR_007358 | Version 3.1.9 |
| Software, algorithm | GraphPad Prism | GraphPad | RRID:SCR_002798 | Version 3.1.2 |
| Software, algorithm | ImageJ | National Institutes of Health | RRID:SCR_003070 | Version 1.53f51 |
| Software, algorithm | ZEN Blue | Zeiss | RRID:SCR_013672 | Version 2.5 |
Additional files
-
Supplementary file 1
Summary of overexpression screen in A549 cells.
- https://cdn.elifesciences.org/articles/73137/elife-73137-supp1-v3.xlsx
-
Supplementary file 2
List of genes induced by IRF1 ectopic expression or IFNγ treatment in A549 cells.
- https://cdn.elifesciences.org/articles/73137/elife-73137-supp2-v3.xlsx
-
Supplementary file 3
Comparison of genes induced by IRF1 or IFNγ with genes in the type II ISG screen library.
- https://cdn.elifesciences.org/articles/73137/elife-73137-supp3-v3.xlsx
-
Supplementary file 4
List of primer sets used.
- https://cdn.elifesciences.org/articles/73137/elife-73137-supp4-v3.docx
-
Transparent reporting form
- https://cdn.elifesciences.org/articles/73137/elife-73137-transrepform1-v3.docx
-
Source data 1
GFP channel of live video microscopy for CTG-GFP infection in A549 cells ectopically expressing FLUC control.
- https://cdn.elifesciences.org/articles/73137/elife-73137-data1-v3.zip
-
Source data 2
Phase channel of live video microscopy for CTG-GFP infection in A549 cells ectopically expressing FLUC control.
- https://cdn.elifesciences.org/articles/73137/elife-73137-data2-v3.zip
-
Source data 3
GFP channel of live video microscopy for CTG-GFP infection in A549 cells ectopically expressing RARRES3 control.
- https://cdn.elifesciences.org/articles/73137/elife-73137-data3-v3.zip
-
Source data 4
Phase channel of live video microscopy for CTG-GFP infection in A549 cells ectopically expressing RARRES3 control.
- https://cdn.elifesciences.org/articles/73137/elife-73137-data4-v3.zip
Download links
A two-part list of links to download the article, or parts of the article, in various formats.
Downloads (link to download the article as PDF)
Open citations (links to open the citations from this article in various online reference manager services)
Cite this article (links to download the citations from this article in formats compatible with various reference manager tools)
Overexpression screen of interferon-stimulated genes identifies RARRES3 as a restrictor of Toxoplasma gondii infection
eLife 10:e73137.
https://doi.org/10.7554/eLife.73137


