The molecular mechanism of load adaptation by branched actin networks
- Department of Bioengineering & Biophysics Program, University of California, Berkeley, United States
- Division of Biological Systems & Engineering, Lawrence Berkeley National Laboratory, United States
- Advanced Science Research Center, City University of New York, United States
- Department of Cellular and Molecular Pharmacology and Howard Hughes Medical Institute, University of California, San Francisco, United States
- Department of Systemic Cell Biology, Max Planck Institute of Molecular Physiology, Germany
- Department of Chemistry, University of California, Berkeley, United States
- Chan Zuckerberg Biohub, United States
Figures
Figure 1 with 1 supplement

Effect of mechanical load on branched actin network assembly.
(A) Schematic illustration of actin networks generated by profilin-actin, the Arp2/3 complex and capping protein from surfaces coated with NPF (WAVE1ΔN). Conditions are 5 μM actin (1% Alexa 488-labeled), 5 μM profilin, 100 nM Arp2/3 (5% Alexa647-labeled), 100 nM CP (15% TMR-labeled) if not indicated otherwise. (B) Representative TIRFM images of Alexa488-actin (top), TMR-CP (middle) and Alexa647-Arp2/3 (bottom) incorporation into dendritic actin networks at indicated growth stress. (C) Top: Height (red) and stress (black) as a function of time for a representative growing network. The stress was kept constant at a defined setpoint via the feedback mechanism of the AFM (‘‘force-clamp mode’’) until the height change over time appeared linear and the network composition was constant, which means that a steady state in network assembly was reached. The stress was then raised to a higher setpoint, to which the network responded by a rapid adaptation, followed by a new steady state assembly phase. Network growth velocities and densities of components as a function of growth stress were determined from the linear, steady-state phases (grey areas). Bottom: Quantification of average fluorescent intensities for indicated protein components (left y-axis, colored lines) for networks either subjected to step-wise increasing loads (dark colors; applied stress is shown in the right y-axis (black lines)) or adjacent control networks growing in the same chamber in the absence of load (bright colors, see also Figure 1—figure supplement 1). (D) Top: Quantification of average fluorescent intensities for indicated network components as a function of applied load. Measurements are from for n=15 actin networks from N=5 independent experiments. Bottom: Corresponding average growth velocities (from n=12 actin networks from N=4 independent experiments) and average free barbed end densities (from n=21 actin networks; N=7 independent experiments) as measured by an ‘arrest-and-label’ approach as described in Bieling et al., 2016. Error bars represent ± SD (standard deviation).
-
Figure 1—source data 1
Quantification of network height, growth stress, and fluorescence intensities of network components.
- https://cdn.elifesciences.org/articles/73145/elife-73145-fig1-data1-v2.xlsx
Figure 1—figure supplement 1
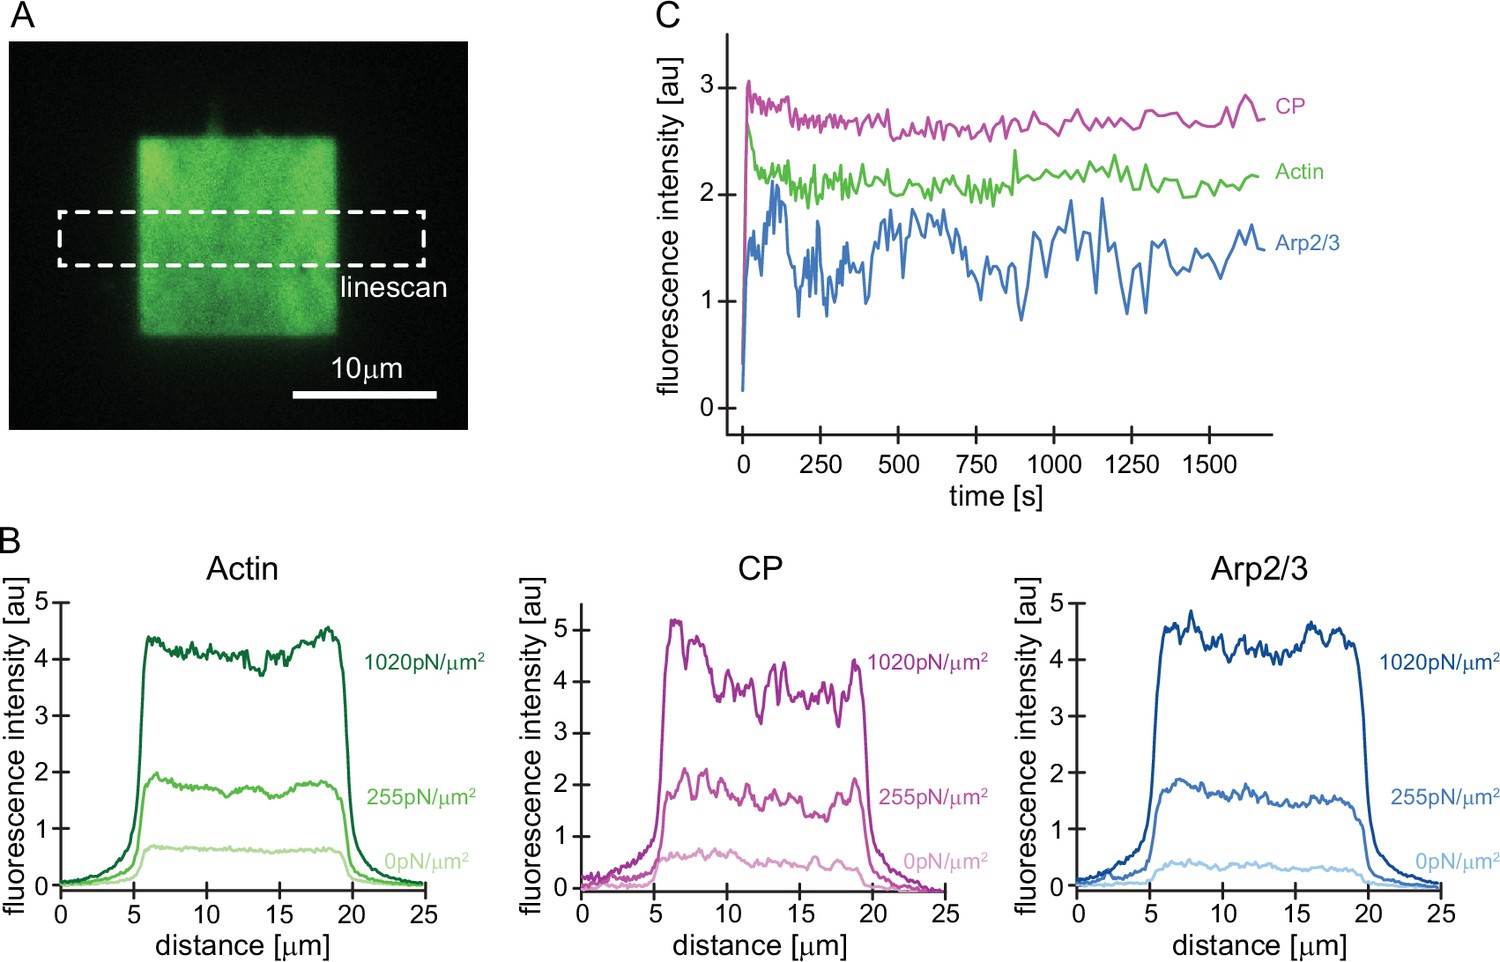
Uniform incorporation of all network components across the NPF surface.
(A) Representative TIRFM images of Alexa488-actin incorporation into dendritic actin networks. Local fluorescence densities were analyzed for all network components by scans of a 25 µm long x 4 µm wide line across the network. (B) Local fluorescence intensities of actin (left, green), CP (middle, magenta), or Arp2/3 (right, blue) analyzed by linescans as illustrated in A at indicated growth stresses. Note that the steady-state density is even and does not strongly vary across the network axis. (C) Whole-network fluorescence intensity of indicated components for control networks grown in the absence of external load as a function of time (same experiment as shown in Figure 1D).
-
Figure 1—figure supplement 1—source data 1
Quantification of the spatial distribution of network components and time-dependence of their incorporation.
- https://cdn.elifesciences.org/articles/73145/elife-73145-fig1-figsupp1-data1-v2.xlsx
Figure 2
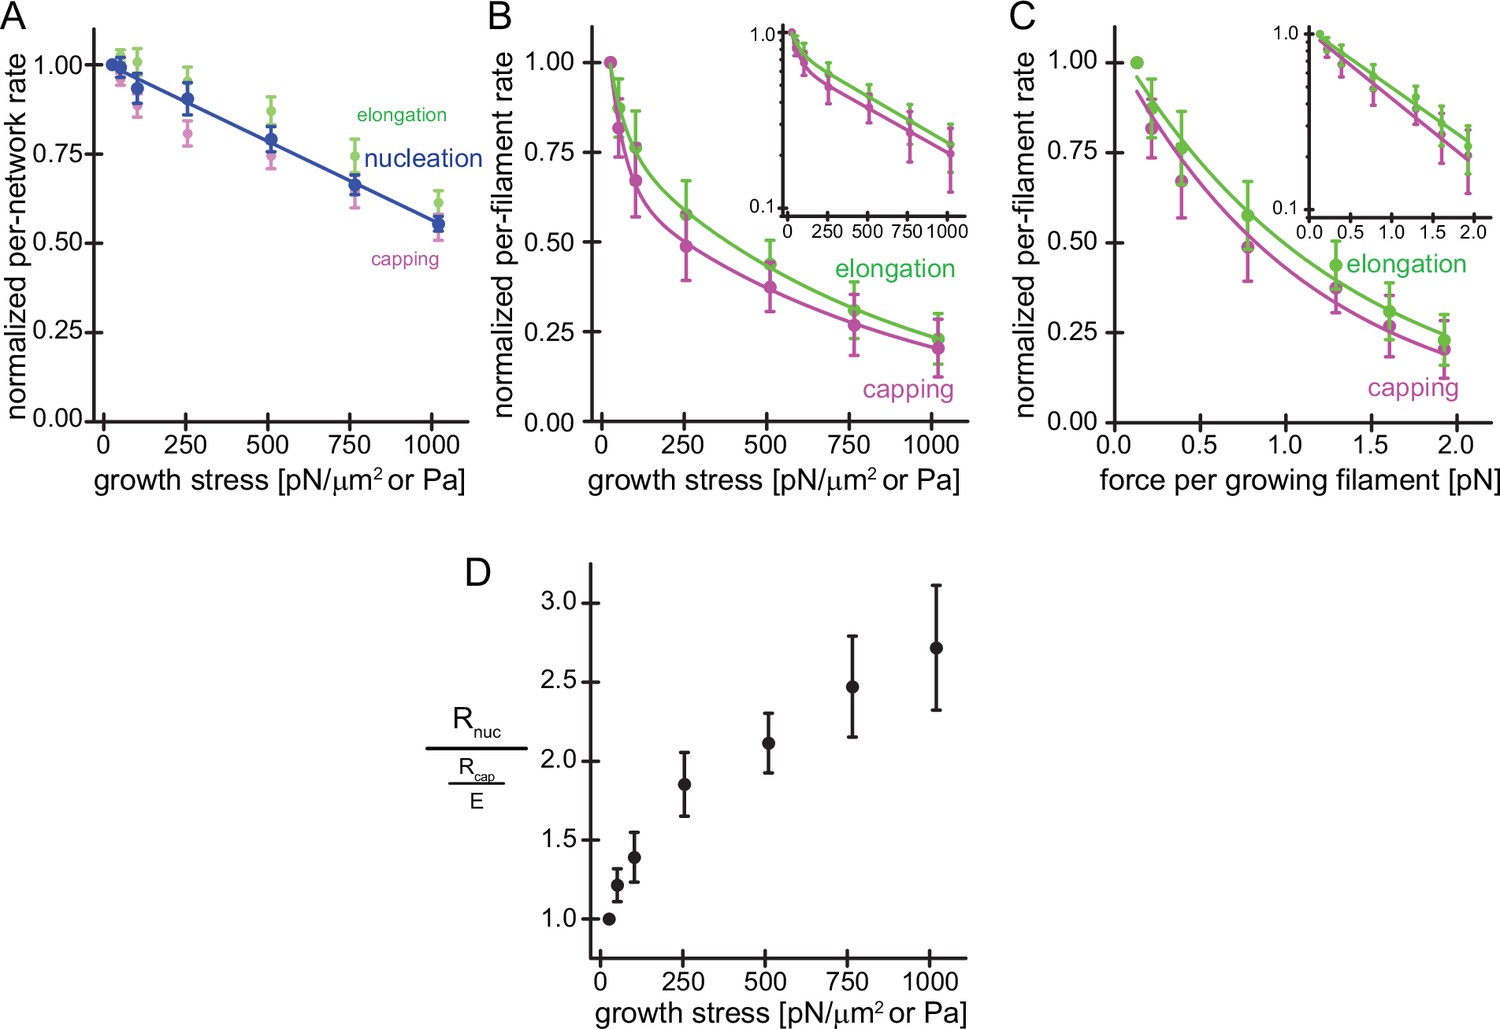
Load on branched actin network assembly decreases nucleation and.
(A) Average per-network rates of filament elongation (green), capping (magenta), and nucleation (blue) calculated by the product of the bulk fluorescence intensities and the network growth velocity (Figure 1D) normalized to the flux at 25pN/μm2 as a function of external load. The line is a linear fit to the nucleation rate data. Error bars are SEM. (B) Average per-filament rates of filament elongation (green) and capping (magenta) as determined by normalizing their per-network rates (shown in A) by the relative density of free barbed ends (Figure 1D) as a function of external load. Lines are fits to double exponential decay functions. Inset: Semi-logarithmic plots of the same data. (C) Average per-filament rates of filament elongation (green) and capping (magenta) as a function of force per growing filament end. Lines are fits to single exponential decay functions. Inset: Semi-logarithmic plots of the same data. Error bars are SEM. (D) Ratio of the per-network nucleation and the per-filament capping rates as a function of external load. Error bars are ± SEM (standard error of the mean).
-
Figure 2—source data 1
Quantification of network incorporation rates of Actin, CP and Arp2/3.
- https://cdn.elifesciences.org/articles/73145/elife-73145-fig2-data1-v2.xlsx
Figure 3 with 1 supplement
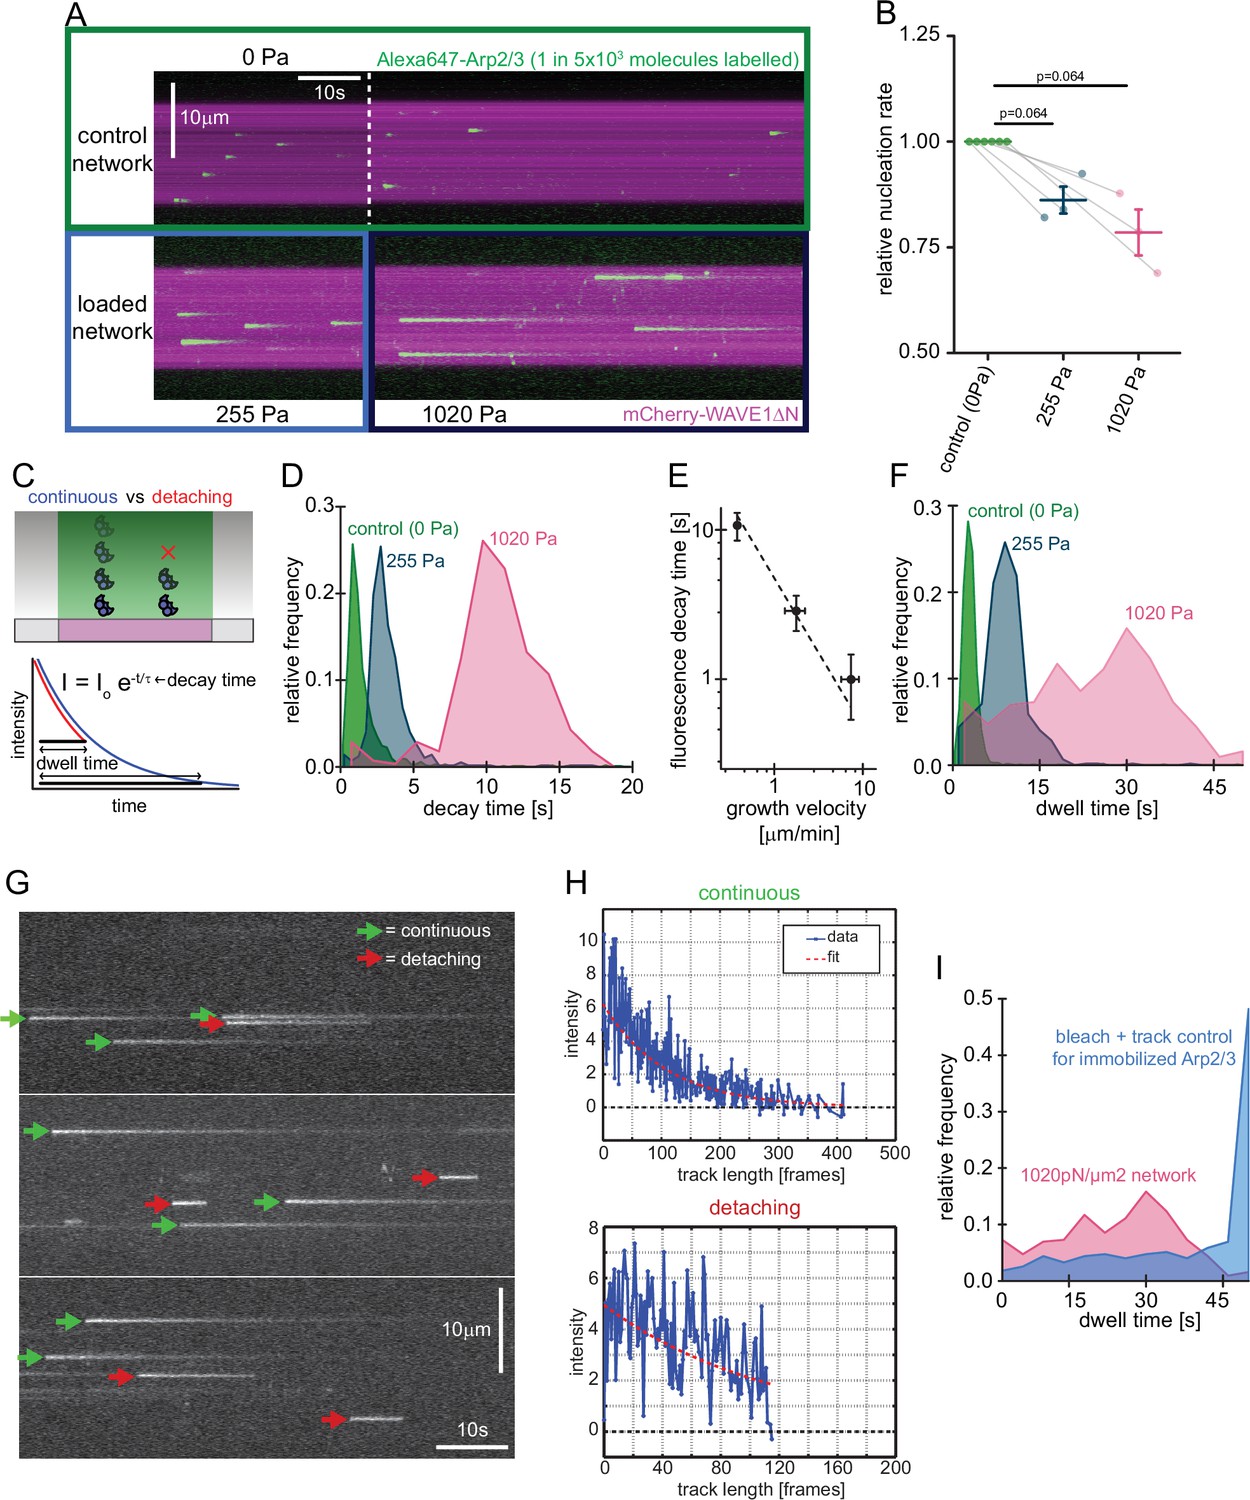
Single molecule characterization of force-dependent Arp2/3 nucleation.
(A) Kymographs of single molecule nucleation on NPF surfaces (mCherry-WAVE1ΔN, magenta) by spike-in of a small fraction of Alexa647-Arp2/3 (green, c=20 pM) into the overall Arp2/3 pool (100 nM) at indicated applied stress (lower panel) or in an adjacent unloaded control network (upper panel). (B) Mean nucleation rates determined by single molecule imaging normalized to the nucleation rate in an adjacent unloaded control network at indicated growth stress from N=3 independent experiments. Pairs of control and loaded network are measured in the same flow chamber in a large field of view as illustrated by the lines linking two data points. Error bars are SEM. p-values were derived from paired Wilcoxon signed rank tests. (C) Scheme of single-molecule Arp2/3 dynamics followed by TIRF microscopy. Exponential decay of Arp2/3 fluorescence reflects movement of the fluorophore away from the coverslip driven by actin filament assembly. Some Arp2/3 molecules remain attached to the growing actin network for their entire transit through the TIRF illumination field (blue) whereas others detach from the network while still detectable by TIRF Illumination (red). Individual intensity trajectories, therefore, reflect either the transit time through the evanescent field or the time to detachment (dwell time). (D) Normalized frequency of fluorescence transit times of single Alexa 647-Arp2/3 complexes (n=1109, 594, and 318 Arp2/3 molecules at 0, 255, and 1020 Pa growth stress from N=3 independent experiments) in networks assembled at indicated stress. (E) Double-logarithmic plot of the mean fluorescence transit time (+/-SD) as a function of network growth velocity. The dashed line show perfect reciprocal correlation (slope = –1). (F) Normalized frequency of fluorescence dwell times of single Alexa 647-Arp2/3 complexes (n=1109, 594, and 318 Arp2/3 complexes at 0, 255, and 1020 Pa growth stress from N=3 independent experiments) in networks assembled at indicated stress. (G) Examples of kymographs from TIRF microscopy of individual Arp2/3 complexes in networks under high load (1020 pN/m2). Individual complexes are either continuously moving towards the rear of the evanescent field (continuous, green arrows) or dissociating prematurely (abortive, red arrows). (H) Representative time courses of fluorescence intensity for individual Arp2/3 complexes as a function of number of imaging frames categorized as either continuous (top panel) or abortive (bottom panel). (I) Relative frequency of dwell times for Arp2/3 complexes in dendritic networks at high load (1020pN/m2, red, n=318 Arp2/3 molecules from N=3 independent experiments) compared to the bleaching and loss of tracking control for surface-immobilized Arp2/3 complexes (blue, see Figure 3—figure supplement 1, n=274 Arp2/3 complexes from N=3 independent experiments). Note that the frequency of early loss events is exceeding the combined bleaching and tracking loss frequency.
-
Figure 3—source data 1
Quantification of branching nucleation from single molecule Arp2/3 imaging.
- https://cdn.elifesciences.org/articles/73145/elife-73145-fig3-data1-v2.xlsx
Figure 3—figure supplement 1
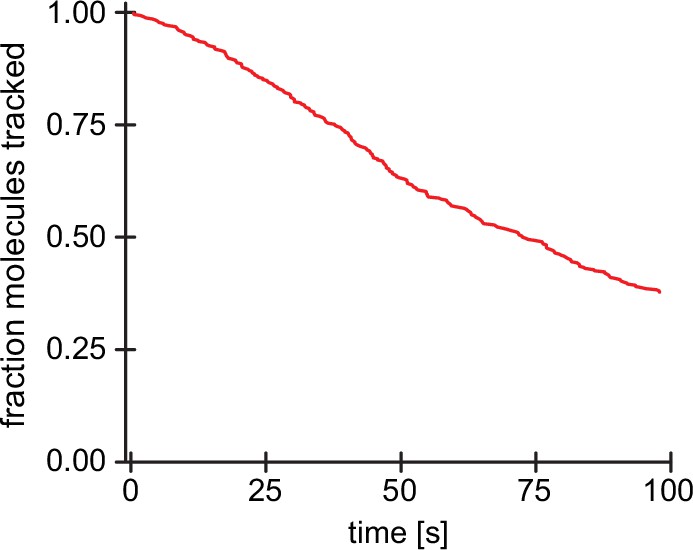
Tracking and bleaching control for single surface-immobilized Arp2/3 complexes.
Survival function of tracked molecules for surface-immobilized Arp2/3 complexes (n=274 Arp2/3 molecules from N=3 independent experiments) as a function of time under the same imaging conditions as for network-associated Arp2/3. Loss of molecules is based on both bleaching and loss of tracking.
-
Figure 3—figure supplement 1—source data 1
Comparison of biochemical activities, effects on actin network architecture, and diffusion of wildtype and biulky mutant capping proteins.
- https://cdn.elifesciences.org/articles/73145/elife-73145-fig3-figsupp1-data1-v2.xlsx
Figure 4 with 1 supplement
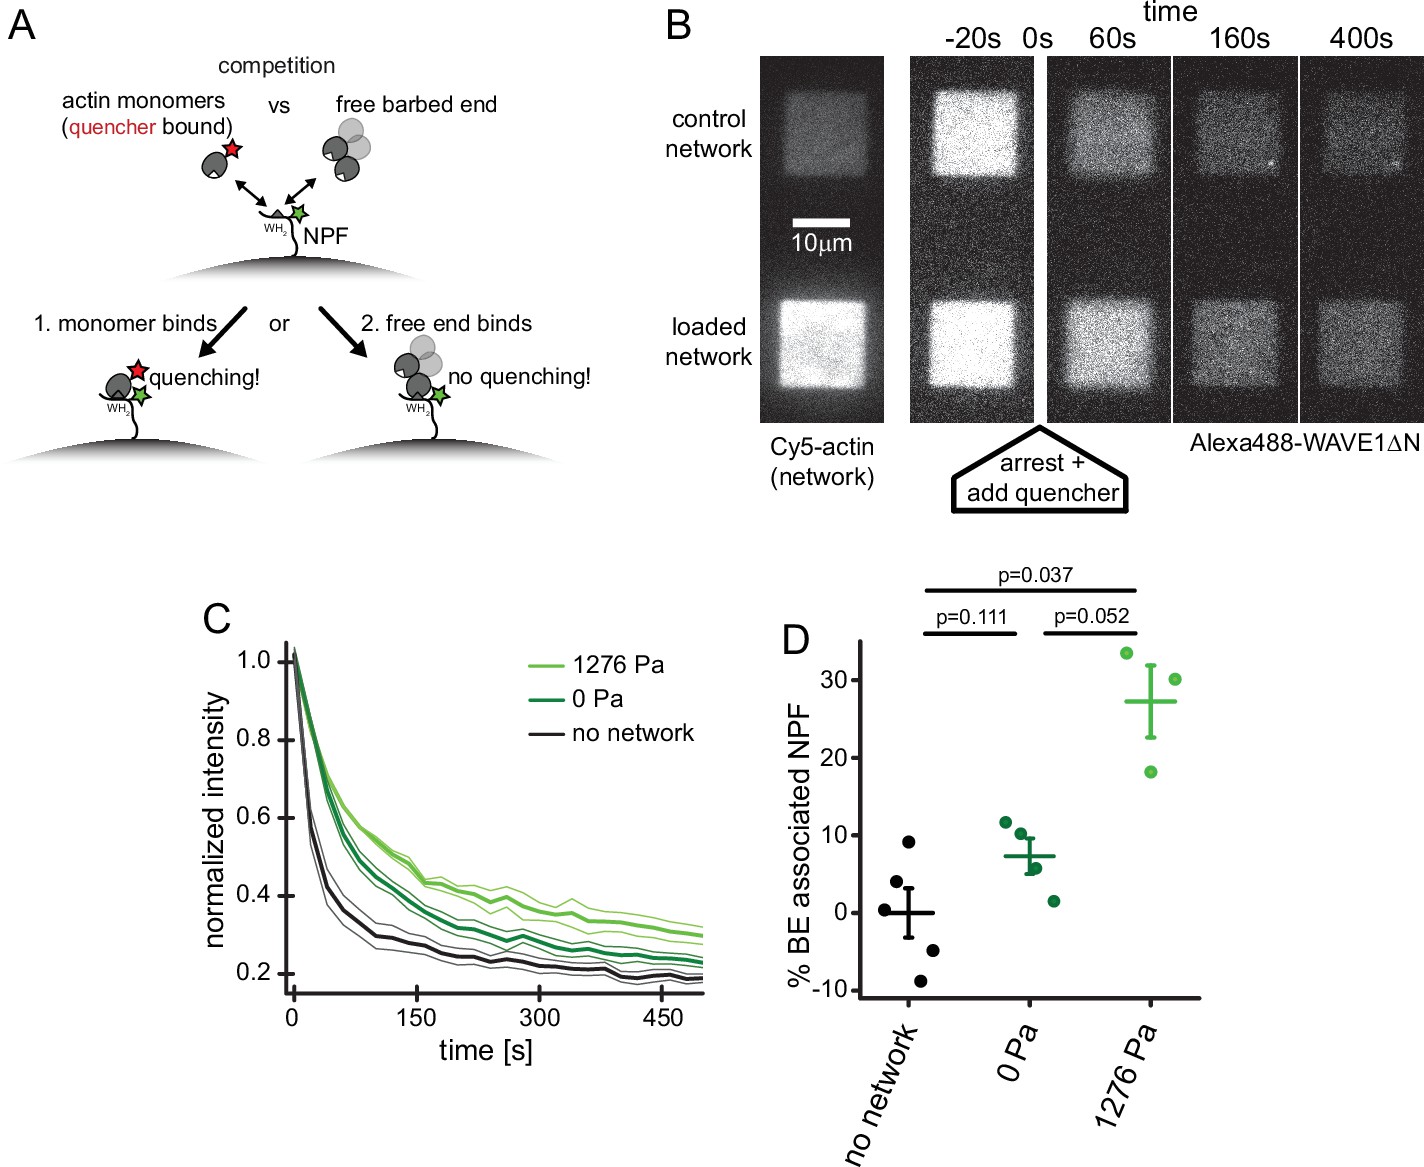
Free barbed ends bind and sequester the WH2 domain of the NPF in a load-dependent manner.
(A) Scheme of the FRET setup. Surface-bound, donor- (Alexa488-) labeled NPF molecules can interact with either quencher- (Atto540Q-) labeled actin monomers resulting in decrease of donor fluorescence or unlabeled terminal protomers of uncapped barbed ends resulting in no change in fluorescence. The terminal protomers are unlabeled since quencher-labeled monomers are introduced only upon network arrest. (B) Time lapse TIRF microscopy images of Alexa 647-Actin (left image) or Alexa 488-WAVEΔN (FRET donor, other images) at indicated times after addition of 200 μl fixation and quenching mix (t=0, 30 μM LatB, 30 μM phalloidin, 5 μM Atto540Q-actin, 7 μM profilin, 37.5 μM myotrophin/V1 (CP inhibitor)) to 100 μl network assembly mix. (C) Averaged time-courses of the Alexa 488-WAVEΔN signal following the addition of quencher-labelled monomers at t=0 as shown in B for N=5, 4, and 3 experiments for no network, 0 Pa or 1278 Pa growth stress networks. Error indicators are SEM. (D) Mean fraction of barbed end-associated NPF molecules in either in the absence of an actin network (black) or in the presence of a non-loaded (dark green) or 1276 Pa loaded (light green) network (see Materials and methods). N=5, 4, and 3 experiments for no network, 0 Pa or 1278 Pa growth stress networks. Error bars are SEM. p-Values were derived from Mann–Whitney U tests.
-
Figure 4—source data 1
Quantification of actin monomer binding by surface-immobilized WAVE1ΔN molecules as measured by FRET.
- https://cdn.elifesciences.org/articles/73145/elife-73145-fig4-data1-v2.xlsx
Figure 4—figure supplement 1
Comparison of biochemical activities, effects on actin network architecture, and diffusion of wildtype and biulky mutant capping proteins.
Figure 5 with 2 supplements
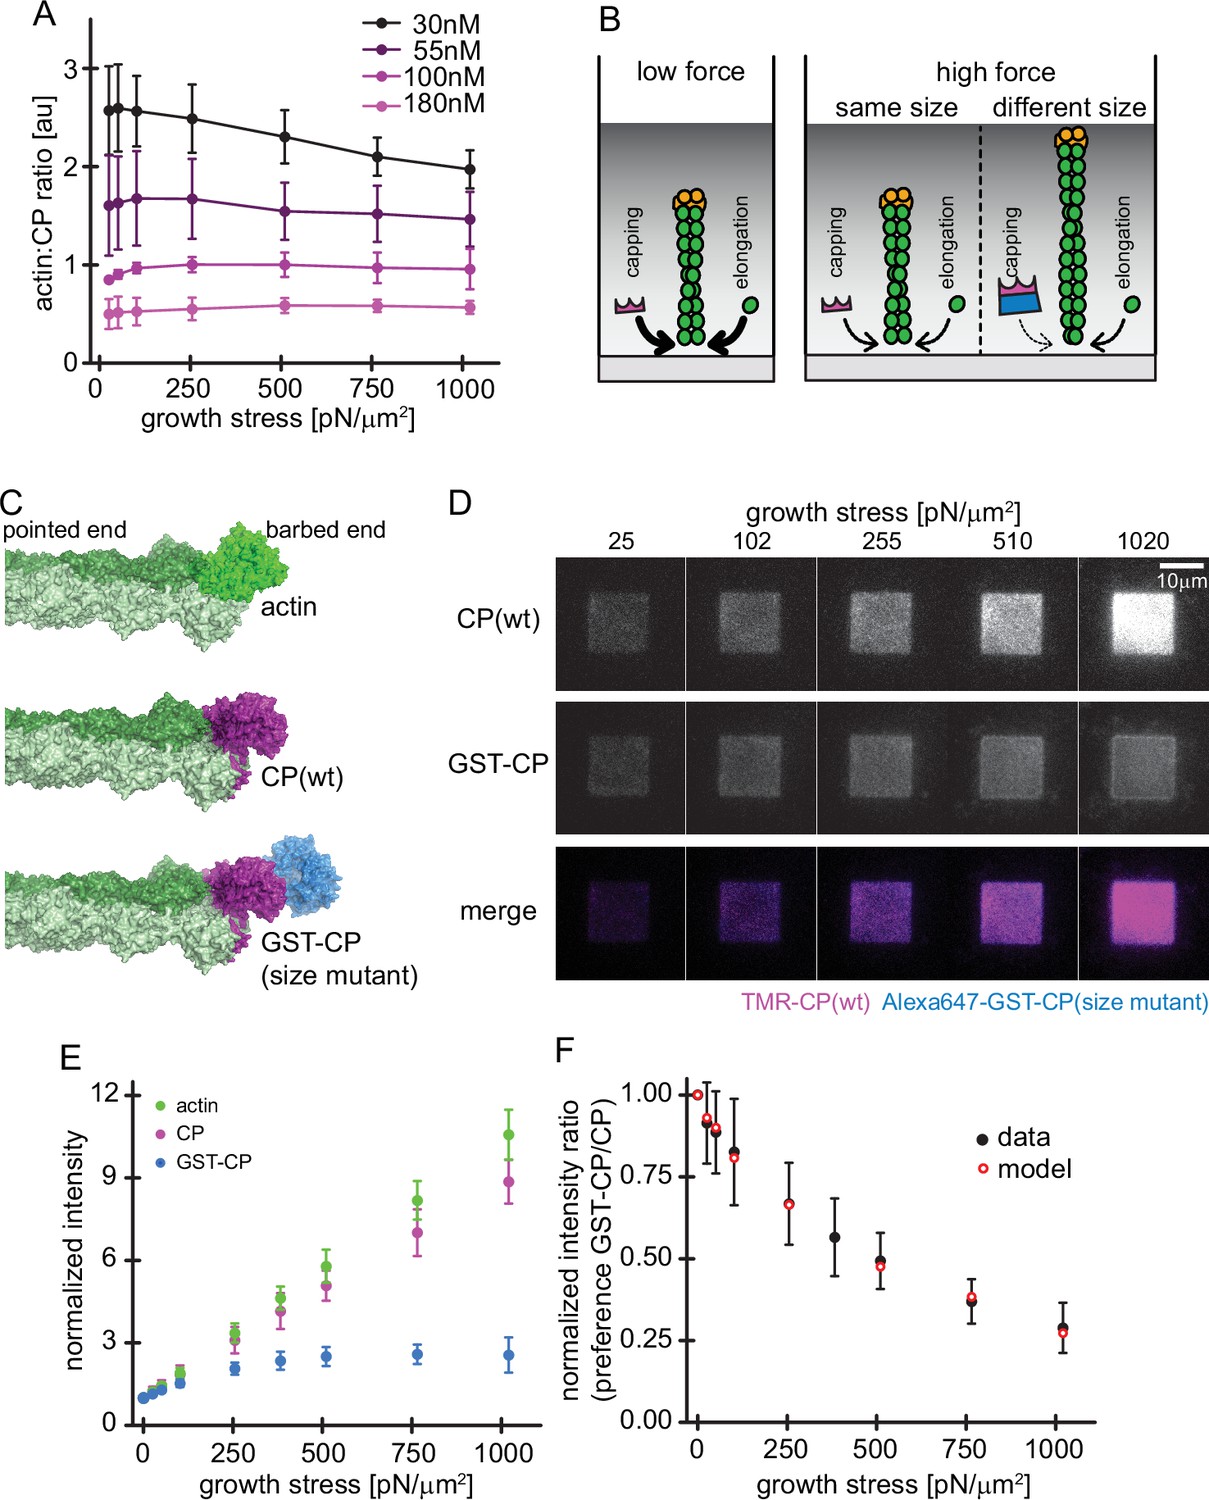
Load dependence of capping and a direct test of the elastic Brownian theory of force generation by actin networks.
(A) Average ratios of capping protein to actin fluorescence for networks grown at different CP concentrations as indicated as a function of load (see Figure 4—figure supplement 1). Error bars are SD. N=3 independent experiments for each CP concentration used. (B) Illustration of the consequences of load dependence of capping and polymerization. Low load allows for high capping and polymerization rates (left panel). A similar load dependence of these two processes maintains filament length at high load (middle panel), whereas a difference in load dependence leads to changes in filament length (right panel). (C) Structural models of a filament barbed end (light and dark green) bound by either an additional actin monomer (top panel, bright green), a wt CP heterodimer (middle panel, magenta) or an engineered GST and CP dimer fusion (‘bulky variant’, bottom panel, magenta = CP, blue = GST). (D) TIRFM images of dendritic actin networks (top panel = TMR CP (wt), middle panel = Alexa647-GST-CP (bulky variant) and bottom panel = color merge) at indicated stress. Networks were assembled at standard conditions, except that CP (wt) concentration was 90 nM (of which 10 nM were TMR-CP) and Alexa647-GST-CP concentration was 10 nM. (E) Mean Alexa 488-actin, TMR-CP(wt) or Alexa 647-GST-CP (bulky variant) intensity normalized to the intensity of an adjacent unloaded network as a function of load. Error bars are SD. N=4 independent experiments. (F) Measured mean fluorescence intensity ratios of CP(wt)/GST-CP(bulky variant) normalized to the intensity ratio of an adjacent unloaded network as a function of load. Error bars are SD. N=4 independent experiments. Red open circles are derived from the Brownian Ratchet Model (see Appendix 1).
-
Figure 5—source data 1
Quantification of concentration and load dependence of filament capping.
- https://cdn.elifesciences.org/articles/73145/elife-73145-fig5-data1-v2.xlsx
Figure 5—figure supplement 1
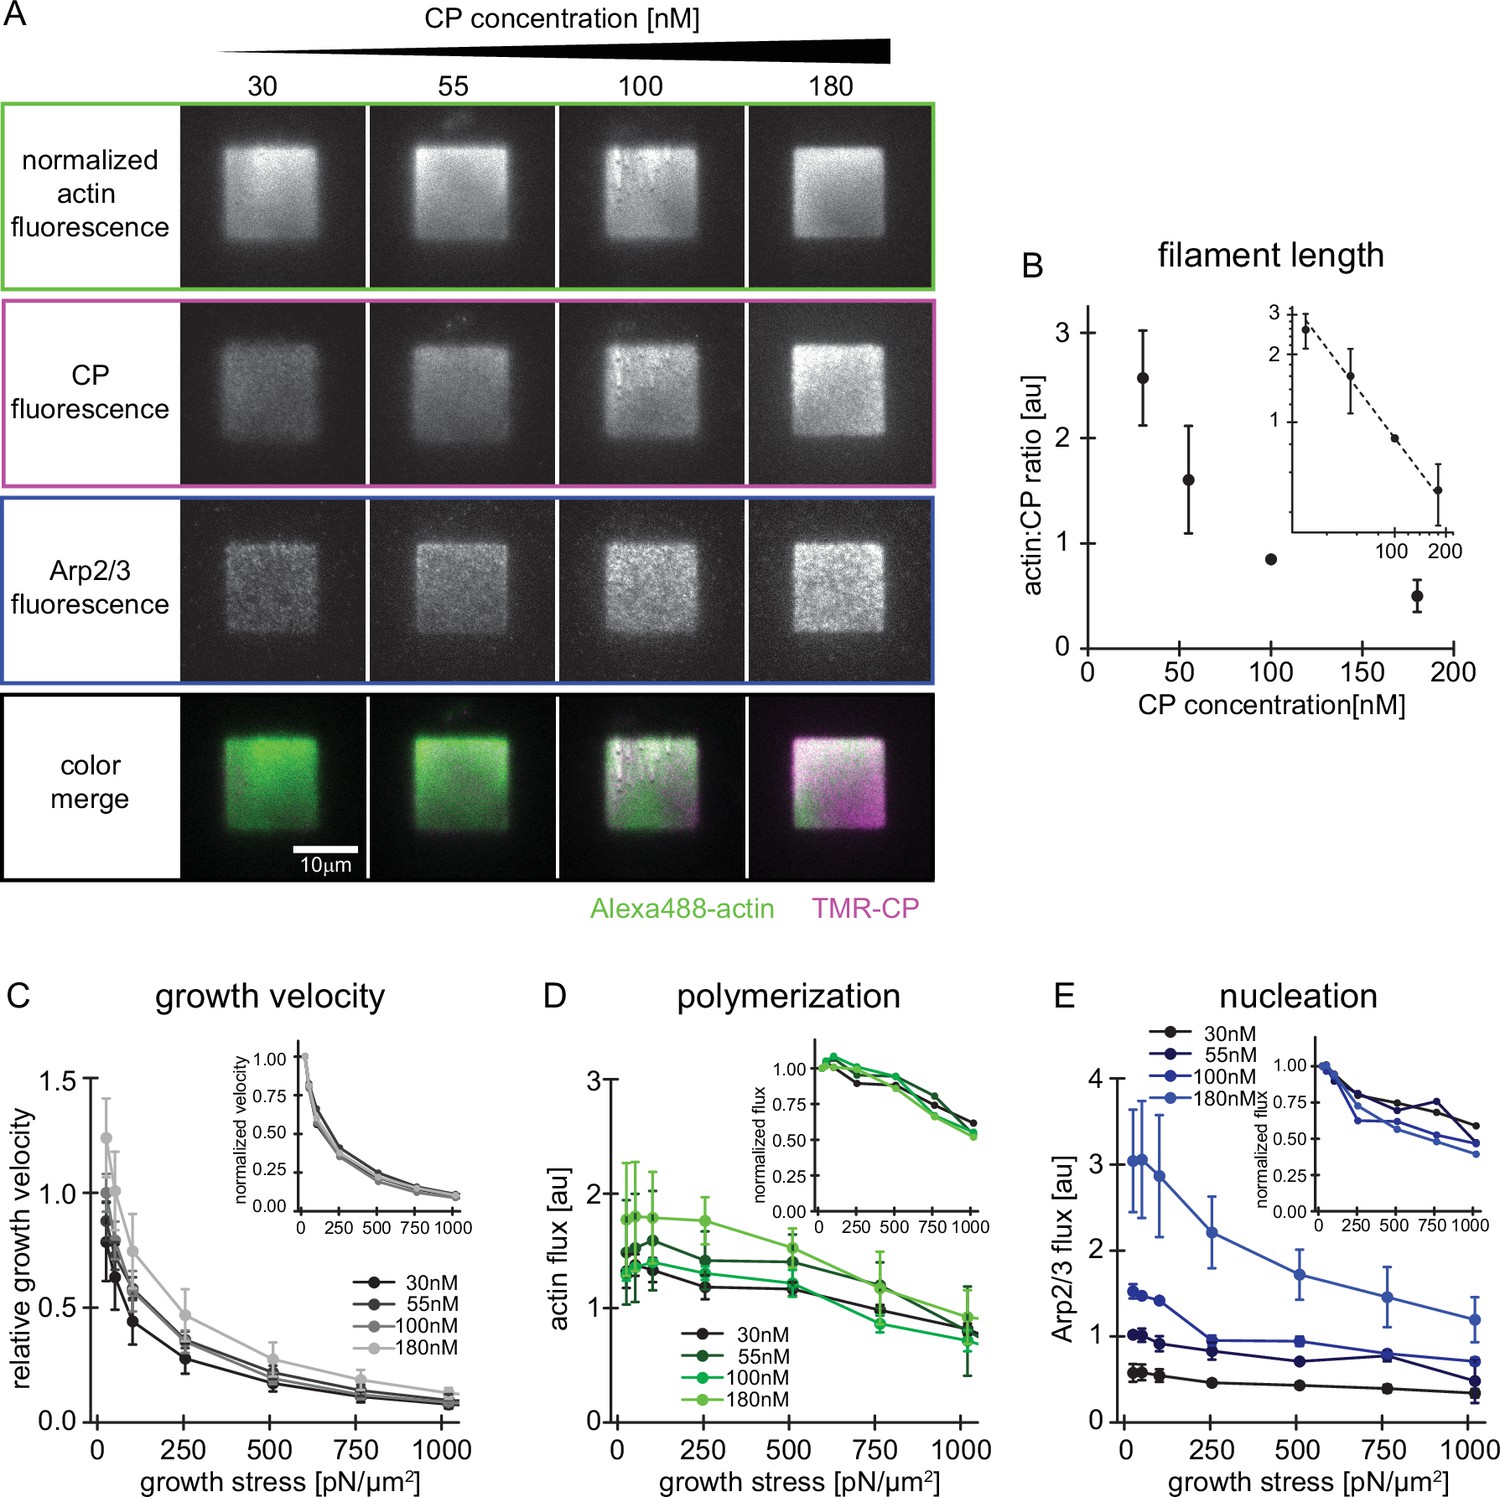
Characterization of network assembly at various CP concentrations.
(A) Representative TIRFM images of individual protein constituents as indicated in growing actin networks loaded with low (25 Pa) growth stress. Conditions were 5 µM profilin-actin (1%Alexa488-actin), 100 nM Arp2/3 (5% Alexa647-Arp2/3) and CP concentrations as indicated (15% TMR-CP). (B) Relative filament length as calculated from the actin:CP ratio as a function of the total CP concentration. Inset: Double-logarithmic plot. N=3 independent experiments for each CP concentration used. (C) Relative network growth velocities normalized to the standard condition (25 Pa growth stress at 100 nM CP) for networks growing in the presence of various CP concentrations as indicated. Inset: same data but normalized to the growth velocity at 25 Pa at the same CP concentration. N=3 independent experiments for each CP concentration used. (D) Relative actin flux determined by the product of the bulk Alexa488-actin fluorescence intensity (as in A) and the corresponding growth velocity (as in C). Inset: Same data but normalized to the actin flux at 25 Pa at the same CP concentration. N=3 independent experiments for each CP concentration used. (E) Relative Arp2/3 flux determined by the product of the bulk Alexa647-Arp2/3 fluorescence intensity (as in A) and the corresponding growth velocity (as in C). Inset: Same data but normalized to the Arp2/3 flux at 25 Pa at the same CP concentration. Error bars are SD. N=3 independent experiments for each CP concentration used.
-
Figure 5—figure supplement 1—source data 1
Quantification of network assembly at various CP concentrations.
- https://cdn.elifesciences.org/articles/73145/elife-73145-fig5-figsupp1-data1-v2.xlsx
Figure 5—figure supplement 2

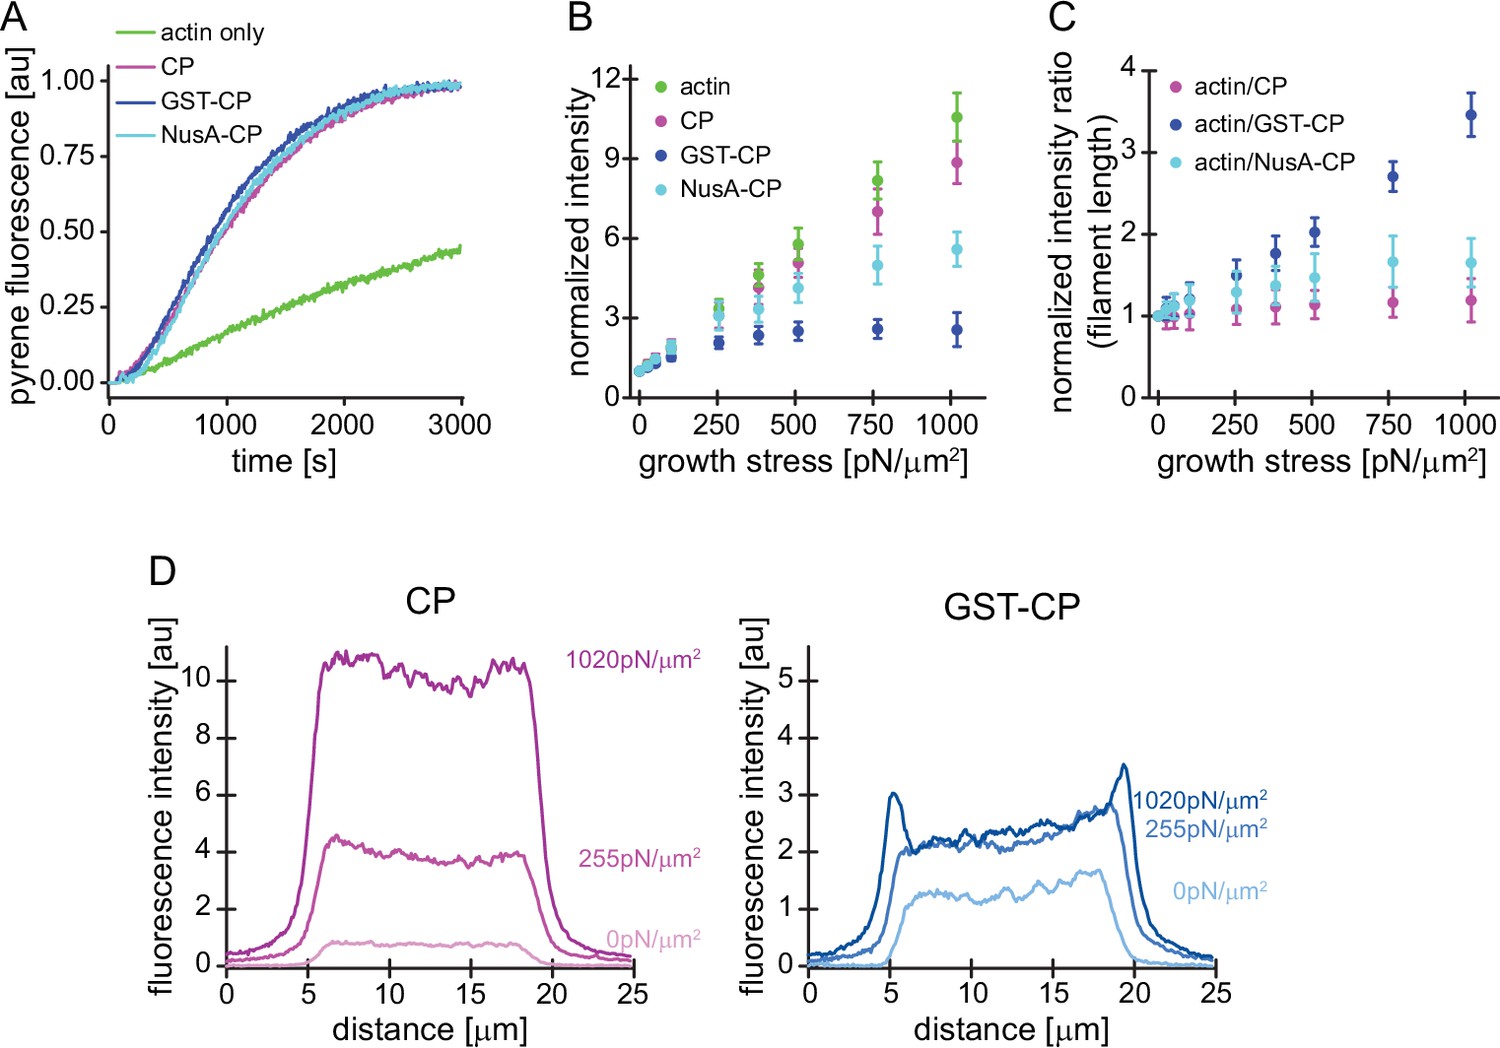
Characterization of CP variants.
(A) CP (wt, magenta), GST-CP (bulky variant 1, blue), and NusA-CP (bulky variant 2, cyan), similarly stimulate the generation of free pointed ends of actin (2 μM containing 5% pyrenyl-actin) in the absence of profilin. Green trace is the negative control containing only actin. CP concentration was 30 nM total for all cases. The experiment was performed once. (B) Mean Alexa 488-actin, TMR-CP(wt, magenta), Alexa 647-GST-CP (bulky variant 1, blue) or Alexa 647-NusA-CP (bulky variant 2, cyan) intensity normalized to the intensity of an adjacent unloaded network as a function of load. Error bars are SD. N=4 independent experiments per spike-in condition (GST-CP/CP(wt) and NusA-CP/CP(wt)). (C) Mean fluorescence intensity ratios of actin/CP(wt) (magenta), actin/GST-CP(bulky variant 1, blue) or actin/GST-CP(bulky variant 2, cyan) normalized to the intensity ratio of an adjacent unloaded network as a function of load. Error bars are SD. N=4 independent experiments per spike-in condition (GST-CP/CP(wt) and NusA-CP/CP(wt)). (D) Local fluorescence intensities of wildtype CP (left, magenta) or bulky GST-CP (right, blue) analyzed by linescans as illustrated in Figure 1—figure supplement 1 at indicated growth stresses.
-
Figure 5—figure supplement 2—source data 1
Quantification of capping by bulky variants compared to wildtype capping protein.
- https://cdn.elifesciences.org/articles/73145/elife-73145-fig5-figsupp2-data1-v2.xlsx
Appendix 1—figure 1
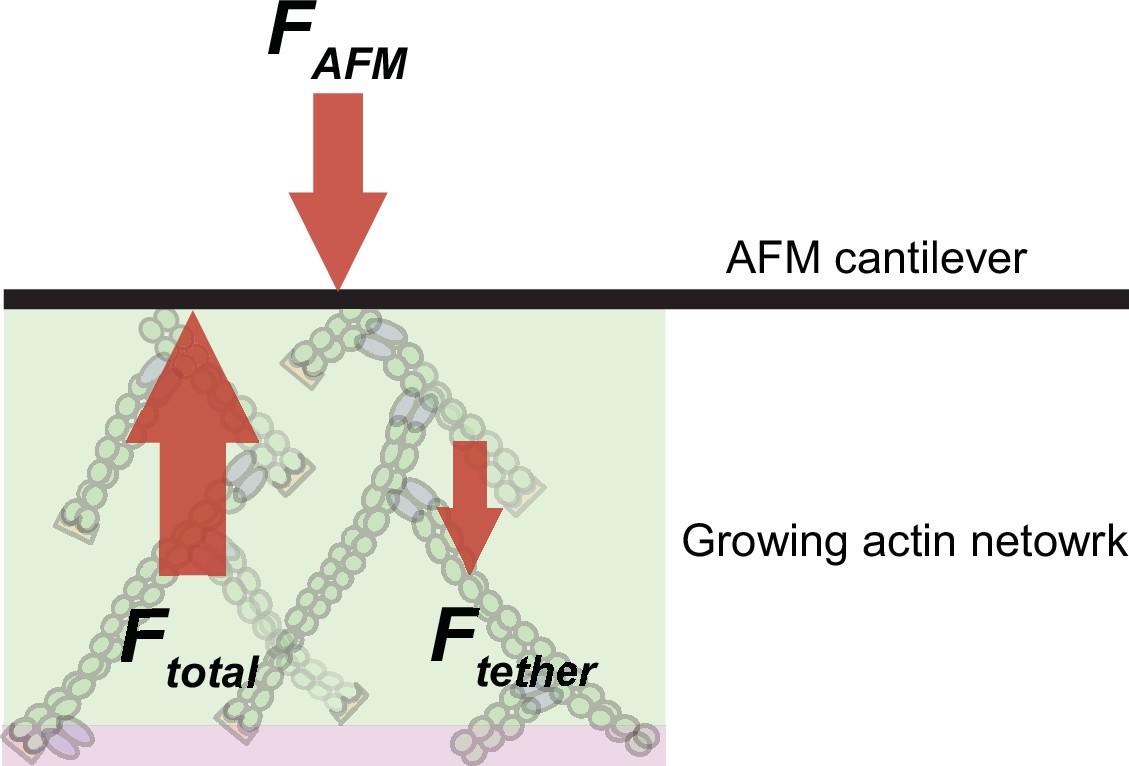
Scheme illustrating the balance of forces in our experimental setup.
Branched network assembly produces a protrusive force (Ftotal), which is counteracted by (i) the external load force applied by the AFM cantilever (FAFM) and (ii) the internal frictional forces that originate from attractive tethering forces due to interactions between the network and the NPF-coated surface (Ftether).
Appendix 1—figure 2
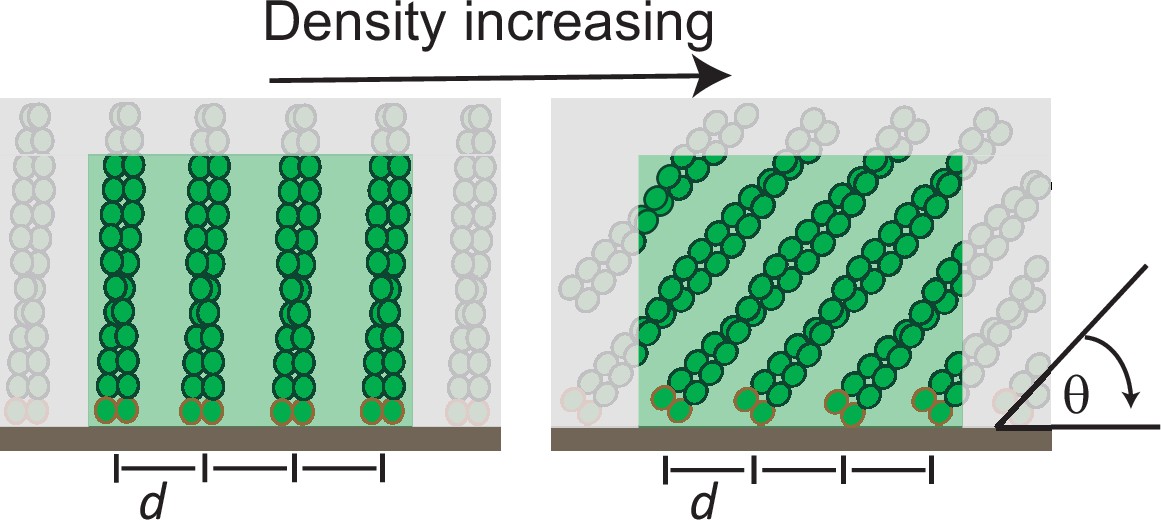
Illustration of the architectural changes in branched actin due to load.
Filament reorientation to shallower contact angles (θ) at higher loads leads to an increase in total filament density within the network.
Videos
Video 1
Incorporation of individual Arp2/3 complexes into growing actin networks visualized by single-molecule TIRFM.
Time-lapse movie from TIRF microscopy of single Alexa647-Arp2/3 complexes incorporating in actin networks either subjected to 1020 Pa of load (left square) or growing in the absence of external load (right square). Spike in of low amounts of Alexa647-Arp2/3 complexes (1–5000 labeling ratio, 20pM of 100 nM total) allows for the visualization of nucleation with single molecule resolution. Productive events are characterized by a rapid appearance of a fluorescent spot that decreases gradually in intensity as the Arp2/3 complex moves out of the evanescent field with the growing actin network. Scale bar = 10 μm. Conditions are as in Figure 3A.
Video 2
Compressive load inhibits actin monomer binding to nucleation promoting factors.
Time-lapse movie from TIRF microscopy of two WAVE squares containing Alexa 488-WAVEΔN (FRET donor attached to the NPF) generating actin networks either subjected to 1020 Pa of load (left square) or growing in the absence of external load (right square). At the indicated time (t=60 s), 200 μl fixation and quenching mix 30 μM LatB, 30 μM phalloidin, 5 μM Atto 540-actin, 7 μM profilin, 37.5 μM Myotrophin (CP inhibitor) were added to 100 μl network assembly mix, leading to the observed drop in donor fluorescence. Scale bar = 10 μm. Conditions are as in Figure 4B.
Video 3
Load dependence of capping in growing branched networks as visualized by differential incorporation of wildtype or bulky capping protein.
Time-lapse movie from TIRF microscopy (top panel = TMR CP (wt), middle panel = Alexa647-GST-CP (bulky variant) and bottom panel = color merge with TMR-CP in magenta and Alexa647-GST-CP in blue) of dendritic actin networks either subjected to a stepwise increase in load (left square) or an adjacent unloaded control network (right square). Networks were assembled at standard conditions, except that CP (wt) concentration was 90 nM (of which 10 nM were TMR-CP) and Alexa647-GST-CP concentration was 10 nM. Scale bar = 10 μm. Conditions are as in Figure 5D.
Additional files
Download links
A two-part list of links to download the article, or parts of the article, in various formats.
Downloads (link to download the article as PDF)
Open citations (links to open the citations from this article in various online reference manager services)
Cite this article (links to download the citations from this article in formats compatible with various reference manager tools)
The molecular mechanism of load adaptation by branched actin networks
eLife 11:e73145.
https://doi.org/10.7554/eLife.73145


