Inhibition of SHP-1 activity by PKC-θ regulates NK cell activation threshold and cytotoxicity
- The Mina and Everard Goodman Faculty of Life Sciences, Bar-Ilan University, Israel
Figures
Figure 1 with 1 supplement

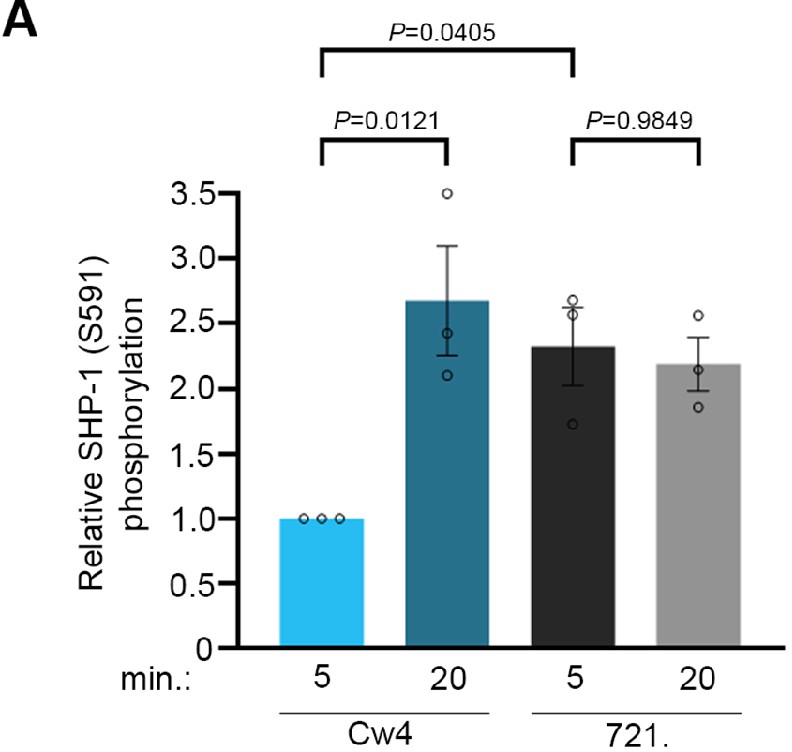
Phosphorylation kinetics of SHP-1 S591 during activating and inhibitory NK cell interactions.
(A) YTS-2DL1 NK cells were incubated with either inhibitory 721-Cw4 HLA or activating 721-Cw7 HLA target cells at 37°C for 5 min, and then lysed. Lysates were separated on SDS-PAGE and immunoblotted with anti-pSHP-1 S591 antibody. SHP-1 S591 phosphorylation levels were measured by densitometric analysis, relative to β-tubulin loading control using ImageJ. Samples were normalized to the YTS-2DL1 sample incubated with 721-Cw4 target after 5 min of activation (p=0.0104, quantification on the right showing the average of three independent experiments). (B) pNK-2DL1 cells were incubated with either 721-Cw4 HLA or 721-HLA-negative target cells at 37°C for 5 min. pSHP-1 S591 levels were determined as in (A) (p=0.0060, quantification on the right showing the average of three independent experiments). (C) YTS-2DL1 cells were incubated with target cells as described in (A), for four different time points, as indicated. pSHP-1 S591 levels were quantitated as in (A). Statistical significance between Cw4 and Cw7 after 5 min of activation (p=0.015), statistical significance between Cw4 at 5 min versus 20 min (p=0.0091). pSHP-1 S591 levels of YTS-2DL1 cells incubated with targets for 5 and 20 min are shown in the bar graph (quantification showing the average of three independent experiments). Data are shown as mean ± SEM. One-sample t-tests (A, B) or one-way ANOVA with Tukey test (C) was used to calculate p-values.
-
Figure 1—source data 1
Representative blots.
- https://cdn.elifesciences.org/articles/73282/elife-73282-fig1-data1-v1.pdf
-
Figure 1—source data 2
Numerical data for all the graphical presentations in Figure 1.
- https://cdn.elifesciences.org/articles/73282/elife-73282-fig1-data2-v1.xlsx
Figure 1—figure supplement 1
Phosphorylation kinetics of SHP-1 S591 in pNK cells.
(A) pNK-2DL1 cells were incubated with target cells as described in Figure 1C, for two different activation time points, as indicated. pSHP-1 S591 levels were determined as in Figure 1C. pSHP-1 S591 levels of pNK-2DL1 cells incubated with targets for 5 and 20 min are shown on the bar graph. The bar graph shows the average of four independent experiments.
-
Figure 1—figure supplement 1—source data 1
Numerical data for the graphical presentation in Figure 1—figure supplement 1.
- https://cdn.elifesciences.org/articles/73282/elife-73282-fig1-figsupp1-data1-v1.xlsx
Figure 2
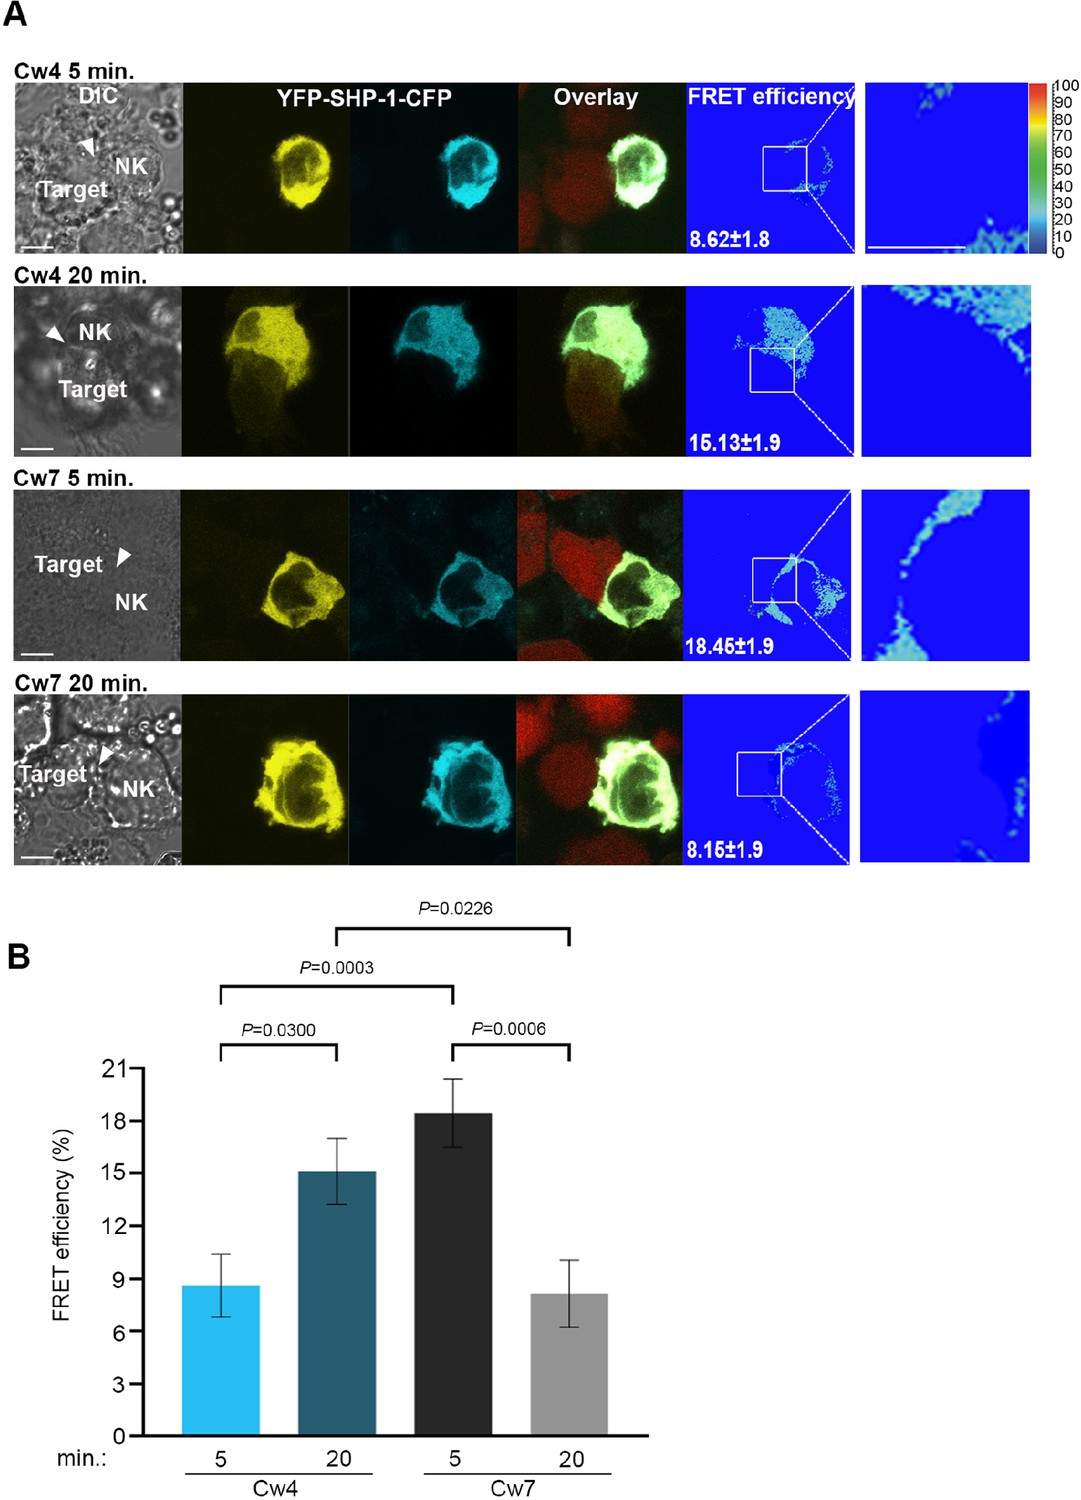
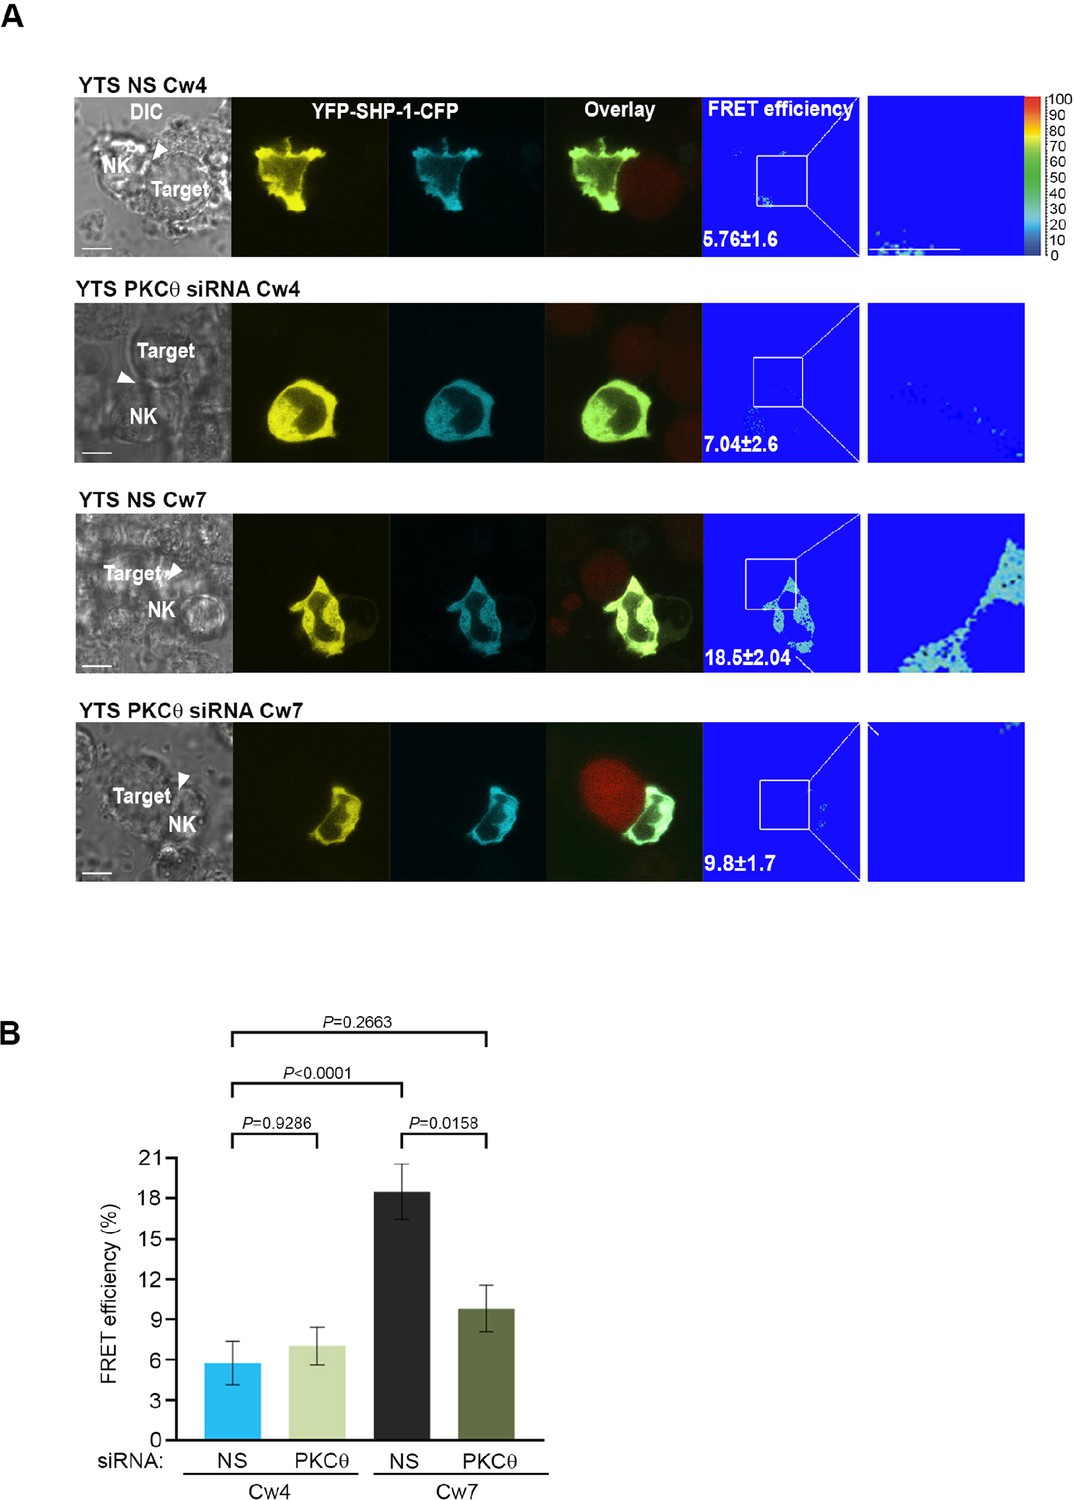
SHP-1 conformational dynamics reflect S591 phosphorylation during activating and inhibitory NK cell interactions.
(A) YTS-2DL1 YFP-SHP-1-CFP cells were incubated over slides pre-seeded with 721-Cw4 (top panels) or Cw7 (bottom panels) target cells expressing mCherry. The cells were incubated for 5 or 20 min at 37°C to enable conjugate formation, and fixed. FRET analysis was performed as indicated. (B) Graph summarizing FRET efficiency following 5 or 20 min activation with Cw4 or Cw7 target cells. For Cw4, 5 and 20 min activation, n = 72 and 62 cell conjugates analyzed, respectively. For Cw7, 5 and 20 min activation, n = 73 and 47 cell conjugates analyzed from three independent experiments, respectively. Data are shown as mean ± SEM. Two-way ANOVA with Tukey test (B) was used to calculate p-values.
-
Figure 2—source data 1
Numerical data for all the graphical presentations in Figure 2.
- https://cdn.elifesciences.org/articles/73282/elife-73282-fig2-data1-v1.xlsx
Figure 3 with 1 supplement
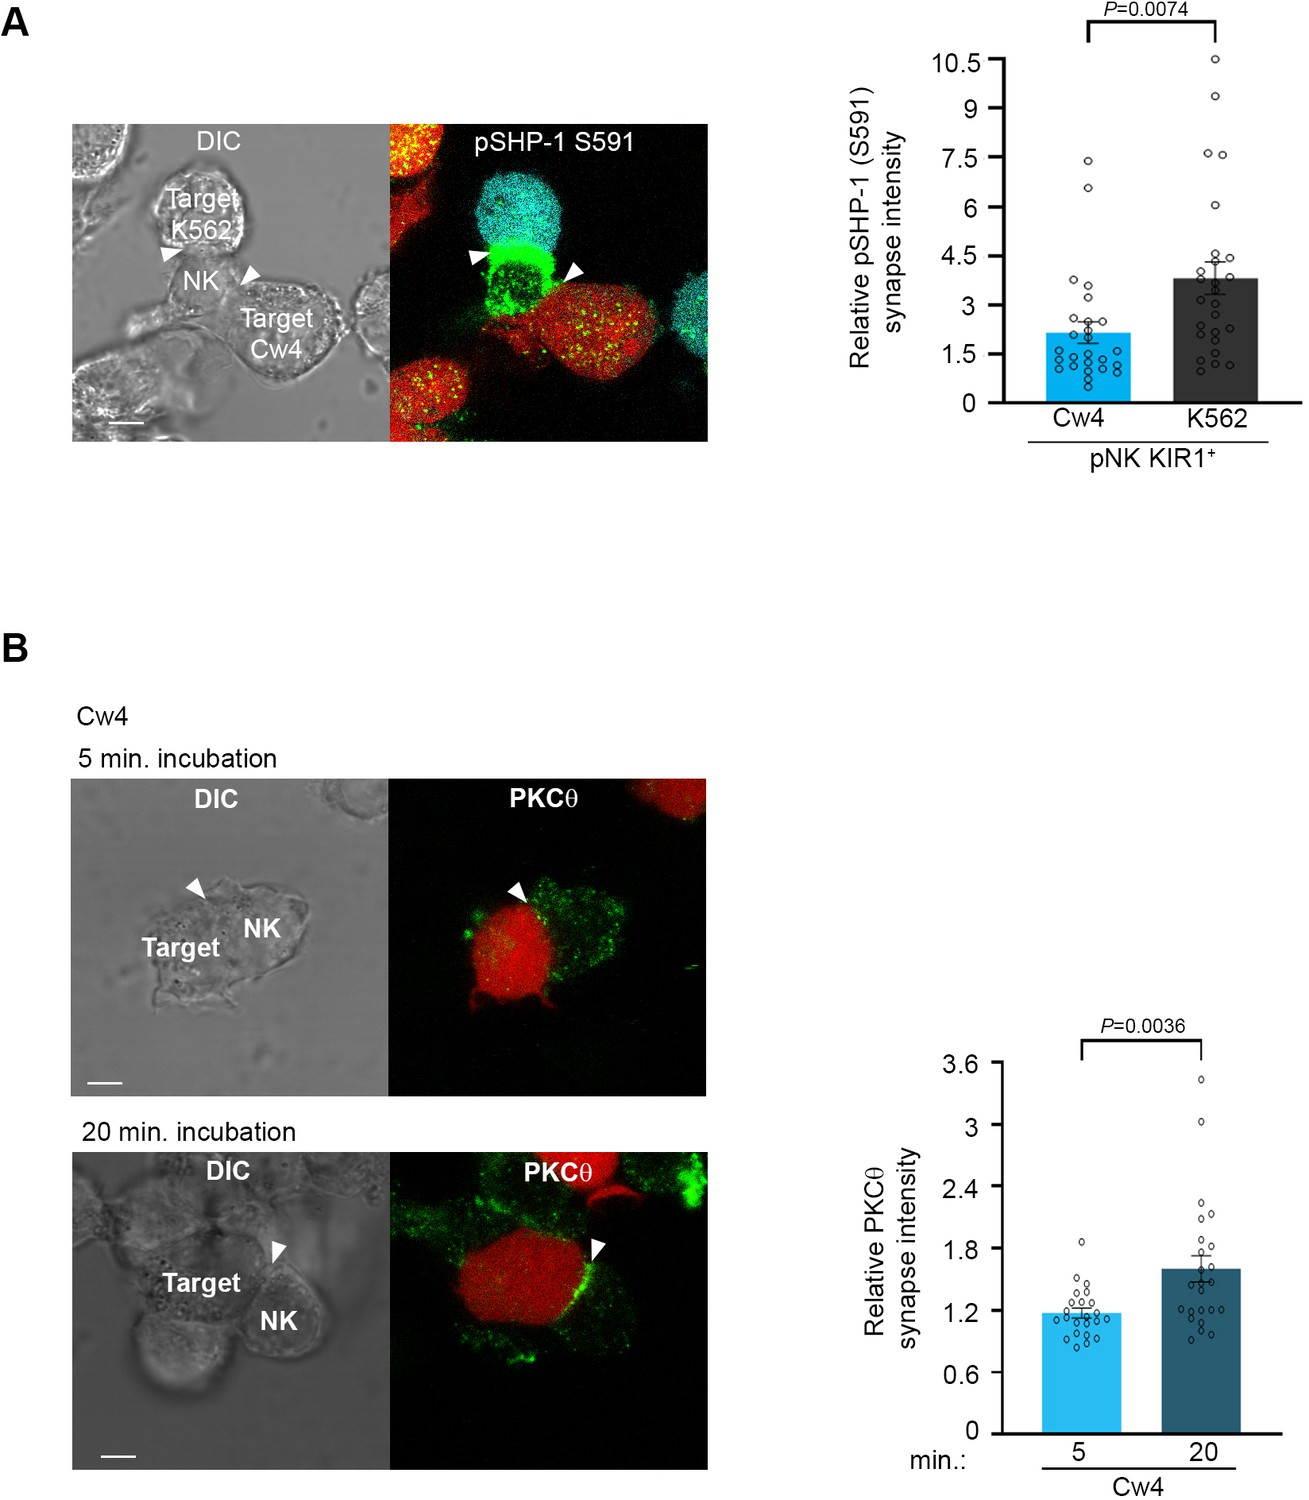
Phosphorylation of SHP-1 S591 occurs at the activating NKIS during simultaneous activating and inhibitory synapse formation, in parallel to PKC-θ accumulation.
(A) pNK-2DL1 cells were incubated over slides pre-seeded with 721-Cw4 and K562 cells expressing mCherry or CFP, respectively. The cells were incubated for 5 min at 37°C to enable conjugate formation and were fixed. pSHP-1 S591 was labeled with primary rabbit anti-pSHP-1 S591 antibody, and secondary anti-rabbit 488 antibody. Synapse intensity was quantified in NK cells relative to each cell in multiple NK cell synapses with two different targets (p=0.007, quantification on the right of triple-cell conjugates collected, n = 26). (B) YTS-2DL1 cells were incubated over slides pre-seeded with 721-Cw4 target cells expressing mCherry. The cells were incubated for 5 or 20 min at 37°C to enable conjugate formation and were fixed. PKC-θ was subsequently labeled with primary goat anti-PKC-θ antibody and secondary anti-goat 488 antibody. Right: graph summarizing PKC-θ accumulation at the NKIS at two time points following activation. Analysis was conducted comparing PKC-θ intensity at the NKIS relative to the rest of the NK cell. For Cw4, 5 and 20 min activation, n = 24 cell conjugates were analyzed from three independent experiments. Data are shown as mean ± SEM. One-sample t-tests (A, B) were used to calculate p-values.
-
Figure 3—source data 1
Numerical data for all graphical presentations in Figure 3.
- https://cdn.elifesciences.org/articles/73282/elife-73282-fig3-data1-v1.xlsx
Figure 3—figure supplement 1
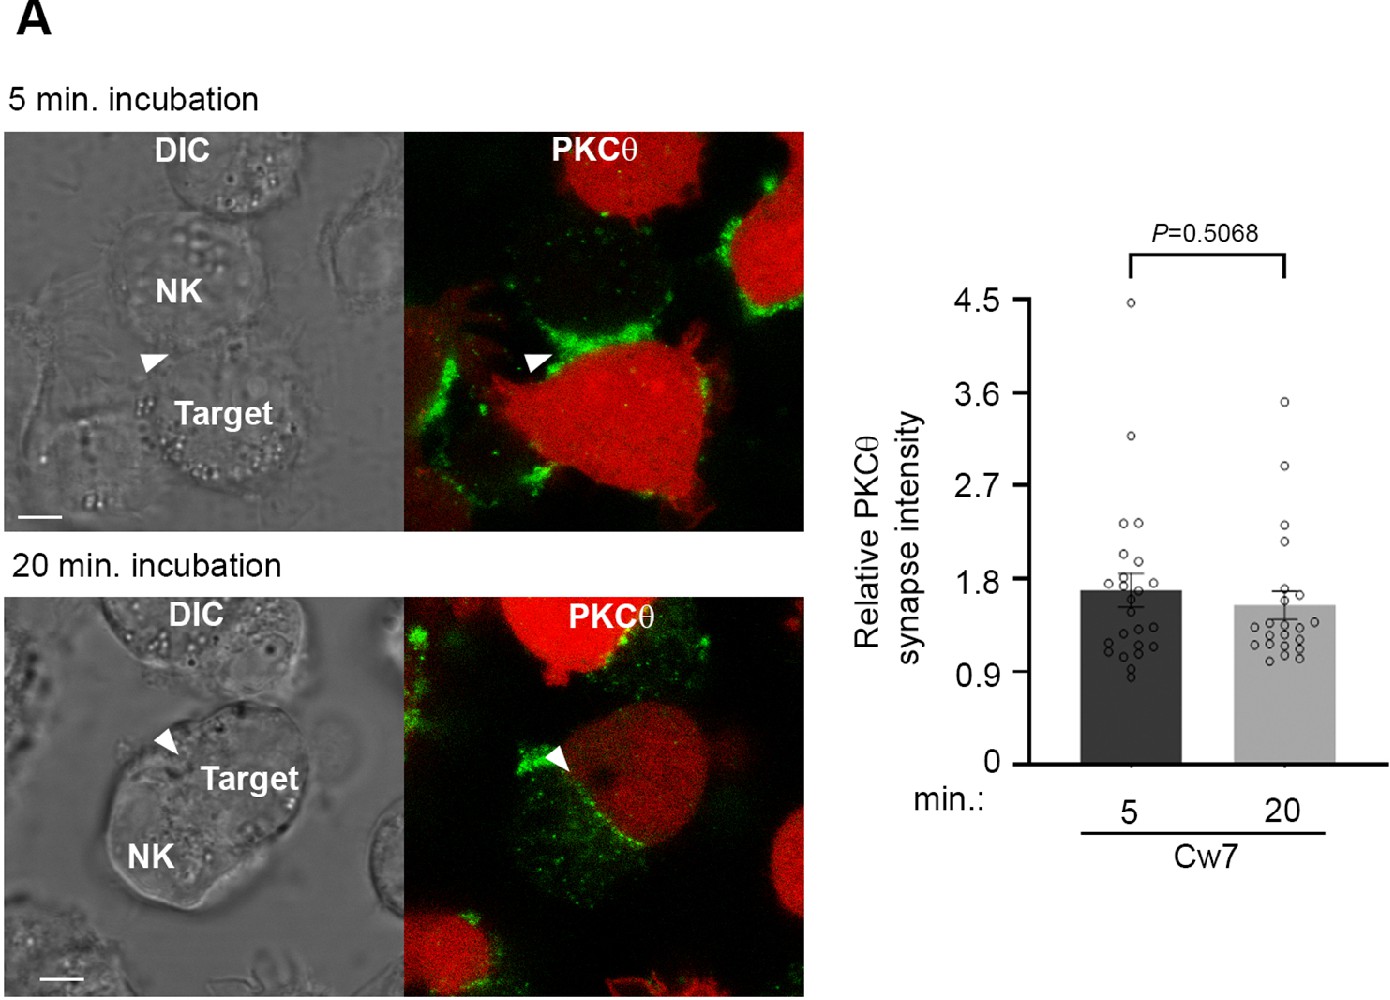
PKC-θ accumulation at the activating NKIS.
(A) YTS-2DL1 cells were incubated over slides pre-seeded with 721-Cw7 target cells expressing mCherry. The cells were incubated for 5 or 20 min at 37°C to enable conjugate formation and were fixed. PKC-θ was subsequently labeled with primary goat anti-PKC-θ antibody and secondary anti-goat 488 antibody. Graph summarizing PKC-θ accumulation at the NKIS during each activation time. Analysis was conducted comparing PKC-θ intensity at the NKIS relative to the rest of the NK cell. For Cw7, 5 and 20 min activation, n = 27 and 24 conjugates were analyzed.
-
Figure 3—figure supplement 1—source data 1
Numerical data for the graphical presentation in Figure 3—figure supplement 1.
- https://cdn.elifesciences.org/articles/73282/elife-73282-fig3-figsupp1-data1-v1.xlsx
Figure 4
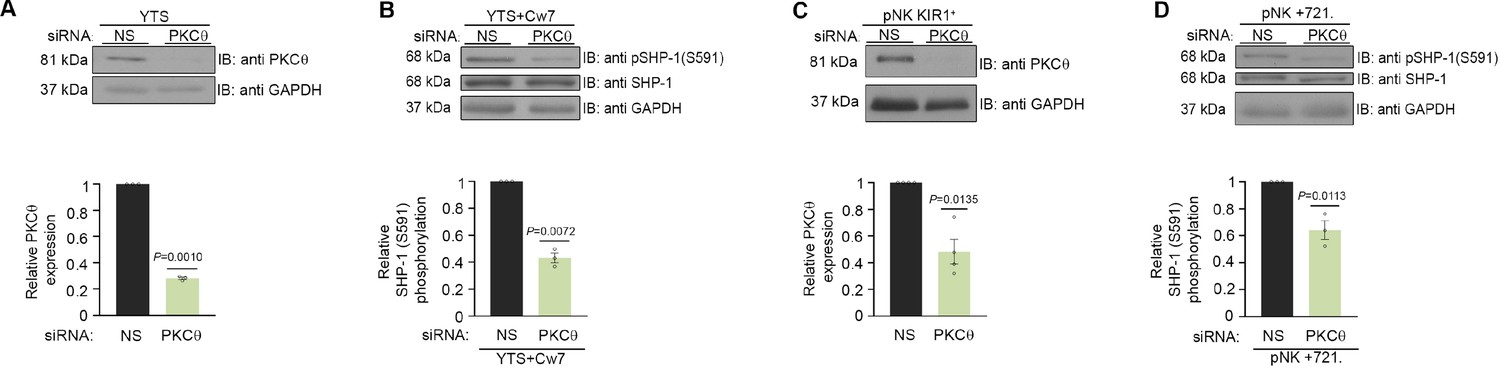
SHP-1 phosphorylation is mediated through PKC-θ.
(A) Silencing efficiency of PKC-θ. YTS-2DL1 cells treated with either nonspecific (control) (NS) or PKC-θ siRNA, lysed, separated on SDS-PAGE, and immunoblotted with anti- PKC-θ antibody. PKC-θ levels were measured by densitometric analysis, relative to the GAPDH loading control using ImageJ. Samples were normalized to the sample treated with NS siRNA (p=0.001, quantification on the bottom showing average of three independent experiments). (B) YTS-2DL1 treated with either NS or PKC-θ siRNA were incubated with 721- HLA target cells at 37°C for 5 min, and cells were subsequently lysed. Lysates were separated on SDS-PAGE, transferred to a nitrocellulose membrane, and immunoblotted with anti-pSHP-1 S591 antibody. SHP-1 S591 phosphorylation levels were measured by densitometric analysis, relative to the GAPDH loading control using ImageJ. Samples were normalized to the YTS-2DL1 sample treated with NS siRNA and incubated with 721-Cw7 targets (p=0.0072, quantification on the bottom of independent experiments, n = 3). (C) Silencing efficiency of PKC-θ. pNK-2DL1 cells were transfected with 250 pmol of PKC-θ siRNA. After 48 hr, prior to incubation with target cells, pNK-2DL1 were counted and lysed. Lysates were separated on SDS-PAGE and immunoblotted with anti-PKC-θ antibody. PKC-θ expression levels were measured by densitometric analysis using ImageJ and expressed relative to the GAPDH loading control. Samples were normalized according to the pNK-NS siRNA sample. Bar graph on the bottom shows the average of three independent experiments. (D) pNK-2DL1 cells were incubated with 721-HLA-negative cells at 37°C for 5 min, and cells were subsequently lysed. Lysates were separated on SDS-PAGE and transferred to a nitrocellulose membrane that was immunoblotted with anti-pSHP-1 S591 antibody. SHP-1 S591 phosphorylation levels were measured by densitometric analysis, relative to the GAPDH loading control using ImageJ. Samples were normalized to the pNK-2DL1 sample treated with NS siRNA and incubated with 721 targets (p=0.0113, quantification on the bottom showing the average of three independent experiments). Data are shown as mean ± SEM. One-sample t-tests (A–D) were used to calculate p-values.
-
Figure 4—source data 1
Representative blots.
- https://cdn.elifesciences.org/articles/73282/elife-73282-fig4-data1-v1.pdf
-
Figure 4—source data 2
Numerical data for all the graphical presentations in Figure 4.
- https://cdn.elifesciences.org/articles/73282/elife-73282-fig4-data2-v1.xlsx
Figure 5 with 1 supplement
SHP-1 conformation is regulated by PKC-θ at the NKIS.
(A) YTS-2DL1 YFP-SHP-1-CFP cells were treated with either NS or PKC-θ siRNA and incubated over slides pre-seeded with 721-Cw4 (top panels) or Cw7 (bottom panels) target cells expressing mCherry. The cells were incubated for 5 min at 37°C to enable conjugate formation and were fixed. FRET analysis was performed, as indicated. (B) Graph summarizing FRET efficiency during 5 min activation with 721-Cw4 or Cw7 target cells. For Cw4 NS and PKC-θ siRNA, n = 52 and 63 cell conjugates were analyzed, respectively, and for Cw7 NS and PKC-θ siRNA n = 67 and 61 cell conjugates were analyzed from three independent experiments, respectively. Data are shown as mean ± SEM. Two-way ANOVA with Tukey test (B) was used to calculate p-values.
-
Figure 5—source data 1
Numerical data for all the graphical presentations in Figure 5.
- https://cdn.elifesciences.org/articles/73282/elife-73282-fig5-data1-v1.xlsx
Figure 5—figure supplement 1
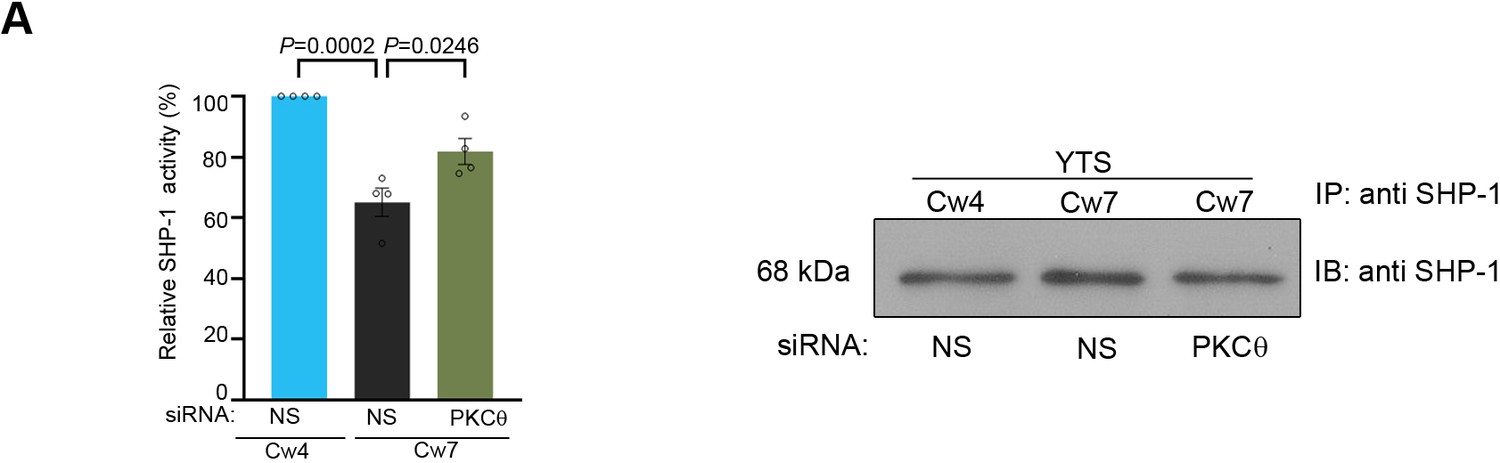
PKC-θ regulates SHP-1 activity.
(A) YTS-2DL1 cells were treated with NS or PKC-θ siRNA for 48 hr, and SHP-1 activity was determined. Loading control of SHP-1 precipitated for the protein tyrosine phosphatase (PTP) assay is shown to the right. The bar graph represents averages of four independent experiments.
-
Figure 5—figure supplement 1—source data 1
Representative blot.
- https://cdn.elifesciences.org/articles/73282/elife-73282-fig5-figsupp1-data1-v1.pdf
-
Figure 5—figure supplement 1—source data 2
Numerical data for the graphical presentation in Figure 5—figure supplement 1.
- https://cdn.elifesciences.org/articles/73282/elife-73282-fig5-figsupp1-data2-v1.xlsx
Figure 6

SHP-1 substrate phosphorylation is reduced following PKC-θ silencing.
(A) YTS-2DL1 or pNK-2DL1 cells were transfected with 500 pmol of PKC-θ siRNA for 48 hr. Cells were incubated with target cells for 5 min at 37°C and then lysed. Lysates were separated on SDS-PAGE and immunoblotted with anti-pVAV-1 (Y160) antibody. Phosphorylation levels were measured by densitometric analysis, relative to the GAPDH loading control using ImageJ. Samples were normalized according to the YTS-2DL1 or pNK-2DL1 NS siRNA Cw4 sample. Quantification of independent experiments is shown on the bottom; n = 3 for YTS and n = 4 for pNK experiments. (B) pNK-2DL1 cells were transfected with either NS or PKC-θ siRNA 48 hr prior to each experiment. Cells were incubated with either 721-Cw4 or 721-HLA-negative target cells for 5 min at 37°C, and subsequently lysed. Lysates were separated on SDS-PAGE and immunoblotted with anti-pPLCγ-1 (Y783) antibody. Phosphorylation levels were measured by densitometric analysis, relative to the GAPDH loading control using ImageJ. Samples were normalized to the pNK-2DL1 NS siRNA Cw4 sample. Quantification of independent experiments is shown on the bottom; n = 3. The blot in (A) was stripped and reblotted against pPLCγ1(Y783) in (B). (C) YTS-2DL1 WT or YTS-2DL1 SHP-1 S591D cells were transfected with either NS or PKC-θ siRNA and incubated over slides pre-seeded with 721-Cw4 or Cw7 target cells expressing mCherry. The cells were incubated for 5 min at 37°C to enable conjugate formation and fixed. pVAV-1 (Y160) was subsequently labeled with primary rabbit anti-pVAV-1 (Y160) antibody and secondary anti-rabbit 488 antibody. Quantification is shown on the bottom; for YTS-2DL1 WT NS or PKC-θ siRNA vs. Cw4 and Cw7, n = 21 and 28 cell conjugates were analyzed, respectively. For YTS-2DL1 SHP-1 S591D NS or PKC-θ and Cw7, n = 21 and 28 cell conjugates were analyzed from three independent experiments, respectively. (D) YTS-2DL1 SHP-1 KO cells were transfected with either WT YFP-SHP-1, YFP-SHP-1 S591A, or YFP-SHP-1 S591D phosphorylation mutants, and incubated on slides with mCherry-expressing 721-Cw4 target cells at 37°C. After 5 min incubation, the cells were fixed and stained with anti-pPLCγ1(Y783). NK cells were distinguished from targets based on mCherry expression by the target cells. Graph summarizes the relative synapse staining intensities. For WT YFP-SHP-1, YFP-SHP-1 S591A, and YFP-SHP-1 S591D, n = 48, 48, and 25 cell conjugates from three independent experiments analyzed, respectively. (E) YTS-2DL1 cells were transfected with either NS or PKC-θ siRNA 48 hr prior to the experiment. Cells were incubated with either 721-Cw4 or Cw7 target cells for 5 min at 37°C and subsequently lysed. Lysates were immunoprecipitated on beads containing PLCγ-1 antibody and immunoblotted for pPLCγ-1 (Y783). Densitometric analysis was normalized to PLCγ-1 loading controls, and relative to the YTS-2DL1 NS siRNA: Cw7 pPLCγ-1(Y783) sample. Bar graph on the bottom shows the average of three independent experiments. Data are shown as mean ± SEM. One-way ANOVA with Tukey test (A, B, D, E) or two-way ANOVA with Tukey test (C) was used to calculate p-values.
-
Figure 6—source data 1
Representative blots.
- https://cdn.elifesciences.org/articles/73282/elife-73282-fig6-data1-v1.pdf
-
Figure 6—source data 2
Numerical data for all the graphical presentations in Figure 6.
- https://cdn.elifesciences.org/articles/73282/elife-73282-fig6-data2-v1.xlsx
Figure 7 with 1 supplement

NK cell activation threshold is increased following gene silencing of PKC-θ.
YTS-2DL1 cells were transfected with specific PKC-θ siRNA or with NS siRNA and assessed for effector activity after 48 hr. (A) YTS-2DL1 cells were loaded with calcium-sensitive Fluo-3-AM and analyzed for basal intracellular calcium levels for 1 min. The NK cells were then mixed with 721-Cw4 or Cw7 target cells and incubated at 37°C and analyzed by spectrofluorometry. (B) YTS-2DL1 cells were incubated with [35S]Met-labeled 721-Cw4 or Cw7 target cells at a ratio of 10:1 for 5 hr at 37°C. The specific lysis of target cells was measured. The graph summarizes three independent experiments. (C) pNK-2DL1 cells were incubated with [35S]Met-labeled 721-Cw4 or HLA-negative target cells at a ratio of 10:1 for 5 hr at 37°C. The specific target cell lysis was measured. The graph shows the average of three independent experiments. (D) WT YTS-2DL1 or YTS-2DL1 SHP-1 KO cells were treated with either NS or PKC-θ-specific siRNA 24 hr before incubation with mCherry-expressing 721-Cw4 target cells for 2 hr at 37°C, and analyzed for degranulation via FACS relative to the WT NS-treated cells incubated with 721-Cw4 targets, as described in Materials and methods. A representative blot is shown (bottom) demonstrating PKC-θ and SHP-1 expression. (E) WT YTS-2DL1, YTS-2DL1 SHP-1 KO, and YTS-2DL1 SHP-1 S591D NK cells were treated with PKC-θ or NS siRNA and were incubated with mCherry-expressing 721-Cw4 or 721-Cw7 target cells for 2 hr at 37°C and analyzed for degranulation via FACS. Degranulation was assessed relative to the WT NS-treated cells incubated with 721-Cw4 targets, as described in Materials and methods. For knockdown, cells were treated with either NS or PKC-θ-specific siRNA 24 hr before incubation with mCherry-expressing 721-Cw4 or 721-Cw7 target cells; the graph shows the average of four independent experiments. Data are shown as mean ± SEM. Two-way ANOVA with Tukey test (B, C) or one-way ANOVA with Tukey test (D, E) was used to calculate p-values.
-
Figure 7—source data 1
Numerical data for all the graphical presentations in Figure 7.
- https://cdn.elifesciences.org/articles/73282/elife-73282-fig7-data1-v1.xlsx
-
Figure 7—source data 2
Representative blots.
- https://cdn.elifesciences.org/articles/73282/elife-73282-fig7-data2-v1.pdf
Figure 7—figure supplement 1
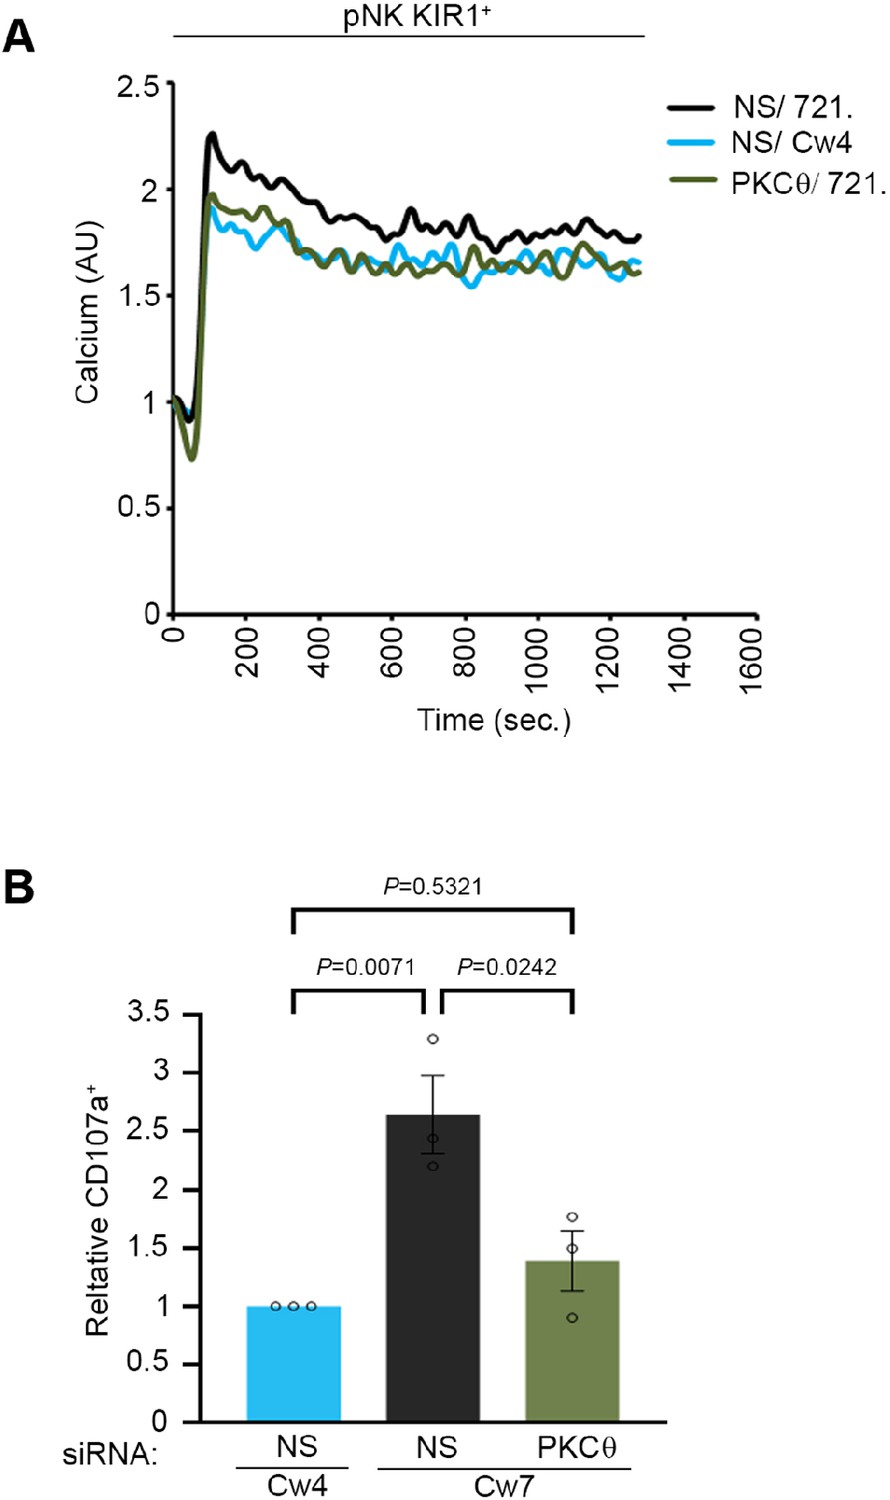
NK cell activation threshold is increased following gene silencing of PKC-θ.
(A) pNK-2DL1 cells were transfected with specific PKC-θ siRNA or with NS siRNA and were used after 48 hr. pNK-2DL1 cells were loaded with Fluo-3-AM and analyzed for basal intracellular calcium levels for 1 min. The NK cells were then mixed with 721-Cw4 or 721-HLA-negative target cells, incubated at 37°C and analyzed by spectrofluorometry. (B) pNK-2DL1 cells were PKC-θ gene-silenced or treated with NS siRNA. pNK-2DL1 cells were incubated with mCherry-expressing 721- Cw7 or Cw4 target cells for 2 hr at 37°C and analyzed for degranulation via FACS. Bar graph on the right is normalized to the pNK-2DL1 vs. Cw4 sample and represents averages of three independent experiments. Data are shown as mean ± SEM. One-way ANOVA with Tukey test (A, B) was used to calculate p-values.
-
Figure 7—figure supplement 1—source data 1
Numerical data for the graphical presentation in Figure 7—figure supplement 1.
- https://cdn.elifesciences.org/articles/73282/elife-73282-fig7-figsupp1-data1-v1.xlsx
Figure 8 with 1 supplement
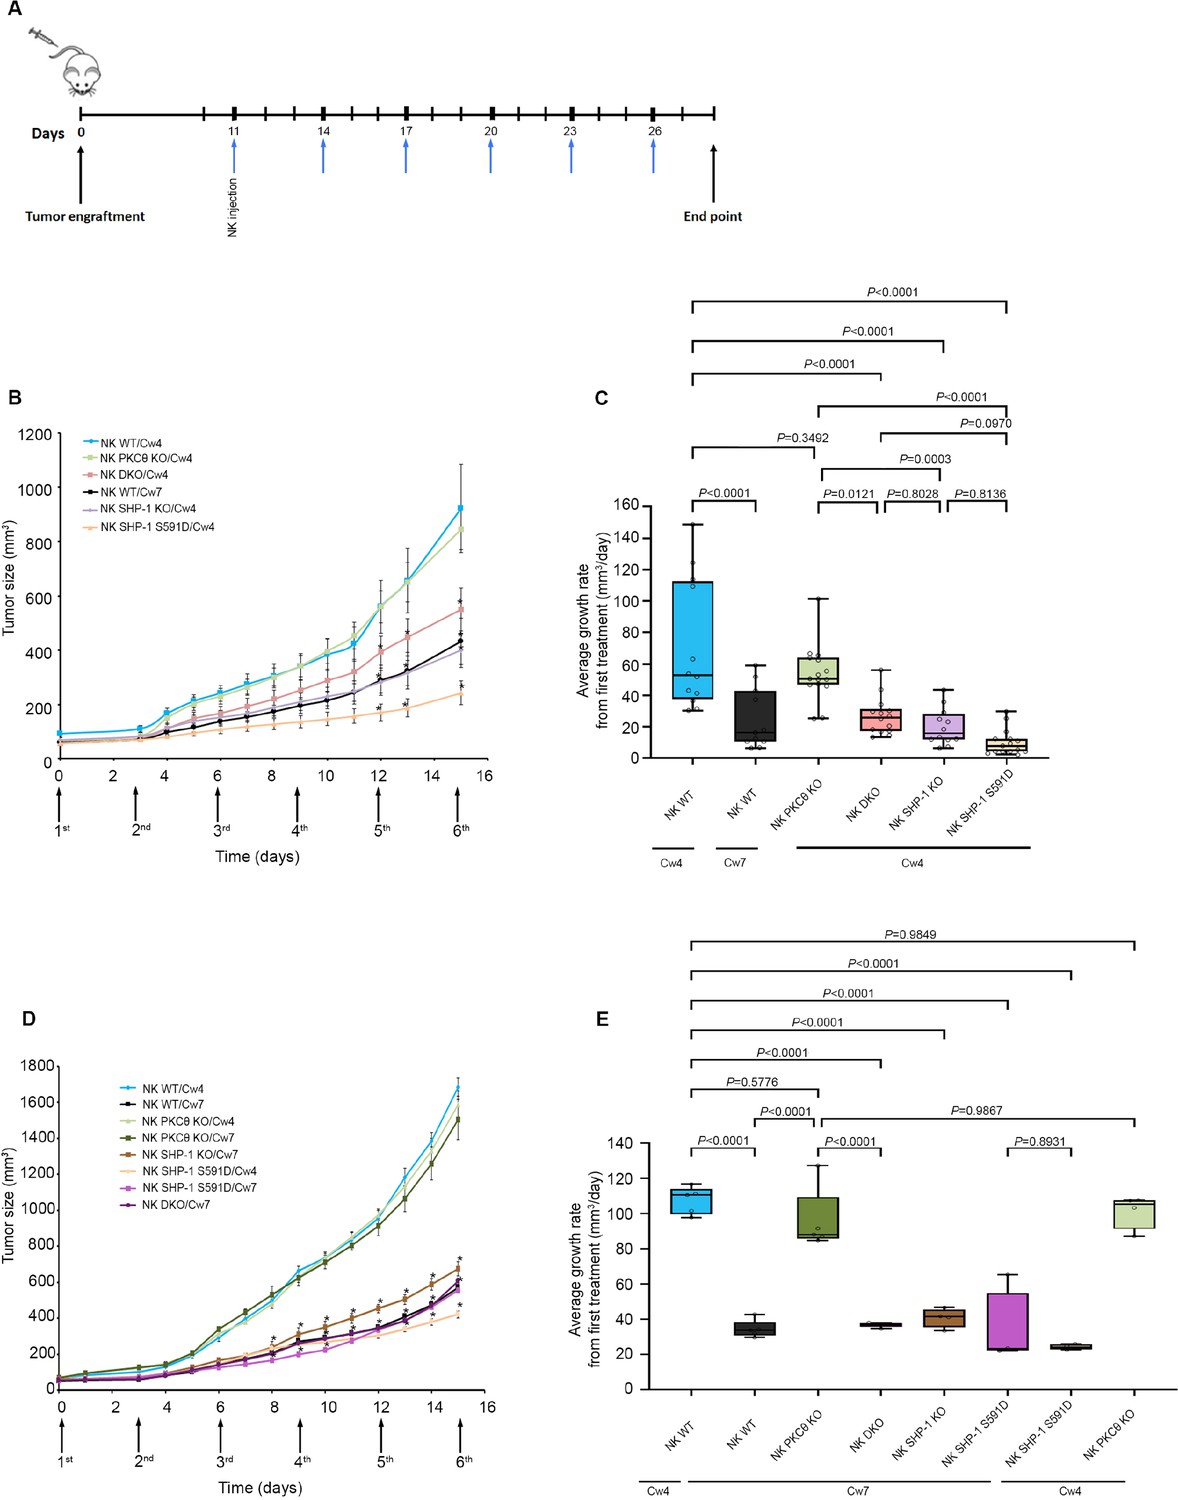
SHP-1-deficient NK cells exhibit enhanced antitumor activity in vivo, irrespective of PKC-θ expression.
(A) Schematic representation of the experimental timeline. (B) Tumor volumes measured daily in NOD-Rag1nullIL2rgnull (RAG) mice. NOD-Rag1nullIL2rgnull (RAG) mice were subcutaneously injected with 3 × 10⁶ 721-Cw4 or Cw7-expressing tumor cells. Mice were administered by intratumor injections every 3 days with either 5 * 106 irradiated WT YTS-2DL1, WT YTS-2DL1 that were treated with PKC-θ siRNA (NK PKC-θ KO), YTS-2DL1 SHP-1 KO cells (NK SHP-1 KO), YTS-2DL1 SHP-1 KO cells that were treated with PKC-θ siRNA (NK DKO), or YTS-2DL1 SHP-1 S591D mutant cells. (C) Average growth rates of tumors from the first treatment to the end point. Tumor volumes and tumor growth rates were calculated as described in Materials and methods. Data are shown as mean ± SEM. Two-way ANOVA with Tukey test (B, C) was used to calculate p-values. (D) Mice were subcutaneously injected with 3 × 10⁶ 721-Cw4 or Cw7-expressing tumor cells. Mice were treated by intratumor injections every 3 days with either 5 * 106 irradiated WT YTS-2DL1, WT YTS-2DL1 PKC-θ KO, YTS-2DL1 SHP-1 KO, YTS-2DL1 DKO, or YTS-2DL1 SHP-1 S591D mutant cells (n = 5). Tumor volumes were measured daily. (E) Average growth rates of tumors from the first treatment to the end point. Tumor volumes and tumor growth rates were calculated as described in Materials andethods. Data are shown as mean ± SEM. Two-way ANOVA with Tukey test (D, E) was used to calculate values.
-
Figure 8—source data 1
Numerical data for all the graphical presentations in Figure 8.
- https://cdn.elifesciences.org/articles/73282/elife-73282-fig8-data1-v1.xlsx
Figure 8—figure supplement 1
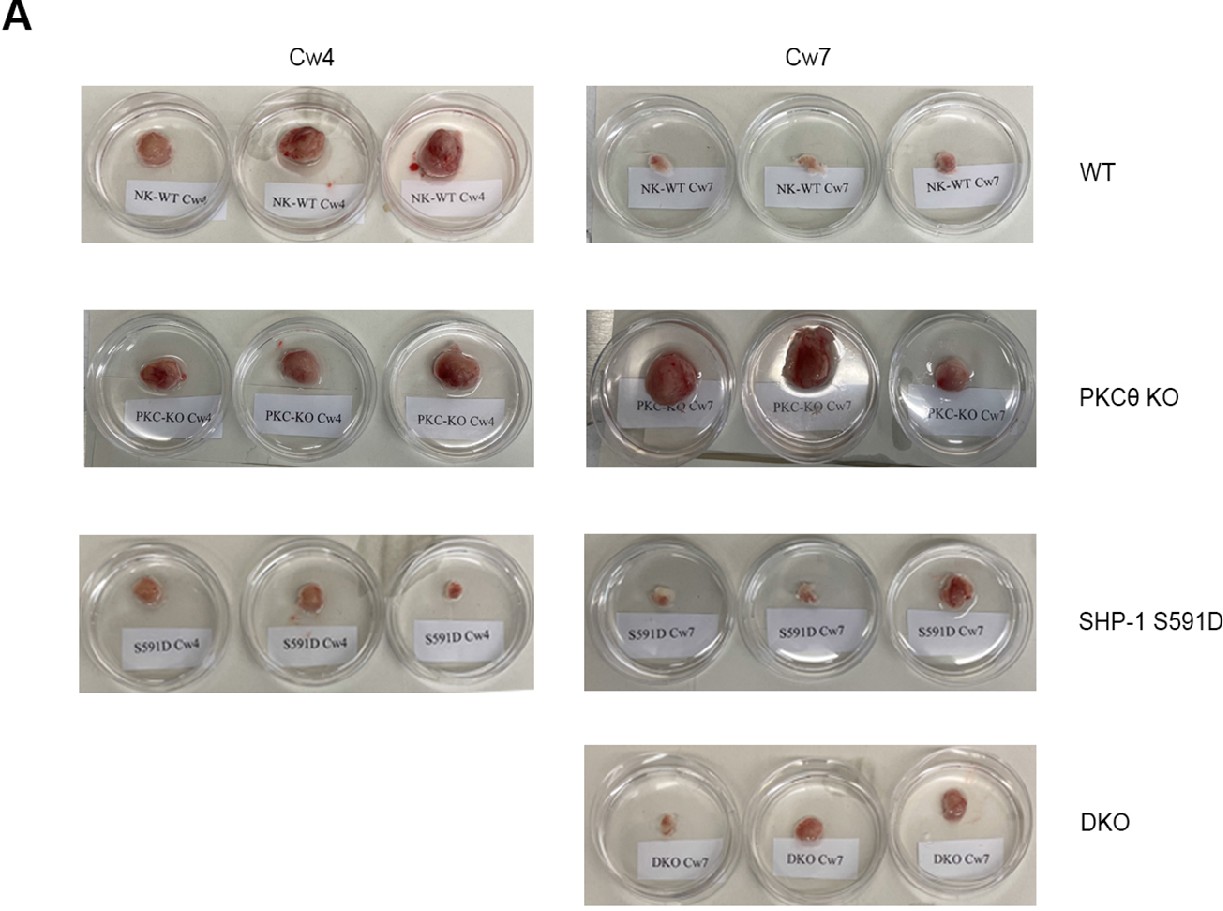
SHP-1-deficient natural killer (NK) cells exhibit decrease in the tumor volume, irrespective of PKC-θ expression.
(A) Mice were treated by intratumor injections every 3 days with either 5 * 106 irradiated WT YTS-2DL1, WT YTS-2DL1 PKC-θ KO, YTS-2DL1 K SHP-1 KO, YTS-2DL1 DKO, or YTS-2DL1 SHP-1 S591D mutants. Representative images of excised tumors from each treatment group at the end point of the experiment.
Tables
Key resources table
| Reagent type (species) or resource | Designation | Source or reference | Identifiers | Additional information |
|---|---|---|---|---|
| Antibody | Anti-human PLCγ1 (mouse monoclonal) | Upstate | 05-163 | IB: 1:500 (14 µL) |
| Antibody | Anti-human VAV1 (D7) (mouse monoclonal) | Santa Cruz | SC-8039 | IB: 1:500 (14 µL) |
| Antibody | Anti-human SHP-1 (SH-PTP-1)(C-19) (rabbit polyclonal) | Santa Cruz | SC-287 | IB: 1:1000 (7 µL) |
| Antibody | Anti-human GAPDH (0411) (mouse monoclonal) | Santa Cruz | SC-47724 | IB: 1:1000 (7 µL) |
| Antibody | Anti-human pSHP-1 (S591) (rabbit polyclonal) | ECM Biosciences | Sp-1531 | IB: 1:1000 (7 µL)IF: 1:500 (0.6 µL) |
| Antibody | Anti-human pPLCγ (Y783) (rabbit polyclonal) | Cell Signaling | CST-2821S | IB: 1:1000 (7 µL)IF: 1:500 (0.6 µL) |
| Antibody | Anti-human pVAV1 (Y160) (rabbit polyclonal) | Bio Source | Bs-44482 | IB: 1:1000 (7 µL)IF: 1:500 (0.6 µL) |
| Antibody | Anti-human-PKC-θ (1C2) (mouse monoclonal) | Santa Cruz | SC-81534 | IB: 1:500 (14 µL)IF: 1:250 (1.2 µL) |
| Antibody | Goat anti-mouse | Jackson Laboratory | #115-035-003 | 1:10,000 (1 µL) |
| Antibody | Goat anti-rabbit | Santa Cruz | Sc-2004 | 1:10,000 (1 µL) |
| Antibody | Anti-human KIR2DL1/S1-PE conjugated (mouse monoclonal) | Miltenyi Biotec | 130-099-209 | 1:10 (10 µL) |
| Antibody | Anti-human CD107a (LAMP-1) (mouse monoclonal) | BioLegend | #328602 | 1:20 (2.5 µL) |
| Antibody | Alexa Fluor-conjugated 488 (goat polyclonal) anti-rabbit IgG (H+L) Highly Cross-Adsorbed Secondary Antibody | Invitrogen | A11034 | IF: 1:2000 (1 µL) |
| Antibody | Alexa Fluor-conjugated 488 goat polyclonal anti-mouse IgG (H+L) | Jackson Laboratory | 115-545-146 | IF: 1:2000 (1 µL) |
| Recombinant DNA reagent | YFP-SHP-1-CFP (plasmid) | Matalon et al., 2018 | ||
| Recombinant DNA reagent | CRISPR CAS9 SHP-1 S591D | Ben-Shmuel et al., 2021 | Backbone pSpCas9 (BB)–2A-GFP vector Addgene plasmid #48138 | |
| Sequence-based reagent | siRNA: target PRKCQ gene | Sigma-Aldrich | 5′ CUCUUCACCUGGGCGCCAA 3′5′ UUGGCGCCCAGGUGAAGAG 3′ | |
| Sequence-based reagent | siRNA: nonspecific target | Sigma-Aldrich | 5′ UAGCGACUAAACACAUCAA 3′,5′UAAGGCUAUGAAGAGAUAC3′, 5′AUGUAUUGGCCUGUAUUAG3′, 5′ AUGAACGUGAAUUGCUCAA 3′, and 5′ UGGUUUACAUGUCGACUAA3′ | |
| Chemical compound, drug | Fluo-3-AM | Biotium | 50016 | 1 µg per sample |
| Chemical compound, drug | p-Nitophenyl phosphate (pNPP) | NEB-P0757S | ||
| Chemical compound, drug | [35S]Met | PerkinElmer | NEG009L005MC | |
| Chemical compound, drug | Monensin | BioLegend | #420701 | |
| Chemical reagent | Mirus | Ingenio Solution | MIR50111 | |
| Chemical compound, reagent | Enhanced chemiluminescence | PerkinElmer, Life Gene | NEL105001EA,AC2103 | |
| chemical compound, reagent | Protein A/G plus-Agarose beads | Santa Cruz Biotechnology | SC-2003 | |
| Commercial assay or kit | NK Cell enrichment kit | STEMCELL Technologies | Cat# 19055 | |
| Commercial assay or kit | Human PE selection kit | STEMCELL Technologies | Cat# 18551 | |
| Software, algorithm | GraphPad Prism | V9.0.1 | RRID:SCR_002798 | |
| Software, algorithm | Adobe Photoshop | CC2019 | ||
| Software, algorithm | FACS Diva | |||
| Software, algorithm | ImageJ 1.53c | https://imagej.nih.gov/ | RRID:SCR_003070 | |
| Cell line (Homo sapiens) | YTS KIR2DL1 | RRID:CVCL_D324;parent: CVCL_1797 (YT); DSMZ no. ACC-434 | Kind gift from Prof. Ofer MandelboimSTR profiling testing was done by DSMZ | |
| Cell line (H. sapiens) | 721.221 HLA-Cw4 | RRID:CVCL_6263;ATCC: CRL-1855 | Kind gift from Prof. Ofer MandelboimSTR profiling was done by ATCC | |
| Cell line (H. sapiens) | 721.221 HLA-Cw7 | RRID:CVCL_6263;ATCC: CRL-1855 | Kind gift from Prof. Ofer MandelboimSTR profiling was done by ATCC | |
| Cell line (H. sapiens) | K562 | RRID:CVCL_0004;DSMZ no. ACC-434 | Kind gift from Prof. Ofer MandelboimSTR profiling testing was done by DSMZ | |
| Biological sample (H. sapiens) | PBMCs | Blood samples from healthy donors were provided by Magen David Adom (MDA; Israeli National Blood Bank)Donor’s identification information remained anonymous | ||
| Strain, strain background (Mus musculus, female) | NOD-Rag1nullIL2rgnull (RAG) | Jackson Labs | NOD-Rag1nullIL2rgnull (RAG) | Details are listed in In vivo conditions and study design table |
| Strain, strain background (M. musculus, female) | NOD-SCID IL2Rgammanull (NSG) | Jackson Labs | NOD-SCID IL2Rgammanull (NSG) | Details are listed in In vivo conditions and study design table |
Additional files
Download links
A two-part list of links to download the article, or parts of the article, in various formats.
Downloads (link to download the article as PDF)
Open citations (links to open the citations from this article in various online reference manager services)
Cite this article (links to download the citations from this article in formats compatible with various reference manager tools)
Inhibition of SHP-1 activity by PKC-θ regulates NK cell activation threshold and cytotoxicity
eLife 11:e73282.
https://doi.org/10.7554/eLife.73282


