Conformational decoupling in acid-sensing ion channels uncovers mechanism and stoichiometry of PcTx1-mediated inhibition
- Center for Biopharmaceuticals, Department of Drug Design and Pharmacology, University of Copenhagen, Denmark
Figures
Figure 1 with 2 supplements
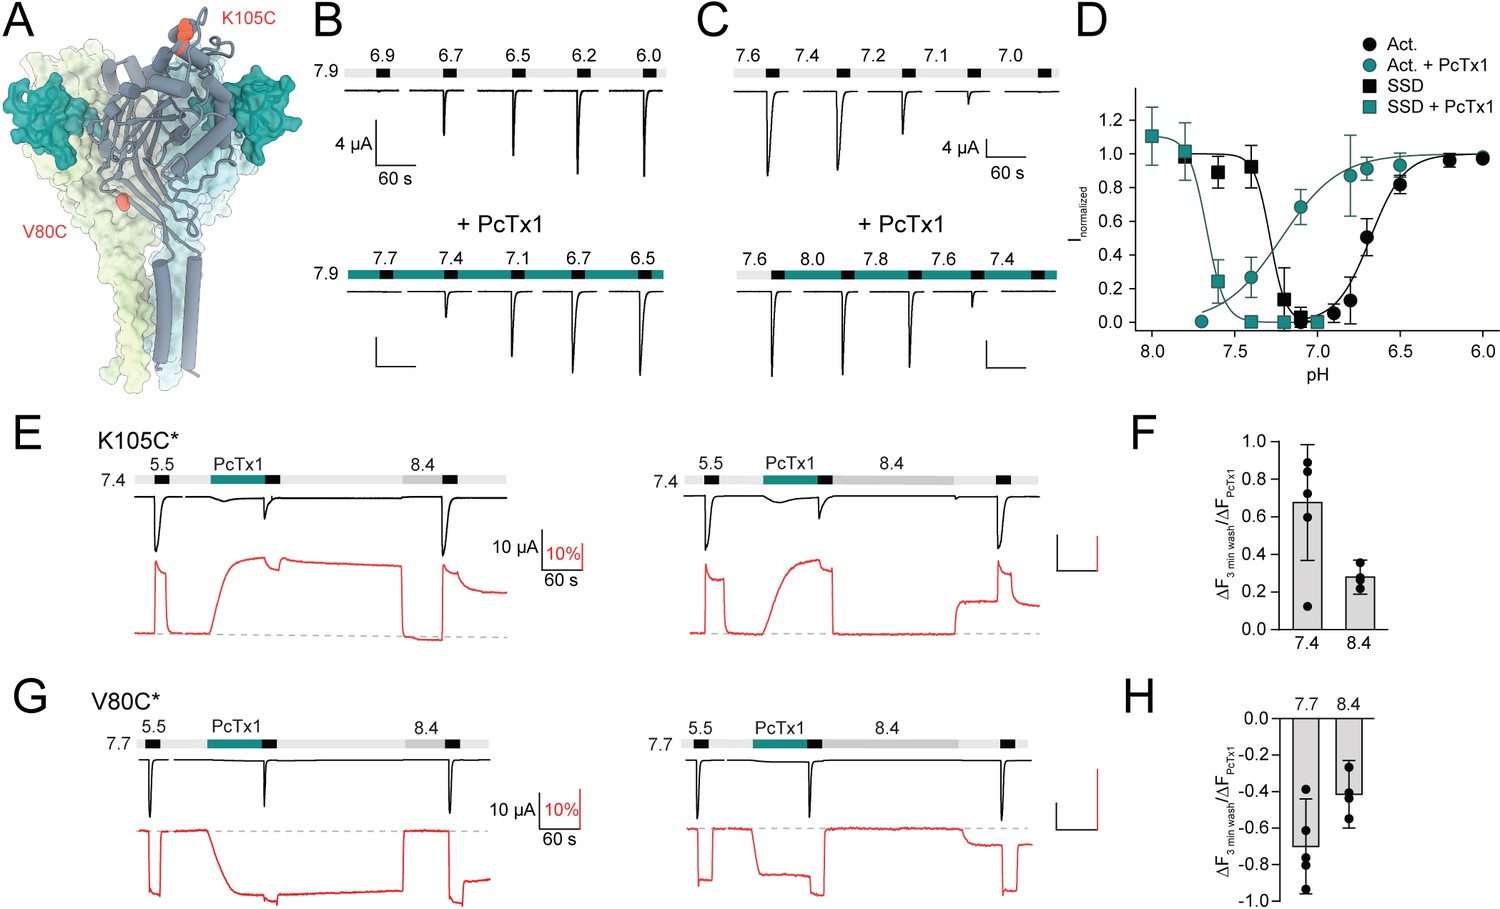
Psalmotoxin-1 (PcTx1) induces a distinct long-lived conformational state in the acid-sensing ion channel 1a (ASIC1a) extracellular domain (ECD).
(A) Structural overview (PDB ID 4FZ0) of chicken ASIC1 with positions V80 and K105, which were substituted for cysteine and used for channel labeling, highlighted in red. PcTx1 (teal) binds to the subunit interfaces. (B) Representative two-electrode voltage-clamp (TEVC) traces recorded from X. laevis oocytes of WT ASIC1a showing pH sensitivity of activation in the absence (upper panel) and presence (lower panel) of 30 nM PcTx1, added in the resting solution (pH 7.9). Scale bars are 4 µA (vertical) and 60 s (horizontal). (C) Same as in (B) but for steady-state desensitization (SSD). PcTx1 was applied to solutions of decreasing pH in between application of activating pH 5.6 solution. Scale bars are 4 µA (vertical) and 60 s (horizontal). (D) Concentration–response relationship of WT ASIC1a activation and SSD in the absence and presence of 30 nM PcTx1 retrieved form experiments shown in (B) and (C) (n = 6–18). (E) Representative traces of voltage-clamp fluorometry (VCF) recordings of K105C* with the current in black and the fluorescence in red. PcTx1 (300 nM) was washed off for 3 min using pH 7.4 (left) or pH 8.4 (right). Scale bars are 60 s (black horizontal), 10 µA (black vertical), and 10% (red vertical). (F) Quantitative analysis of the fluorescence signal at the end of the 3 min washout protocols shown in (E) relative to the fluorescence observed upon PcTx1 application. (G) Representative trace of a VCF recording of V80C* equivalent to the ones shown in (E). Scale bars are 60s (black horizontal), 10 µA (black vertical), and 10% (red vertical).(H) Same as in (F) but for V80C*F350L. Data in (D), (F), and (H) are presented as mean ± 95 CI.
-
Figure 1—source data 1
TEVC data from mASIC1a WT of activation and SSD with and without PcTx1, as shown in Figure 1B-D.
- https://cdn.elifesciences.org/articles/73384/elife-73384-fig1-data1-v2.xlsx
-
Figure 1—source data 2
VCF data from K105C* and V80C* of different PcTx1 washout protocols, as shown in Figure 1E-H and Figure 1—figure supplement 2.
- https://cdn.elifesciences.org/articles/73384/elife-73384-fig1-data2-v2.xlsx
Figure 1—figure supplement 1
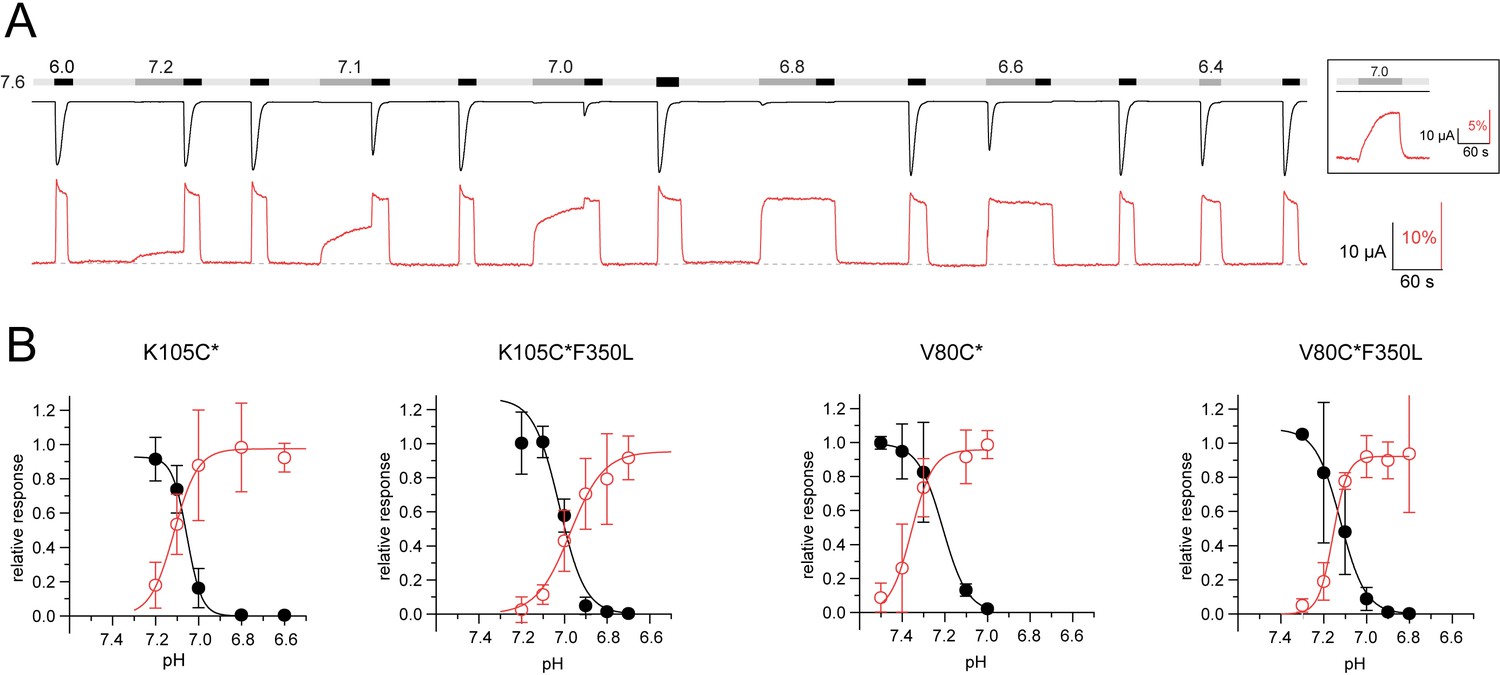
Voltage-clamp fluorometry (VCF) data of pH activation.
(A) Representative trace of a VCF recording of K105C* with the current in black and the fluorescence in red to establish steady-state desensitization (SSD) and pH-dependent fluorescence response. Inset shows pH 7.0 application without subsequent pH 5.5 activation. (B) SSD and fluorescence response curves for different acid-sensing ion channel 1a (ASIC1a) variants based on recording protocols shown in (A). Data are presented as mean ± 95 CI, panel (B) of K105C* is adapted from Borg et al., 2020.
-
Figure 1—figure supplement 1—source data 1
VCF data from mASIC1a K105C* and K105C*F350L of the pH dependent changes in fluorescence and SSD, as shown in Figure 1—figure supplement 1.
- https://cdn.elifesciences.org/articles/73384/elife-73384-fig1-figsupp1-data1-v2.xlsx
-
Figure 1—figure supplement 1—source data 2
VCF data from mASIC1a V80C* and V80C*F350L of the pH dependent changes in fluorescence and SSD, as shown in Figure 1—figure supplement 1.
- https://cdn.elifesciences.org/articles/73384/elife-73384-fig1-figsupp1-data2-v2.xlsx
Figure 1—figure supplement 2
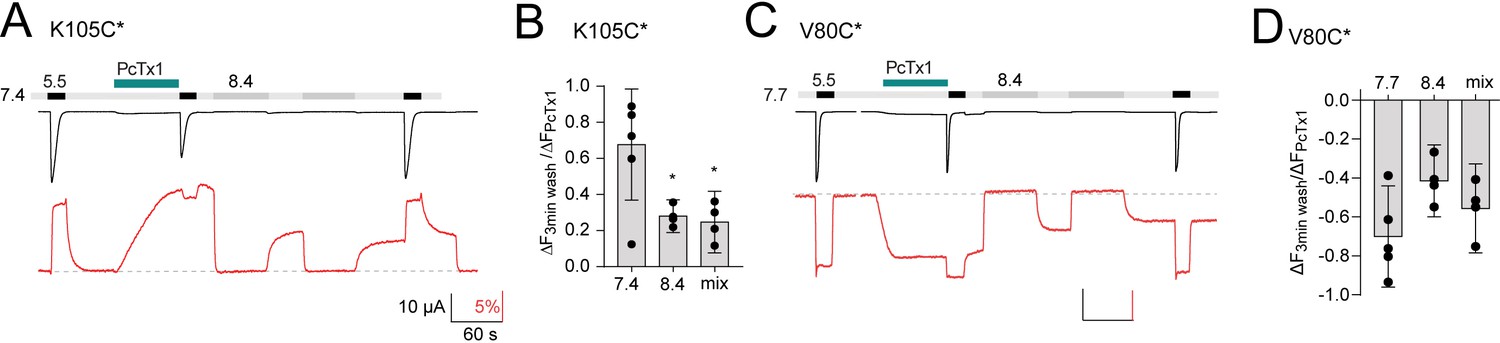
Voltage-clamp fluorometry (VCF) data of psalmotoxin-1 (PcTx1) washout.
(A) Representative trace of a VCF recording of K105C* showing application of PcTx1 (300 nM) washed off for 3 min with alternating pHs (20 s pH 7.4, 60 s pH 8.4, 40 s pH 7.4, 60 s pH 8.4) before switching to pH 7.4 again. (B) Comparison of the fluorescence of K105C* after a 3 min washout of 300 nM PcTx1 using pH 7.4, 8.4, or a mix of the two as shown in the protocol in (A) and Figure 1E and F. (C) Same as in (A) but for V80C* and running buffer 7.7 instead of 7.4. (D) Same as in (B) but for V80C* and base on the protocol shown in (C) and Figure 1G and H. All scale bars are 60 s (black horizontal), 10 µA (black vertical), and 5% (red vertical). Data in (B) and (D) are presented as mean ± 95 CI, ordinary analysis of variance (ANOVA).
Figure 2 with 1 supplement
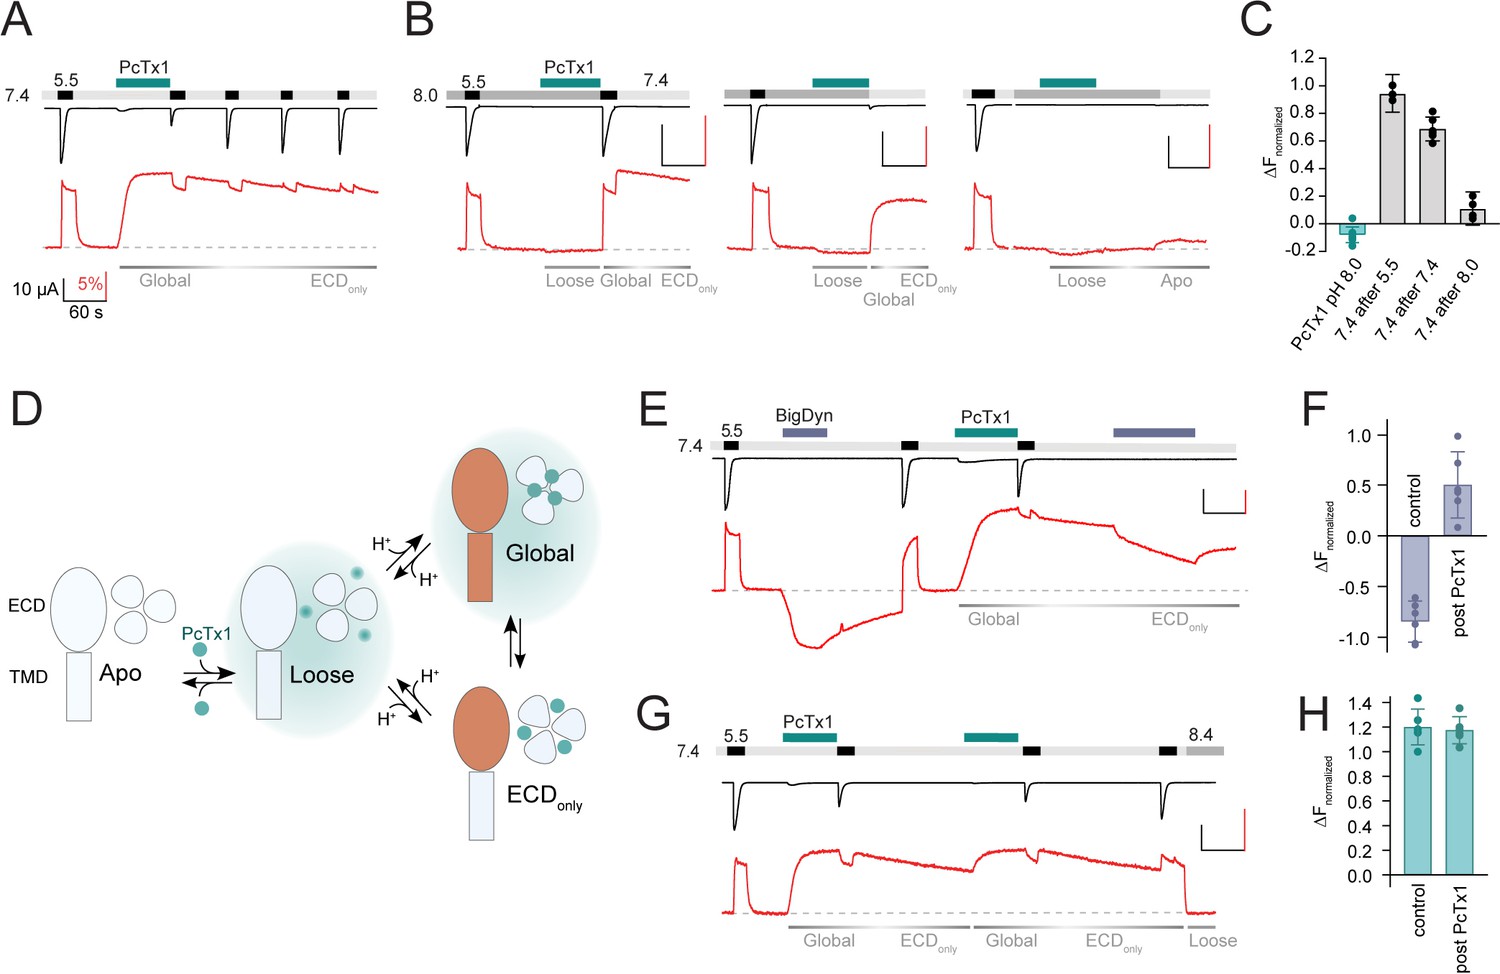
Psalmotoxin-1 (PcTx1) has pH-dependent binding modes and alters acid-sensing ion channel 1a (ASIC1a) pharmacology.
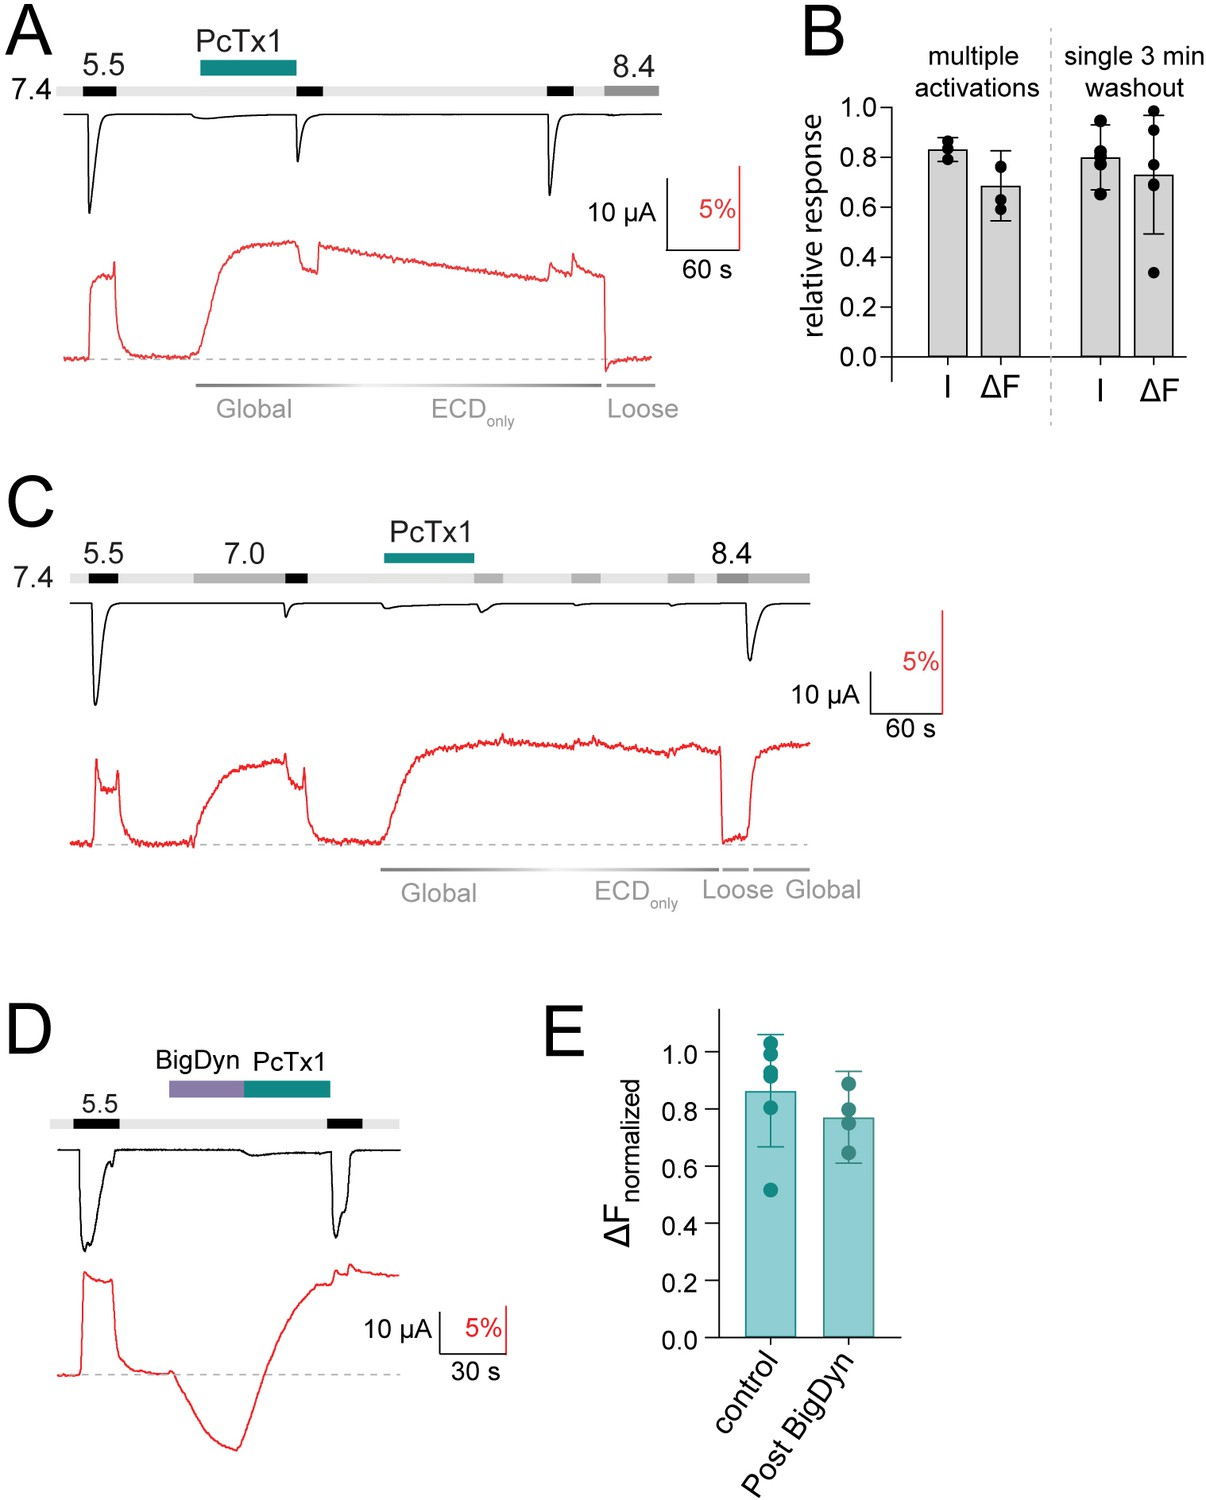
(A) Voltage-clamp fluorometry (VCF) trace of K105C* showing the introduction of the ‘Global’ inhibitory binding mode upon application of 300 nM PcTx1 at pH 7.4. During washout and repeated activation, the channel readily returns to a functional apo state (current, black trace) while the fluorescence change induced by PcTx1 is persistent over multiple ASIC1a activations at pH 5.5 (fluorescence, red trace), characteristic for the ‘ECDonly’ state. (B) VCF traces highlighting the fluorescence changes associated with application of PcTx1 at pH 8.0 with subsequent application of pH 5.5 (left), pH 7.4 (middle), and pH 8.0 (right). Respective PcTx1 binding modes are indicated below the traces. (C) Quantitative comparison of the fluorescence signal 60 s into the pH 7.4 application at the end of the experiments shown in (B) normalized to the fluorescence change induced by pH 5.5 application. (D) Schematic representation of the different pH-dependent binding modes of PcTx1: A ‘Loose’ closed state at high pH, a ‘Global’ state that exists at neutral/low pH that leads to conformational rearrangements in the extracellular domain (ECD) and the pore (indicated in orange), and an ‘ECDonly’ state in which the conformational rearrangements are only found in the ECD and that exists at neutral/low pH even when PcTx1 is absent in the extracellular solution. Teal background shading in the ‘Loose’ and ‘Global’ indicates the presence of PcTx1 in the extracellular solution (although not mandatory, see text for details). (E) VCF trace of K105C* exposed to pH 5.5, followed by a 60 s big dynorphin (BigDyn) (1 µM) application (purple bar), with subsequent washout and activation. BigDyn is reapplied after the ‘ECDonly’ state has been evoked through PcTx1 (300 nM) application, this time resulting in a smaller decrease in the fluorescence signal. (F) Quantitative comparison of the fluorescence change induced by a 60 s BigDyn application to the apo (control) and to the PcTx1-induced ‘ECDonly’ state (post PcTx1), normalized to the signal induced by pH 5.5. (G) VCF trace of K105C* where 300 nM PcTx1 is applied to the ‘ECDonly’ state. (H) Quantitative analysis of the protocol shown in (G) comparing the fluorescence change induced by PcTx1 to the apo state at 7.4 (control) with the PcTx1 application to the ‘ECDonly’ state. All scale bars are 60 s (black horizontal), 10 µA (black vertical), and 5% (red vertical). Data in (C), (F), and (H) are presented as mean ± 95 CI.
-
Figure 2—source data 1
VCF data from mASIC1a K105C* of single and multiple activations during PcTx1 washout, as shown in Figure 2A and Figure 2—figure supplement 1A, B.
- https://cdn.elifesciences.org/articles/73384/elife-73384-fig2-data1-v2.xlsx
-
Figure 2—source data 2
VCF data from mASIC1a K105C* of PcTx1 application at pH 8.0 followed by different washout protocols, as seen in Figure 2B, C.
- https://cdn.elifesciences.org/articles/73384/elife-73384-fig2-data2-v2.xlsx
-
Figure 2—source data 3
VCF data of mASIC1a K105C* of BigDyn and PcTx1 application, as seen in Figure 2E-H and Figure 2—figure supplement 1D, E.
- https://cdn.elifesciences.org/articles/73384/elife-73384-fig2-data3-v2.xlsx
Figure 2—figure supplement 1
Voltage-clamp fluorometry (VCF) data of psalmotoxin-1 (PcTx1) modulation and pharmacology.
(A) Representative VCF trace of K105C* showing application of PcTx1 (300 nM) washout for 3 min before pH 5.5 stimulus. Corresponding binding modes are indicated below. (B) Comparison of the final pH 5.5-induced current (I) and fluorescence (ΔF) at pH 7.4 in recordings shown in Figure 2A, where channels undergo three 1 min washouts at pH 7.4, each followed by pH 5.5 stimulus (left) or the protocol shown in (A) with a single 3 min washout (right). The final pH 5.5-induced current was normalized to the one at the beginning of the recording, the fluorescence was analyzed right before the final pH 5.5 activation and normalized to the deflection induced by PcTx1. (C) Representative VCF trace of K105C* showing pH 7.0 stimuli at various states of the recording. Corresponding binding modes are indicated below. (D) Representative trace of a VCF recording of K105C* depicting 30 s pre-conditioning with big dynorphin (BigDyn) (1 μM) and subsequent 30 s PcTx1 (300 nM) application and pH 5.5 activation. (E) Quantitative comparison of the fluorescence change induced by 300 nM PcTx1 at pH 7.4 in the apo state (control) and after BigDyn (1 μΜ) application, normalized to the signal induced by pH 5.5. Data in (B) and (E) are presented as mean ± 95CI.
Figure 3
The F350L mutation diminishes psalmotoxin-1 (PcTx1) sensitivity by destabilizing the toxin-induced conformation.
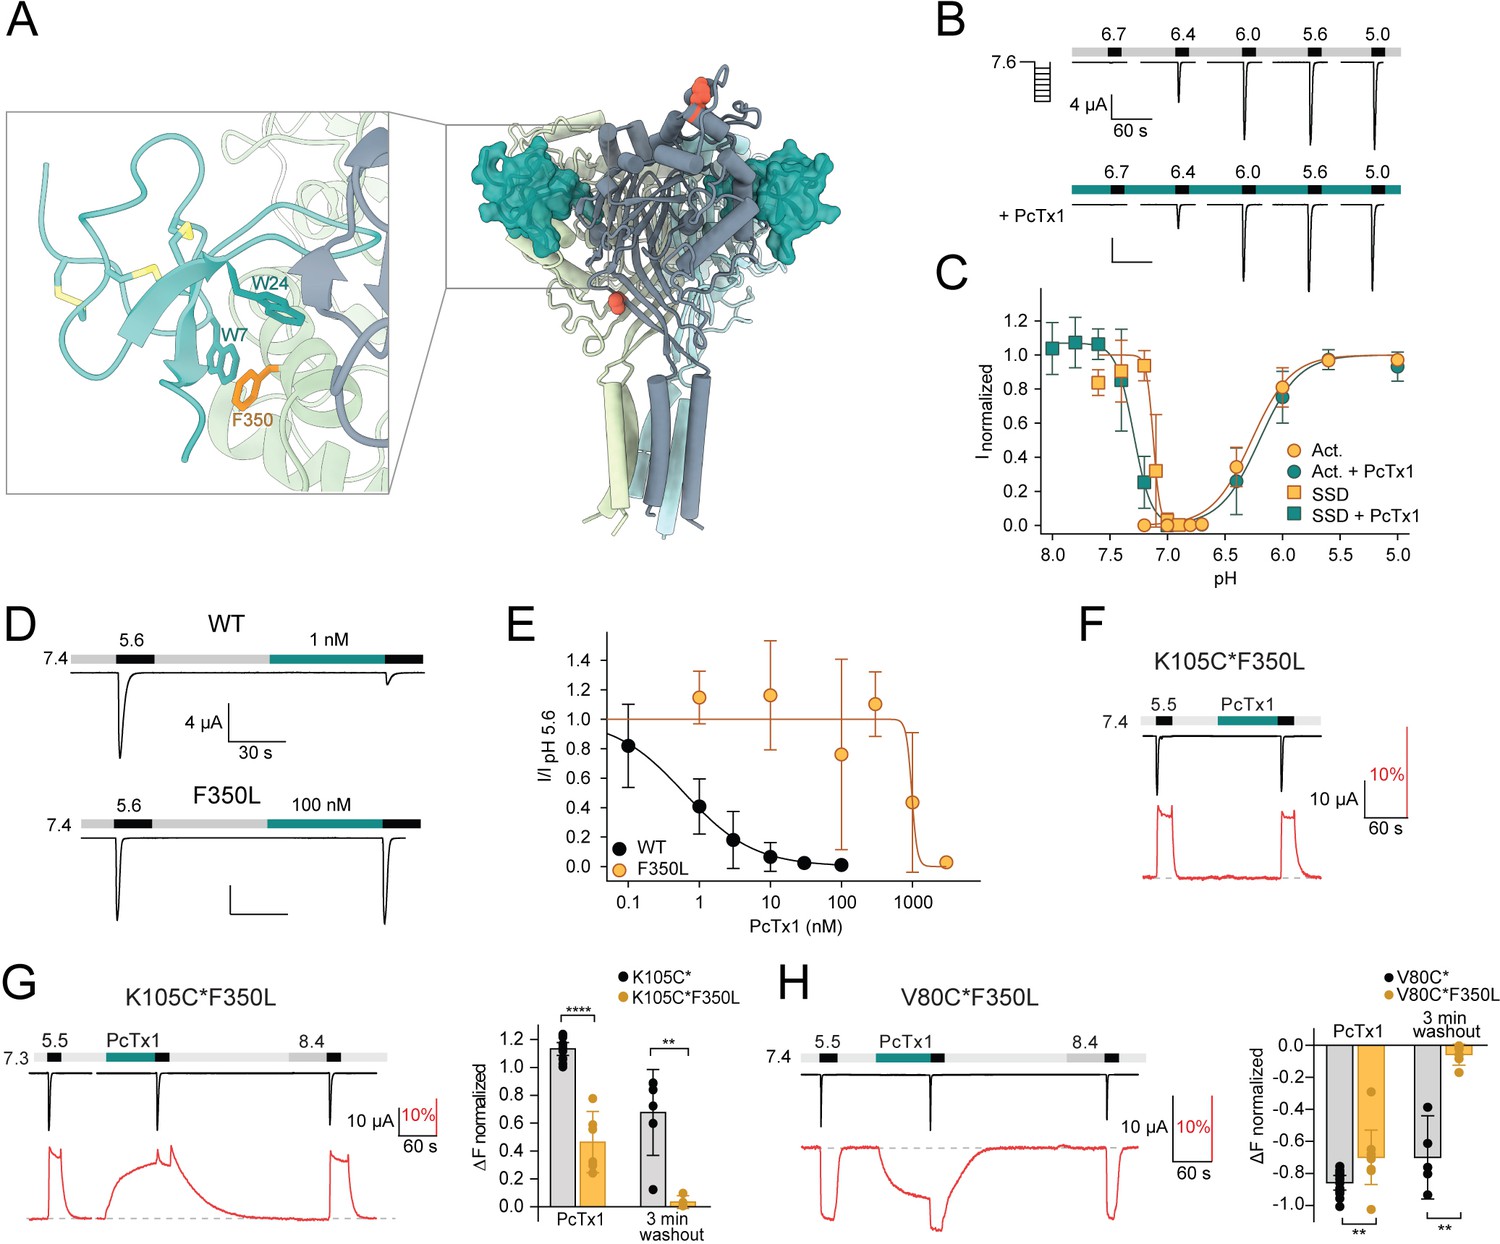
(A) Model of the co-crystal structure of cASIC1a and PcTx1 (teal) binding to the extracellular domain (PDBID 4FZO). Inset shows a closeup of the interaction site at the acidic pocket, including acid-sensing ion channel 1a (ASIC1a) residue F350 (orange). (B) Representative two-electrode voltage-clamp (TEVC) trace showing mASIC1a F350L pH activation in the absence (top) and presence (bottom) of 30 nM PcTx1. Scale bars are 4 µA (vertical) and 60 s (horizontal). (C) Activation and steady-state desensitization (SSD) curve of F350L mASIC1a without (orange) and with (teal) 30 nM PcTx1 (n = 5–12). (D) TEVC traces showing the effect of 1 nM PcTx1 on mASIC1a WT (top) and 100 nM PcTx1 on F350L (bottom) applied at pH 7.4. Scale bars are 4 µA (vertical) and 30 s (horizontal). (E) PcTx1 concentration–response curve at pH 7.4 using the protocol shown in (D) (WT: n = 9–14, F350L: n = 4–7). (F) Representative voltage-clamp fluorometry (VCF) trace of the K105C*F350L mutant showing application of 300 nM PcTx1 at pH 7.4. (G) Left: representative VCF trace of the K105C*F350L mutant showing application of 300 nM PcTx1 at pH 7.3. Right: comparison of the fluorescence change upon PcTx1 application and after a 3 min washout between K105C* and K150C*F350L. (H) Left: representative trace of a VCF recording of V80C*F350L equivalent to the one shown in (G). Right: same analysis as in (G) but compared between V80C* and V80C*F350L. Data in (C), (E), (G), and (H) are presented as mean ± 95 CI, unpaired Mann–Whitney test, **p<0.005, ****p<0.0001.
-
Figure 3—source data 1
TEVC data from mASIC1a F350L of activation and SSD with and without PcTx1, as shown in Figure 3B, C.
- https://cdn.elifesciences.org/articles/73384/elife-73384-fig3-data1-v2.xlsx
-
Figure 3—source data 2
TEVC data from mASIC1a WT and F350L of PcTx1 concentration-response curve, as shown in Figure 3D, E.
- https://cdn.elifesciences.org/articles/73384/elife-73384-fig3-data2-v2.xlsx
-
Figure 3—source data 3
VCF data from mASIC1a K105C*(F350L) and V80C*(F350L) of application and washout of PcTx1, as shown in Figure 3F-G.
- https://cdn.elifesciences.org/articles/73384/elife-73384-fig3-data3-v2.xlsx
Figure 4 with 2 supplements
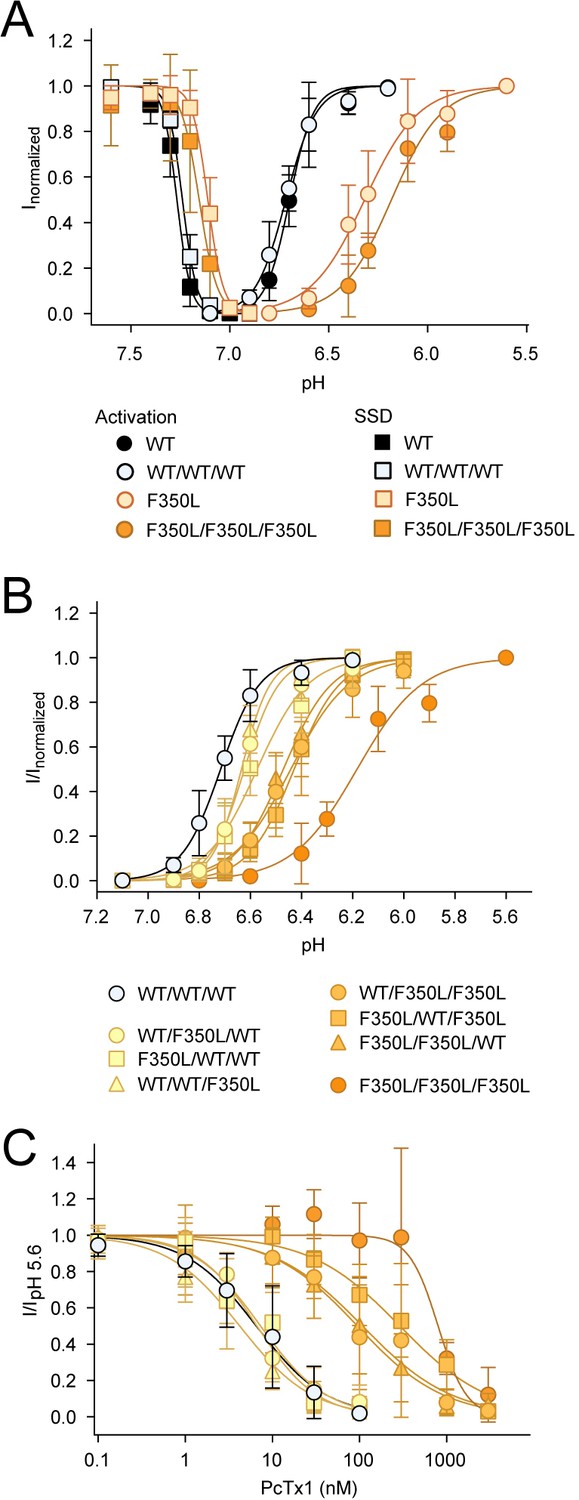
In concatemeric constructs, two WT subunits are sufficient for WT-like psalmotoxin-1 (PcTx1) inhibition.
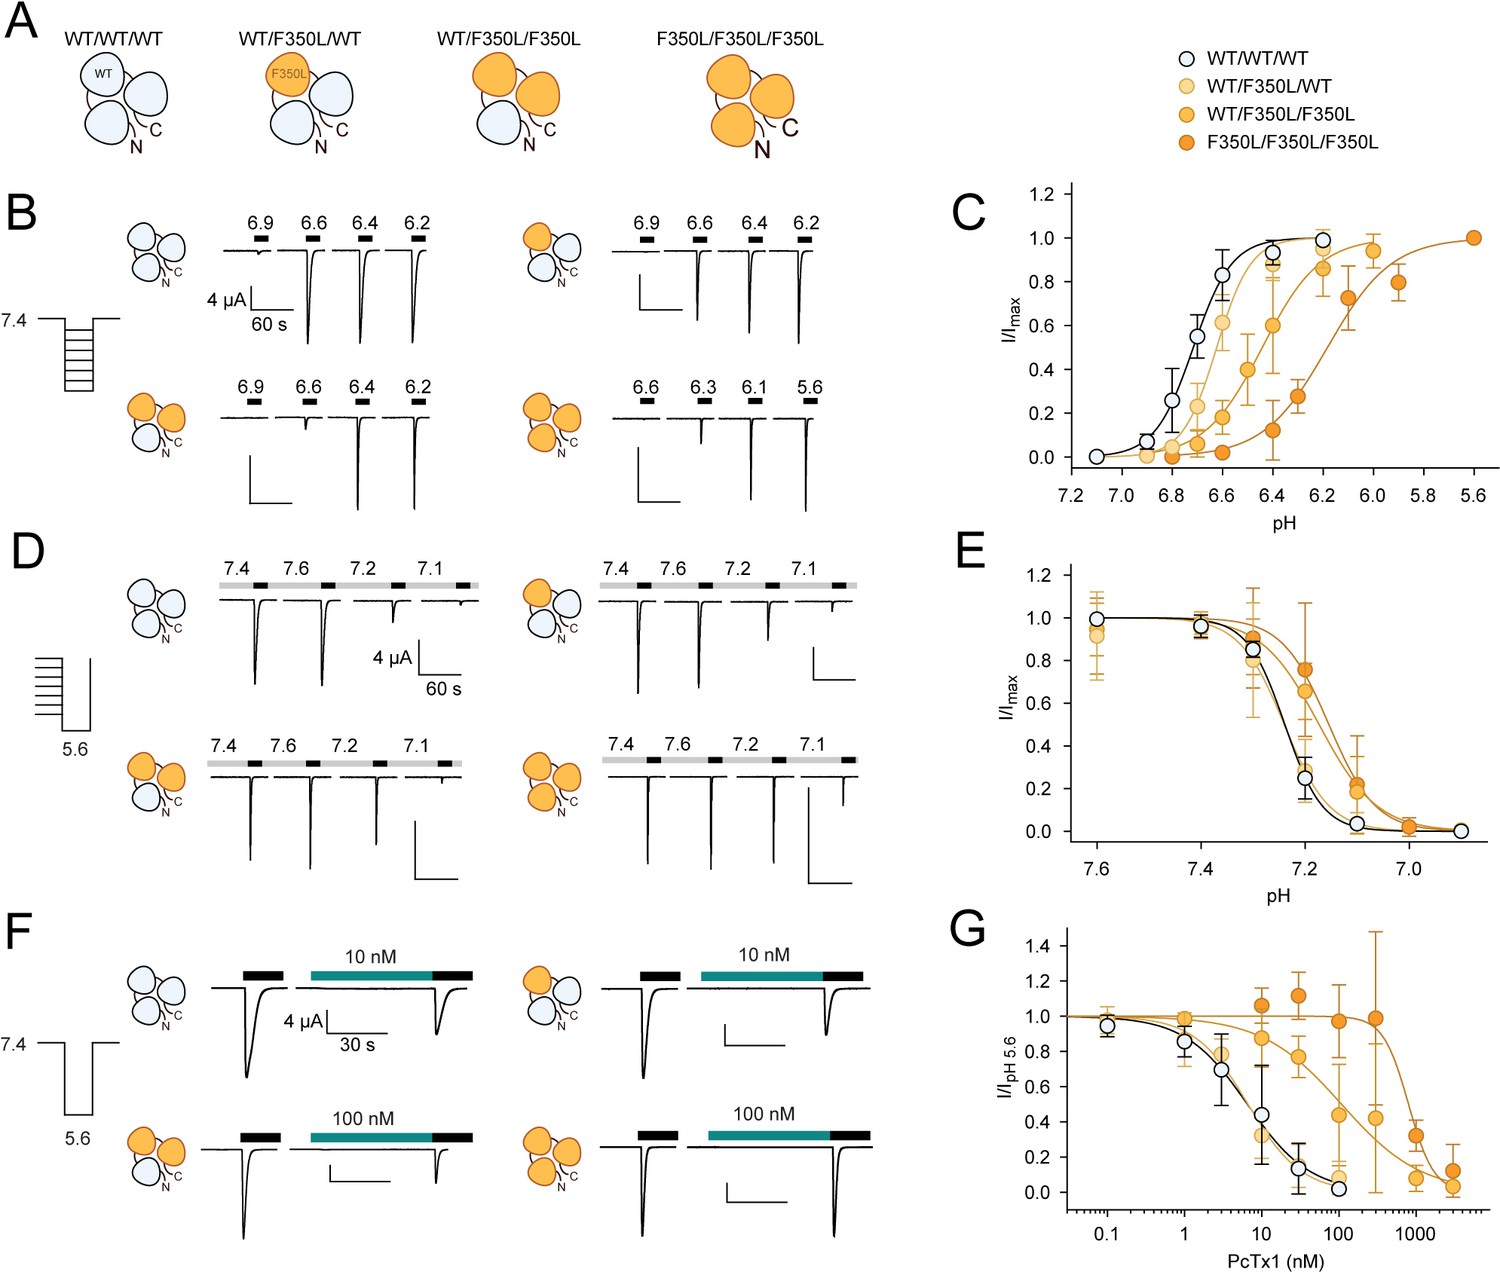
(A) Schematic overview of the concatemeric constructs containing the F350L mutation (orange) in none, one, two, or all three subunits. (B) Representative two-electrode voltage-clamp (TEVC) trace of activation (C) Activation curve from recordings shown in (B) for the four different concatemeric constructs (n = 7–13). (D) Representative TEVC trace of steady-state desensitization (SSD). (E) SSD profiles from recordings shown in (D) (n = 4–11). (F) Representative TEVC trace of concentration-dependent PcTx1 inhibition at pH 7.4. (G) PcTx1 concentration–response curves from data shown in (F) (n = 4–11). Scale bars are 4 µA (vertical) and 60 s (horizontal) for (B, D) and 30 s for (F). Data points in (C, E and G) represent mean ± 95CI.
-
Figure 4—source data 1
TEVC data from concatemeric mASIC1a of pH-dependent activation, as shown in Figure 4B, C and Figure 4—figure supplement 2B.
- https://cdn.elifesciences.org/articles/73384/elife-73384-fig4-data1-v2.xlsx
-
Figure 4—source data 2
TEVC data from concatemeric mASIC1a of SSD, as shown in Figure 4D, E.
- https://cdn.elifesciences.org/articles/73384/elife-73384-fig4-data2-v2.xlsx
-
Figure 4—source data 3
TEVC data from concatemeric mASIC1a of PcTx1 concentration–response curve, as shown in Figure 4F, G and Figure 4—figure supplement 2C.
- https://cdn.elifesciences.org/articles/73384/elife-73384-fig4-data3-v2.xlsx
Figure 4—figure supplement 1
Concatemer design and validation.
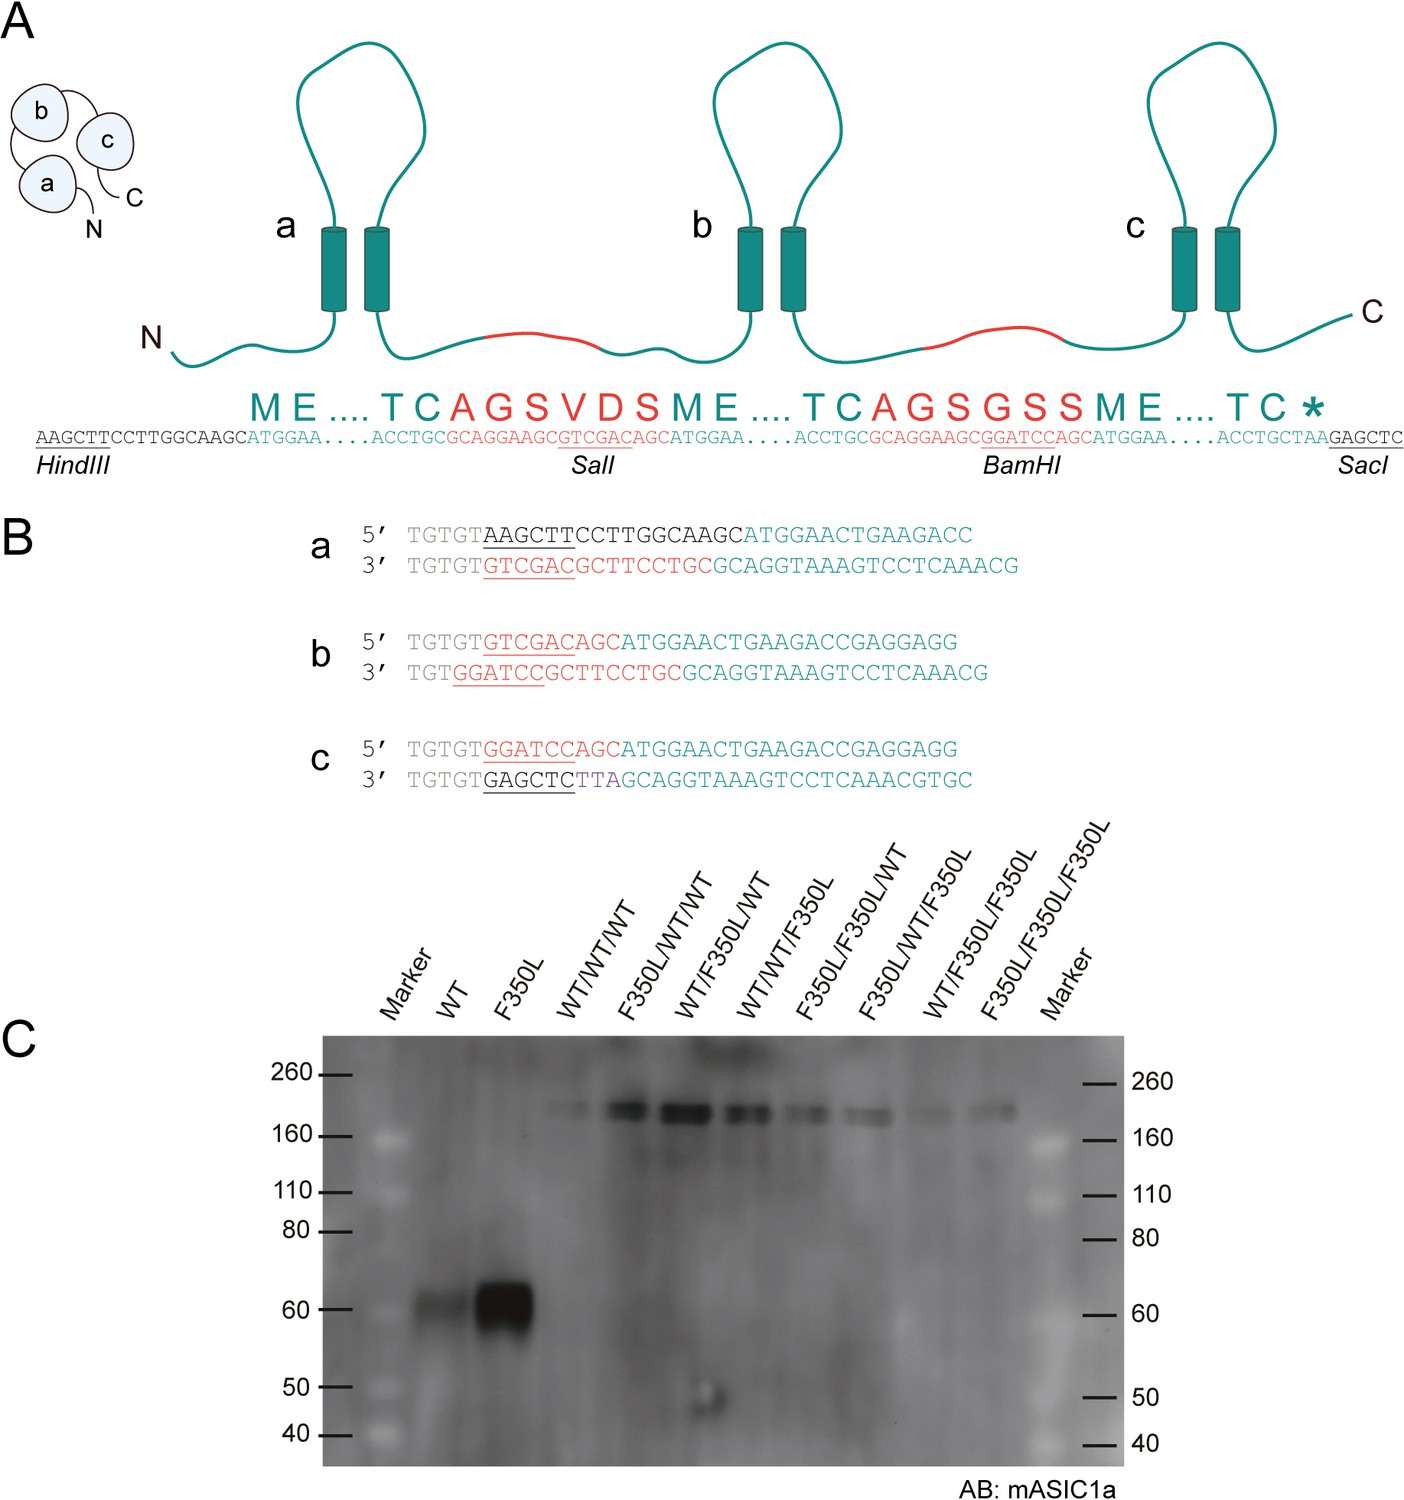
(A) Schematic representation of the concatemer design showing mASIC1a sequence in teal, linkers that connect subunits a, b, and c in red, with restriction sites underlined. (B) Primer pairs used to generate inserts a–c for ligation into the concatemer constructs. Nucleotide spacers and untranslated sequences are shown in gray, restriction sites are shown in red, peptide linker are shown in black, and mASIC1a sequence is in teal. (C) Western blot of surface-purified membrane protein from oocytes expressing monomeric or concatemeric acid-sensing ion channel 1a (ASIC1a) constructs using a mASIC1a-specific antibody. Bands for monomeric ASIC1a WT and F350L subunits appear at ~60 kDa while the bands for concatemeric ASIC1a constructs appear at ~180 kDa, corresponding to three covalently linked ASIC1a subunits. Panels (A, B) adapted from Lynagh et al., 2017.
Figure 4—figure supplement 2
Sensitivity of concatemers to pH and psalmotoxin-1 (PcTx1).
(A) Activation and steady-state desensitization (SSD) curves for trimeric and concatemeric WT and F350L channels in comparison. (B) Activation curves for all concatemeric variants showing that concatemers with the same number of F350L-bearing subunits cluster around similar pH sensitivities. (C) Same as in (B), but for concentration-dependent PcTx1 inhibition. Data are presented as mean ± 95 CI.
Figure 5 with 1 supplement
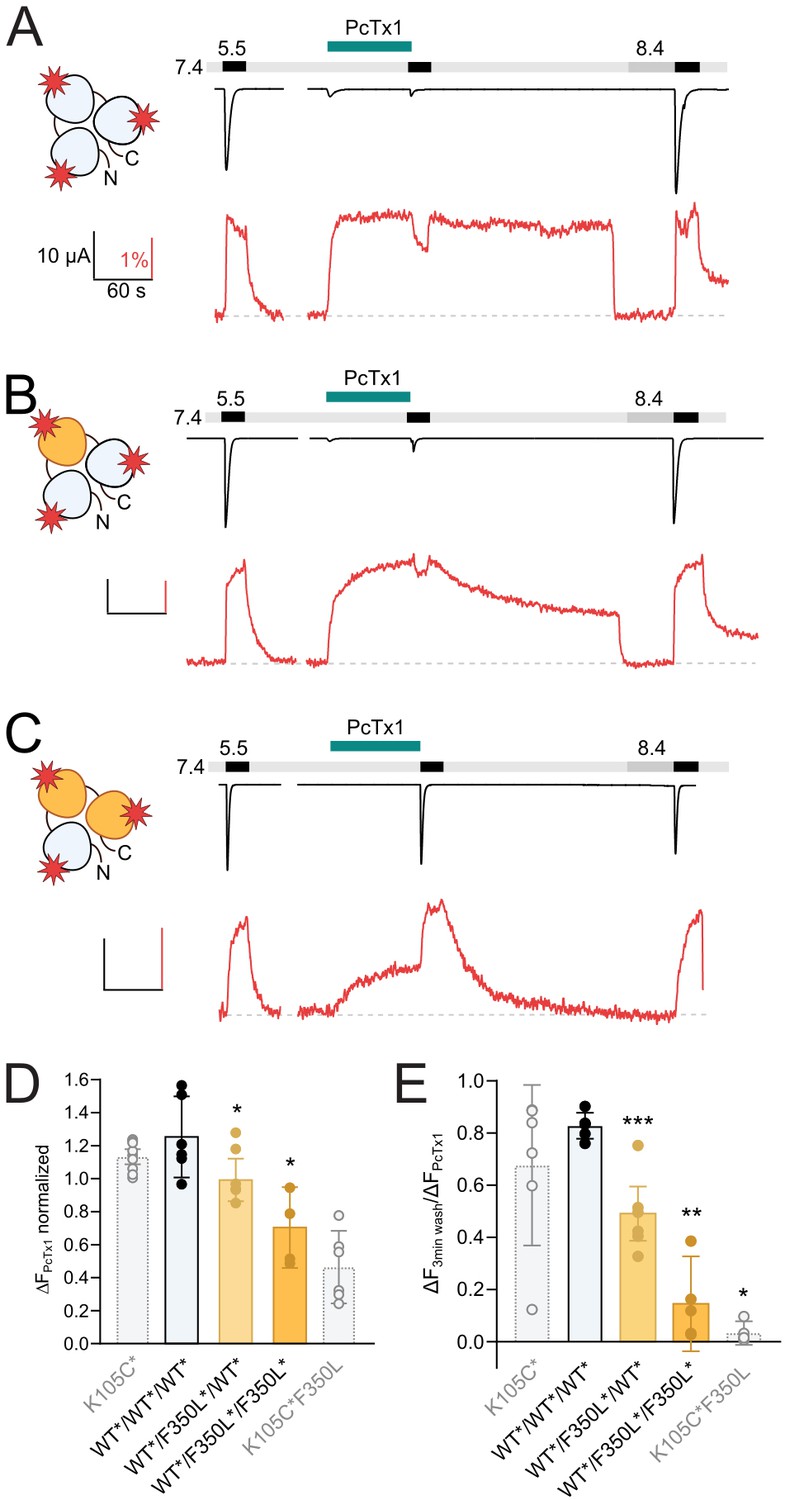
One F350L subunit is sufficient to destabilize the psalmotoxin-1 (PcTx1)-induced extracellular domain (ECD) conformation.
(A) Representative voltage-clamp fluorometry (VCF) trace of 300 nM PcTx1 application to a concatemeric construct labeled at K105C* in all three subunits (red star) and subsequent washout for 3 min with pH 7.4 and 40 s pH 8.4. (B) Same as in (A) but one subunit carries a F350L mutation. (C) Same as in (A) but with two subunits carry a F350L mutation. (D) Comparison of the PcTx1-induced change in the fluorescence signal between the different concatemeric constructs shown in (A–C). Results from non-concatenated channels are indicated for comparison (shown in light gray). (E) Comparison of the fluorescence intensity after a 3 min washout relative to the intensity upon PcTx1 application. Results from non-concatenated channels are indicated for comparison (shown in light gray). All scale bars represent 10 μA (black vertical), 60 s (black horizontal), 1% (red vertical). In (D) and (E), error bars represents 95CI, unpaired Mann–Whitney test to neighboring bar on the left, *p<0.05, **p<0.005, ***p<0.0005.
-
Figure 5—source data 1
VCF data from concatemeric mASIC1a of PcTx1 application and washout as shown in Figure 5.
- https://cdn.elifesciences.org/articles/73384/elife-73384-fig5-data1-v2.xlsx
Figure 5—figure supplement 1

Voltage-clamp fluorometry (VCF) data of pH-dependent desensitization and fluorescence response of concatemers.
(A) Steady-state desensitization (SSD) and fluorescence response curves for the WT*/WT*/WT* concatemer. (B) Same as in (A) but for WT*/F350L*/WT* (C) Same as in (A) but for WT*/F350L*/F350L*. Data are presented as mean ± 95 CI.
-
Figure 5—figure supplement 1—source data 1
VCF data from concatemeric mASIC1a of the pH–dependent changes in fluorescence and SSD, as seen in Figure 5—figure supplement 1.
- https://cdn.elifesciences.org/articles/73384/elife-73384-fig5-figsupp1-data1-v2.xlsx
Figure 6
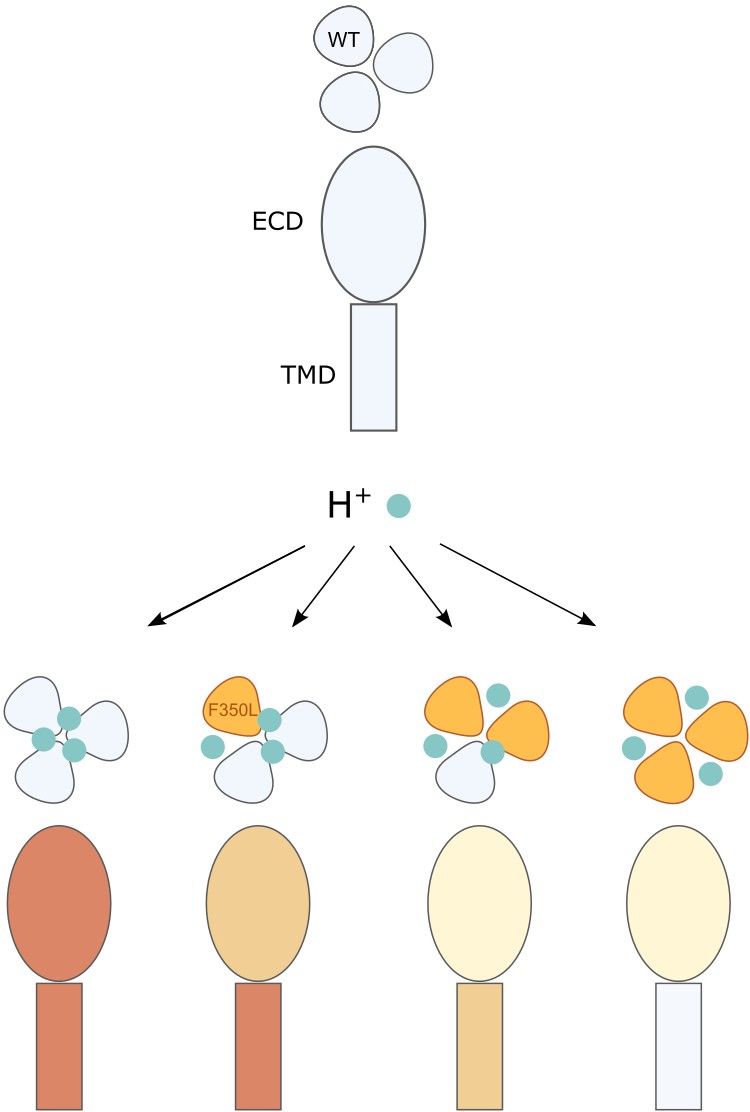
Illustration of the conformational and functional stoichiometry of psalmotoxin-1 (PcTx1) binding.
Schematic representation of a side view of acid-sensing ion channel 1a (ASIC1a) extracellular domain (ECD) and transmembrane domain (TMD) and top view of the three subunits and consequences of PcTx1 (teal) binding at neutral/low pH (as in Figure 2D) and with the F350L mutation (orange) in 0–3 subunits. The side view coloring shows the decreasing stability of the PcTx1-induced ‘ECDonly’ state with increasing number of F350L-containing subunits, and the decreasing inhibitory effect on the pore. In channels with a single F350L subunit, only the PcTx1-induced conformational state of the ECD is affected, while the TMD behaves WT-like.
Author response image 1
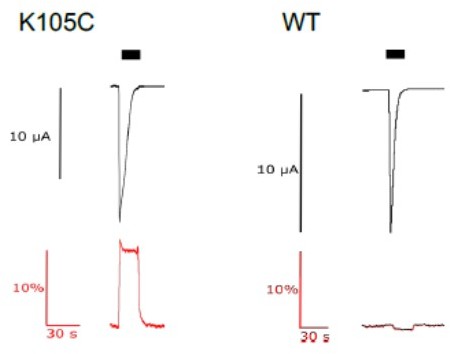
current (upper trace in black) and fluorescence (lower trace in red) recorded from labeled oocytes expressing K105C or WT mASIC1a.
Author response image 2
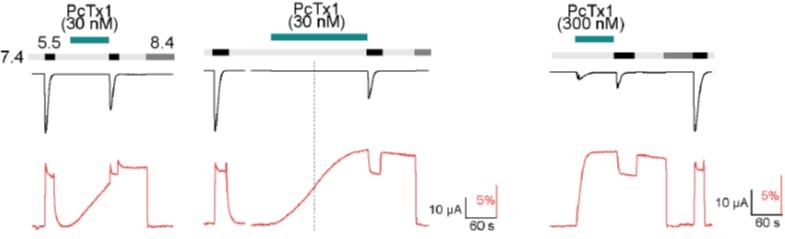
current (upper trace in black) and fluorescence (lower trace in red) recorded from labeled oocytes expressing K105C mASIC1a.
The dashed line indicates the 80 s mark since the start of the PcTx1 application.
Additional files
-
Supplementary file 1
Data tables.
(a). Effect of psalmotoxin-1 (PcTx1) on activation and steady-state desensitization (SSD) of WT and F350L mASIC1a. Data are reported as mean with 95 CI in brackets. (b). SSD and pH-dependent changes in fluorescence for labeled mASIC1a constructs. Data are reported as mean with 95 CI in brackets. (c). Resulting fluorescence change upon application of 300 nM PcTx1 for mASIC1a-labeled constructs. Data are reported as mean with 95 CI in brackets. (d). Change in fluorescence after a 3 min washout of 300 nM PcTx1. Data are reported as mean with 95 CI in brackets. (e). Comparison of current and fluorescence in experiments where 300 nM PcTx1 were applied at pH 7.4. The channels then underwent three 1 min washouts each followed by pH 5.5 stimulus or a single 3 min washout with pH 7.4 followed by a pH 5.5 stimulus. The final pH 5.5 current was normalized to the one at the beginning of the recording, and the fluorescence was analyzed at pH 7.4 right before the final pH 5.5 activation and normalized to deflection induced by PcTx1. Data are reported as mean with 95 CI in brackets. (f) Fluorescence after PcTx1 applications at pH 8.0 followed by different pH regimes (pH 5.5, 7.4, or 8.0) and a washout with pH 7.4. Fluorescence is reported 1 min into the final pH 7.4 application. Data are reported as mean with 95 CI in brackets. (g) Resulting fluorescence change upon peptide application K105C* mASIC1a normalized to the fluorescence response elicited by pH 5.5 application. Big dynorphin (BigDyn) was applied at a concentration of 1 µM, and PcTx1 was applied at a concentration of 300 nM. The fluorescence change was monitored 1 min after application for BigDyn and 30–60 s after application for PcTx1. Data are reported as mean with 95 CI in brackets. (h) Summary of PcTx1 inhibition of mASIC1a constructs. Data are reported as mean with 95 CI in brackets. (i) pH sensitivity of activation and SSD for mASIC1a constructs. Data are reported as mean with 95 CI in brackets.
- https://cdn.elifesciences.org/articles/73384/elife-73384-supp1-v2.docx
-
Transparent reporting form
- https://cdn.elifesciences.org/articles/73384/elife-73384-transrepform1-v2.docx
Download links
A two-part list of links to download the article, or parts of the article, in various formats.
Downloads (link to download the article as PDF)
Open citations (links to open the citations from this article in various online reference manager services)
Cite this article (links to download the citations from this article in formats compatible with various reference manager tools)
Conformational decoupling in acid-sensing ion channels uncovers mechanism and stoichiometry of PcTx1-mediated inhibition
eLife 11:e73384.
https://doi.org/10.7554/eLife.73384


