Aging is associated with increased brain iron through cortex-derived hepcidin expression
- Feinberg Cardiovascular and Renal Research Institute, Northwestern University School of Medicine, United States
- Department of Pathology, University of Michigan School of Medicine, United States
Figures
Figure 1
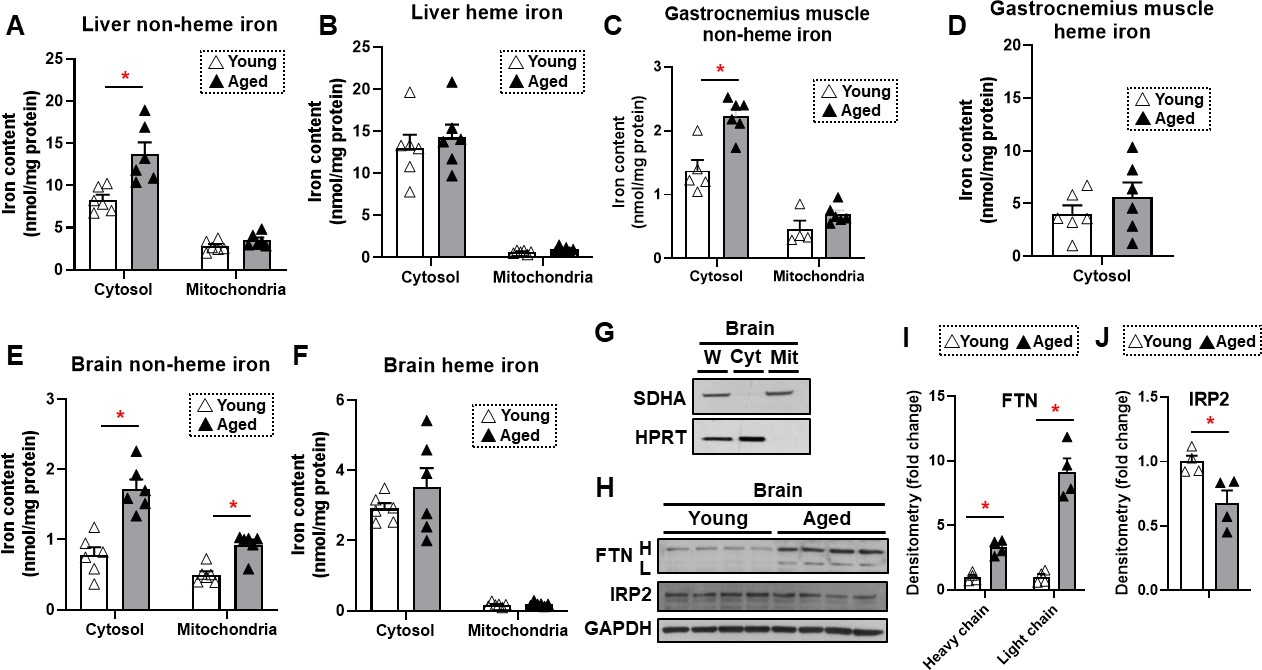
Non-heme iron is increased in the cytosol and mitochondria of the brain cortex with aging.
Liver non-heme (A) and heme (B) iron in young (4 months old) and old (22 months old) mice from the cytosol and mitochondria (n=6). Gastrocnemius non-heme (C) and heme (D) iron in young and old mice from the cytosol and mitochondria (n=6). Outliers in non-heme iron in the cytosol (n=1) and in the mitochondria (n=2) were excluded. Mitochondrial heme iron in gastrocnemius muscle was not detectable in our studies. Brain non-heme (E) and heme (F) iron in young and old mice from the cytosol and mitochondria (n=6). (G) Immunoblots of mitochondrial and cytosolic markers, confirming the purity of mitochondrial isolation in the brain cortex tissue. W = whole cell lysate, Cyt = cytosolic fraction, Mit = mitochondrial fraction, SDHA = Succinate Dehydrogenase Complex Flavoprotein Subunit A, HPRT = hypoxanthine phosphoribosyltransferase. (H) Immunoblots of FTN and IRP2 in the brain of young and aged mice (n=4). FTN = ferritin, IRP2 = iron regulatory protein 2, H = heavy chain, L = light chain. Densitometric quantification of light and heavy chain FTN (I) and IRP2 (J) in the brain of young and aged mice. * p<0.05.
-
Figure 1—source data 1
Full-length images of immunoblots shown in Figure 1.
- https://cdn.elifesciences.org/articles/73456/elife-73456-fig1-data1-v1.pptx
-
Figure 1—source data 2
Iron measurement – Original data of iron measurements shown in Figure 1.
- https://cdn.elifesciences.org/articles/73456/elife-73456-fig1-data2-v1.xlsx
-
Figure 1—source data 3
Densitometry – Original data of densitometric quantifications of immunoblots shown in Figure 1.
- https://cdn.elifesciences.org/articles/73456/elife-73456-fig1-data3-v1.xlsx
Figure 2
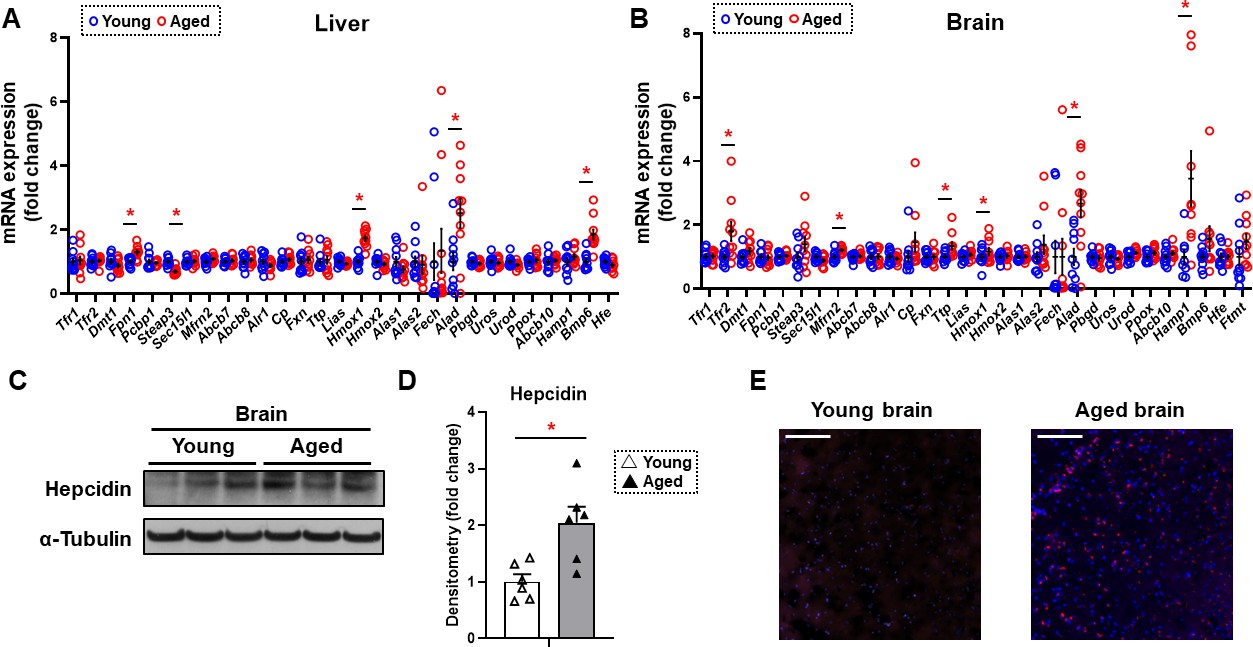
Hepcidin protein expression is significantly increased in the aged brain cortex.
mRNA levels of proteins involved in iron regulation in the liver (A) and brain (B) in young (4 months old) and old (22 months old) mice (n=10/group). Means and SEM are indicated as horizontal and vertical bars, respectively. An undetected measurement (n=1) in the brain Fech and undetected measurements (n=2) and an outlier (n=1) in the brain Hamp1 were excluded. Tfr1 = transferrin receptor 1, Tfr2 = transferrin receptor 2, Dmt1 = divalent metal transporter 1, Fpn1 = ferroportin 1, Pcbp1 = Poly(RC) Binding Protein 1, Steap3 = Metalloreductase Six-Transmembrane Epithelial Antigen Of Prostate 3, Sec15l1 = exocyst complex component 6, Mfrn2 = mitoferrin 2, Abcb7 = ATP-binding cassette sub-family B member 7, Abcb8 = ATP-binding cassette sub-family B member 8, Alr1 = augmenter of liver regeneration, Cp = ceruloplasmin, Fxn = frataxin, Ttp = tristetraprolin, Lias = tristetraprolin, Hmox1 = heme oxygenase 1, Hmox2 = heme oxygenase 2, Alas1 = 5′-aminolevulinate synthase 1, Alas2 = 5′-aminolevulinate synthase 2, Fech = ferrochelatase, Alad = aminolevulinate dehydratase, Pbgd = porphobilinogen deaminase, Uros = uroporphyrinogen III synthase, Urod = uroporphyrinogen decarboxylase, Ppox = protoporphyrinogen oxidase, Abcb10 = ATP-binding cassette, sub-family B member 10, Hamp1 = hepcidin1, Bmp6 = bone morphogenetic protein 6, Hfe = homeostatic iron regulator, Ftmt = mitochondrial ferritin. (C) Representative immunoblot for hepcidin1 in the brain (n=6). (D) Summary of densitometry analysis of panel (C). (E) Representative immunohistochemistry of hepcidin1 (Red = anti-hepcidin1, blue = DAPI) in the brain frontal cortex of young and aged mice. Scale bar=200 µm. * p<0.05.
-
Figure 2—source data 1
Full-length images of immunoblots shown in Figure 2.
- https://cdn.elifesciences.org/articles/73456/elife-73456-fig2-data1-v1.pptx
-
Figure 2—source data 2
qRT-PCR liver – Original data of qRT-PCR in the liver shown in Figure 2.
- https://cdn.elifesciences.org/articles/73456/elife-73456-fig2-data2-v1.xlsx
-
Figure 2—source data 3
qRT-PCR brain – Original data of qRT-PCR in the brain shown in Figure 2.
- https://cdn.elifesciences.org/articles/73456/elife-73456-fig2-data3-v1.xlsx
-
Figure 2—source data 4
Densitometry – Original data of densitometry quantifications of immunoblots shown in Figure 2.
- https://cdn.elifesciences.org/articles/73456/elife-73456-fig2-data4-v1.xlsx
Figure 3
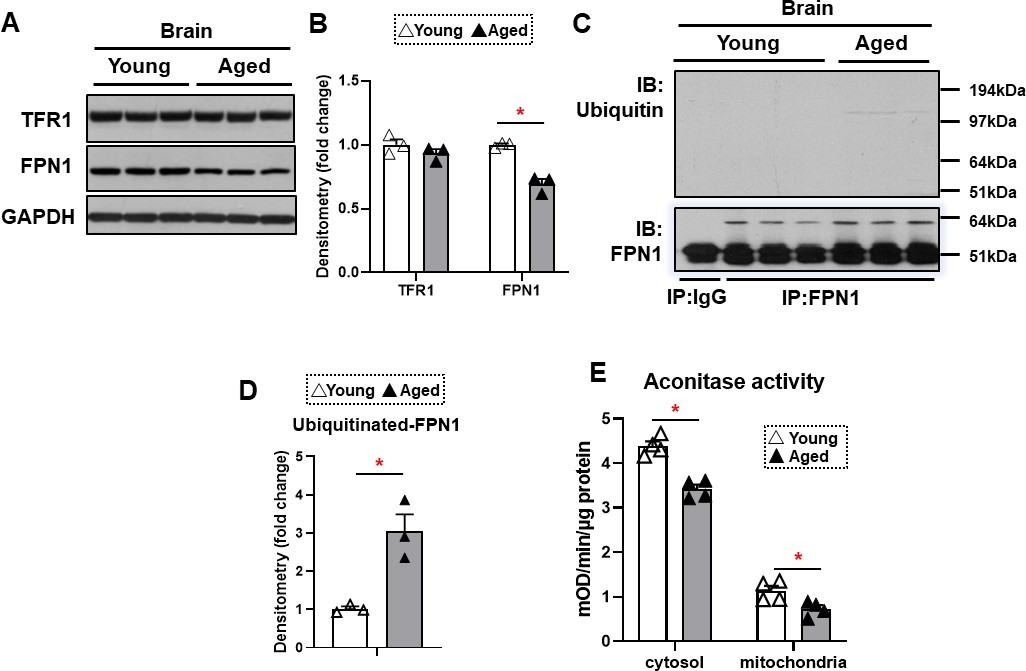
FPN1 protein level is decreased while its poly-ubiquitination is increased in the brain cortex of aged mice.
(A) Immunoblots of iron transporting proteins TfR1 and FPN1 in the brain cortex of young and aged mice (n=3). (B) Summary of densitometric analysis of panel (A). (C) Poly-ubiquitination levels of FPN1, as assessed by immunoprecipitation, in the brain cortex of young and aged mice (n=3). (D) Summary of the densitometric analysis of panel (C). (E) Fe-S cluster containing aconitase enzyme activity, a marker of cellular oxidative stress, in the brain cortex of young and aged mice (n=4). c-aconitase = cytosolic aconitase (ACO1), m-aconitase = mitochondrial aconitase (ACO2). * p<0.05.
-
Figure 3—source data 1
Full length images of immunoblots shown in Figure 3.
- https://cdn.elifesciences.org/articles/73456/elife-73456-fig3-data1-v1.pptx
-
Figure 3—source data 2
Densitometry – Original data of densitometry quantifications of immunoblots shown in Figure 3.
- https://cdn.elifesciences.org/articles/73456/elife-73456-fig3-data2-v1.xlsx
-
Figure 3—source data 3
Aconitase assay – Original data of aconitase enzyme activities shown in Figure 3.
- https://cdn.elifesciences.org/articles/73456/elife-73456-fig3-data3-v1.xlsx
Tables
Key resources table
| Reagent type (species) or resource | Designation | Source or reference | Identifiers | Additional information |
|---|---|---|---|---|
| Strain, strain background(Mus musculus, female, C57BL/6) | UM-HET3 | Dr. Miller lab | Harrison et al., 2021 (cited in the paper) | |
| Strain, strain background(M. musculus, female, C57BL/6) | Wild type | Jackson Laboratories | ||
| Antibody | Rabbit polyclonal anti-HPRT antibody | ProteinTech | 150-59-1-AP | WB (1:5000) |
| Antibody | Rabbit polyclonal anti-SDHA antibody | Invitrogen | 45-920-0 | WB (1:1000) |
| Antibody | Rabbit polyclonal anti-FTN antibody | Sigma-Ardrich | F5012 | WB (1:1000) |
| Antibody | Rabbit polyclonal anti-IRP2 antibody | Sigma-Ardrich | SAB2101174 | WB (1:500) |
| Antibody | Rabbit polyclonal anti-TFR1 antibody | ProteinTech | 100-84-2-AP | WB (1:1000) |
| Antibody | Rabbit polyclonal anti-FPN1 antibody | Novus Biologicals | NBP1-21502 | WB (1:1000) |
| Antibody | Rabbit monoclonal anti-Hepcidin antibody | Abcam | 190775 | WB (1:200)IH (1:20) |
| Antibody | Mouse polyclonal anti-ubiquitin antibody | Cell Signaling Technologies | 3933S | WB (1:1000) |
| Antibody | Mouse monoclonal anti-GAPDH antibody | ProteinTech | 60004-1-Ig | WB (1:5000) |
| Antibody | Rabbit polyclonal anti-α-Tubulin antibody | ProteinTech | 66031-1-Ig | WB (1:5000) |
| Antibody | HRP-conjugated donkey polyclonal anti-rabbit IgG antibody | Jackson ImmunoResearch | 711-035-152 | WB (1:5000) |
| Antibody | HRP-conjugated donkey polyclonal anti-mouse IgG antibody | Jackson ImmunoResearch | 715-035-150 | WB (1:5000) |
| Antibody | Alexa Fluor 594 goat polyclonal anti-rabbit IgG | Jackson ImmunoResearch | 111-585-144 | IH (1:200) |
| Chemical compound, drug | 3-(2-Pyridyl)–5,6-di(2-furyl)–1,2,4-triazine-5′,5″-disulfonic acid disodium salt(Ferrozine) | Sigma-Aldrich | 82940 | |
| Chemical compound, drug | Trichloroacetic acid | Sigma-Aldrich | T6399 | |
| Chemical compound, drug | Thioglycolic acid | Sigma-Aldrich | T3758 | |
| Chemical compound, drug | Hemin | Sigma-Aldrich | H9039 | |
| Chemical compound, drug | RNA-STAT60 | Teltest | Cs-502 | |
| Chemical compound, drug | Glycogen | Life Technologies | AM9510 | |
| Chemical compound, drug | Paraformaldehyde | Thermo Fisher Scientific | AC416780250 | |
| Chemical compound, drug | RIPA Buffer | Thermo Fisher Scientific | 89901 | |
| Commercial assay or kit | ProteaseArrest Protease Inhibitor | G-Biosciences | 786-437 | |
| Commercial assay or kit | qScript cDNA Synthesis Kit | Quanta | 95047-500 | |
| Commercial assay or kit | PerfeCTa SYBR Green FastMix | Quanta | 95074-05K | |
| Commercial assay or kit | SuperSignal West Pico PLUS Chemiluminescent Substrate | Pierce | 34579 | |
| Commercial assay or kit | Dynabeads Protein G for Immunoprecipitation | Invitrogen | 10003D | |
| Commercial assay or kit | BCA Protein Assay Kit | Pierce | 23225 | |
| Commercial assay or kit | Mitochondria Isolation Kit for Tissue | Pierce | 89801 | |
| Commercial assay or kit | Aconitase Activity Assay Kit | Abcam | Ab109712 | |
| Commercial assay or kit | OTC compound | Sakura Finetek | 4583 | |
| Sequence-based reagent | Primers for qRT-PCR | This manuscript | N/A | Included in the next table |
| Software, algorithm | GraphPad Prism | GraphPad | Version 9 | |
| Software, algorithm | ImageJ | NIH | 1.53c |
Additional files
Download links
A two-part list of links to download the article, or parts of the article, in various formats.
Downloads (link to download the article as PDF)
Open citations (links to open the citations from this article in various online reference manager services)
Cite this article (links to download the citations from this article in formats compatible with various reference manager tools)
Aging is associated with increased brain iron through cortex-derived hepcidin expression
eLife 11:e73456.
https://doi.org/10.7554/eLife.73456


