Cytosolic aspartate aminotransferase moonlights as a ribosome-binding modulator of Gcn2 activity during oxidative stress
- Division of Molecular and Cellular Function, Faculty of Biology Medicine and Health, Manchester Academic Health Science Centre, The University of Manchester, United Kingdom
- Division of Evolution, Infection and Genomics, Faculty of Biology Medicine and Health, Manchester Academic Health Science Centre, The University of Manchester, United Kingdom
Figures
Figure 1 with 3 supplements
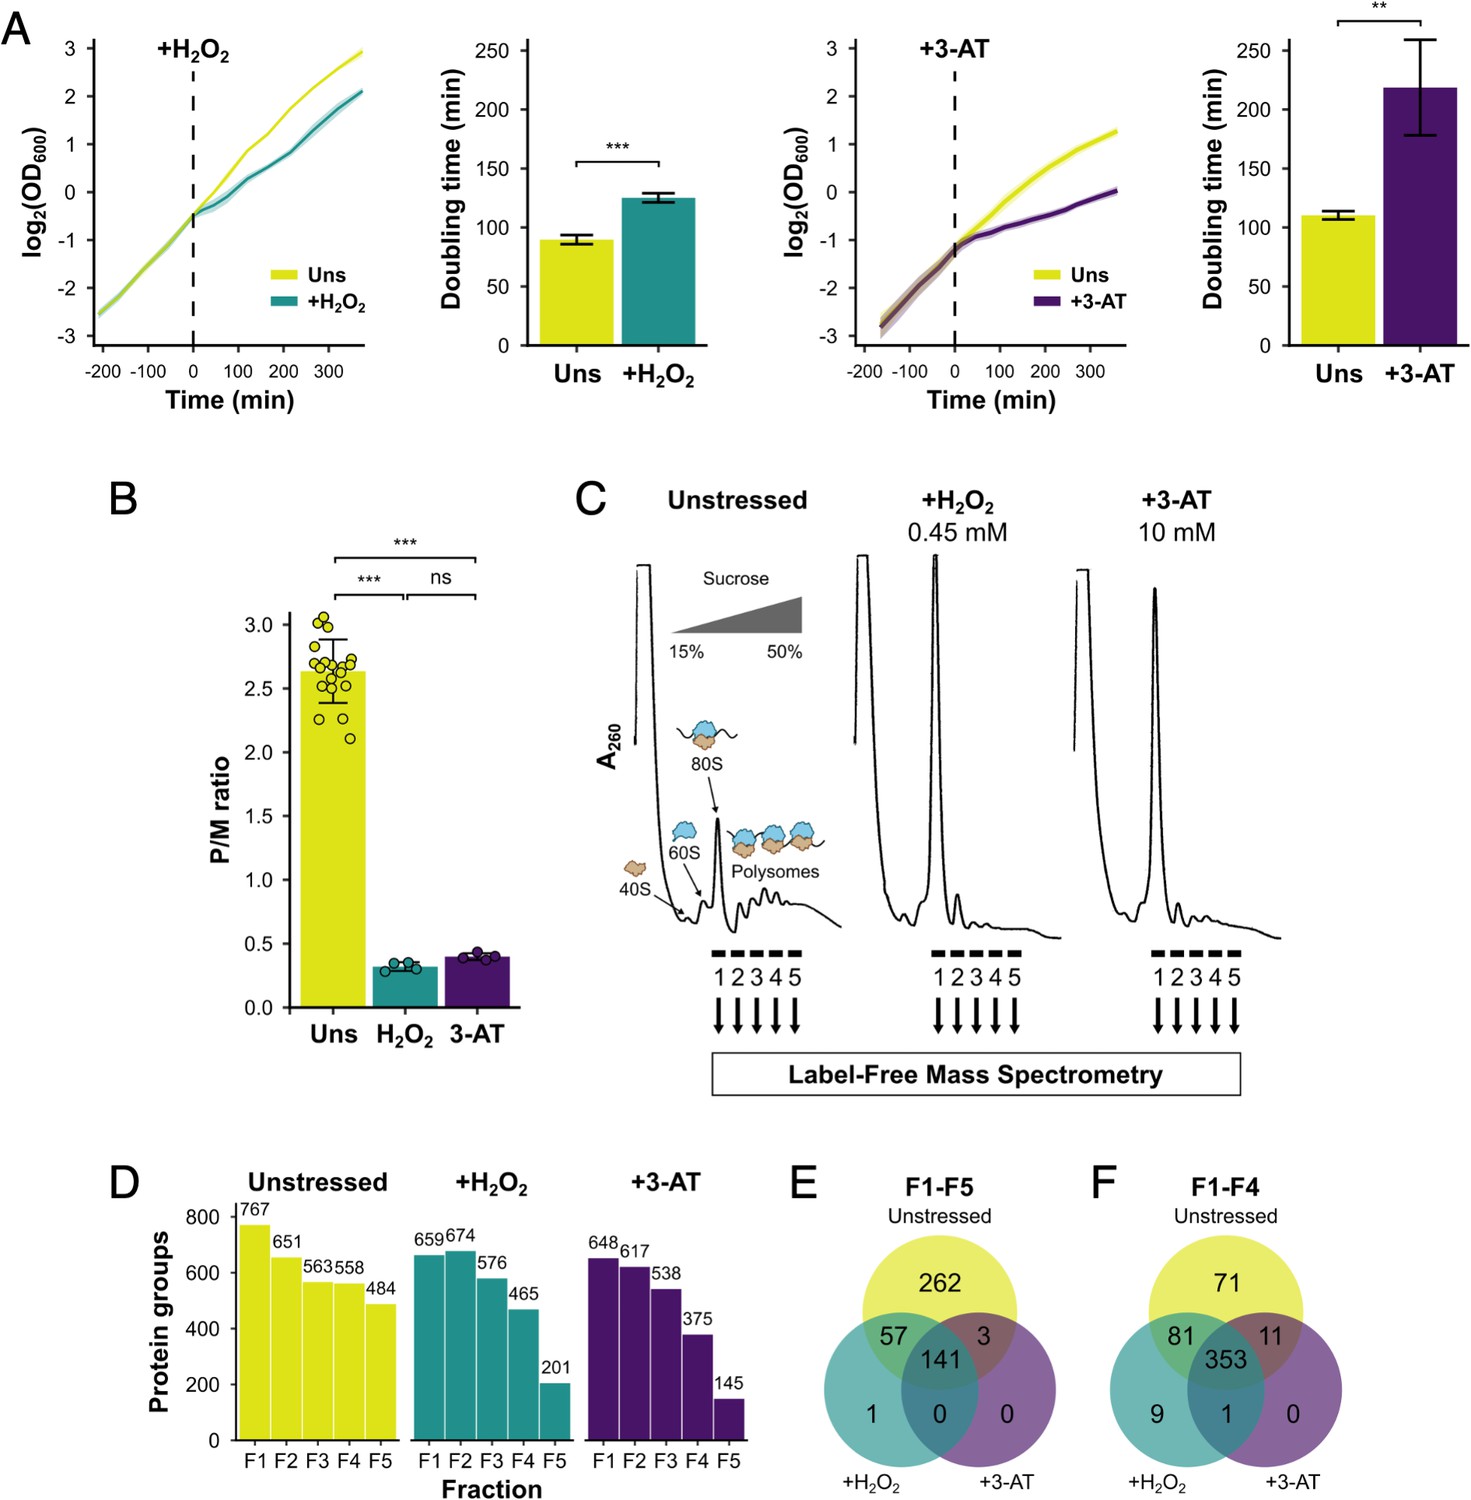
Identification of translational regulators using polysomal proteomics.
(A) Growth curves and doubling times for unstressed, 0.45 mM hydrogen peroxide (H2O2)-treated and 10 mM 3-amino-1,2,4-triazole (3-AT)-treated cultures (n = 3). The time of H2O2 or 3-AT addition is indicated. (B) Quantification of polysome-to-monosome (P/M) ratios under the three conditions (n = 4–19). Error bars show standard deviation (SD). The t-test was used to compare the conditions: ns – not significant (p > 0.05), **p < 0.01, ***p < 0.001. (C) Overview of polysomal proteomics. Monosomal (F1) and polysomal (F2–F5) fractions were isolated from unstressed, H2O2- and 3-AT-treated extracts and analysed using label-free mass spectrometry (MS). (D) The number of proteins identified reproducibly (≥2 replicates) in each fraction. Venn-style diagrams of overlaps between conditions for proteins found across (E) all five fractions or (F) the first four fractions.
Figure 1—figure supplement 1
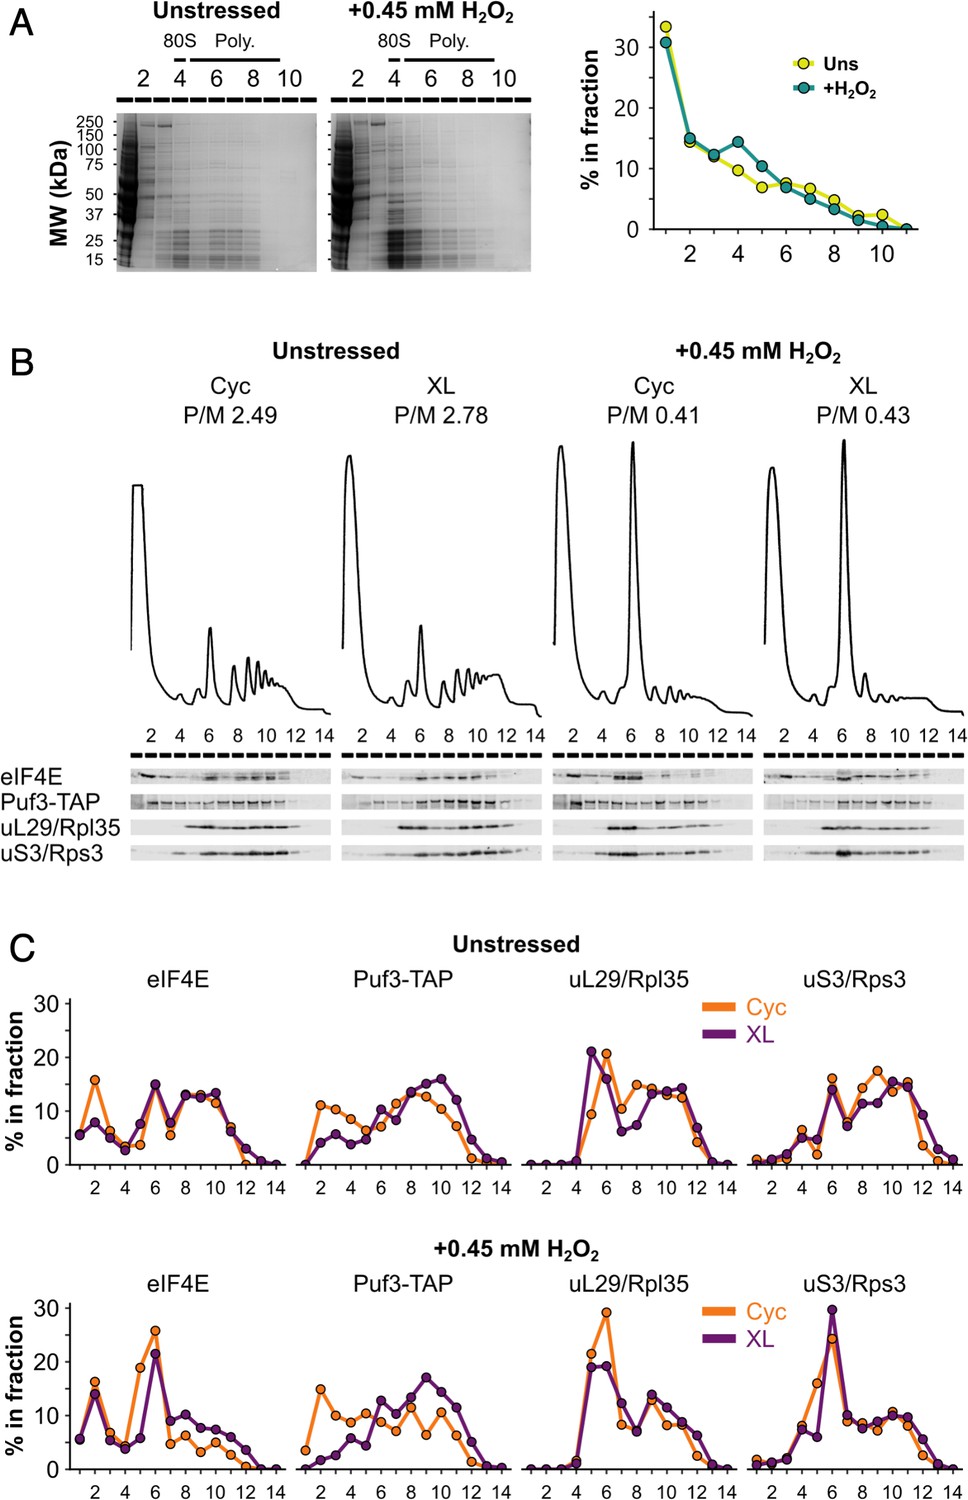
Formaldehyde crosslinking prevents ribosome run-off and retains RNA-binding proteins (RBPs) in polysome fractions similar to cycloheximide treatment.
(A) Left: sodium dodecyl sulphate–polyacrylamide gel electrophoresis (SDS–PAGE) analysis of fractions from unstressed and hydrogen peroxide (H2O2)-treated extracts run on 15–50% sucrose gradients. Right: entire lanes were quantified (LI-COR Image Studio) and the percentage of the total signal that each fraction accounts for was calculated. (B) Polysome profiles and western blots comparing cycloheximide treatment (Cyc) and formaldehyde crosslinking (XL) of cultures for preparing extracts for polysome profiling. (C) Bands from (B) were quantified, as for panel A.
Figure 1—figure supplement 2
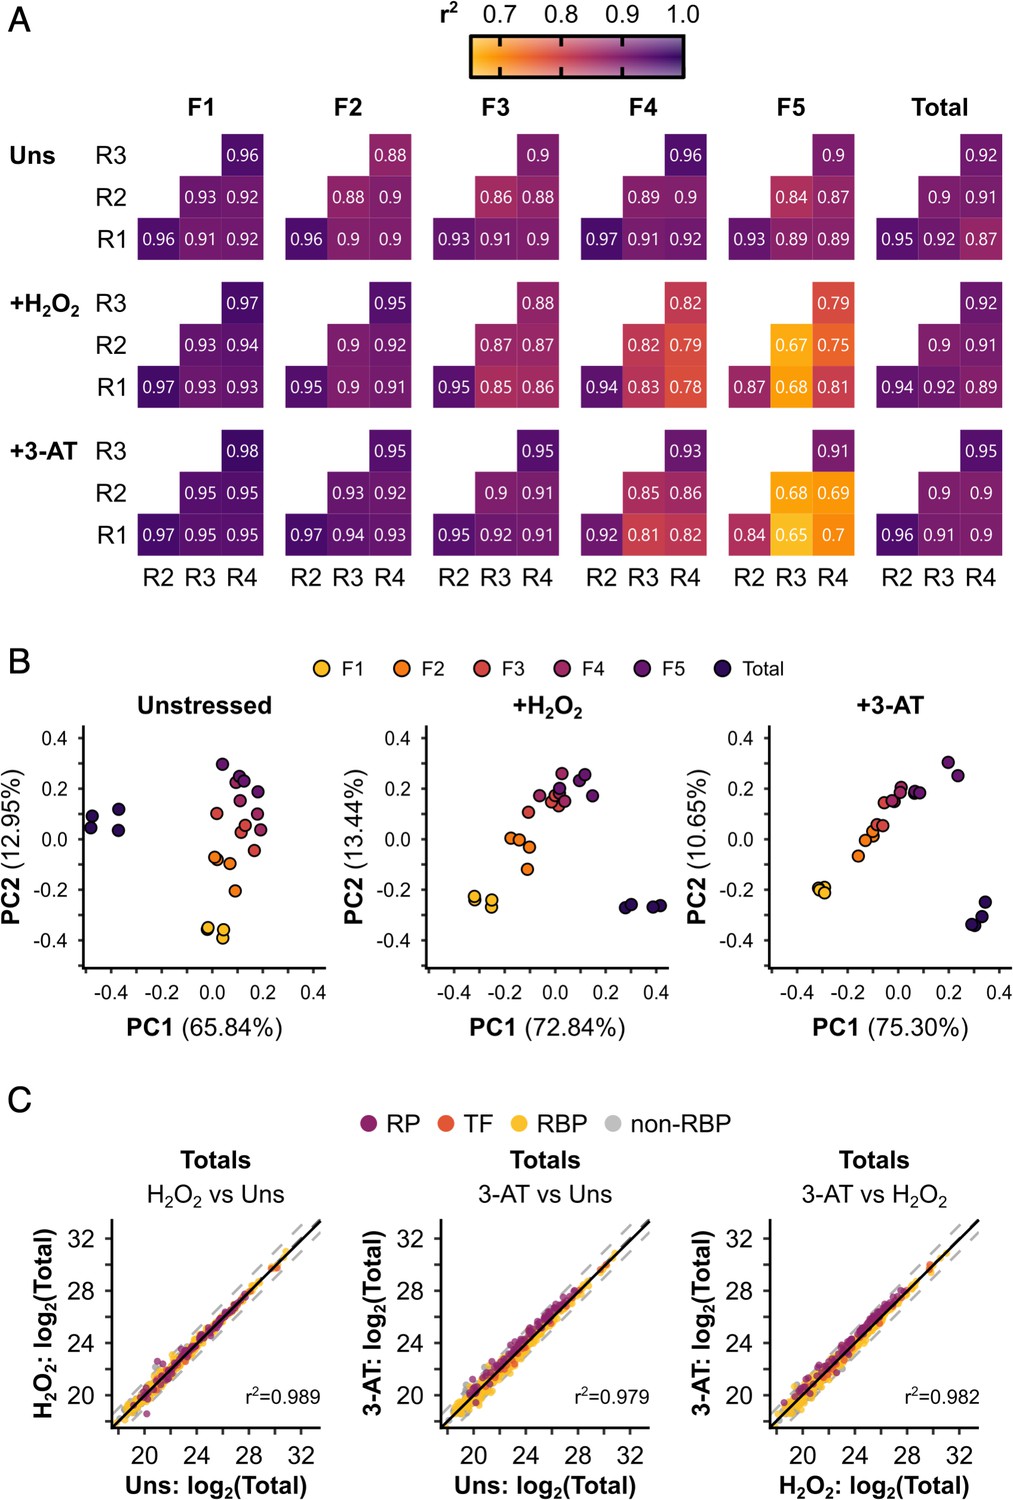
Polysomal proteomics data are reproducible and can separate the different fractions.
(A) r2 values for pairwise correlations between replicates (R1–R4) for each sample. (B) Principal component analysis (PCA) of the different samples under each condition. The percentage of the variation explained by each of the first two principal components is indicated. The axes are not equivalent for the different conditions. Note that only protein groups present in all samples for a given condition could be included in the comparison. (C) Pairwise comparisons between conditions for the totals. r2 values from linear regressions are indicated. Protein groups are coloured by their functional category: RP – ribosomal protein, TF – translation factor, RBP – RNA-binding protein, non-RBP – other protein.
Figure 1—figure supplement 3
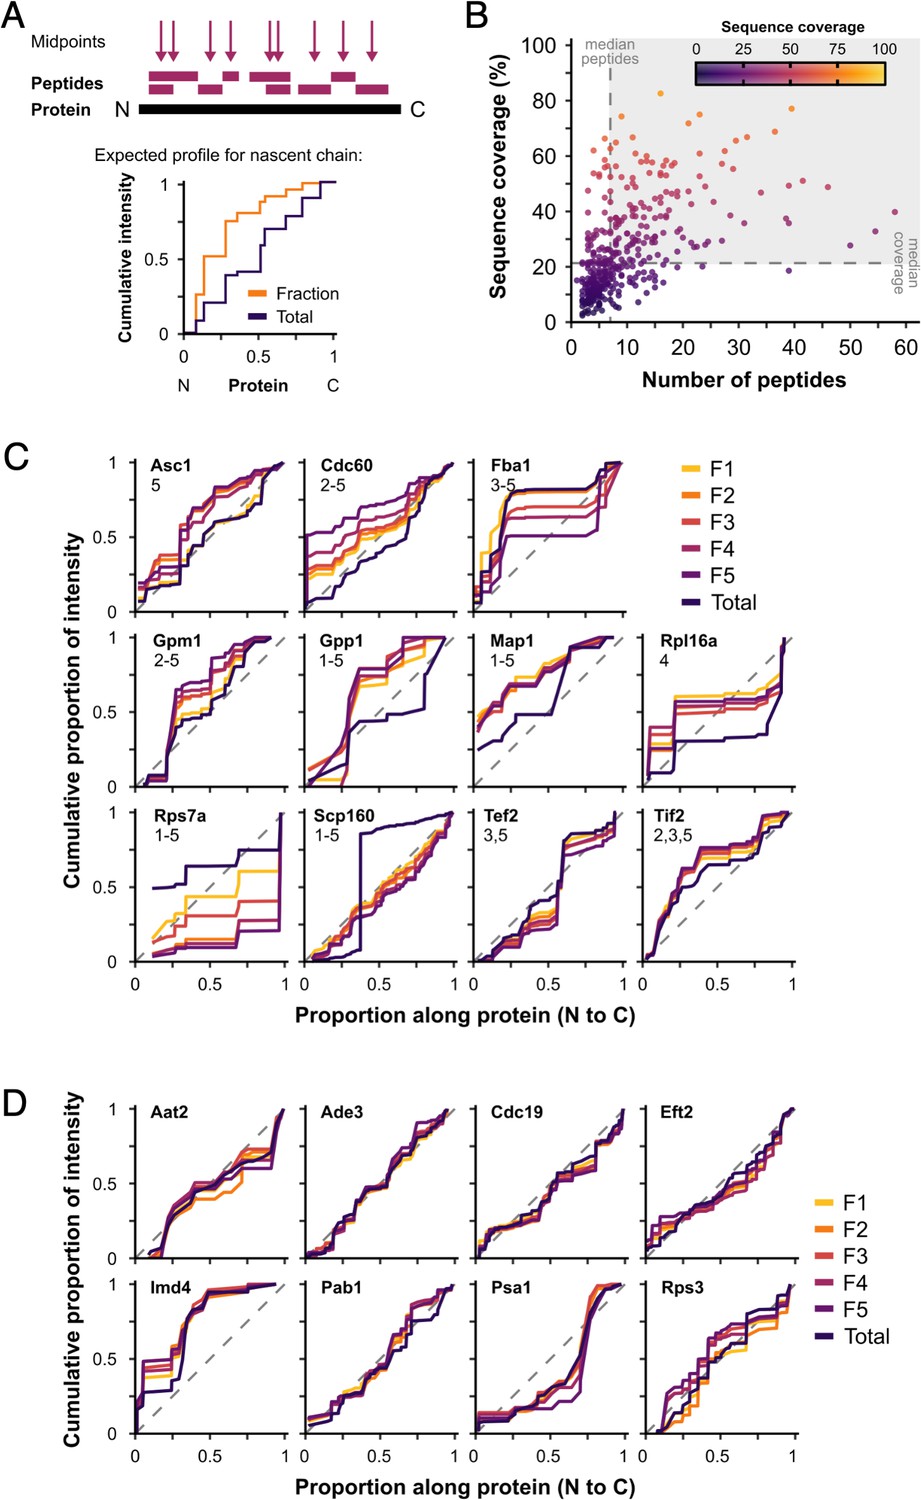
Nascent peptides are not a major contributor to protein signal.
We hypothesised that proteins represented in polysome fractions by nascent chains and/or co-translational complex formation would show greater intensity from N-terminal peptides in F1–F5 than in totals, as they are synthesised in the N-to-C direction. (A) Peptide midpoint calculation and example cumulative peptide intensity distribution. Steps in the cumulative intensity profiles indicate peptide midpoints. For a protein detected in polysome fractions (Fraction) through only nascent chains, a shift in signal accumulation compared with a cytoplasmic extract (Total) would be expected, such that a much greater proportion of the total peptide intensity would be expected from the N-terminal end of the protein. (B) Median number of peptides and median sequence coverage (percentage of the amino acid residues that were detected by mass spectrometry (MS) in at least one peptide) for individual proteins in unstressed samples (371 uniquely detected proteins). Proteins in the shaded area were used for the analysis (142 proteins). Cumulative peptide intensity distributions for fractions and totals of named proteins. Differences between fractions and totals were tested using the Kolmogorov–Smirnov test. (C) The proteins with significantly different fraction distributions compared with totals (p < 0.05). The fractions that are significantly different are indicated by number. Only 6 of 142 showed some evidence of a bias towards the N-terminus in one or more fractions (Asc1, Cdc60, Gpm1, Gpp1, Map1, and eIF4A/Tif2), while 5 others (Fba1, Rpl16a, Rps7a, Scp160, and eEF1A/Tef2) showed different patterns. (D) Representative examples of proteins without significant differences between fractions and totals. Dashed lines are y = x.
Figure 2 with 1 supplement
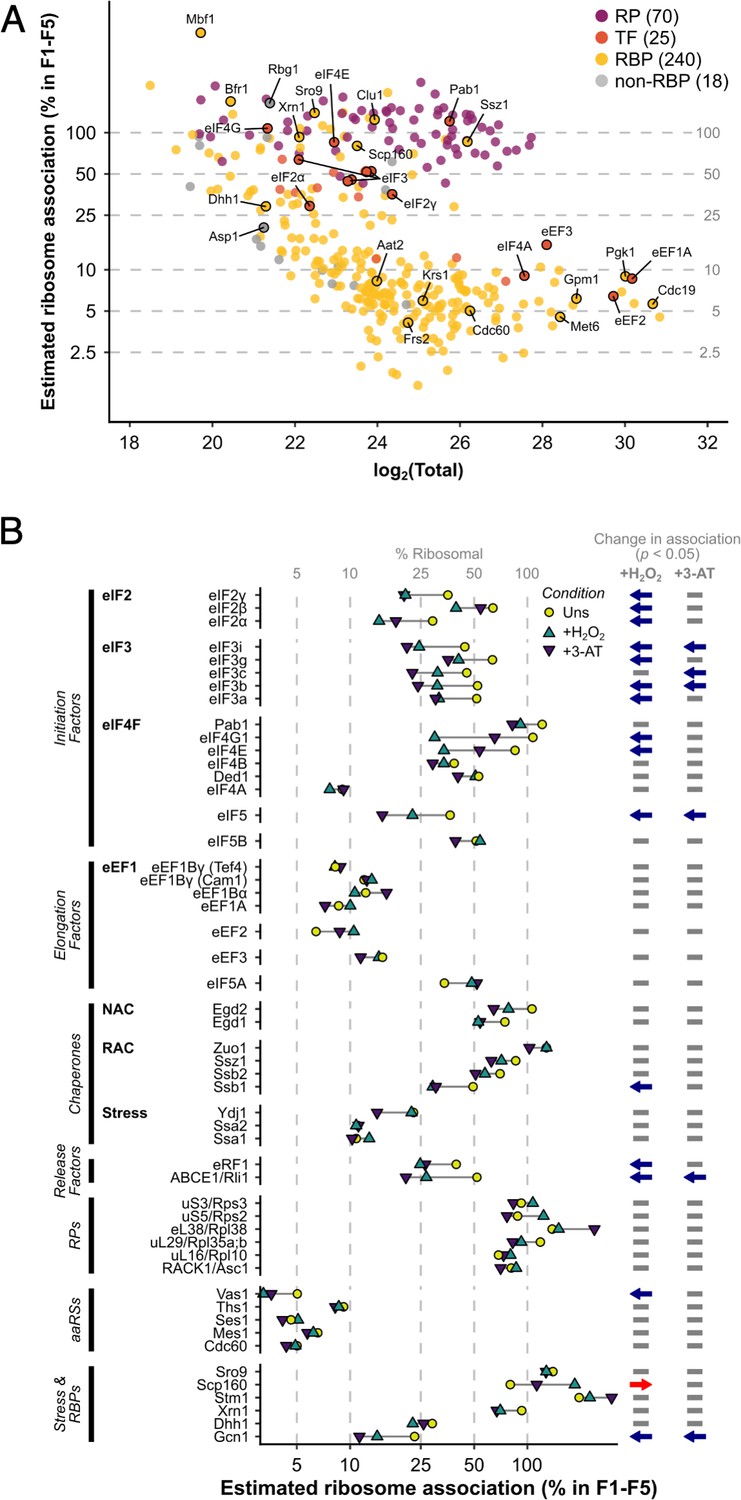
The ribosome association of initiation factors decreases during stress.
(A) Ribosome association of proteins in F1–F4 under all three conditions (353 proteins). The proportion of each protein that is ribosome associated (% ribosomal) was estimated by comparing the summed intensity in the fractions with the totals (see Methods). Protein groups are coloured by their functional category: RP – ribosomal protein, TF – translation factor, RBP – RNA-binding protein, non-RBP – other protein. The number of proteins in each functional category is indicated. (B) The change in overall ribosome association during both stresses for selected translation-related proteins. Statistically significant changes in ribosome association (p < 0.05) are indicated by arrows: blue – decrease, red – increase.
Figure 2—figure supplement 1
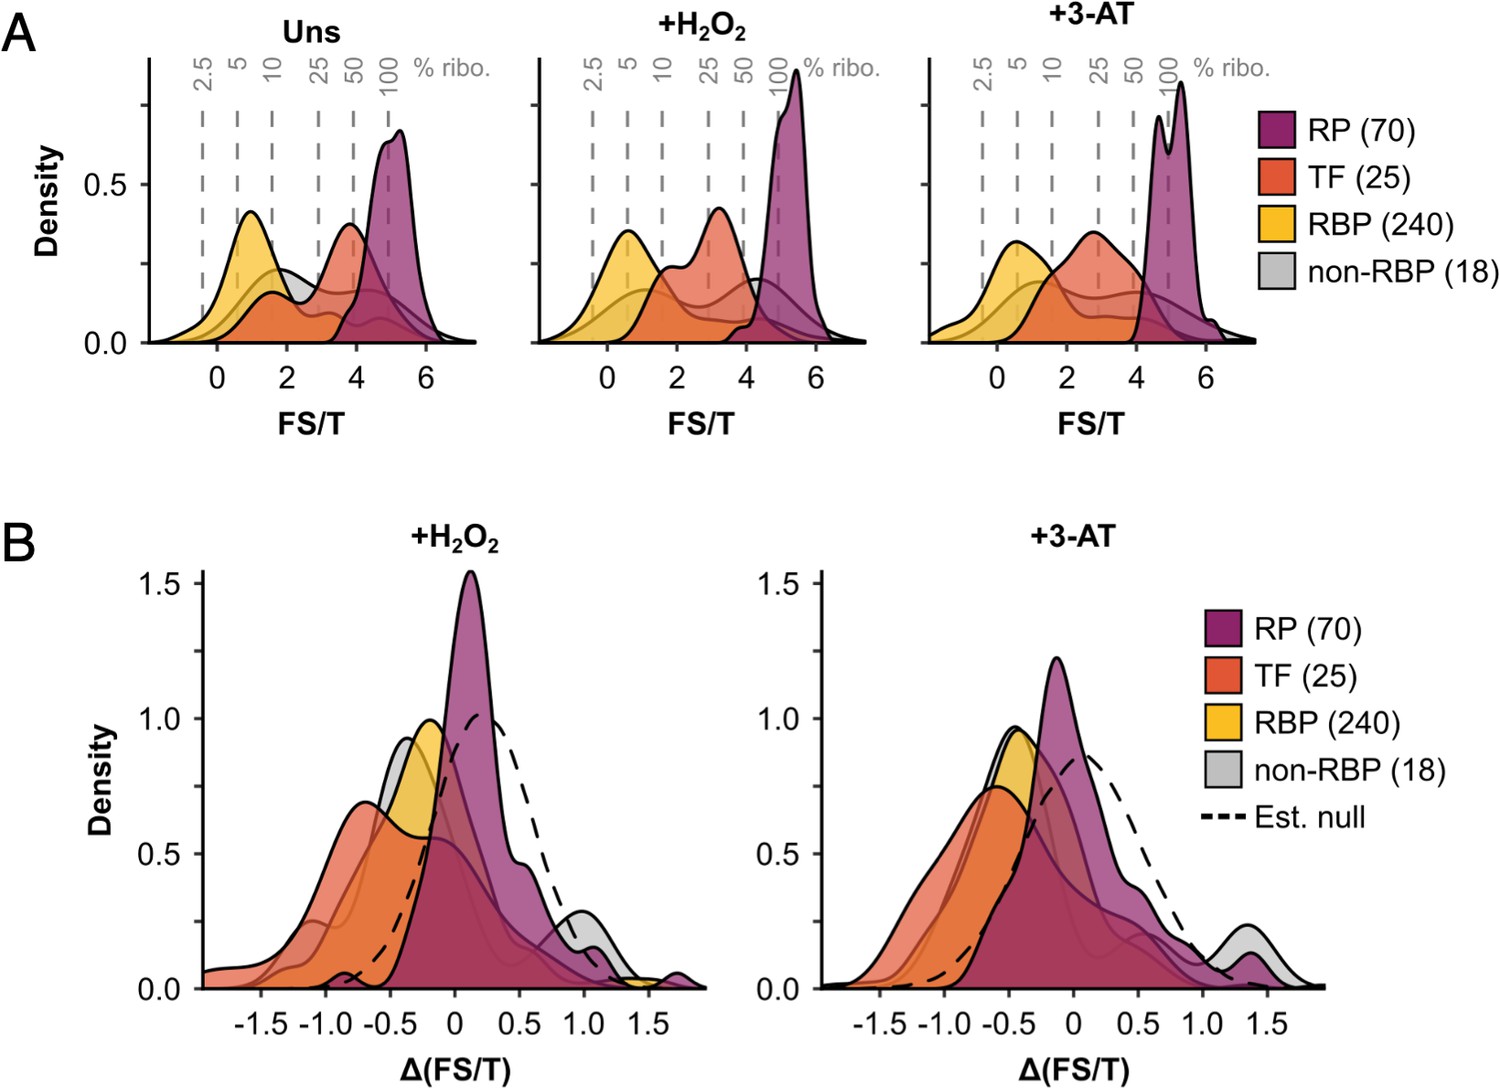
The ribosome association of initiation factors decreases during stress.
(A) Density plots showing fraction sum-to-total ratios (FS/T) of proteins in F1–F4 under all three conditions (353 proteins), separated by functional category. Percentage ribosome association (% ribo.) was estimated from FS/T for each protein (see Methods), and is indicated by the grey dotted lines. (B) Density plots showing changes in ribosome association (ΔFS/T) during both stresses for proteins in the four functional categories. The estimated null distributions (dotted lines, ‘Est. null’) are normal distributions with the same mean and standard deviation as the RPs under each condition. These were used to calculate p values for changes in ribosome association (see Methods). RP – ribosomal protein, TF – translation factor, RBP – RNA-binding protein, non-RBP – other protein. The number of proteins in each functional category is indicated in parenthesis.
Figure 3 with 1 supplement
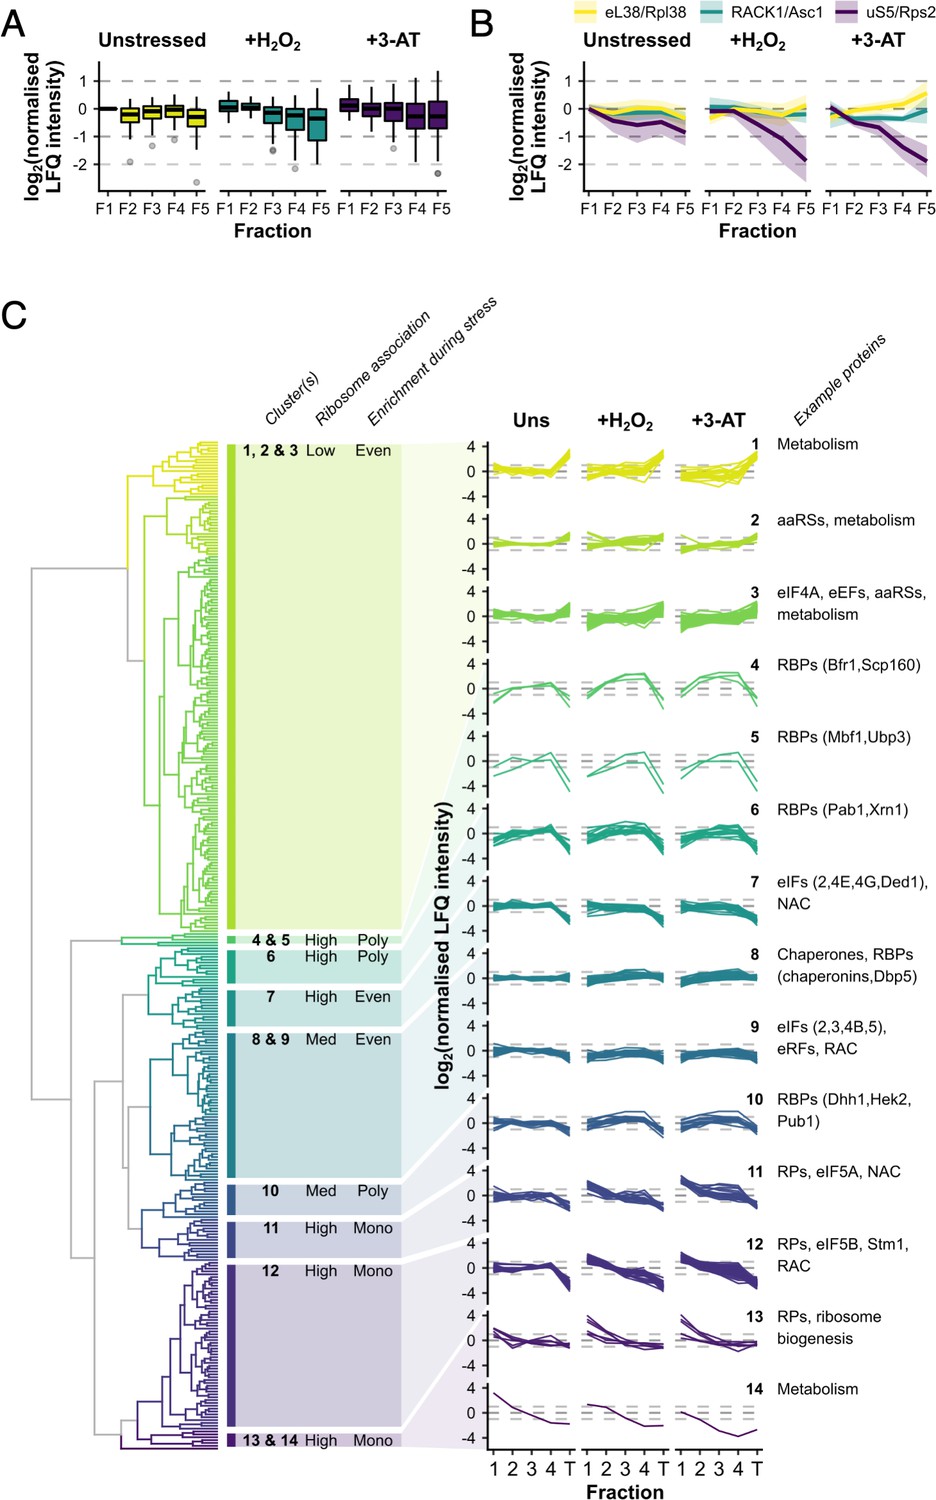
Ribosomal proteins (RPs) and RNA-binding proteins (RBPs) show distinct patterns of polysome enrichment.
(A) The label-free quantification (LFQ) intensities for each RP identified in all conditions F1–F5 were normalised to Rps3/uS3 on a fraction-by-fraction basis and then to unstressed F1. Boxplots showing the distribution of normalised LFQ intensities in each sample. (B) Polysome association profiles for three example RPs normalised to Rps3/uS3. Shaded areas show mean ± standard deviation (SD). (C) Clustered ‘polysome enrichment profiles’ for proteins identified under all three conditions in F1–F4. The LFQ intensities for each protein were normalised only to its own mean across the unstressed fractions. T – total. The overall ribosome association and PE during stress for each cluster or group of clusters is indicated: Poly – polysome-enriched, Mono – monosome-enriched, Even – equally enriched in all fractions.
Figure 3—figure supplement 1
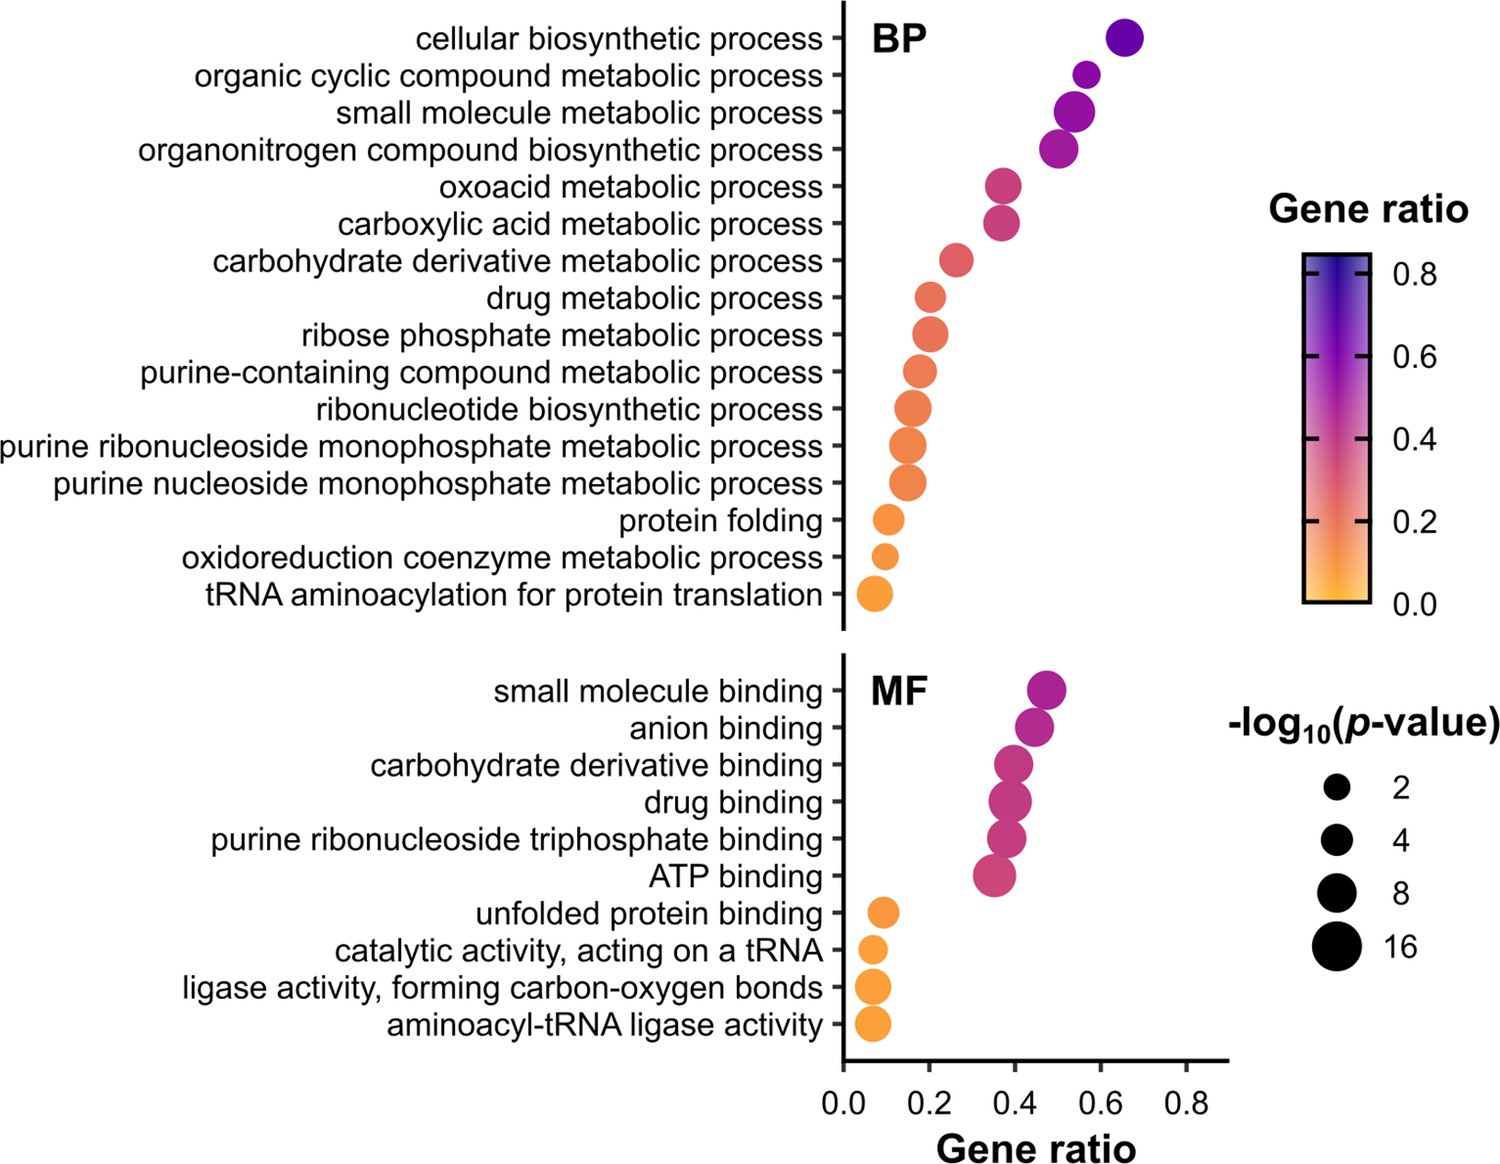
Metabolic functions are enriched among RNA-binding proteins (RBPs) identified in polysomal fractions.
Overrepresentation analysis of gene ontology (GO) terms associated with proteins in all conditions F1–F4, performed using the R package clusterProfiler. p values were calculated using Fisher’s exact test, with false discovery rate (FDR) correction for multiple testing. The set of all proteins identified in at least one mass spectrometry (MS) sample was used as the background (Supplementary file 1 – sheet 1). To focus on RBPs and other proteins, ribosomal proteins (RPs) and translation factors were also excluded from both the test set and the background set. Only enriched terms with p value ≤0.01 (−log10(adjusted p value) ≥2) are shown. Gene ratio is the proportion of the test set annotated with a given GO term. BP – biological process, MF – molecular function. No cellular component (CC) terms were significantly enriched in this set. See Supplementary file 1 – sheet 4 for the full list of proteins associated with each term.
Figure 4 with 1 supplement
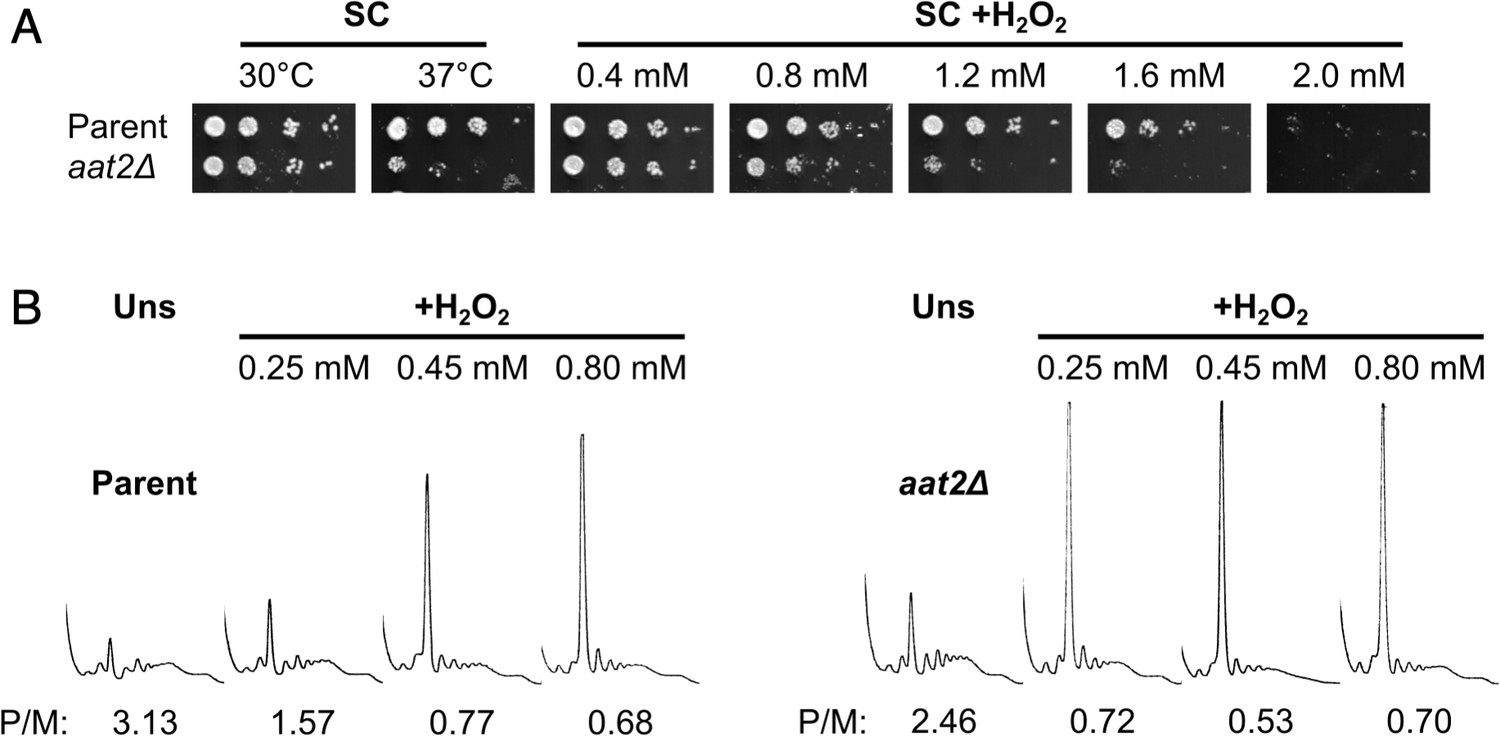
Deletion of AAT2 increases oxidative stress sensitivity.
(A) Spotting assay of BY4741 parent and aat2Δ strains on synthetic complete dextrose (SC) medium in the presence of varying concentrations of hydrogen peroxide (H2O2). Each spot is a tenfold dilution of the previous one. (B) Representative polysome profiles from unstressed and H2O2-treated cultures. P/M: mean polysome-to-monosome ratio (n = 2–3).
Figure 4—figure supplement 1

Metabolic functions are enriched among RNA-binding proteins (RBPs) identified in polysomal fractions.
Deletion strains for multiple candidate RBPs identified by polysomal proteomics were tested for sensitivity to oxidative stress. The slf1Δ strain was previously observed to be hypersensitive to oxidative stress so was used as a control (Kershaw et al., 2015). (A) Spotting assay on synthetic complete dextrose (SC) medium in the presence of varying concentrations of hydrogen peroxide (H2O2). Each spot is a tenfold dilution of the previous one. (B) Representative polysome profiles from unstressed and H2O2-treated cultures (n = 2–3).
Figure 5
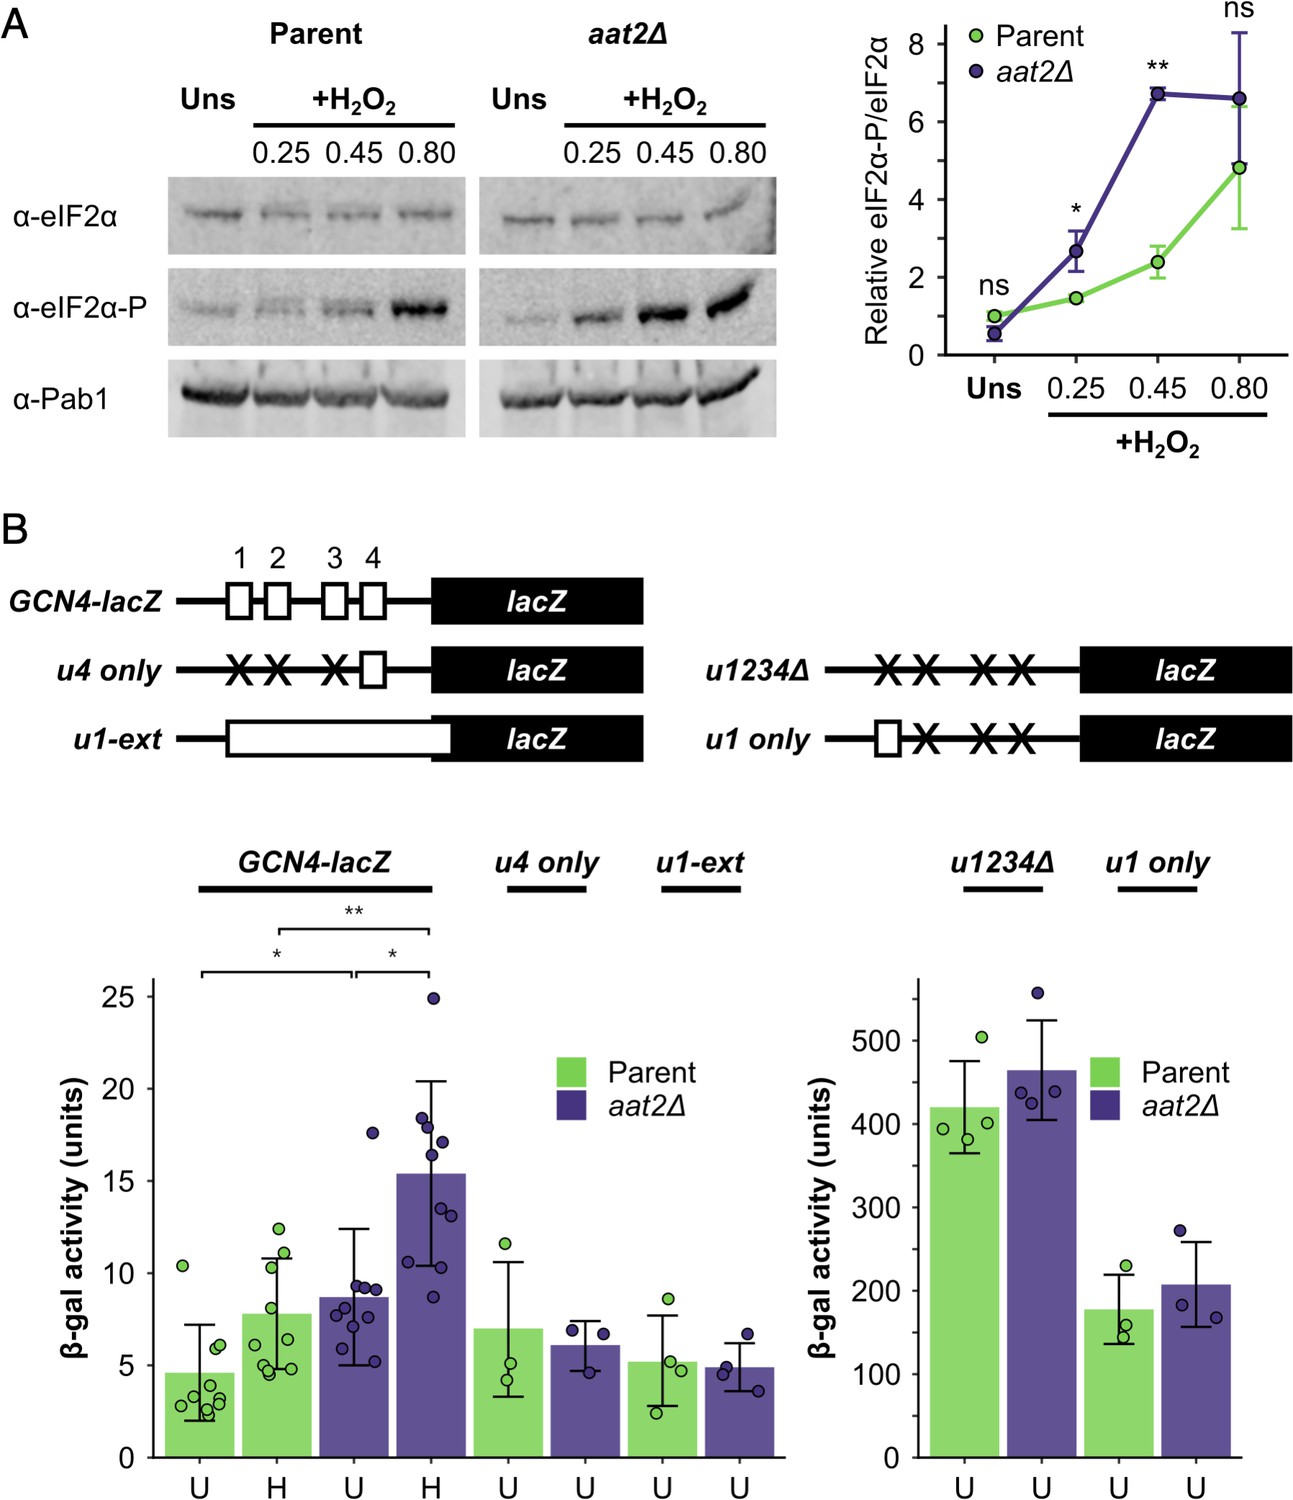
Deletion of AAT2 enhances Gcn2 activity during oxidative stress.
(A) Left: representative western blots showing eIF2α phosphorylation in unstressed and hydrogen peroxide (H2O2)-treated cultures. Right: bands were quantified using LI-COR Image Studio and the eIF2α-P/eIF2α ratio was calculated. Error bars show standard deviation (SD) (n = 3). (B) Top: GCN4-lacZ reporter constructs used to test the translational activation of GCN4. Solid boxes – lacZ ORF, open boxes – GCN4 upstream ORFs, crosses – removed GCN4 uORFs. Bottom: β-galactosidase activity in strains transformed with GCN4-lacZ reporter plasmids (n = 3–10). Error bars show SD. U – unstressed, H – +0.45 mM H2O2. The t-test was used to compare the strains: ns – not significant (p > 0.05), *p < 0.05, **p < 0.01.
Figure 6
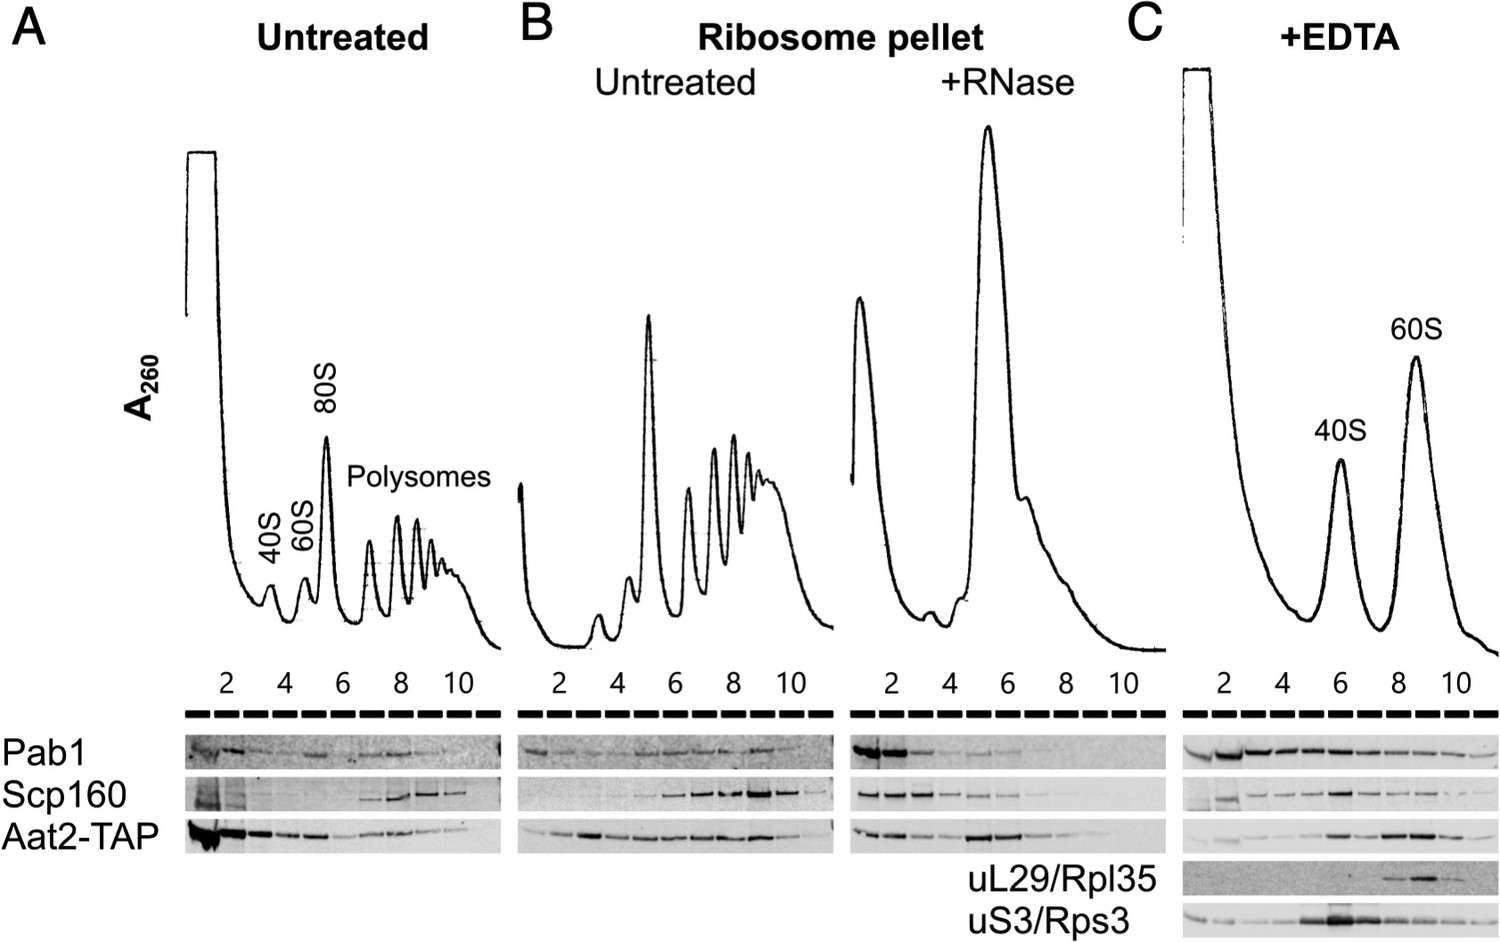
Aat2 binds to 60S ribosomes.
(A) Representative polysome profile and western blot of an unstressed cell extract from the Aat2-TAP strain run on a 15–50% sucrose gradient. (B) Ribosome pellets from unstressed extracts were isolated using sucrose cushions, then either left untreated or treated with RNase I prior to polysome profiling. (C) Representative polysome profile and western blot from an unstressed cell extract treated with 50 mM ethylenediaminetetraacetic acid (EDTA) and run on a 10–25% sucrose gradient to separate the ribosomal subunits.
Figure 7 with 3 supplements

Non-catalytic mutants of Aat2 remain polysome associated and do not show heightened stress sensitivity.
(A) Representative polysome profiles from unstressed and hydrogen peroxide (H2O2)-treated cultures. P/M: mean polysome-to-monosome ratio (n = 2–3). (B) Representative western blots of sucrose gradient fractions from mutated Aat2-TAP strains. The positions of the 80S/monosome and polysome fractions are indicated. (C) Quantification of the 80S/monosomal and polysomal proportions of Aat2-TAP for each strain in (B). The monosomal percentage is indicated. (D) Top: representative western blots showing eIF2α phosphorylation in unstressed and H2O2-treated cultures. Bottom: bands were quantified using LI-COR Image Studio and the eIF2α-P/eIF2α ratio was calculated. Error bars show standard deviation (SD; n = 3–4). (E) β-Galactosidase activity in strains transformed with GCN4-lacZ reporter plasmids (n = 3). Error bars show SD. U – unstressed, H – +0.45 mM H2O2. The t-test was used for comparisons in (D) and (E): ns – not significant (p > 0.05), *p < 0.05, ***p < 0.001. In (D), each t-test result refers to the comparison with the equivalent condition in the parent strain.
Figure 7—figure supplement 1
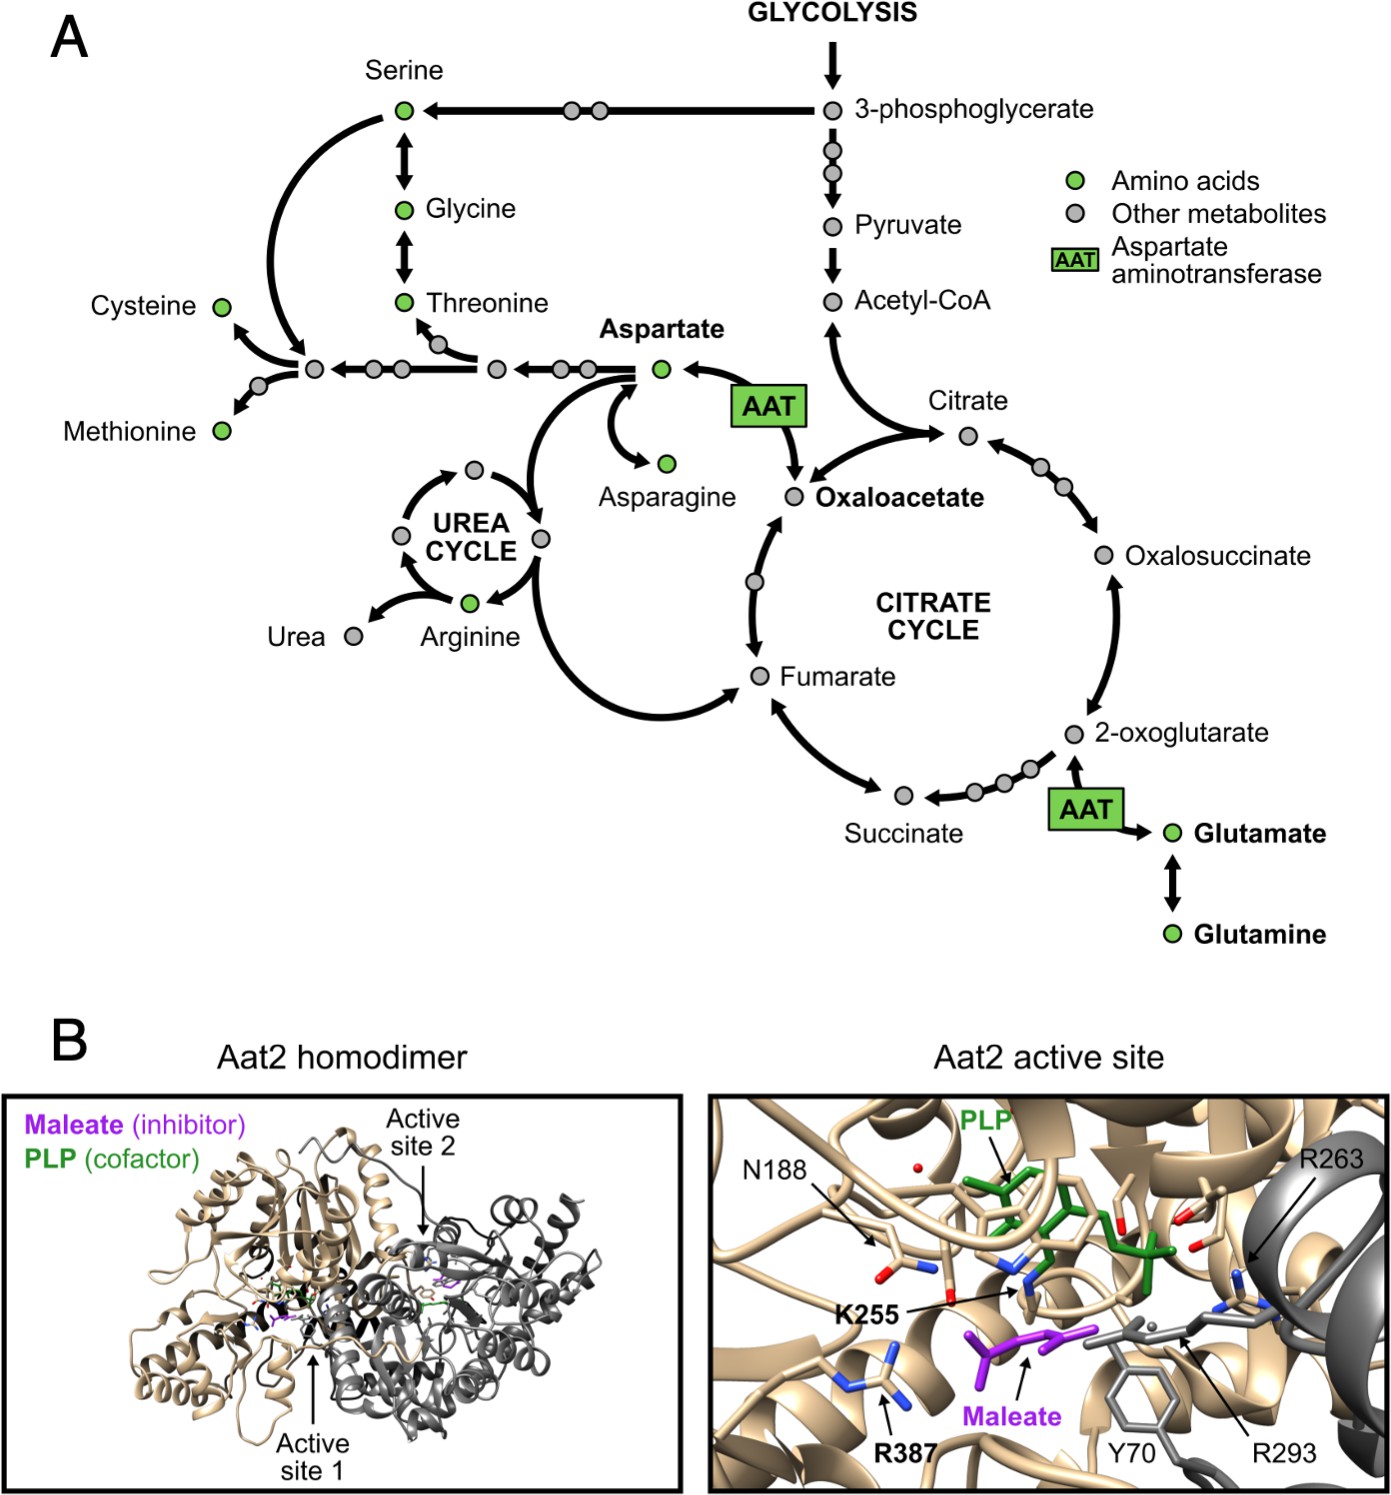
Non-catalytic AAT2 mutants are auxotrophic for aspartate and well expressed.
(A) The role of aspartate aminotransferase (AAT) in linking the citrate cycle with amino acid biosynthesis. Both AAT1 and AAT2 encode AAT in Saccharomyces cerevisiae. Its substrates are in bold. Other pathways are available for the interconversion of 2-oxoglutarate and glutamate. Adapted from pathway sce00250 (alanine, aspartate, and glutamate metabolism – S. cerevisiae) in the KEGG database (Ogata et al., 1999). For clarity, some links are not shown. (B) Views of the Aat2 homodimer (left) and active site (right), showing the cofactor pyridoxal-5′-phosphate (PLP, green) and the competitive inhibitor maleate (purple; PDB 1YAA Jeffery et al., 1998). The two active site residues targeted by site-directed mutagenesis are in bold.
Figure 7—figure supplement 2
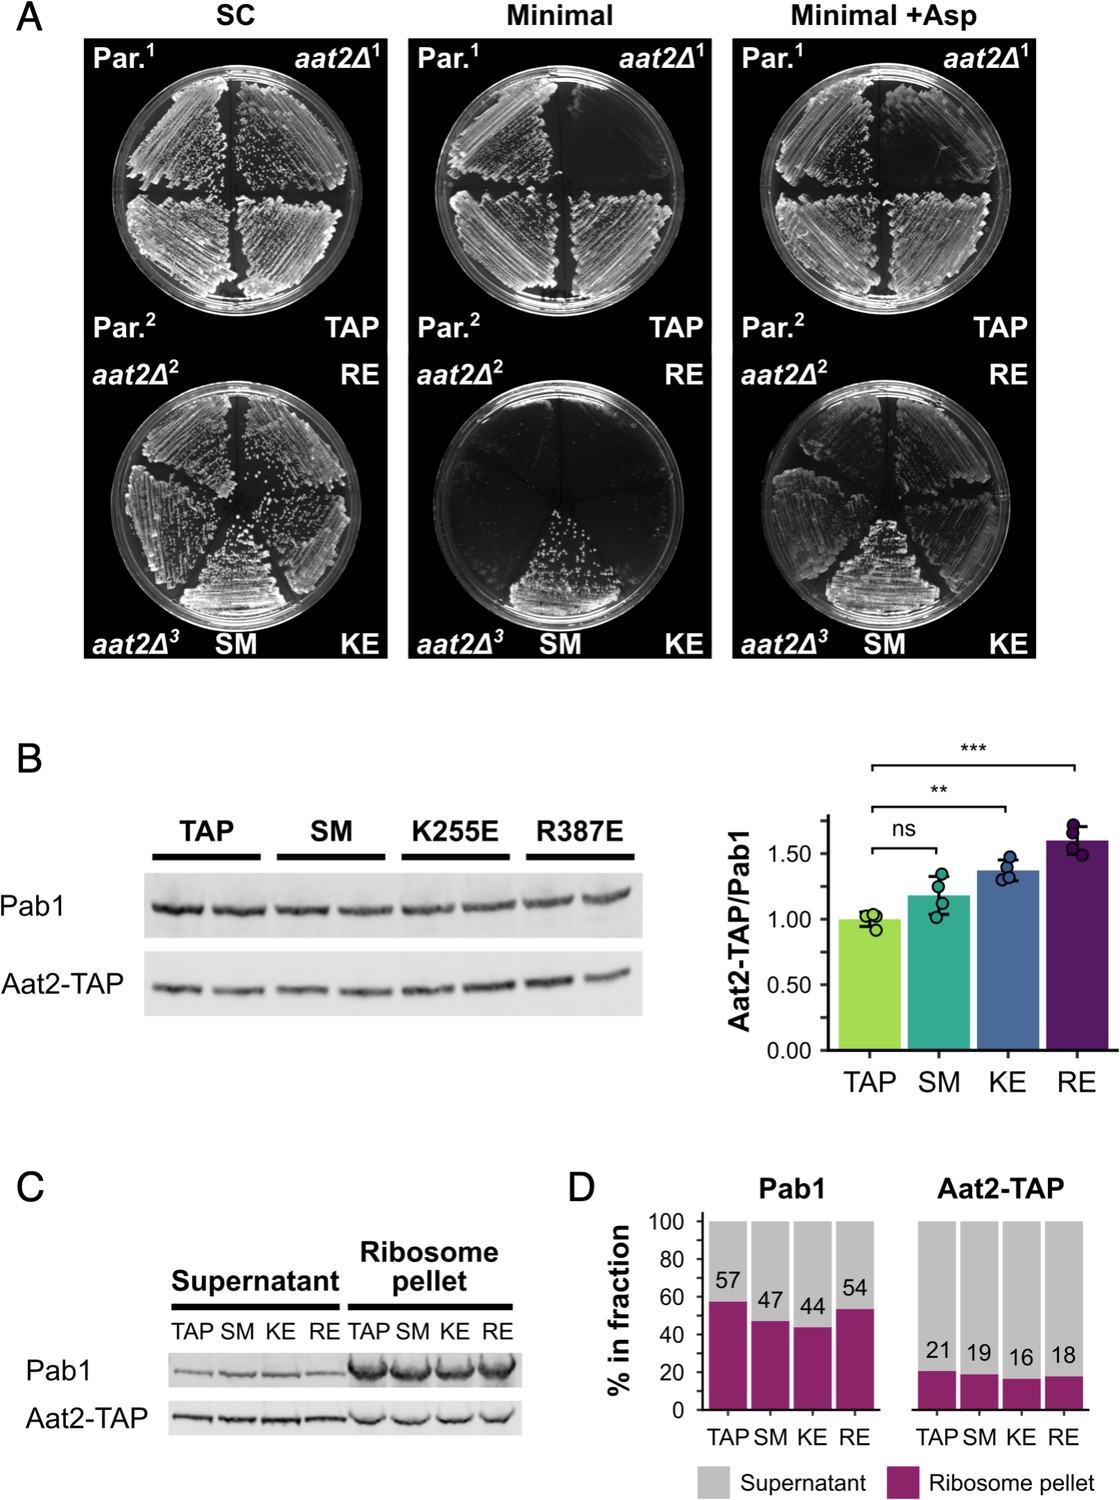
Non-catalytic AAT2 mutants are auxotrophic for aspartate, well expressed and co-migrate with ribosomes.
(A) Growth at 30°C on SC, minimal medium and minimal medium supplemented with L-aspartate (+Asp). (B) Left: representative western blot of cell extracts from parent and mutant strains. Right: quantification of Aat2-TAP expression relative to Pab1 (n = 4). Error bars show standard deviation (SD). The t-test was used to compare the strains: ns – not significant (p > 0.05), **p < 0.01, ***p < 0.001. (C) Ribosome pellets were separated from supernatants using sucrose cushions and analysed by western blotting. (D) Bands from (C) were quantified using LI-COR Image Studio and the percentage of signal from each of the two fractions was calculated. Values are indicated for the ribosome pellet fraction. Strains: Par.1 – BY4741 parent strain, Par.2 – parent strain containing HIS3, aat2Δ1 – deletion strain from lab. collection, aat2Δ2 and aat2Δ3 – CRISPR/Cas9 deletions generated from Par.1 and Par.2, respectively, TAP – Aat2-TAP from lab. collection, SM – control Aat2-TAP strain with silent mutations, KE/K255E – Aat2K255E-TAP, RE/R387E – Aat2R387E-TAP.
Figure 7—figure supplement 3
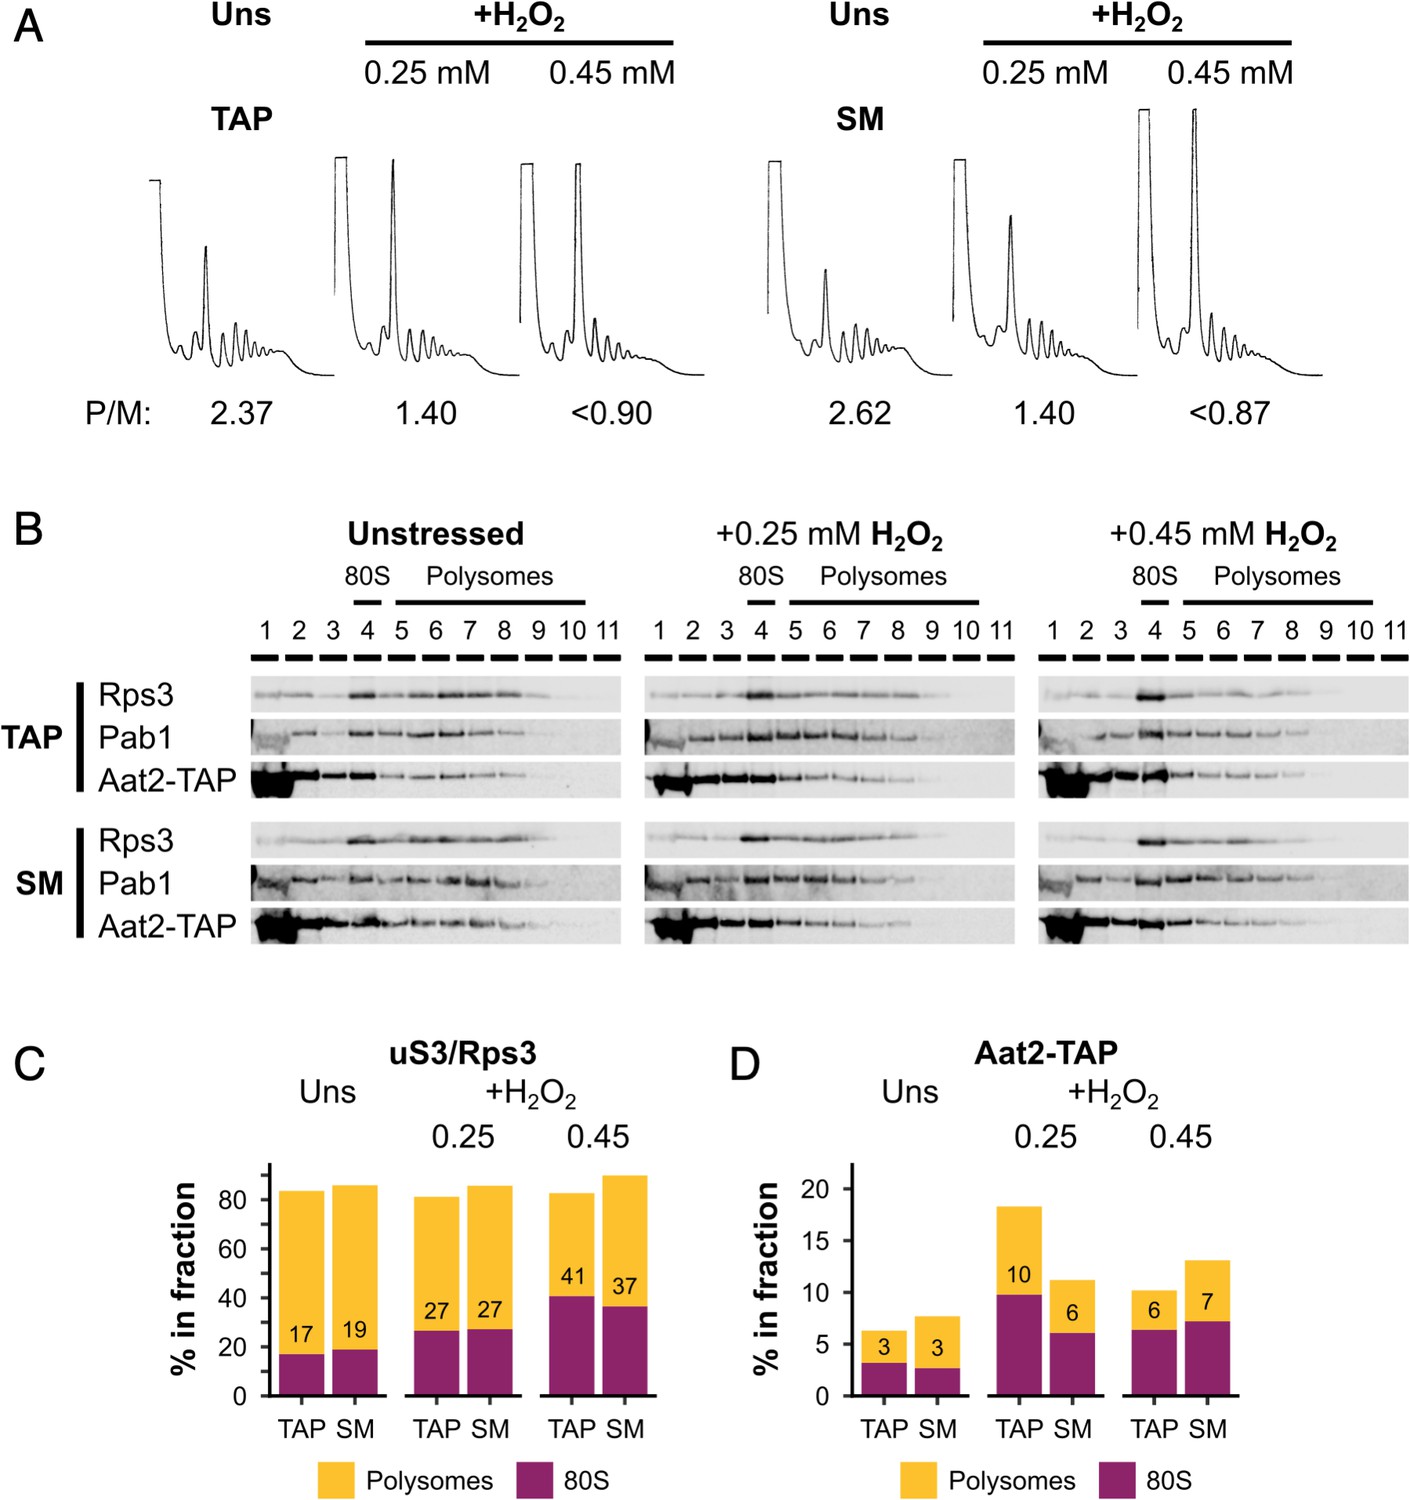
Silent mutations do not affect oxidative stress sensitivity or Aat2 polysome association.
(A) Polysome profiles from unstressed and hydrogen peroxide (H2O2)-treated cultures of the Aat2-TAP parent strain (WT) and Aat2-TAP strain with silent mutations (SM). P/M – polysome-to-monosome ratio. (B) Western blots of sucrose gradient fractions from extracts of the WT and SM strains. The positions of the 80S/monosomes and polysomes are indicated. (C) Quantification of the 80S/monosomal and polysomal proportions of uS3/Rps3 and Aat2-TAP in the two strains under each condition. The monosomal percentage is indicated.
Tables
Key resources table
| Reagent type (species) or resource | Designation | Source or reference | Identifiers | Additional information |
|---|---|---|---|---|
| Antibody | α-Rps3 (rabbit polyclonal) | PMID:11278502 | Diluted in 5% milk-TBST (1:5000) | |
| Antibody | α-Rpl35 (rabbit polyclonal) | PMID:11278502 | Diluted in 5% milk-TBST (1:5000) | |
| Antibody | α-Pab1 (mouse monoclonal) | EnCor Biotechnology | RRID:AB_2572370 | Diluted in 5% milk-TBST (1:4000) |
| Antibody | α-Scp160 (rabbit polyclonal) | PMID:11278502 | Diluted in 5% milk-TBST (1:10,000) | |
| Antibody | α-protein A (rabbit polyclonal) | Sigma-Aldrich P1291 | RRID:AB_1079562 | Diluted in 5% milk-TBST (1:1000) |
| Antibody | α-Sui2 (chicken polyclonal) | PMID:31086188 | Diluted in 5% milk-TBST (1:1000) | |
| Antibody | α-phospho-Sui2 (rabbit polyclonal) | Cell Signalling Technologies | RRID:AB_330951 | Diluted in 5% milk-TBST (1:1000) |
| Antibody | IRDye 800CW Goat anti-Rabbit IgG, H + L (goat polyclonal) | LI-COR Biosciences | Cat. no.: 926-32211 | Diluted in 5% milk-TBST (1:10,000) |
| Antibody | IRDye 680RD Goat anti-Mouse IgG, H + L (goat polyclonal) | LI-COR Biosciences | Cat. no.: 926-68070 | Diluted in 5% milk-TBST (1:10,000) |
| Antibody | IRDye 680RD Donkey anti-Chicken Ig, H + L (donkey polyclonal) | LI-COR Biosciences | Cat. no.: 926-68075 | Diluted in 5% milk-TBST (1:10,000) |
| Chemical compound, drug | Hydrogen peroxide solution | Sigma | Cat. no.: 95,321 | Made 1/100 dilution in water before adding to cultures/media |
| Chemical compound, drug | 3-Amino-1,2,4-triazole | Sigma | Cat. no.: A8056 | |
| Peptide, recombinant protein | Ambion RNase I | Thermo Fisher | Cat. no.: AM2294 | |
| Peptide, recombinant protein | Sequencing Grade Modified Trypsin | Promega | Cat. no.: V5111 | |
| Commercial assay or kit | NuPAGE 4% to 12%, Bis-Tris, 1.0 mm, Mini Protein Gel, 12-well | Life Technologies | Cat. no.: NP0322 | |
| Strain, strain background (E. coli) | XL10-Gold Ultracompetent Cells | Agilent | Cat. no.: 200,314 | |
| Strain, strain background (S. cerevisiae) | S288c | Detailed in Supplementary file 1, Sheet 6 | ||
| Software, algorithm | LI-COR Image Studio and LI-COR Image Studio Lite | LI-COR Biosciences | https://www.licor.com/bio/software | Version 5.2. LI-COR Image Studio Lite has since been discontinued. |
| Software, algorithm | R | R Core Team, 2019 | https://www.r-project.org/ | Version 3.6.2 |
| Software, algorithm | MaxQuant | Tyanova et al., 2016 | https://www.maxquant.org/ | Version 1.5.7.4 |
| Software, algorithm | GNU Image Manipulation Program | GIMP | https://www.gimp.org/ | Version 2.8.10 |
Additional files
-
Transparent reporting form
- https://cdn.elifesciences.org/articles/73466/elife-73466-transrepform1-v2.pdf
-
Source data 1
Uncropped Western blot images.
- https://cdn.elifesciences.org/articles/73466/elife-73466-data1-v2.pdf
-
Supplementary file 1
MS data analyses.
- https://cdn.elifesciences.org/articles/73466/elife-73466-supp1-v2.xlsx
Download links
A two-part list of links to download the article, or parts of the article, in various formats.
Downloads (link to download the article as PDF)
Open citations (links to open the citations from this article in various online reference manager services)
Cite this article (links to download the citations from this article in formats compatible with various reference manager tools)
Cytosolic aspartate aminotransferase moonlights as a ribosome-binding modulator of Gcn2 activity during oxidative stress
eLife 11:e73466.
https://doi.org/10.7554/eLife.73466


