Plant SYP12 syntaxins mediate an evolutionarily conserved general immunity to filamentous pathogens
- University of Copenhagen, Faculty of Science, CPSC, Department of Plant and Environmental Sciences, Denmark
- University of Paris-Saclay, INRAE, UR BIOGER, France
Figures
Figure 1 with 5 supplements

PEN1/SYP122 are required for papilla and encasement responses to Bgh.
(A, B) Spontaneous callose depositions in leaves of 3-week-old plants. (C–G) Accumulation of callose in response to Bgh attack at appressoria (arrows) and primary germ tube (arrowheads) in (C, D), nonpenetrated cells and (E–G) cells following a successful penetration. Open arrows point to the developing intracellular pathogenic structure (IPS). (G) Same as (F), but optical section taken below the point of entry. * marks cells with cell death response. Bars = 20 µm.
Figure 1—figure supplement 1
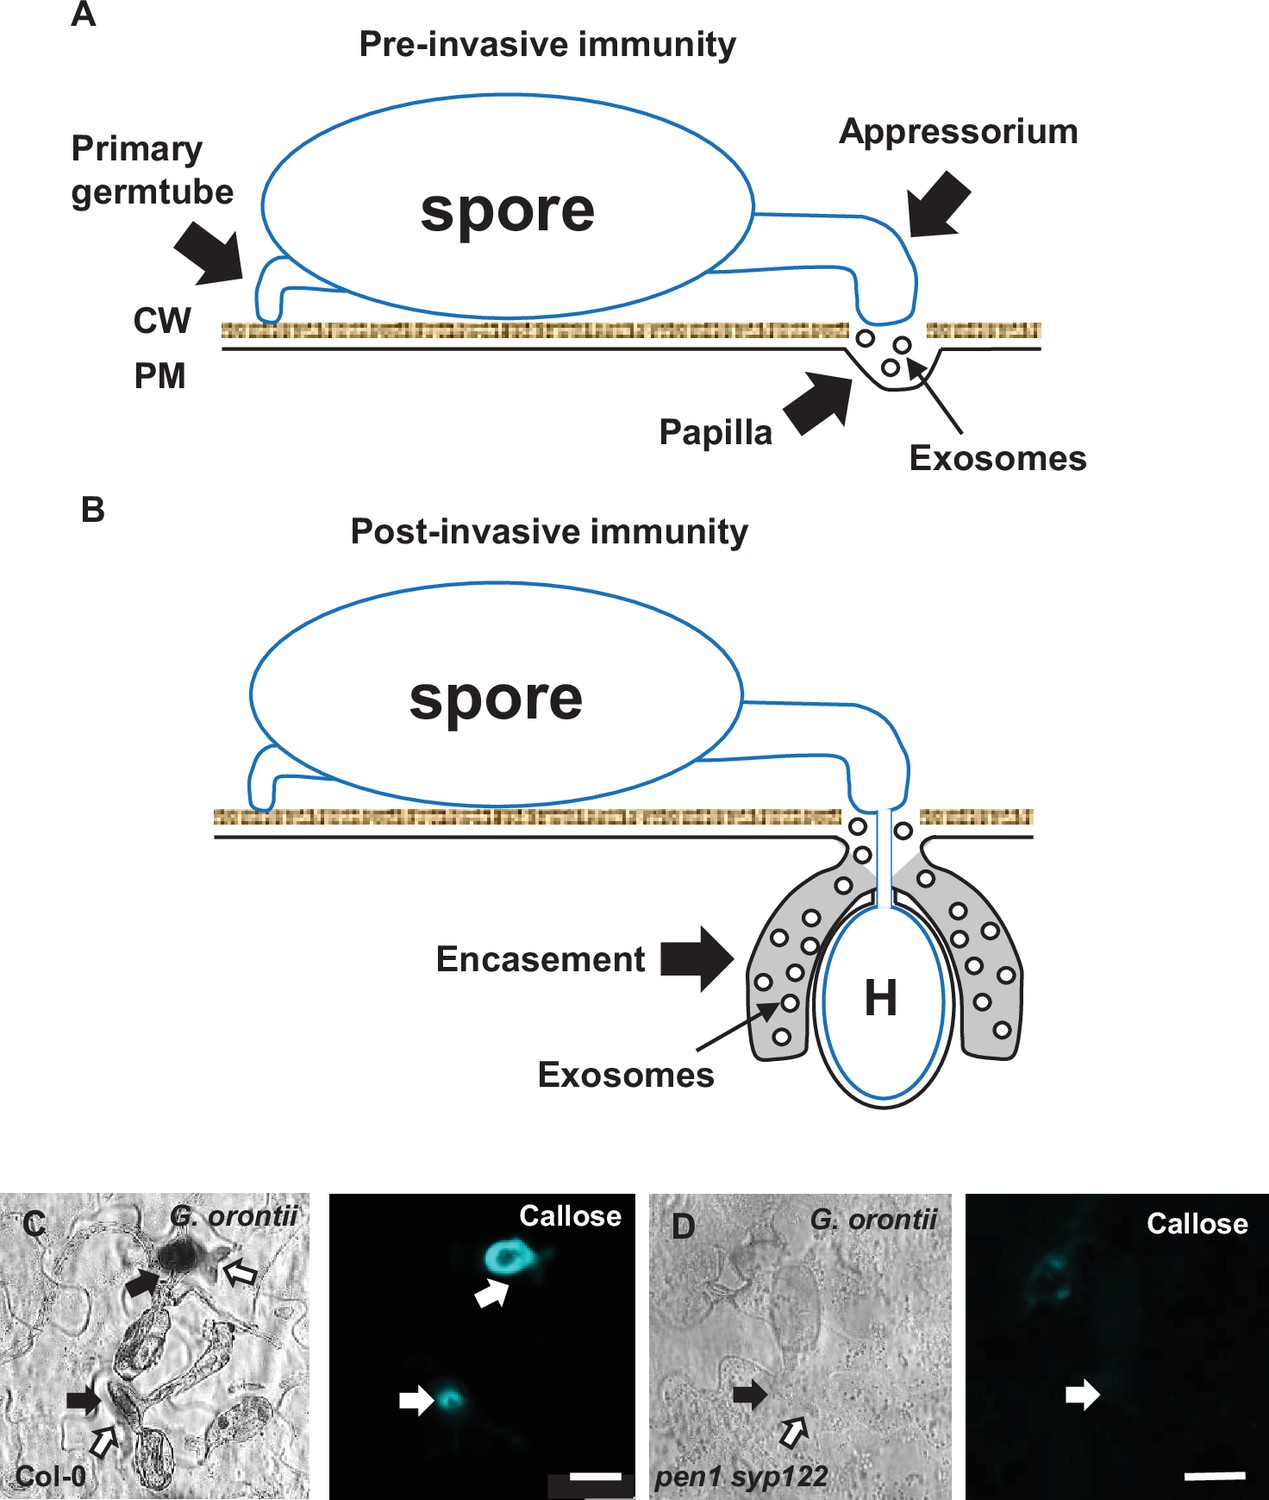
Pre- and postinvasive immunity.
(A) Attack by nonadapted filamentous pathogens such as Bgh on Arabidopsis is met by a localized apposition (papilla) formed between the plant cell wall (CW) and the plasma membrane (PM), containing callose, phenolic compounds, reactive oxygen species, and exosomes, that likely prevents penetration (Zeyen et al., 2002; Assaad et al., 2004; An et al., 2006). (B) Upon successful penetration, the host cell forms an encasement, similar in composition to the papilla, that eventually encloses the developing haustorium (H) and prevents nutrient uptake. Similar to Bgh, spores of C. destructivum and P. infestans attempt to penetrate and form an intracellular pathogenic structure (IPS, haustoria, biotrophic hyphae, and infection vesicle, respectively). In the case of an ineffective encasement response, the host cell initiates a cell death response that prevents pathogen growth. (C, D) Accumulation of callose in response to successful penetration by G. orontii (24 hr). Open arrows point to the developing IPS. Bars = 20 µm.
Figure 1—video 1
Z-stack (callose and bright-field overlay) of successful penetration by Bgh in Col-0.
Figure 1—video 2
Z-stack (callose and bright-field overlay) of successful penetration by Bgh in pen1 syp122.
Figure 1—video 3
Z-stack (callose and bright-field overlay) of successful penetration by G. orontii in Col-0.
Figure 1—video 4
Z-stack (callose and bright-field overlay) of successful penetration by G. orontii in pen1 syp122.
Figure 2 with 2 supplements

PEN1/SYP122 are required for accumulation of TET8-GFP in response to penetration by Bgh.
(A–D) Localization of TET8-GFP in (A, C) resting epidermal cells and in (B, D) response to successful penetration by Bgh (stained with propidium iodide [PI]) and initiation of the intracellular pathogenic structure (IPS) (arrows). Bars = 10 µm.
Figure 2—video 1
Z-stack (GFP and propidium iodide overlay) of successful penetration by Bgh in Col-0.
Figure 2—video 2
Z-stack (GFP and propidium iodide overlay) of successful penetration by Bgh in pen1 syp122.
Figure 3 with 2 supplements
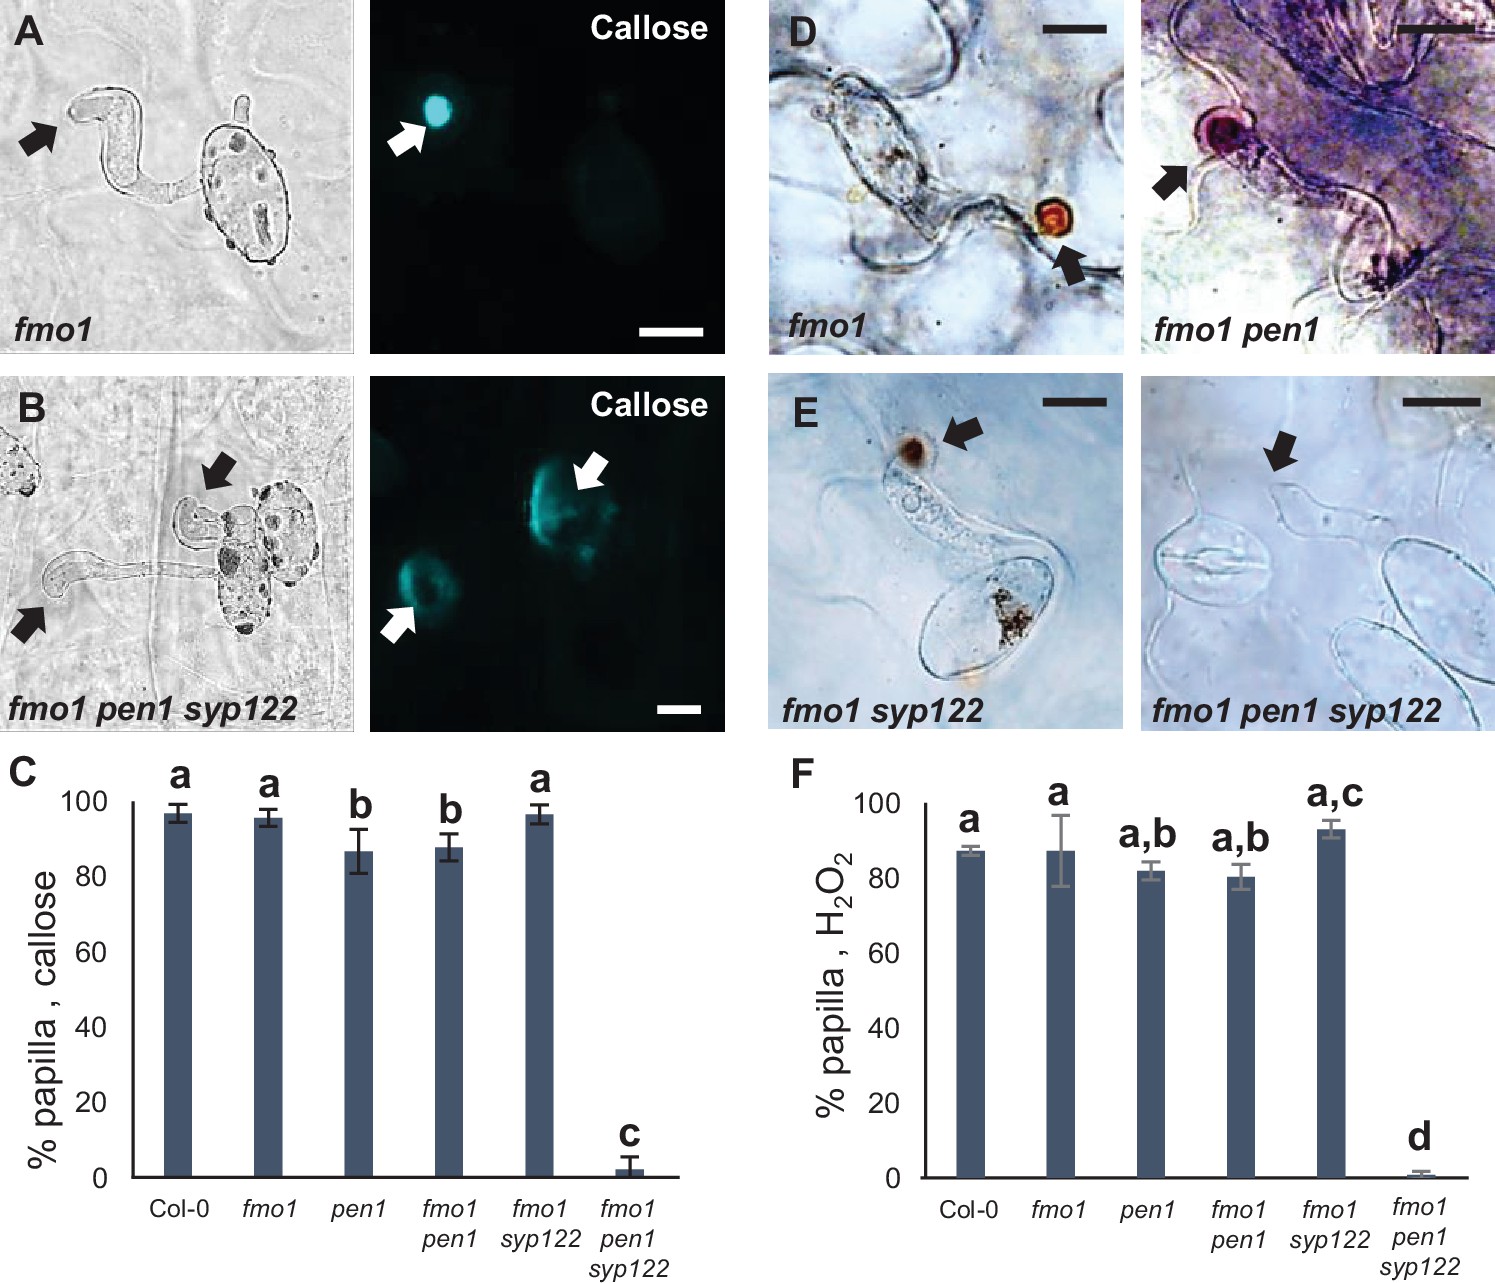
PEN1/SYP122 are required for papilla responses toward Bgh.
(A, B, D, E) Accumulation of callose (A, B) or H2O2 (D, E) in response to Bgh attack (arrows) at nonpenetrated attack sites. Bars = 10 µm. (C, F) Frequency of papillae in response to Bgh in nonpenetrated cells as detected by staining for callose (C) or H2O2 (F). (C, F) All values are mean ± SD (n = 5 leaves per genotype). Different letters indicate significantly different values at p≤0.001 estimated using logistic regression.
-
Figure 3—source data 1
Source data for the graphs in Figure 3C and F.
- https://cdn.elifesciences.org/articles/73487/elife-73487-fig3-data1-v2.xlsx
Figure 3—figure supplement 1
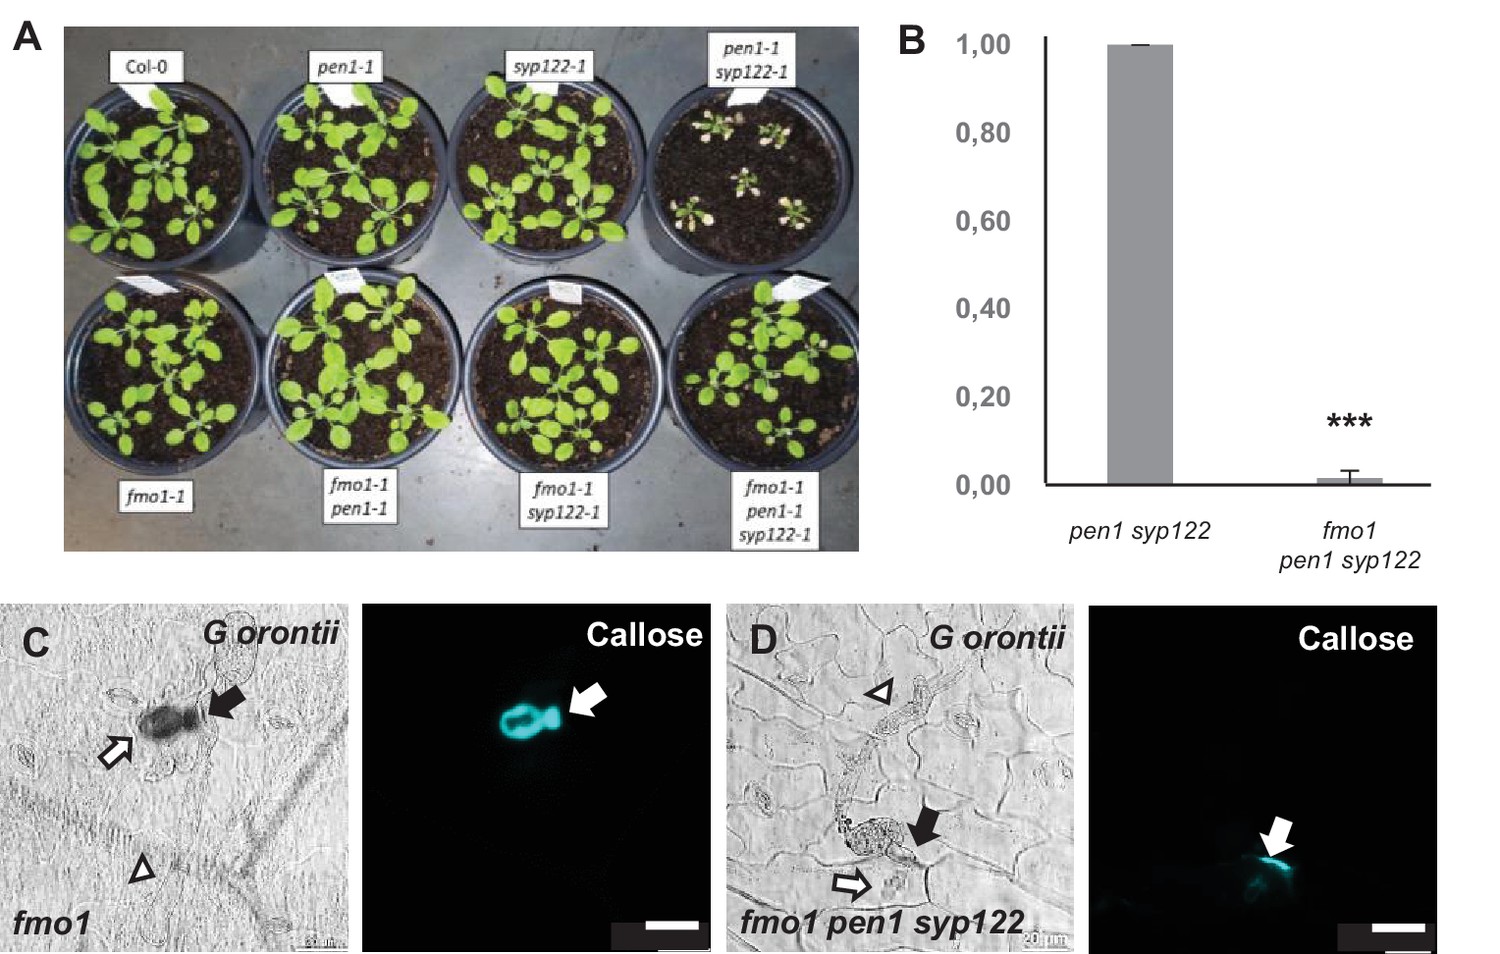
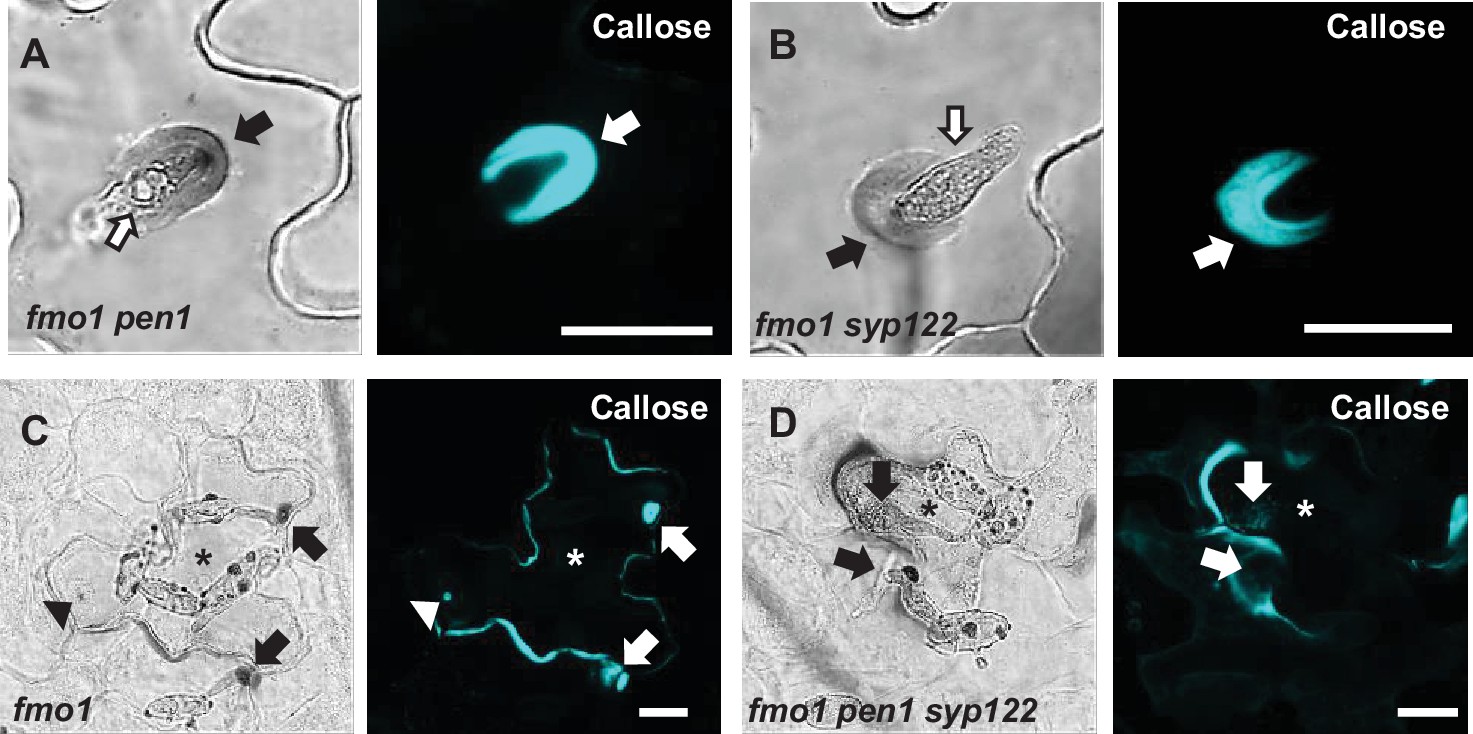
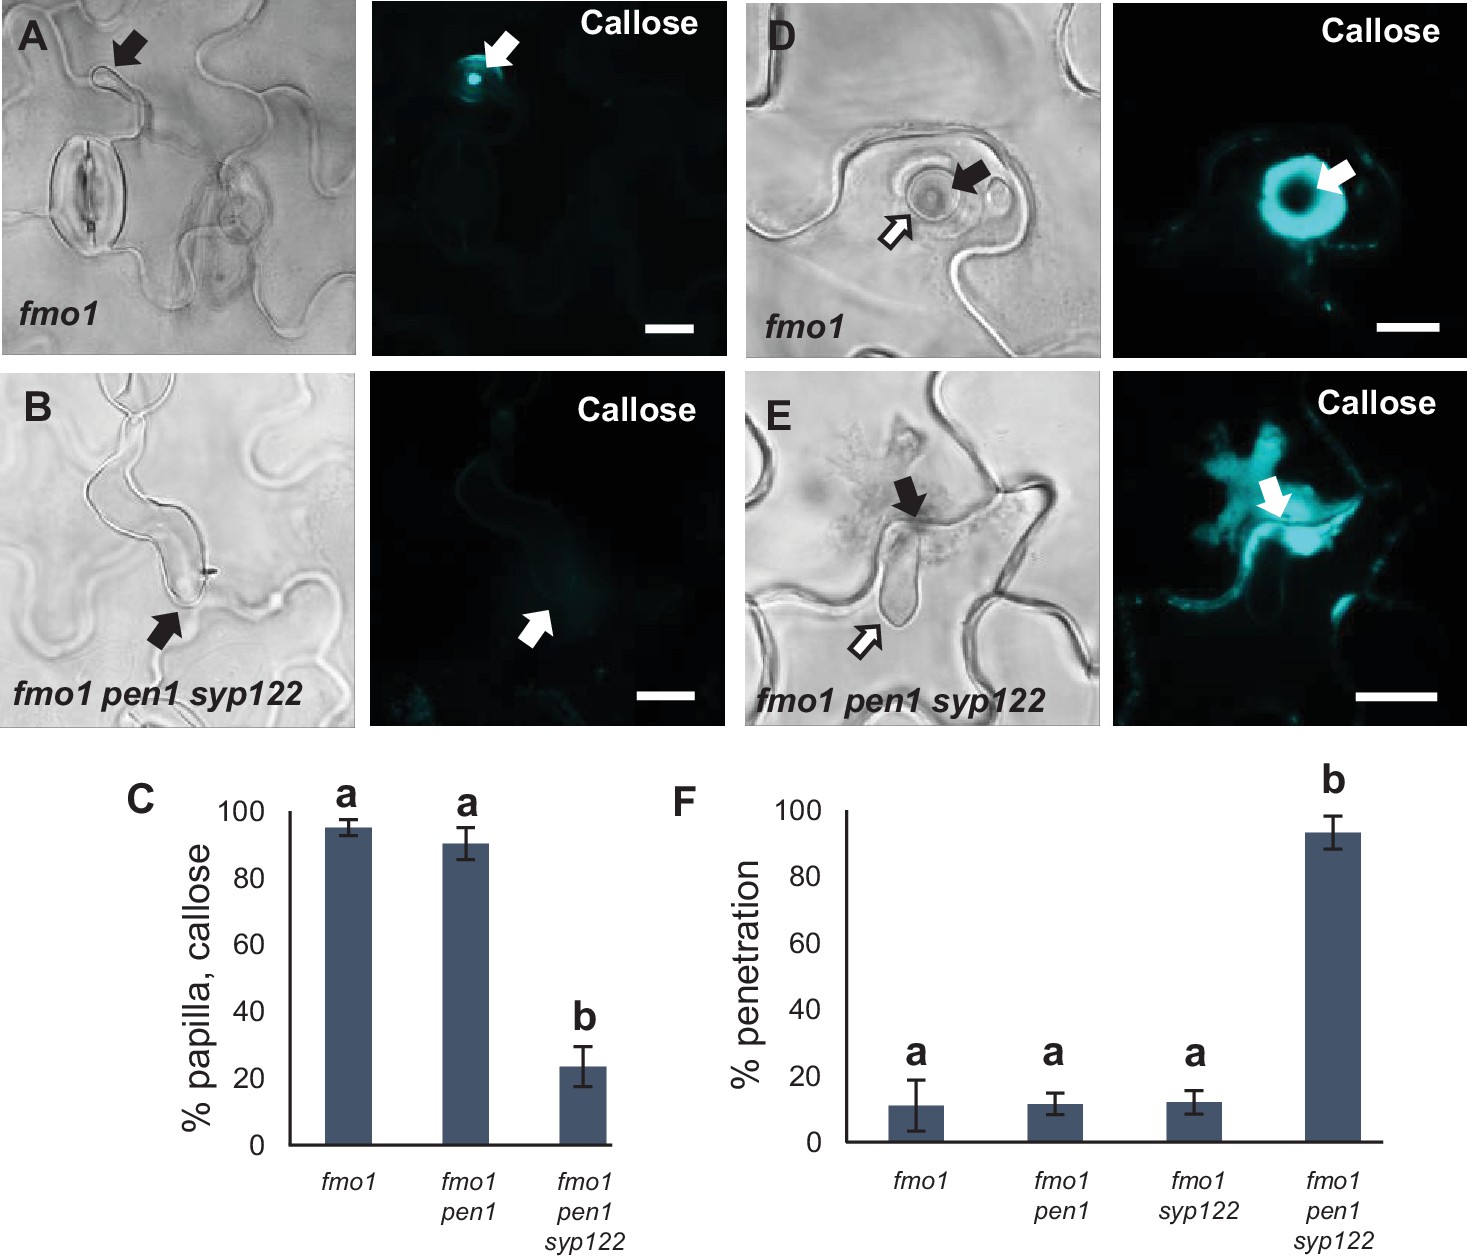
Loss of FMO1 attenuates pen1 syp122 autoimmunity.
(A) Plants at 4 weeks, showing the growth phenotypes of the mutant lines used in these studies. (B) Relative transcript levels of PR1 in 4-week-old plants. Values are mean ± SD (n = 3). ***p<0.001, Student’s t-test. (C, D) Accumulation of callose in response to G. orontii (48 hr). Open arrows and arrowheads point to the developing intracellular pathogenic structure (IPS) and secondary hyphae, respectively. Bars = 20 µm.
Figure 3—figure supplement 2

PEN1/SYP122 are required for papilla responses to Bgh.
(A–D) Accumulation of callose in response to Bgh attack at nonpenetrated (arrowheads) and penetrated (arrows) attack sites. Bars = 20 µm.
Figure 4 with 10 supplements
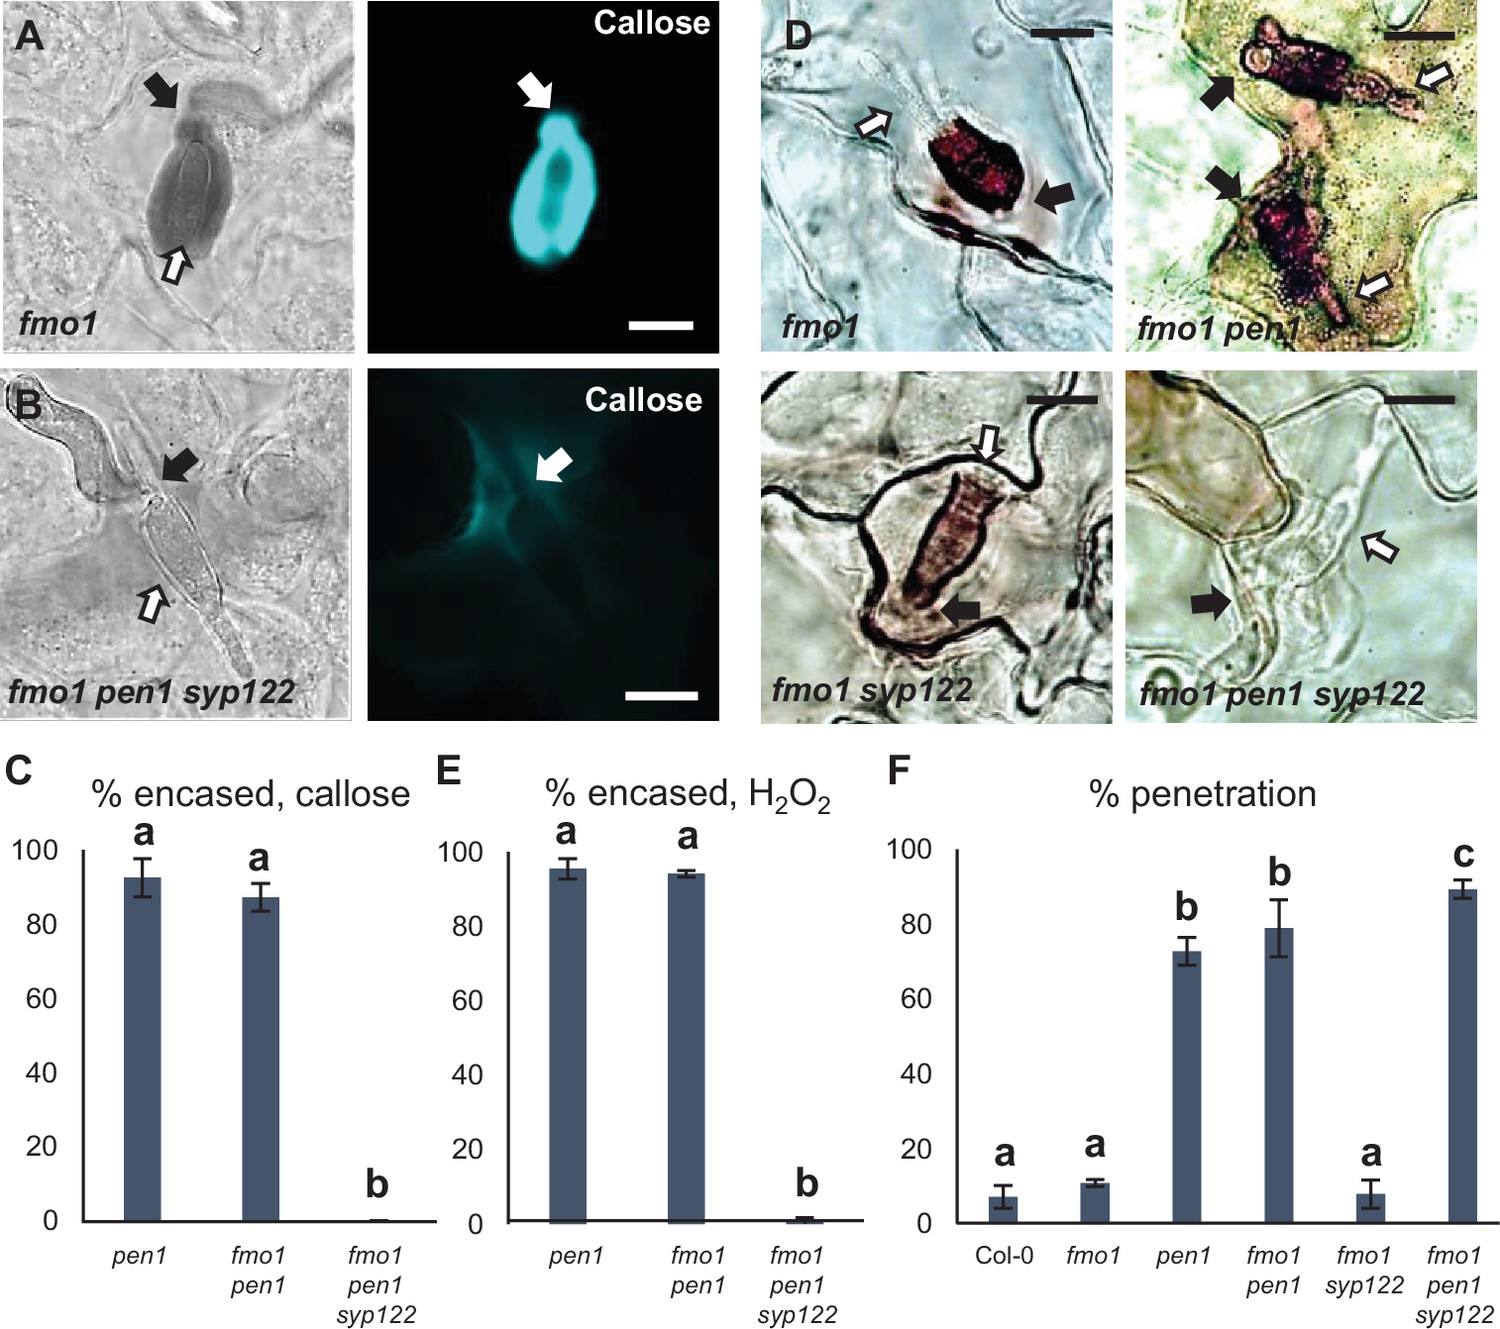
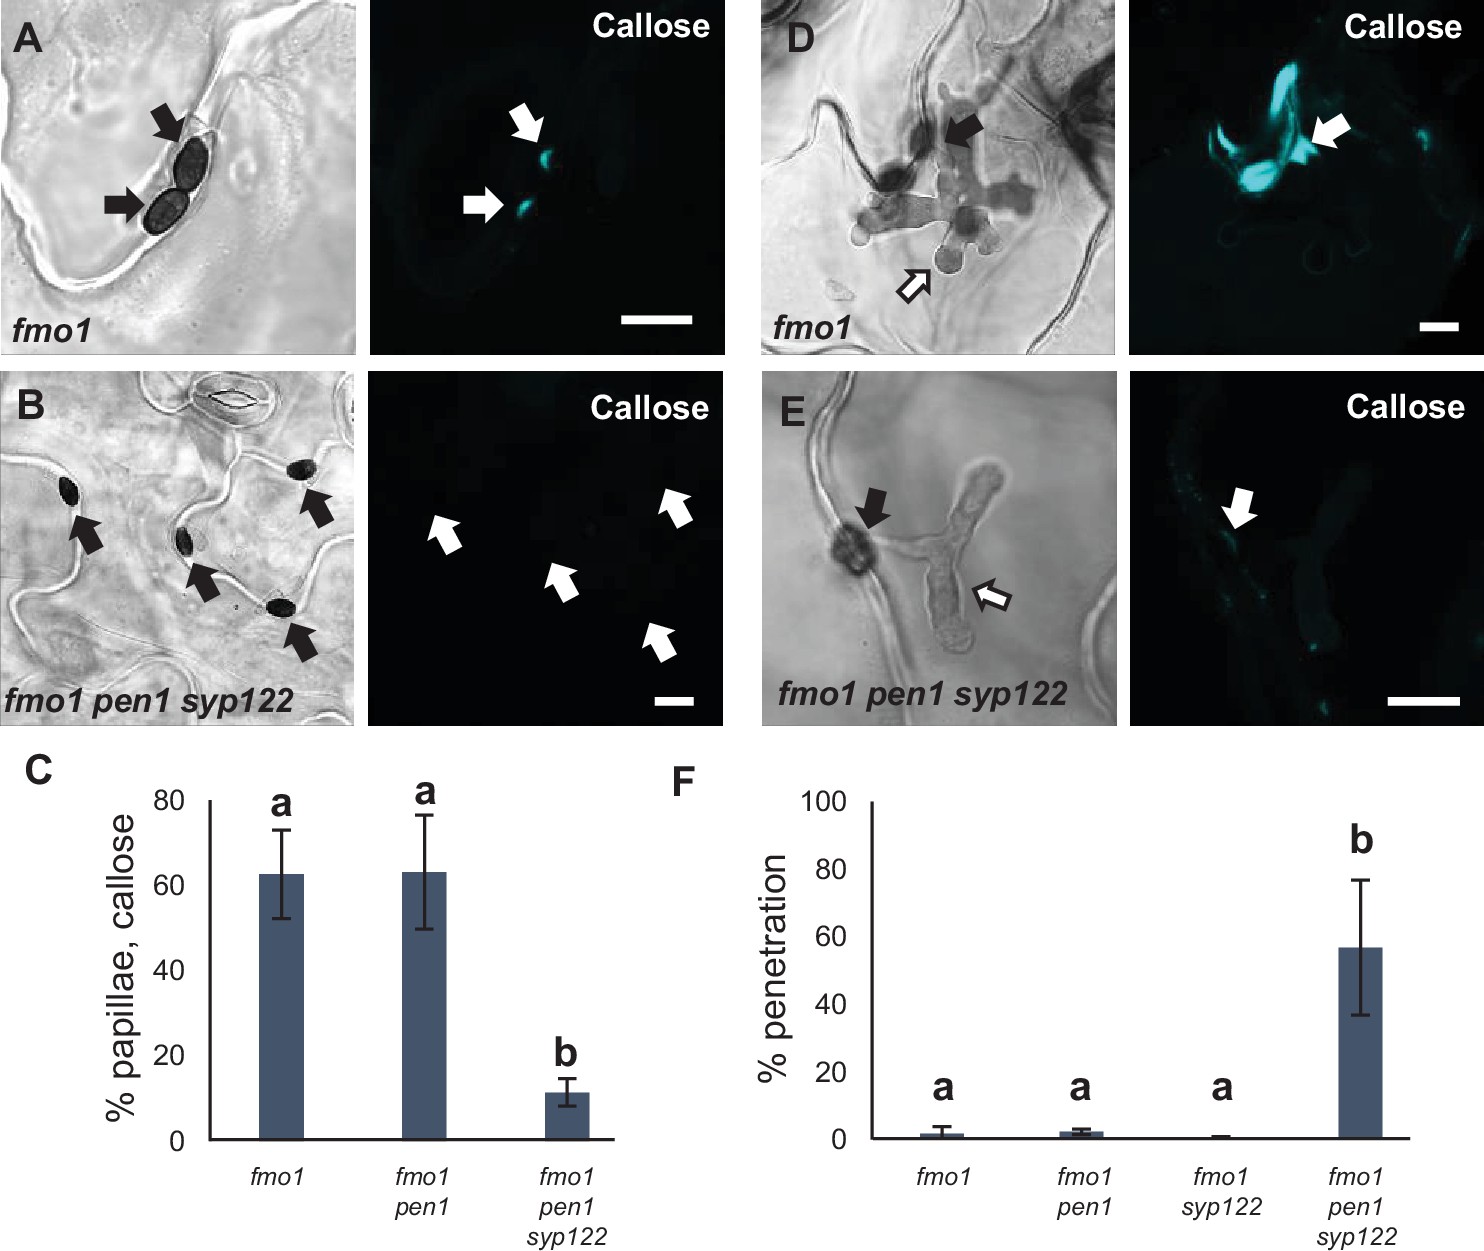
PEN1/SYP122 are required for encasement responses toward Bgh.
(A, B, D) Accumulation of callose (A, B) or H2O2 (D) in response to Bgh attack (arrows) at penetrated attack sites. Open arrows point to the developing intracellular pathogenic structure (IPS). Bars = 10 µm. (C, E) Frequency of encasements in response to Bgh in penetrated cells as detected by staining for callose (C) or H2O2 (E). (F) Frequency of penetrations by Bgh. (C, E, F) All values are mean ± SD (n = 5 leaves per genotype). Different letters indicate significantly different values at p≤0.001 estimated using logistic regression.
-
Figure 4—source data 1
Source data for the graphs in Figure 4C, E and F.
- https://cdn.elifesciences.org/articles/73487/elife-73487-fig4-data1-v2.xlsx
Figure 4—figure supplement 1
PEN1/SYP122 are required for encasement responses to Bgh.
(A–D) Accumulation of callose in response to Bgh attack at nonpenetrated (arrowheads) and penetrated (arrows) attack sites. Open arrows point to the developing intracellular pathogenic structure (IPS). * marks cells with cell death response. Bars = 20 µm.
Figure 4—figure supplement 2
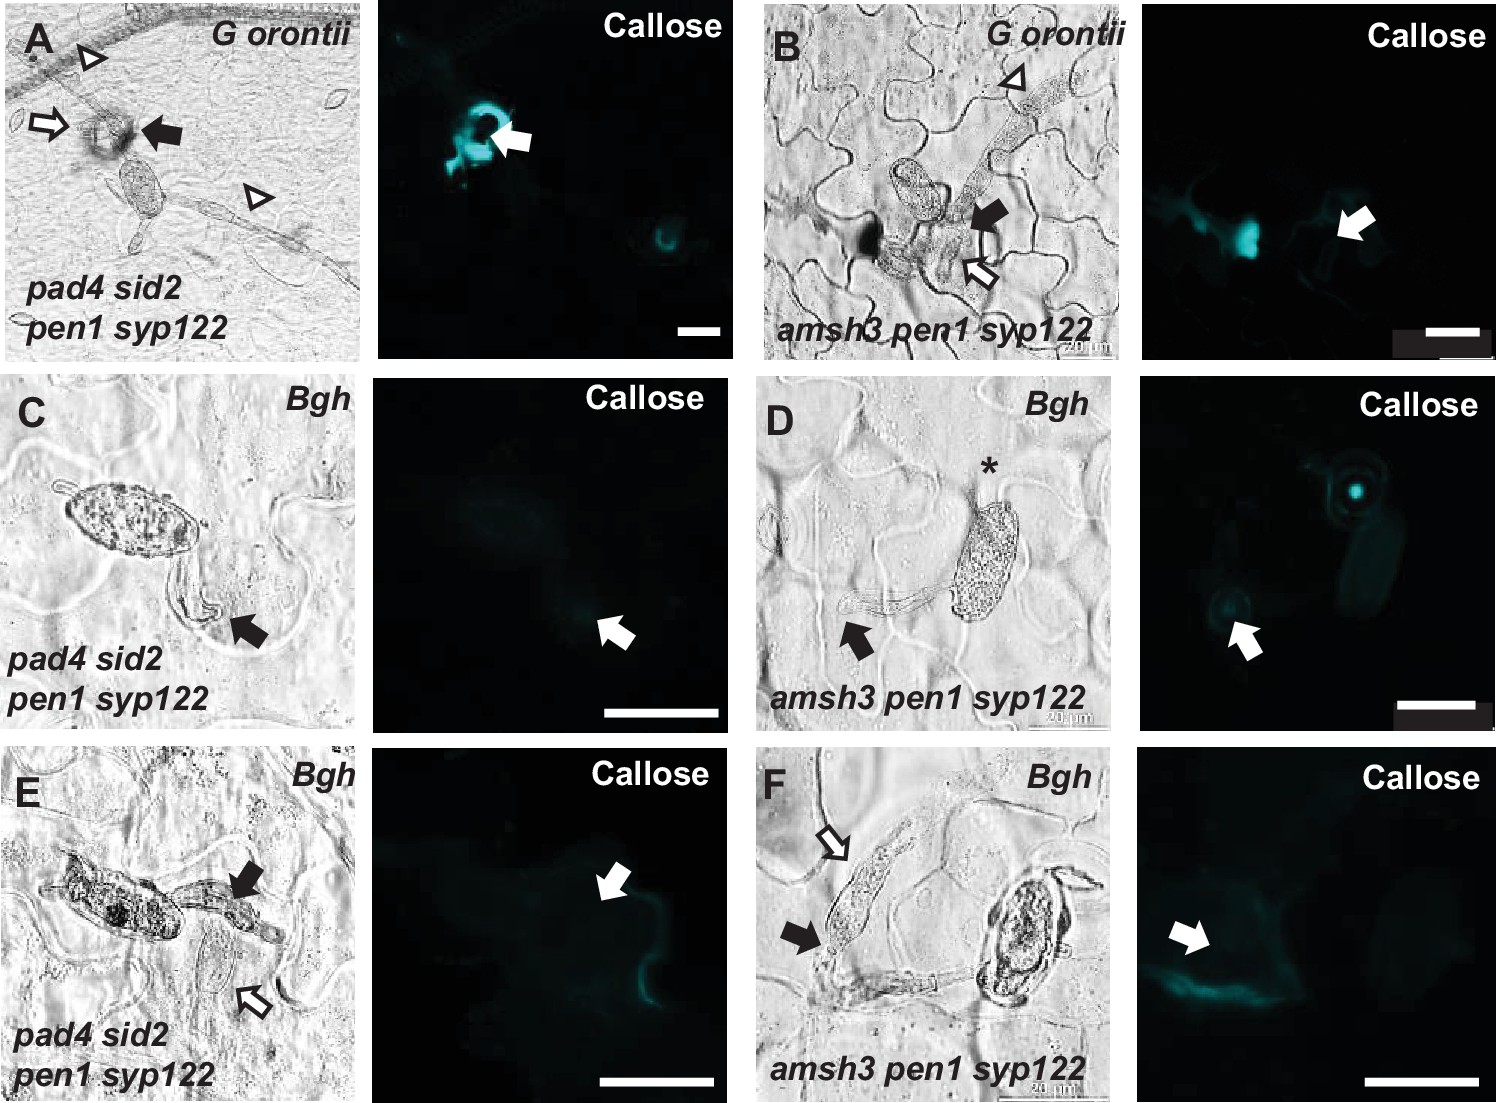
PEN1/SYP122 are required for papilla and encasement responses to Bgh.
(A–F) Accumulation of callose in response to (A, B) G. orontii and (C–F) Bgh (48 hr) attack at (C, D) nonpenetrated and (A, B, E, F) penetrated attack sites (arrows). Open arrows point to the developing intracellular pathogenic structure (IPS). Open arrows and arrowheads point to the developing IPS and secondary hyphae, respectively. Bars = 20 µm.
Figure 4—video 1
Z-stack (callose and bright-field overlay) of successful penetration by G. orontii in fmo1.
Figure 4—video 2
Z-stack (callose and bright-field overlay) of successful penetration by G. orontii in fmo1 pen1 syp122.
Figure 4—video 3
Z-stack (callose and bright-field overlay) of successful penetration by G. orontii in pad4 sid2 pen1 syp122.
Figure 4—video 4
Z-stack (callose and bright-field overlay) of successful penetration by G. orontii in amsh3 pen1 syp122.
Figure 4—video 5
Z-stack (callose and bright-field overlay) of successful penetration by Bgh in fmo1.
Figure 4—video 6
Z-stack (callose and bright-field overlay) of successful penetration by Bgh in fmo1 pen1 syp122.
Figure 4—video 7
Z-stack (callose and bright-field overlay) of successful penetration by Bgh in pad4 sid2 pen1 syp122.
Figure 4—video 8
Z-stack (callose and bright-field overlay) of successful penetration by Bgh in amsh3 pen1 syp122.
Figure 5 with 1 supplement
PEN1/SYP122 are required for preinvasive immunity toward C. destructivum.
(A, B, D, E) Accumulation of callose in response to attack by melanized C. destructivum appressoria (arrows) at (A, B) nonpenetrated and (D, E) penetrated attack sites. Open arrows point to the developing intracellular pathogenic structure (IPS). Bars = 10 µm. (C) Frequency of papillae in response to C. destructivum in nonpenetrated cells. (F) Frequency of penetrations by C. destructivum. (C, F) All values are mean ± SD (n = 4 leaves per genotype). Different letters indicate significantly different values at p≤0.001 estimated using logistic regression.
-
Figure 5—source data 1
Source data for the graphs in Figure 5C and F.
- https://cdn.elifesciences.org/articles/73487/elife-73487-fig5-data1-v2.xlsx
Figure 5—figure supplement 1
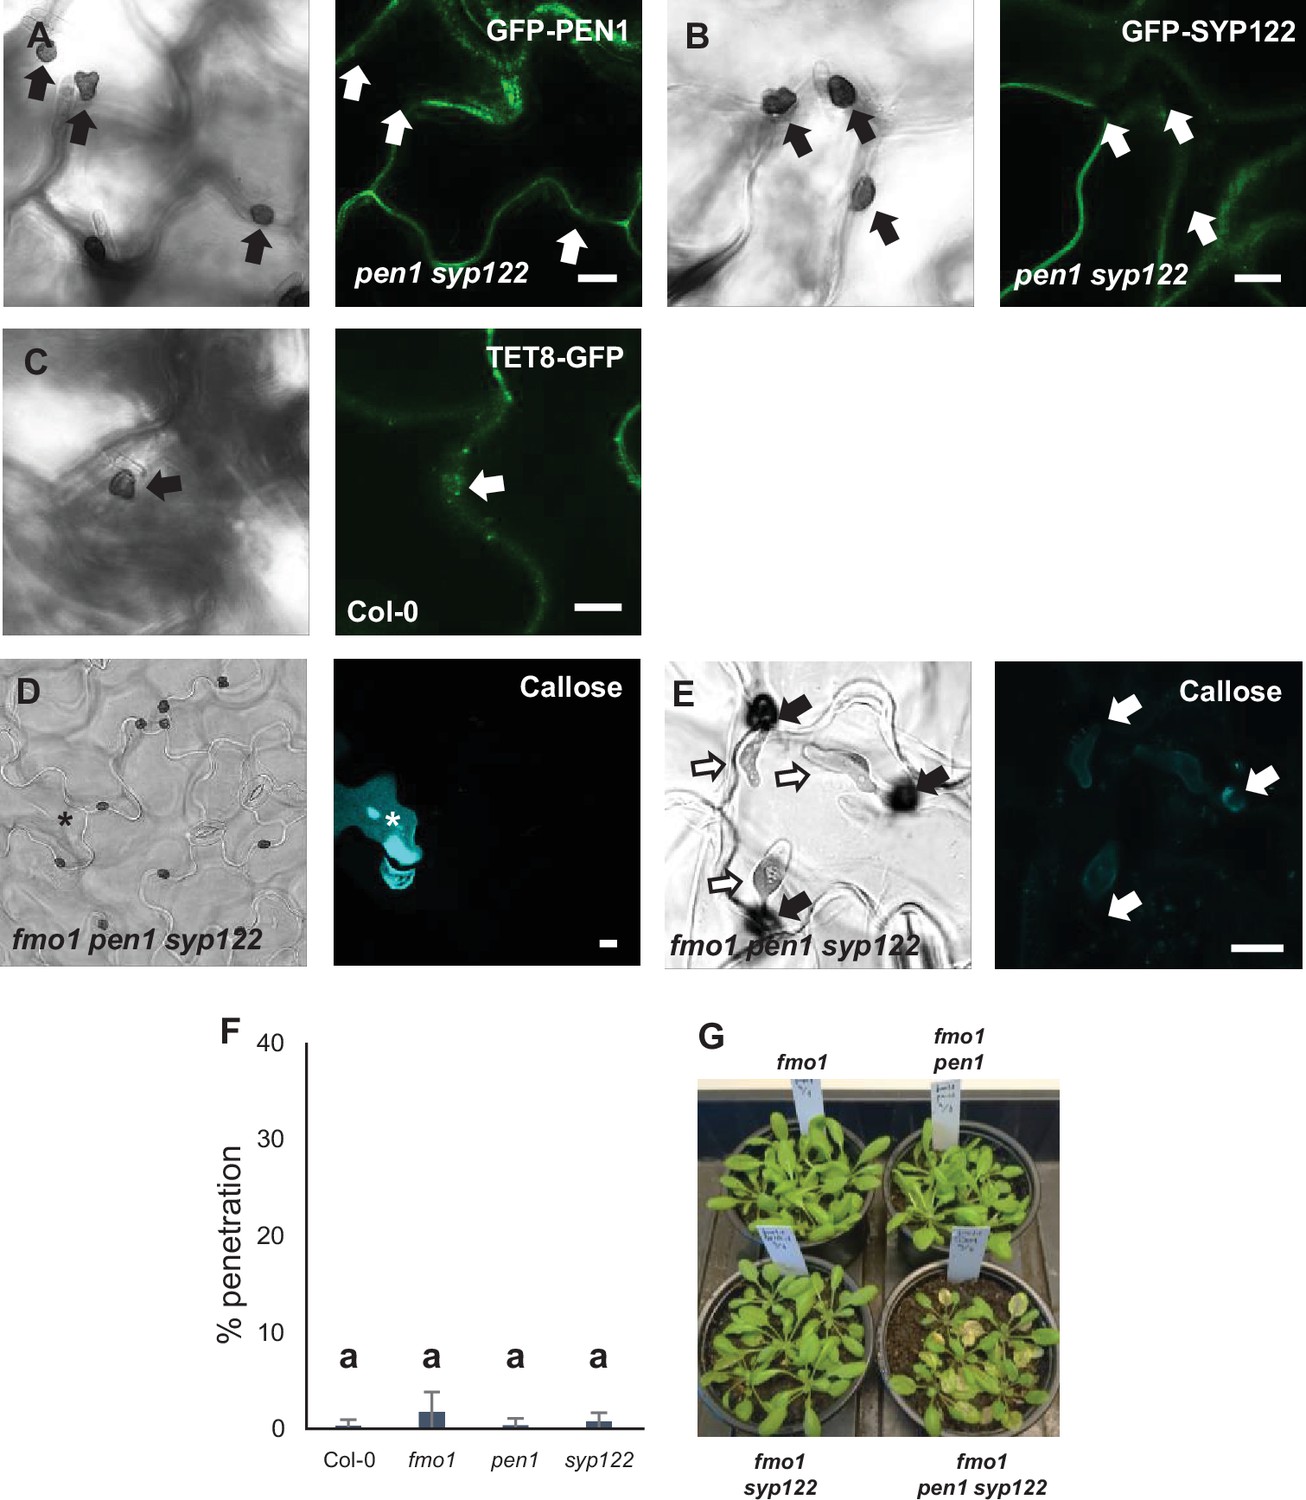
PEN1/SYP122 are required for preinvasive immunity toward C. destructivum.
(A–C) Localization of GFP-PEN1 (A), GFP-SYP122 (B), and TET8-GFP (C) in response to attack by C. destructivum. (D, E) Accumulation of callose in response to attack by C. destructivum in (D) nonpenetrated cells and (E) at penetration sites (arrows). Open arrows point to the developing intracellular pathogenic structure (IPS). * marks cell with cell death response. (F) Frequency of penetration by C. destructivum. (G) Macroscopic phenotype at 5 dai with C. destructivum. Bars = 10 µm. (F) All values are mean ± SD (n = 4 leaves per genotype). Different letters indicate significantly different values at p≤0.001 estimated using logistic regression.
Figure 6 with 1 supplement
PEN1/SYP122 are required for preinvasive immunity toward P. infestans.
(A, B, D, E) Accumulation of callose in response to P. infestans attack (arrows) at (A, B) nonpenetrated and (D, E) penetrated attack sites. Open arrows point to the developing intracellular pathogenic structure (IPS). Bars = 10 µm. (C) Frequency of papillae in response to P. infestans in nonpenetrated cells. (F) Frequency of penetrations by P. infestans. (C, F) All values are mean ± SD (n = 4 leaves per genotype). Different letters indicate significantly different values at p≤0.001 estimated using logistic regression.
-
Figure 6—source data 1
Source data for the graphs in Figure 6C and F.
- https://cdn.elifesciences.org/articles/73487/elife-73487-fig6-data1-v2.xlsx
Figure 6—figure supplement 1

PEN1/SYP122 are required for preinvasive immunity toward P. infestans.
(A–C) Localization of GFP-PEN1 (A), GFP-SYP122 (B), and TET8-GFP (C) in response to attack by P. infestans. (D) Frequency of penetration by P. infestans. Bars = 10 µm. (D) All values are mean ± SD (n = 4 leaves per genotype). Different letters indicate significantly different values at p≤0.001 estimated using logistic regression.
Figure 7 with 1 supplement

Responses in Marchantia polymorpha to filamentous pathogens.
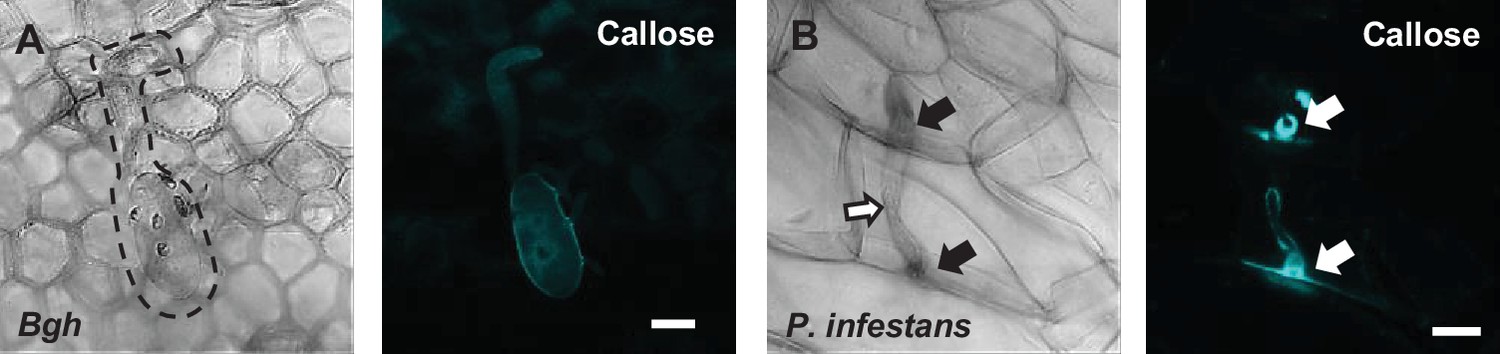
(A, B) Accumulation of callose in Marchantia in response to attack (arrows) by (A) P. infestans or (B) C. destructivum in nonpenetrated cells. Note that the frequency of P. infestans spores that attack a host cell is very low. (C–F) mCitrine signal of MpSYPs in response to attack (arrows) by C. destructivum in nonpenetrated cells. We did not observe any successful penetrations in Marchantia by C. destructivum. Bars = 10 µm.
Figure 7—figure supplement 1
Responses in Marchantia polymorpha to filamentous pathogens.
(A) On M. polymorpha, spores from Bgh (dotted line) were mis-differentiated with no or wrongly orientated appressoria that did not attack the host cell. (B) Accumulation of callose in M. polymorpha in response to attack by P. infestans (arrows) in penetrated cells. Open arrow points to the developing intracellular pathogenic structure (IPS). Note that the frequency of P. infestans spores that attack a host cell is very low. Bars = 10 µm.
Figure 8 with 7 supplements
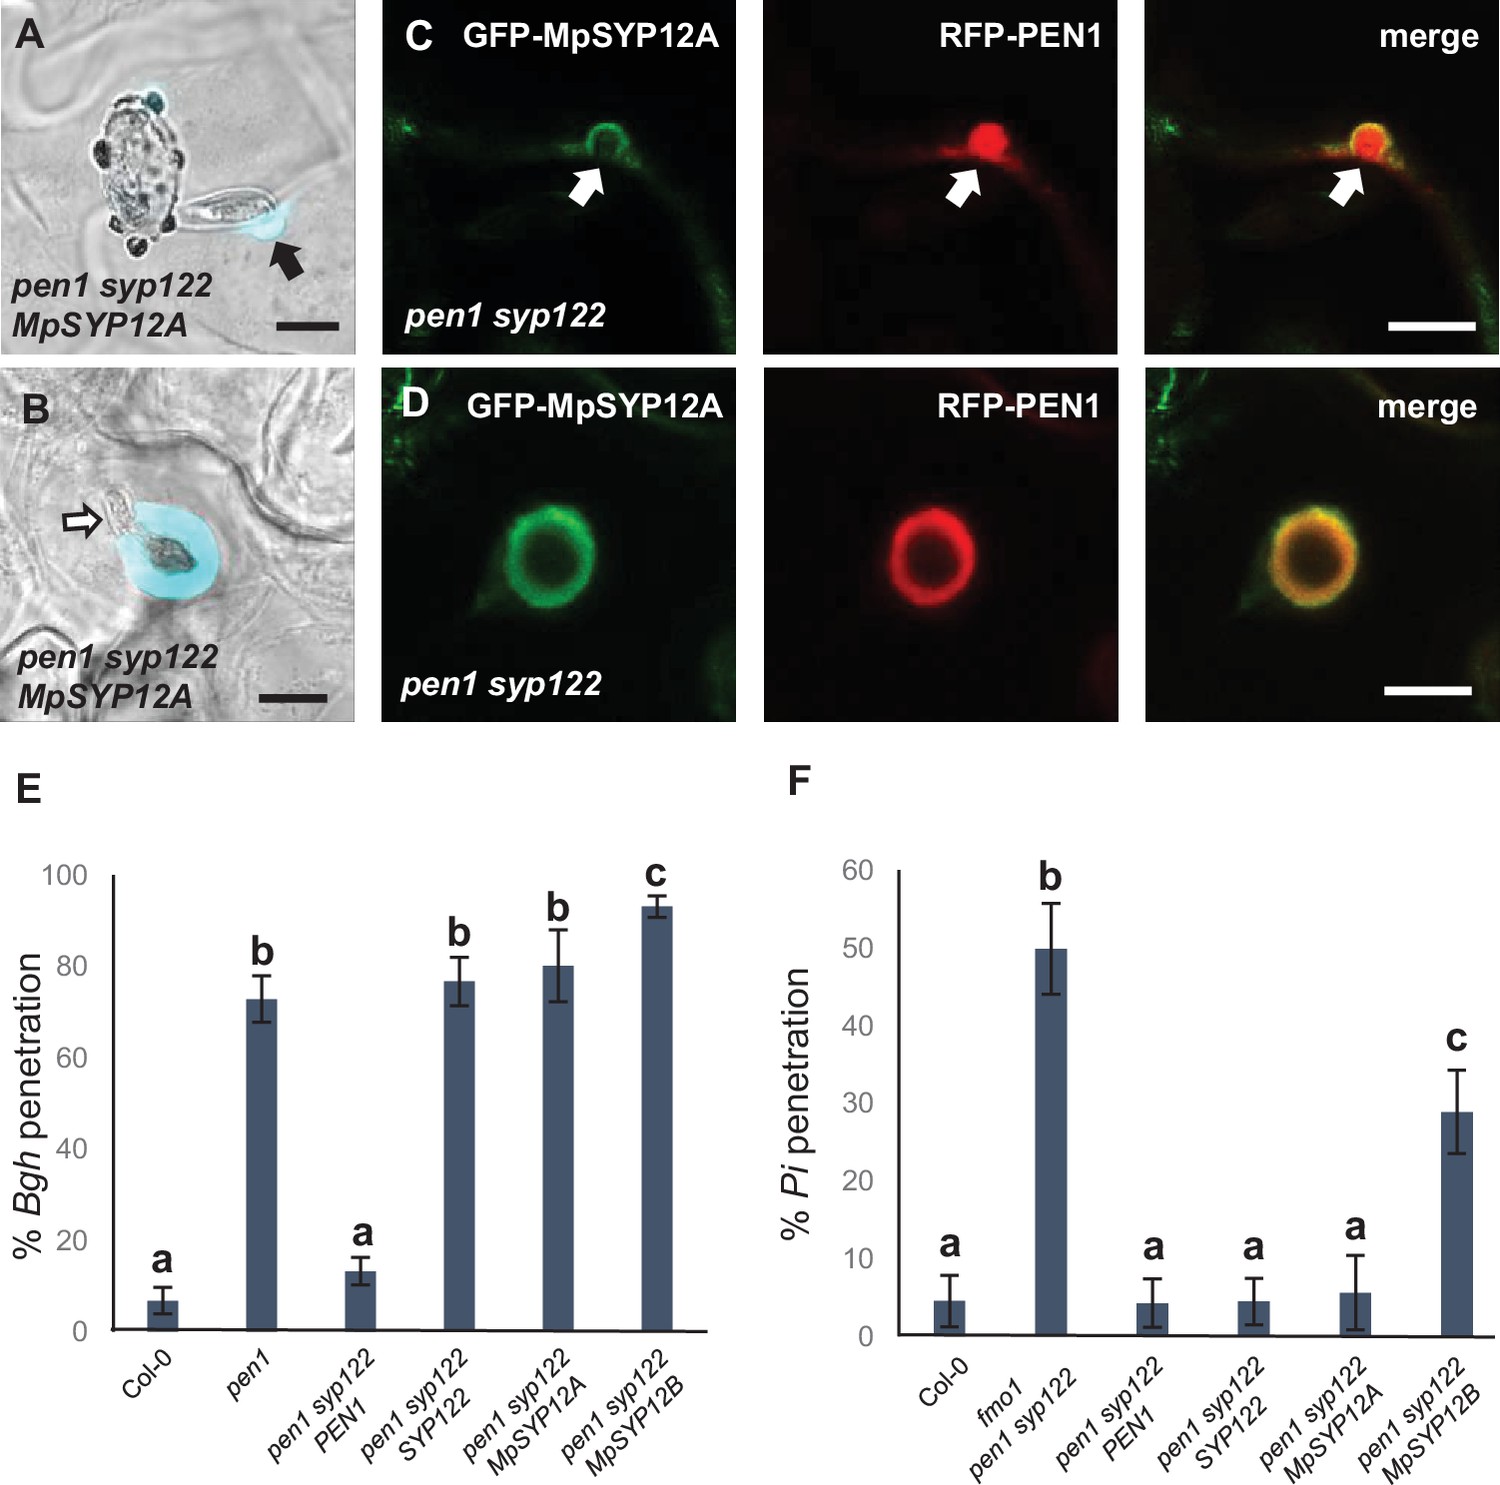
Marchantia syntaxins rescue papilla and encasement responses in Arabidopsis.
(A, B) Accumulation of callose in response to attack (arrow) by Bgh in (A) nonpenetrated and (B) penetrated cells. Open arrow points to the developing intracellular pathogenic structure (IPS). (C, D) Localization of MpSYP12A and PEN1 in response to attack (arrows) by Bgh in (C) nonpenetrated and (D) penetrated cells. Bars = 10 µm. (E, F) Frequency of penetration by (E) Bgh and (F) P. infestans. All values are mean ± SD (n = 4 leaves per genotype). Different letters indicate significantly different values at p≤0.001 estimated using logistic regression.
-
Figure 8—source data 1
Source data for the graphs in Figure 8E and F.
- https://cdn.elifesciences.org/articles/73487/elife-73487-fig8-data1-v2.xlsx
Figure 8—figure supplement 1
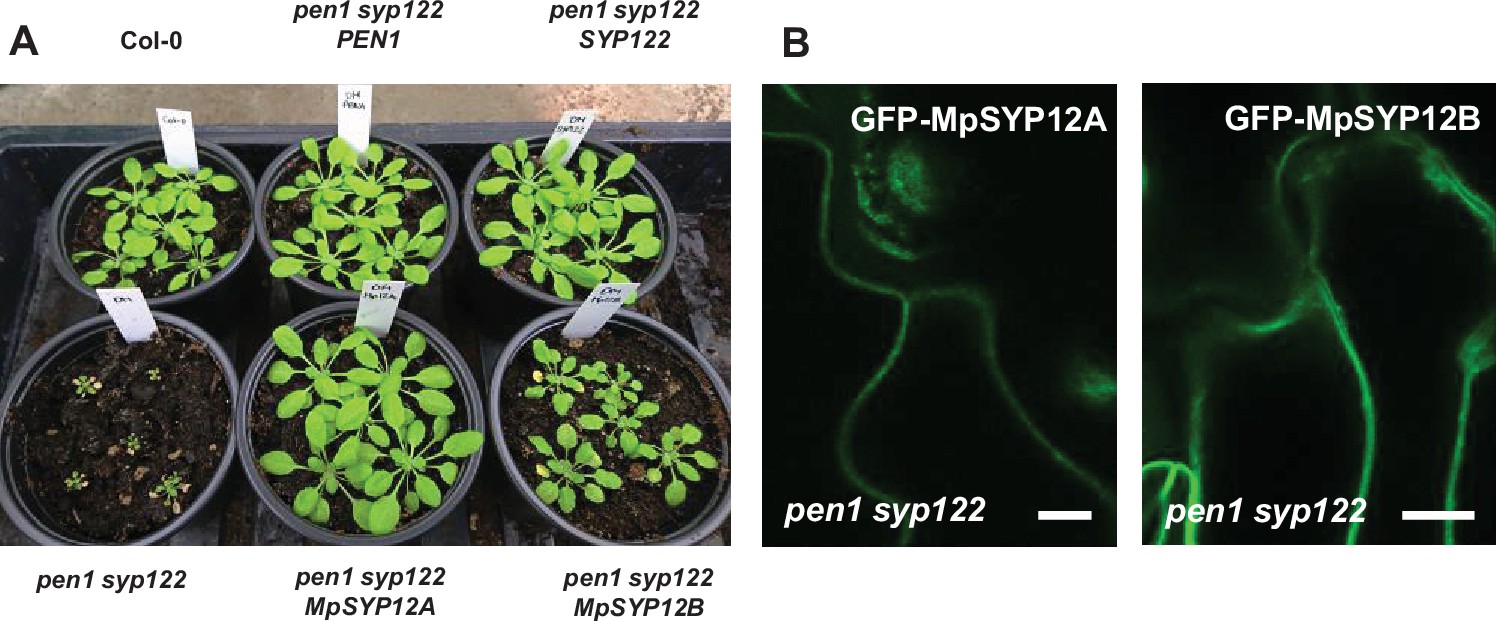
Marchantia syntaxins are functional in Arabidopsis.
(A) Plants at 5 weeks, expressing SYP12 clade members from either Arabidopsis or Marchantia polymorpha. (B) Localization of Marchantia SYP12 clade members in the epidermis of leaves from plants of 4 weeks. Bars = 10 µm.
Figure 8—figure supplement 2
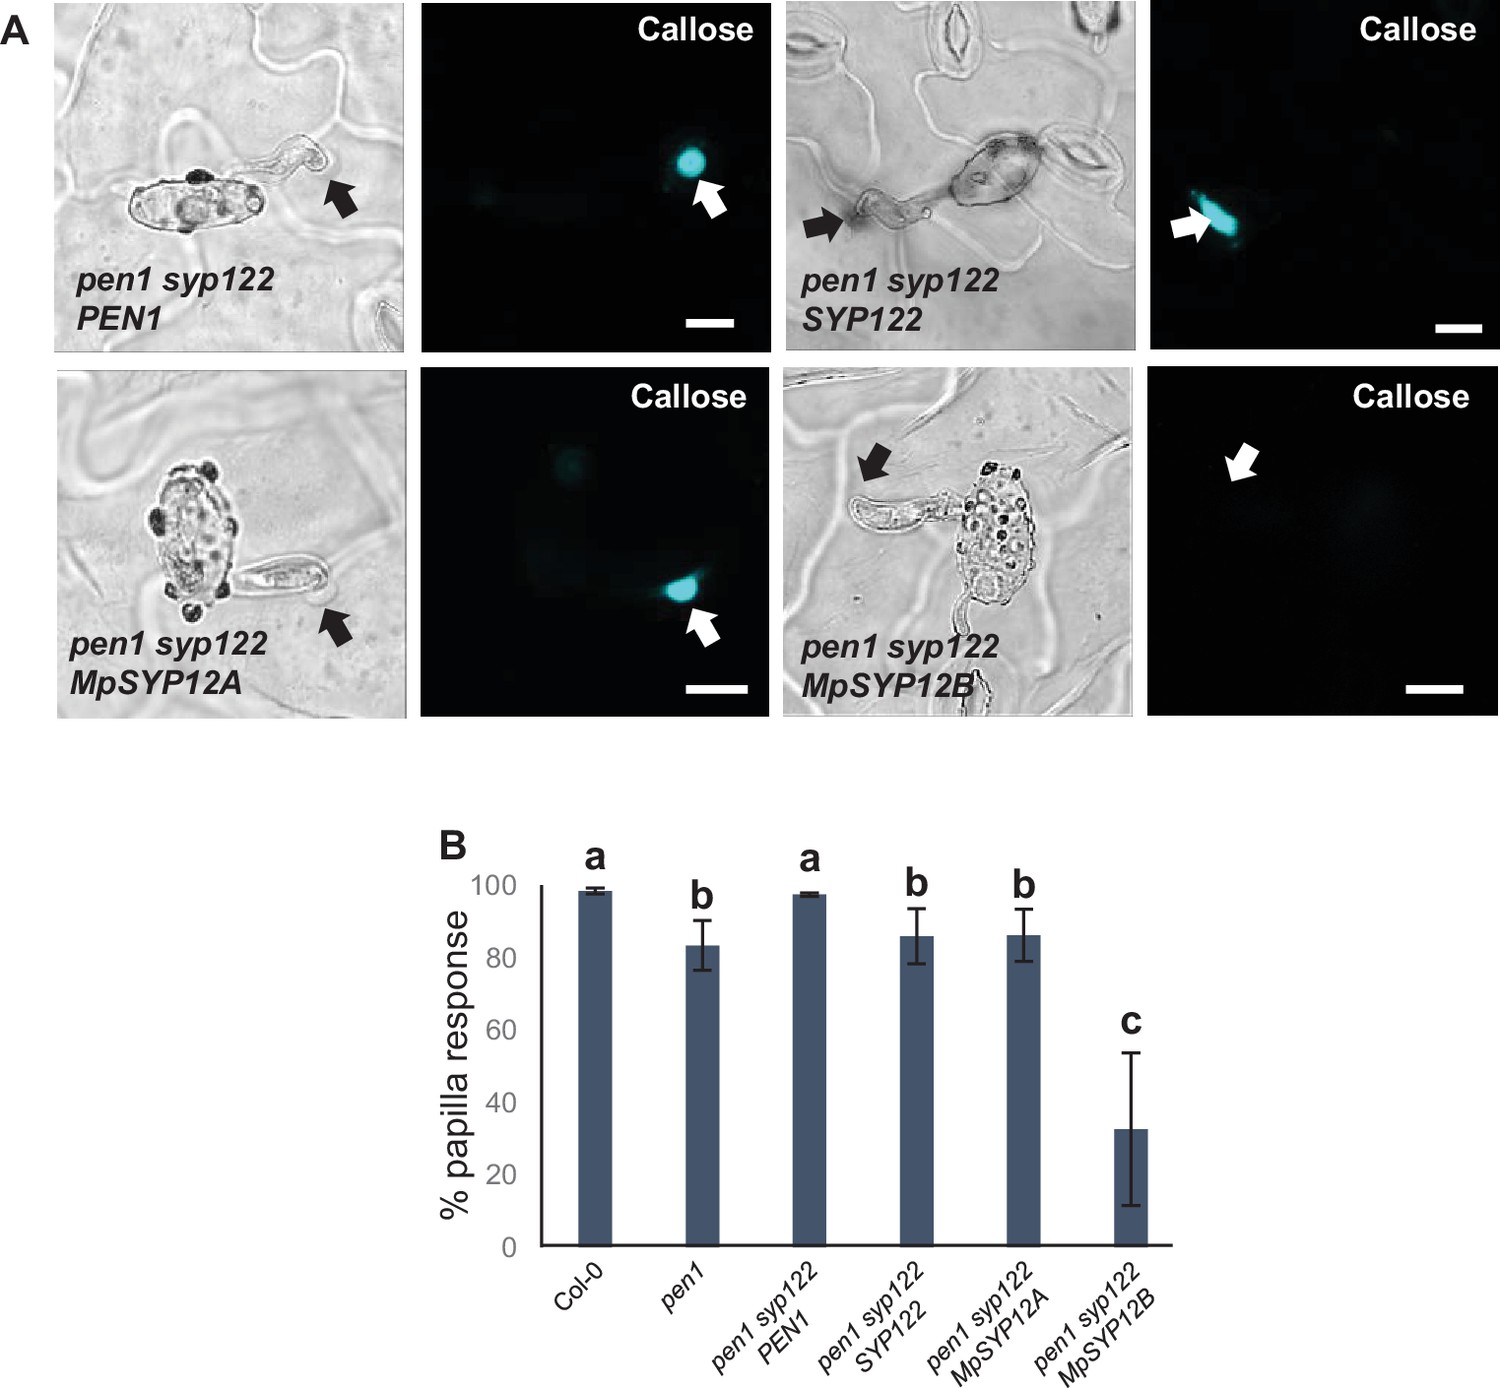
Marchantia syntaxins rescue papilla responses.
(A) Accumulation of callose in response to Bgh attack at nonpenetrated (arrows) attack sites. Bars = 10 µm. (B) Frequency of papillae in response to Bgh in nonpenetrated cells. All values are mean ± SD (n = 5 leaves per genotype). Different letters indicate significantly different values at p≤0.001 estimated using logistic regression.
Figure 8—figure supplement 3
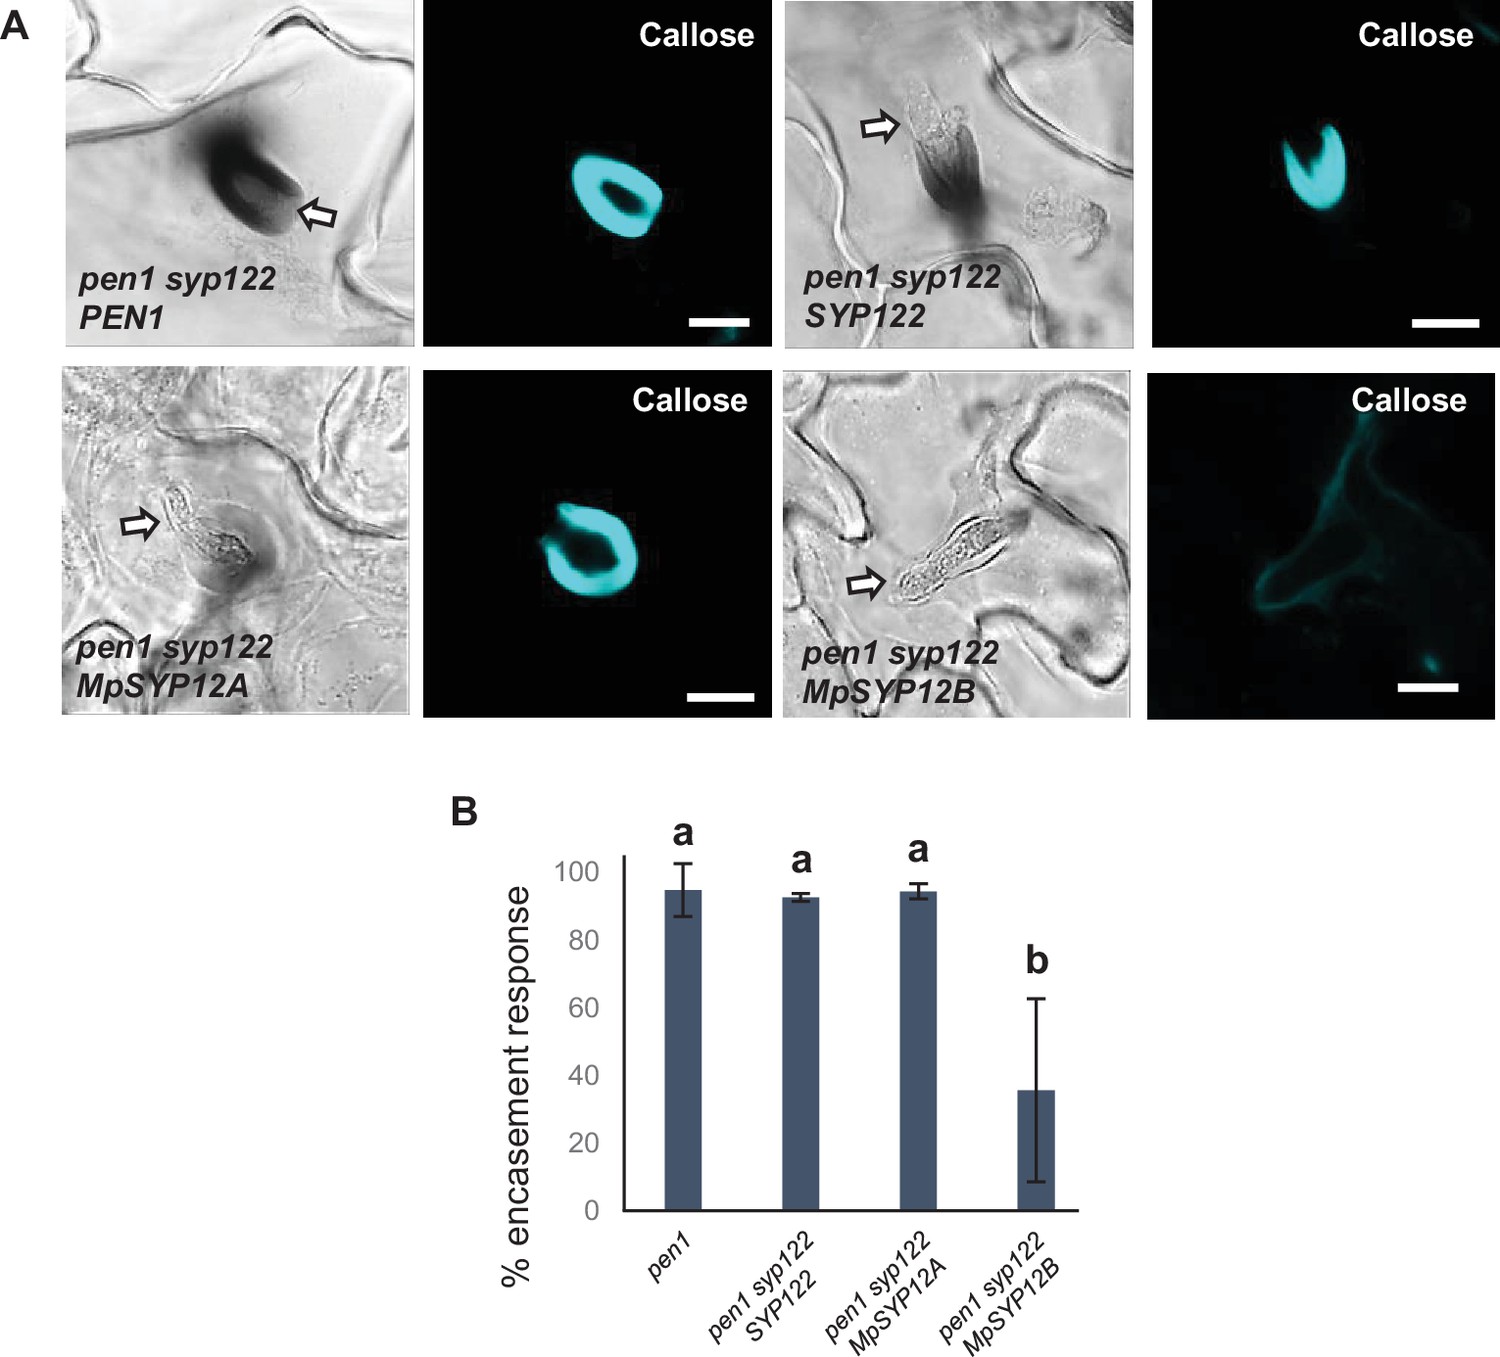
Marchantia syntaxins rescue encasement responses.
(A) Accumulation of callose in response to Bgh attack at successful penetration sites. Open arrows point to the developing intracellular pathogenic structure (IPS). Bars = 10 µm. (B) Frequency of encasements in response to Bgh haustoria in penetrated cells. All values are mean ± SD (n = 5 leaves per genotype). Different letters indicate significantly different values at p≤0.001 estimated using logistic regression.
Figure 8—figure supplement 4
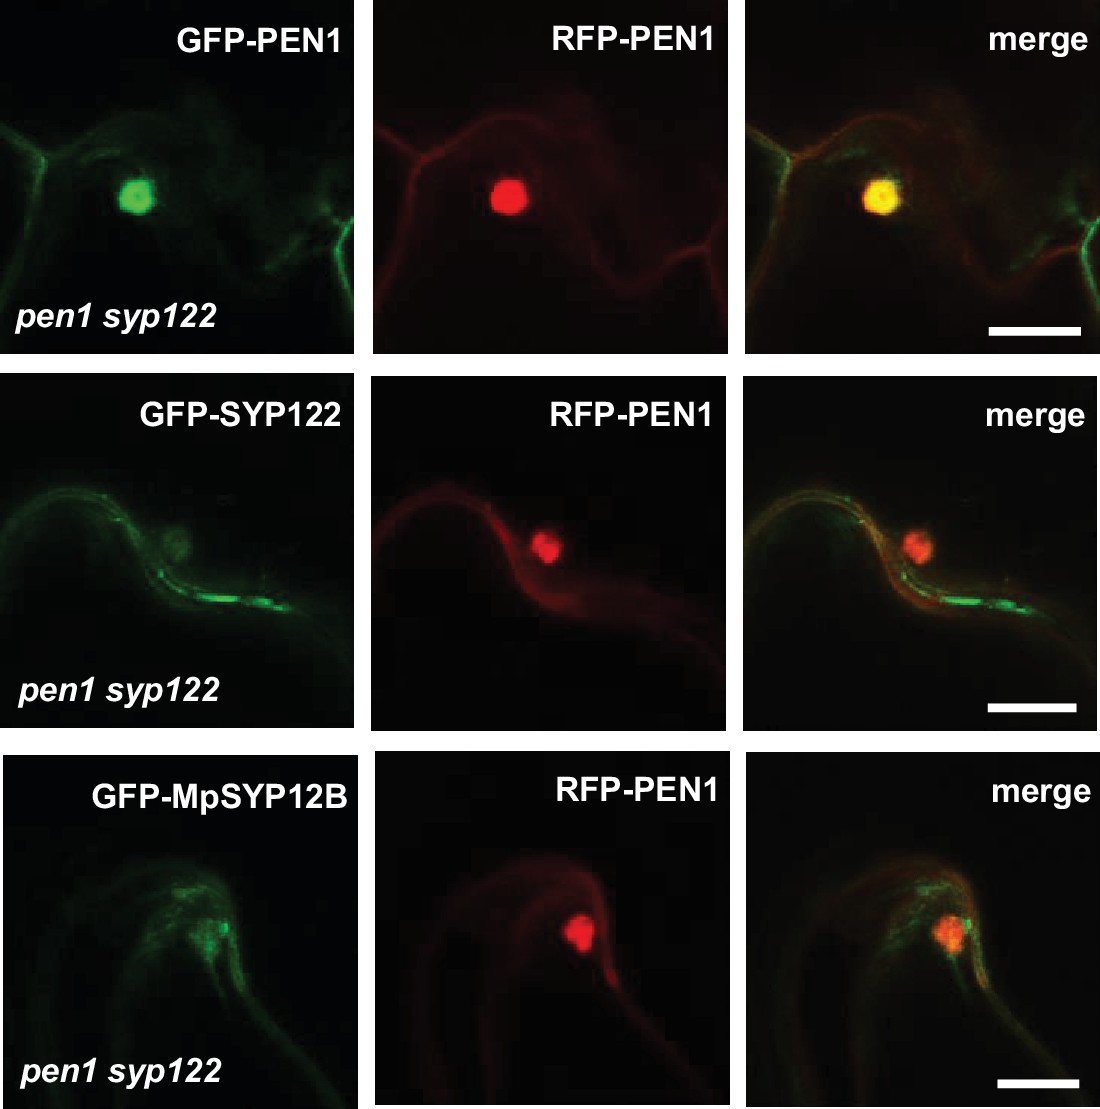
Localization of SYP12 clade members at Bgh attack sites.
Comparative papilla localization of SYP12 members from Arabidopsis or Marchantia in response to attack by Bgh in nonpenetrated cells. Bars = 10 µm.
Figure 8—figure supplement 5
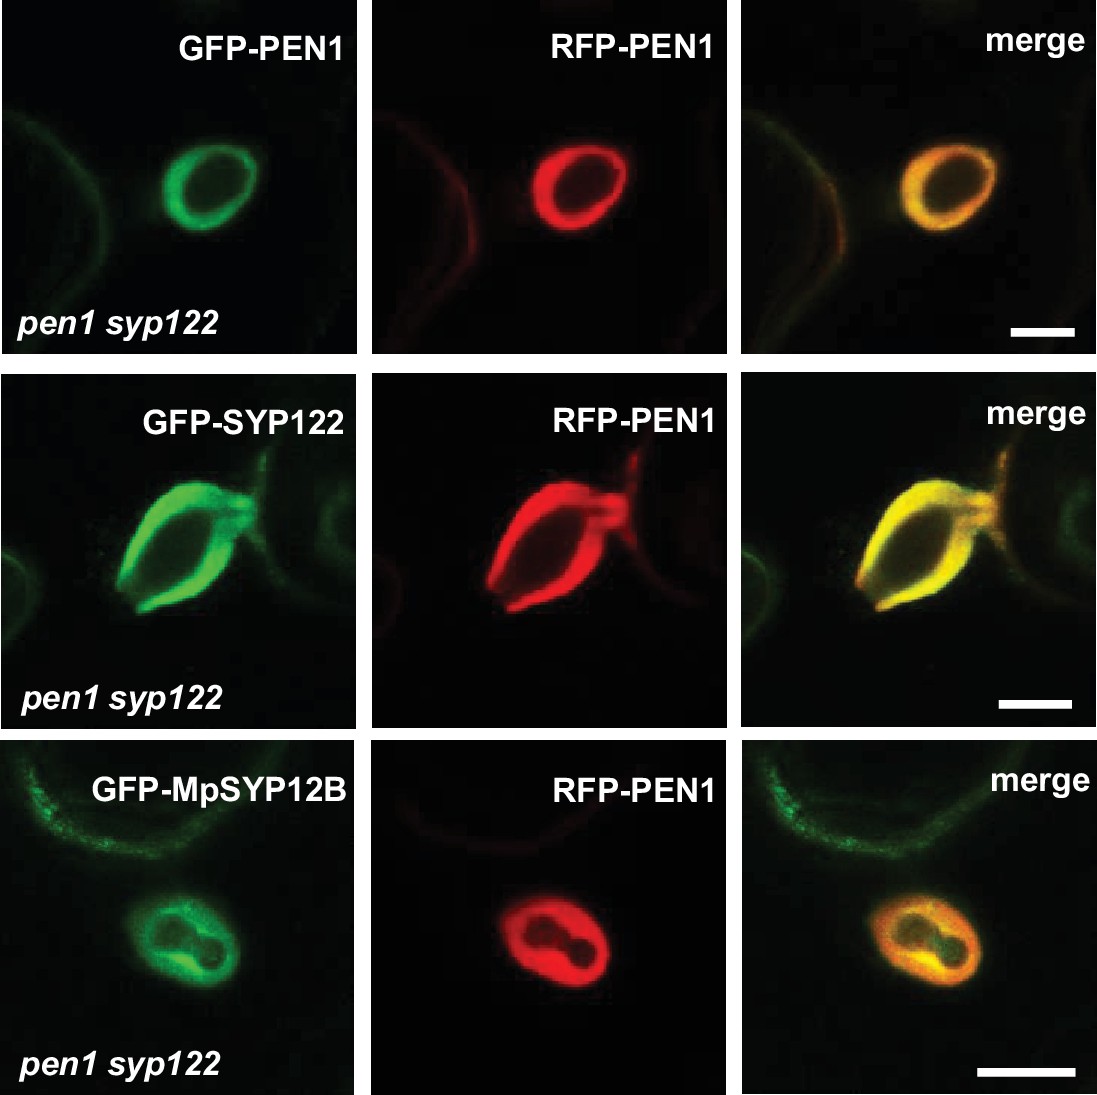
Localization of SYP12 clade members at Bgh penetration sites.
Comparative encasement localization of SYP12 members from Arabidopsis or Marchantia in response to haustoria by Bgh in penetrated cells. Bars = 10 µm.
Figure 8—figure supplement 6
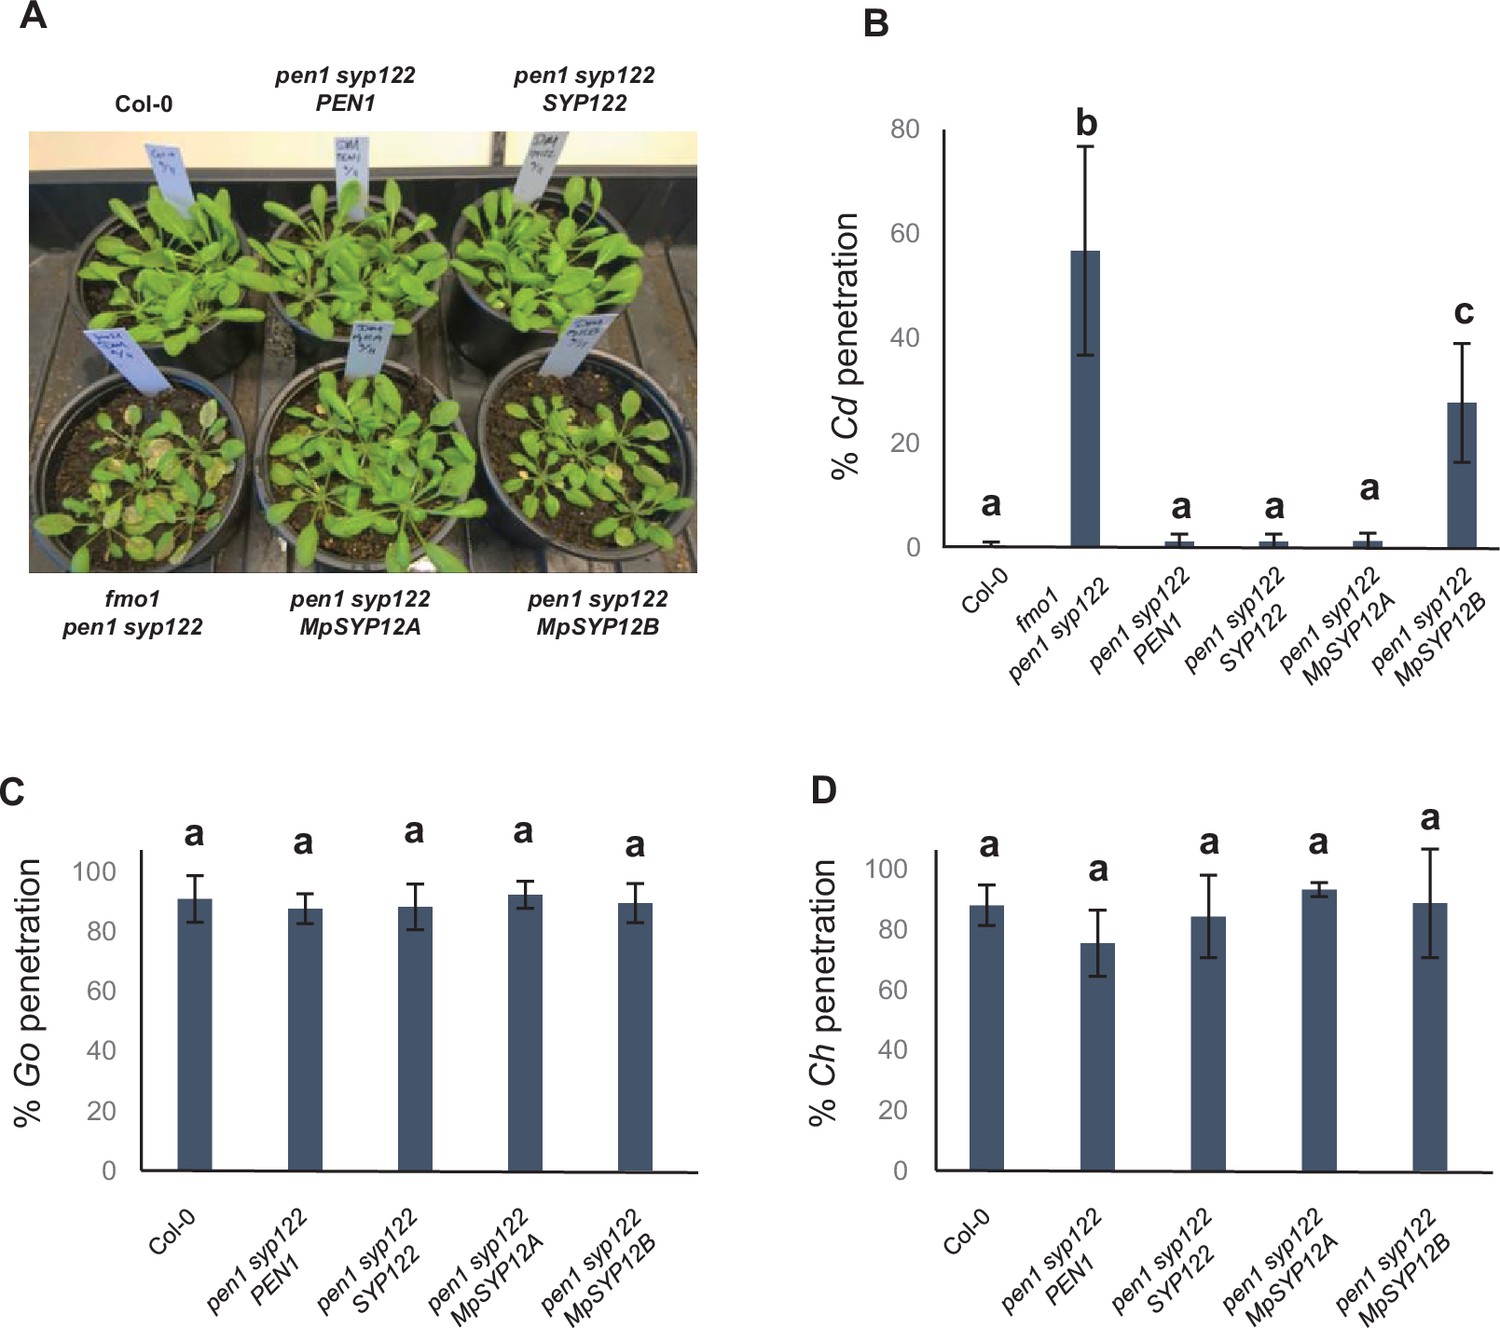
Marchantia SYP12s restore immunity in Arabidopsis toward C. destructivum.
(A) Macroscopic phenotype at 5 dai with C. destructivum. (B–D) Frequency of penetration by C. destructivum (B), G. orontii (C), and C. higginsianum (D). (B–D) All values are mean ± SD (n = 4 leaves per genotype). Different letters indicate significantly different values at p≤0.001 estimated using logistic regression.
Figure 8—figure supplement 7

Localization of Marchantia SYP12 clade members at attack sites.
(A–D) Localization of GFP-MpSYP12A (A, C) and GFP-MpSYP12A (B, D) in response to attack by P. infestans (A, B) and C. destructivum (C, D) in nonpenetrated cells. Bars = 10 µm.
Figure 9

Schematic model of immunity against filamentous pathogens mediated by PEN1 and SYP122.
In response to attack by filamentous pathogens, cargo for the papilla/encasement is received at the plasma membrane (PM) by PEN1 or SYP122 and secreted in between the plant cell wall (CW) and the PM . For pre-invasive immunity against powdery mildew fungi, PEN1 is required at the TGN to enable recycling of cargo that facilitates a fast papilla response (shown in red). The slower, general papilla/encasement response (shown in green) does not require rapid recycling at the TGN using PEN1. Instead, this response likely involves a specialization of the conventional secretory pathway or an alternative recycling pathway where either PEN1 or SYP122 are required at the PM to receive vesicular cargo for the papilla/encasement formation. Likely, the fast papilla response pathway also contributes to formation of the encasement resulting in a mixture of cargo (such as exosomes and anti microbial metabolites) transported by both pathways.
Tables
Key resources table
| Reagent type (species) or resource | Designation | Source or reference | Identifiers | Additional information |
|---|---|---|---|---|
| Gene (Arabidopsis thaliana) | pen1-1 syp122-1 | Assaad et al., 2004 | See Materials and methods | |
| Gene (A. thaliana) | fmo1-1 pen1-1 syp122-1 | Zhang et al., 2008 | See Materials and methods | |
| Gene (A. thaliana) | amsh3-4 pen1-1 syp122-1 | Schultz-Larsen et al., 2018 | See Materials and methods | |
| Gene (A. thaliana) | sid2 pad4 pen1 syp122 | Zhang et al., 2008 | See Materials and methods | |
| Gene (A. thaliana) | TET8-GFP | Boavida et al., 2013 | See Materials and methods |
Additional files
Download links
A two-part list of links to download the article, or parts of the article, in various formats.
Downloads (link to download the article as PDF)
Open citations (links to open the citations from this article in various online reference manager services)
Cite this article (links to download the citations from this article in formats compatible with various reference manager tools)
Plant SYP12 syntaxins mediate an evolutionarily conserved general immunity to filamentous pathogens
eLife 11:e73487.
https://doi.org/10.7554/eLife.73487


