Golden Syrian hamster as a model to study cardiovascular complications associated with SARS-CoV-2 infection
- Immuno-biology Lab, Infection and Immunology Centre, Translational Health Science and Technology Institute, NCR-Biotech Science Cluster, India
- Immunology Core, Translational Health Science and Technology Institute, NCR-Biotech Science Cluster, India
- Non-communicable Disease Centre, Translational Health Science and Technology Institute, NCR-Biotech Science Cluster, India
- Infection and Immunology Centre, Translational Health Science and Technology Institute, NCR-Biotech Science Cluster, India
Figures
Figure 1 with 1 supplement
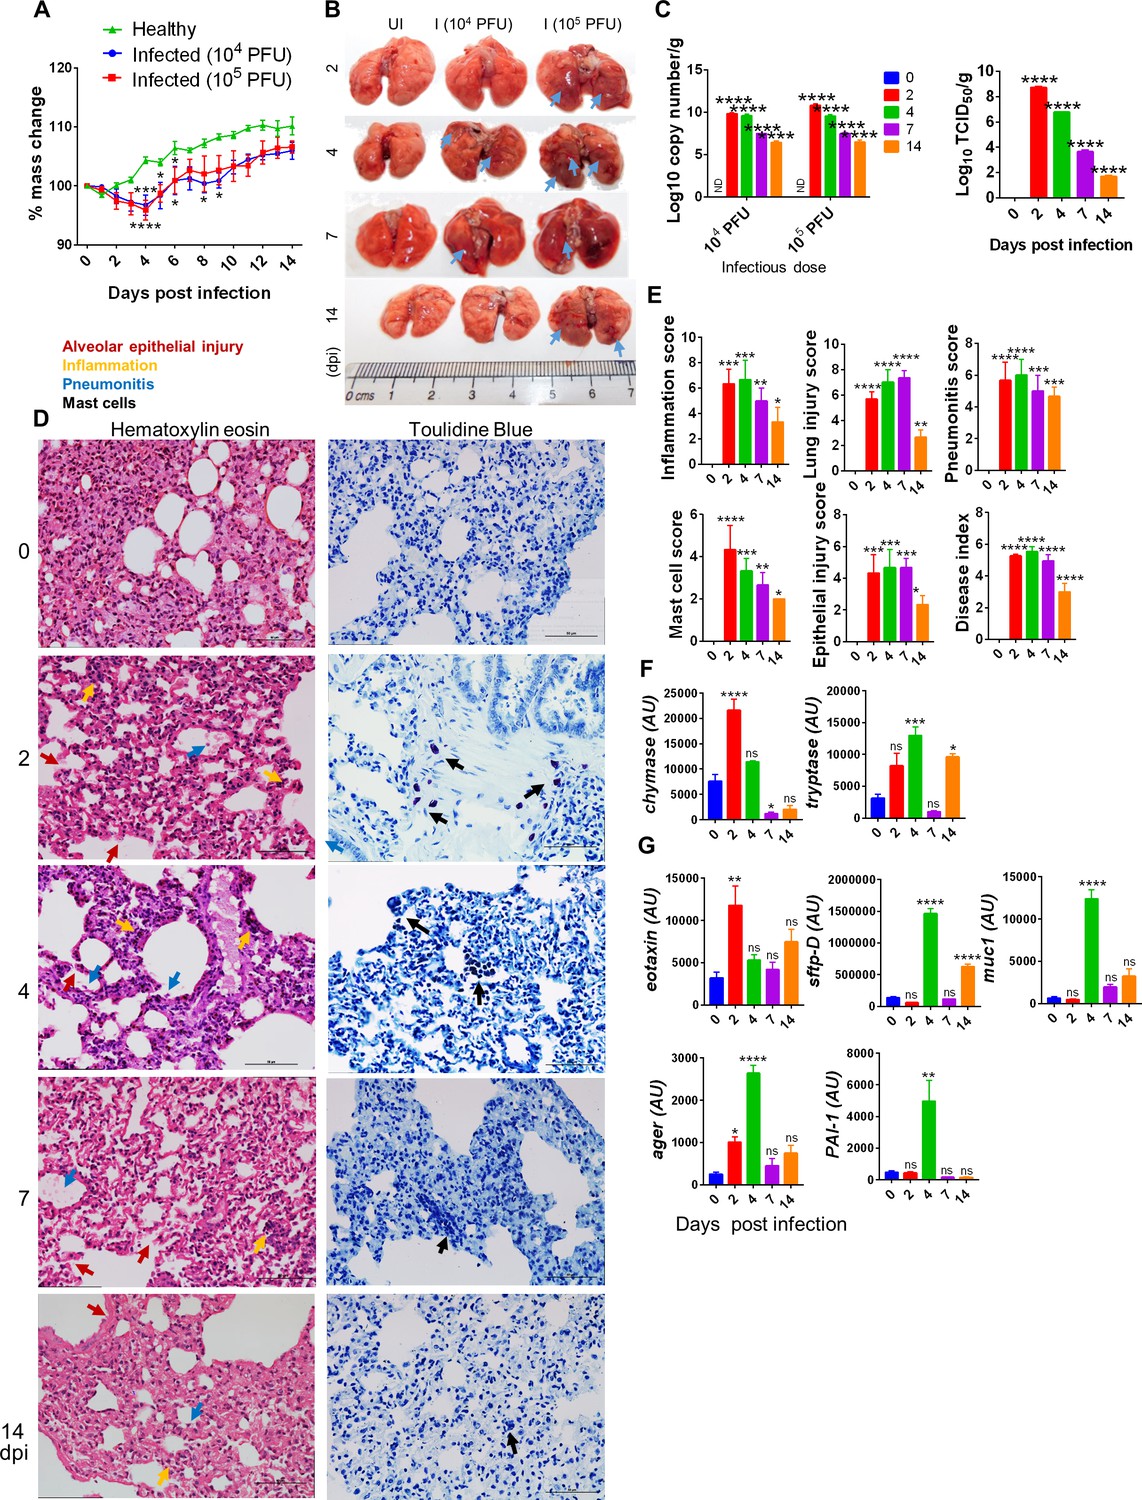
Pulmonary pathologies of severe acute respiratory syndrome coronavirus-2 (SARS-CoV-2)-infected hamsters.
Hamsters infected with 104 or 105 plaque-forming unit (PFU) SARS-CoV-2 and the course of infection were followed for 14 days with the evaluation of clinical and pathological features of SARS-CoV-2 infection. (A) % body mass change. (B) Gross morphology of lungs showing pneumonitis regions and inflammation. (C) Lung viral load expressed as log10 copy number/g or log10 TCID50/g. (D) Microscopic images of hematoxylin and eosin (HE)- and toluidine blue (TB)-stained lungs. (E) Blinded histological scores for pathological parameters on the scale of 0–5, where 0 indicates very low or no pathology while 5 indicates highest pathological change. Mast cells in TB-stained sections appear as dark blue-stained cells. (F, G) Lung qPCR showing mean relative mRNA expression with standard error of the mean (SEM). Alveolar epithelial injury (red arrow), inflammation (blue arrow), pneumonitis (yellow arrow), and mast cells (black arrow). *p<0.05, **p<0.01, ***p<0.001, ****p<0.0001 (one-way ANOVA, nonparametric Kruskal–Wallis test for multiple comparison).
Figure 1—figure supplement 1

Computational analysis deciphering the structural and interaction level insights of key host proteins, angiotensin-converting enzyme 2 (ACE2) (A–E) and neuropilin-1 (NRP-1) (F, G) involved in severe acute respiratory syndrome coronavirus-2 (SARS-CoV-2) infection.
(A) The sequence alignment of human (hu) and hamster (ha) ACE2 sequences. Along with secondary structure, the residual variations are highlighted in yellow arrows indicating the differences among sequences. (B) Crystal structure of human ACE2. The huACE2 (in blue), modeled haACE2 (in ice blue), and receptor-binding domain (RBD) is in red. The surface view of hu/ha ACE2 with RBD. (C) The residue-level interaction map, ACE2, is rendered in cartoon and colored for hu (blue) and ha (ice blue). The amino acid residues are colored as per atom type such as O, red; N, blue; C, cyan/yellow/white. (D) The molecular docking data of ACE2 and RBD interaction (in histogram). (E) The interaction energies calculated at hu/ha interfaces. The interacting residues are aromatic, purple; polar, green; acidic, red; and aliphatic, gray. The types of interaction below <−3.0 Å distance are shown by blue lines, and hydrophobic interactions are in orange dotted lines. The bar graphs are the residue-wise interaction energies (in kcal/mol) for both RBD and ACE2. The key residues (<−2.0 kcal/mol) are highlighted via green dotted lines. (F) The overlay of hu/ha NRP-1 along with CendR peptide, rendered in cartoon. The zoom-out view of interacting interfaces of hu/ha NRP-1 loop residues and CendR peptide residues. Peptide residues are rendered in licorice and color-coded atom-wise. The hydrogen bond-forming residues are shown by yellow lines. (G) Bar graph showing the residue-wise interaction energy. (H, I) The binding groove of NRP-1 showing how nicely CendR peptides fit in hu/ha. (J) Image of toluidine blue-stained experimental control lung section.
Figure 2 with 1 supplement
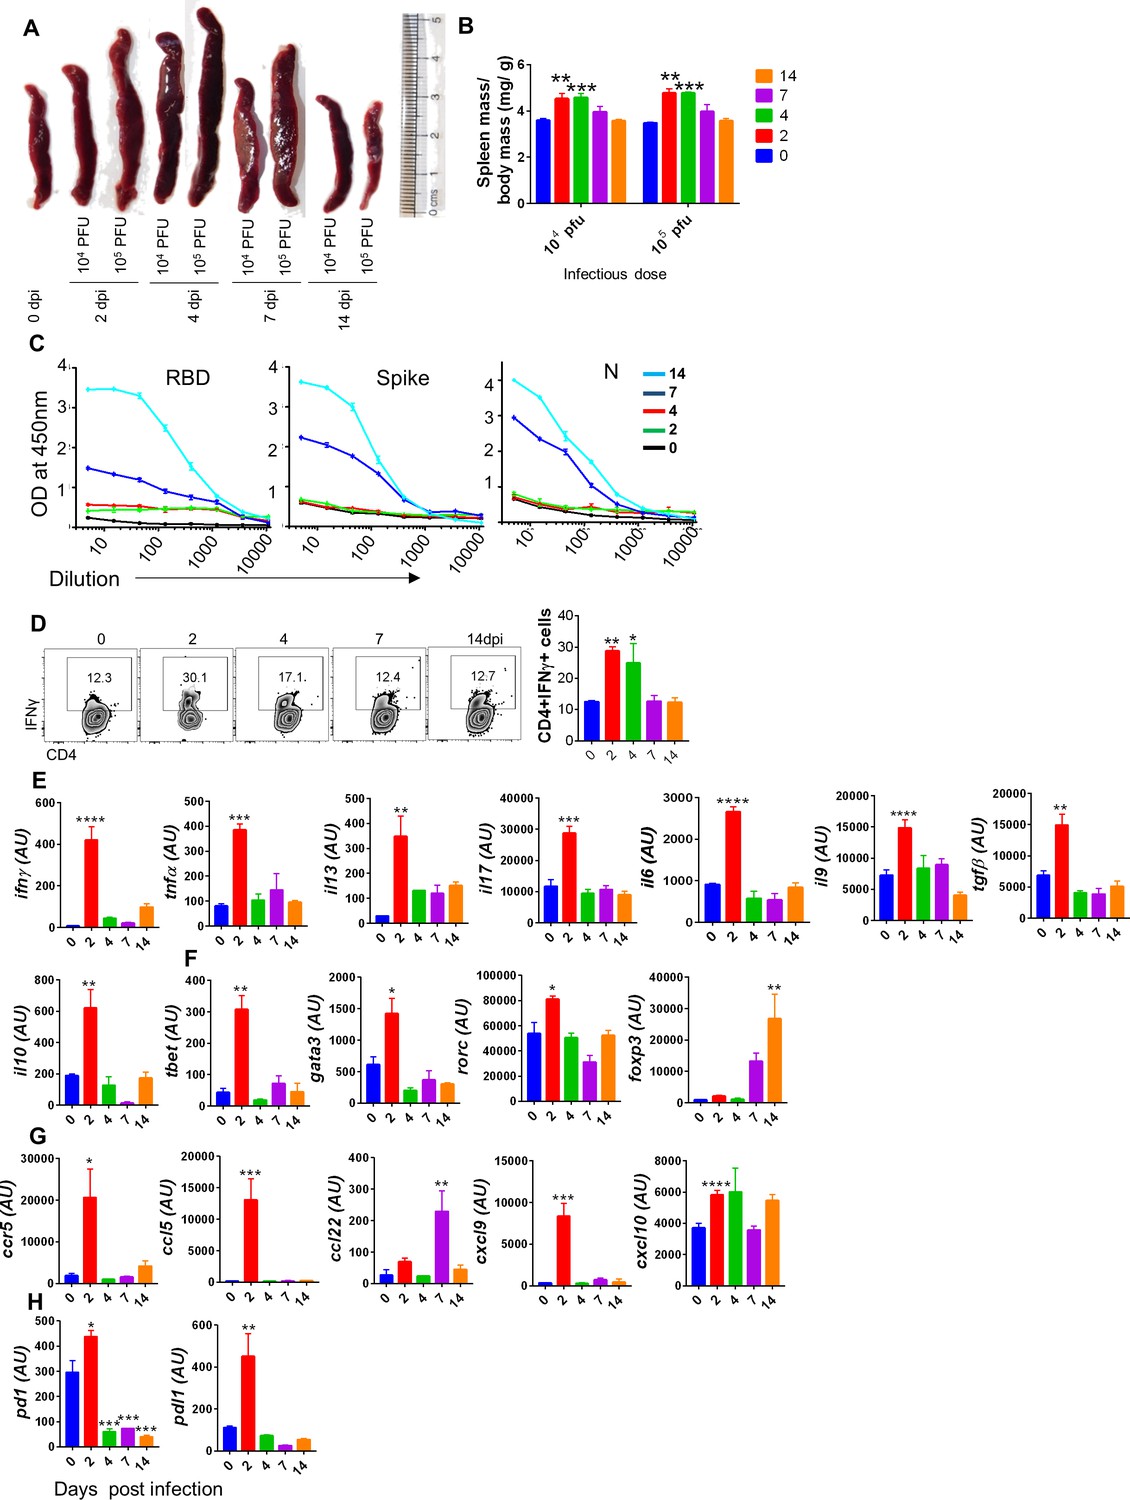
Immunological response against severe acute respiratory syndrome coronavirus-2 (SARS-CoV-2) infection in hamsters.
Immunological responses of SARS-CoV-2-challenged hamsters were evaluated from serum or spleen samples. (A) Changes in spleen length of SARS-CoV-2-infected animals at different days post infection (dpi) as compared to uninfected animals. (B) Spleen mass to body mass ratio for excised spleen at different time points. (C) Serum IgG titer against SARS-CoV-2 viral proteins. (D) FACS for IFNγ secretion showing representative dot plots with % age frequency values and a bar graph showing mean ± SEM. Relative mRNA expression of (E) cytokines, (F) transcription factors, (G) chemokines, and (H) checkpoint inhibitors in the spleen of infected vs. uninfected hamsters. *p<0.05, **p<0.01, ***p<0.001, ****p<0.0001 (one-way ANOVA, nonparametric Kruskal–Wallis test for multiple comparison).
Figure 2—figure supplement 1

Immunopathological changes associated with severe acute respiratory syndrome coronavirus-2 (SARS-CoV-2) infection in hamsters.
(A) IgG titer for day 14 post-infection serum samples for different doses of infection. (B) FACS dot plot and bar graph showing mean ± SEM % frequency of CD4+ cells (one-way ANOVA, nonparametric Kruskal–Wallis test for multiple comparison).
Figure 3 with 1 supplement
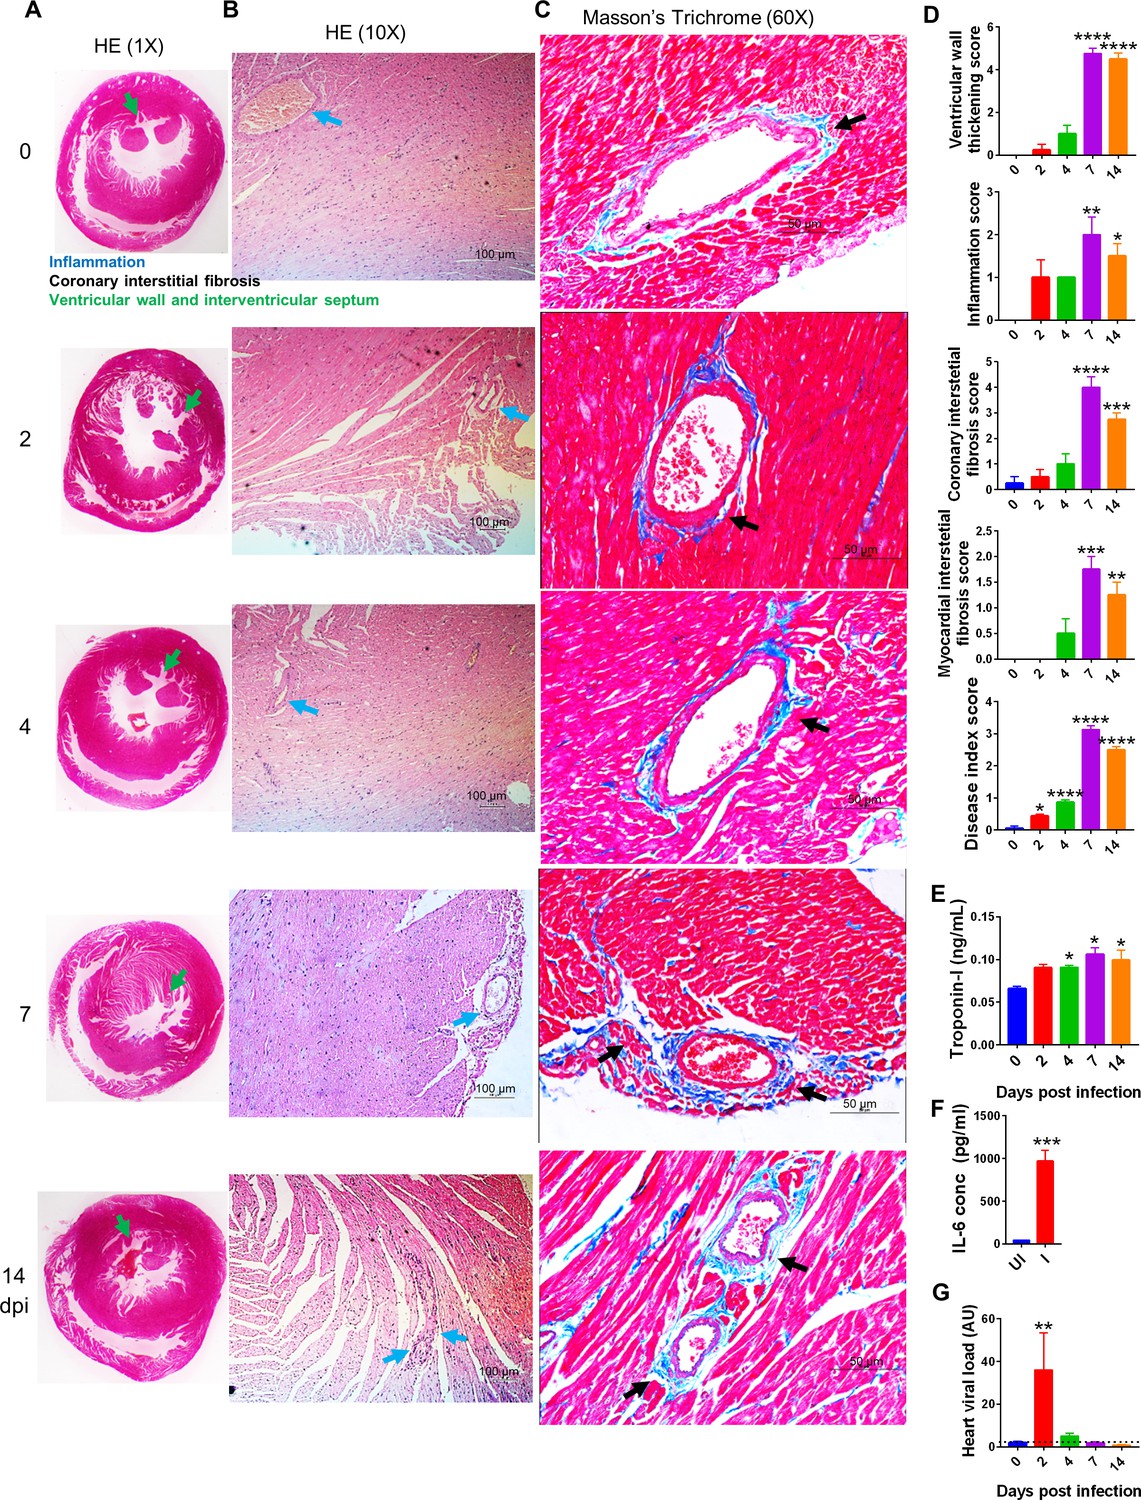
Cardiovascular complication (CVC) in hamsters challenged with severe acute respiratory syndrome coronavirus-2 (SARS-CoV-2).
Histopathological changes in infected hamsters along with serum markers for CVC were evaluated. (A, B) Images of hematoxylin and eosin (HE)-stained heart captured at 1× and 10× showing ventricular walls and interstitial septum (green arrow) and inflammation around coronary artery (blue arrow). (C) Heart Masson’s trichrome (MT) stains showing interstitial coronary fibrosis (black arrow). (D) Blinded histological scores for ventricular wall thickening, inflammation, coronary interstitial fibrosis, myocardial interstitial fibrosis, and disease index score were performed by a trained pathologist on the scale of 0–5, where 0 indicates very low or no pathology while 5 indicates highest pathological change. (E) Serum cardiac troponin I levels and (F) serum IL6 levels from Uninfected (UI) and Infected (I) samples as measured by sandwich ELISA (t-test, nonparametric Mann–Whitney test). (G) Relative heart viral load in heart homogenate. *p<0.05, **p<0.01, ***p<0.001, ****p<0.0001 (one-way ANOVA, nonparametric Kruskal–Wallis test for multiple comparison).
Figure 3—figure supplement 1
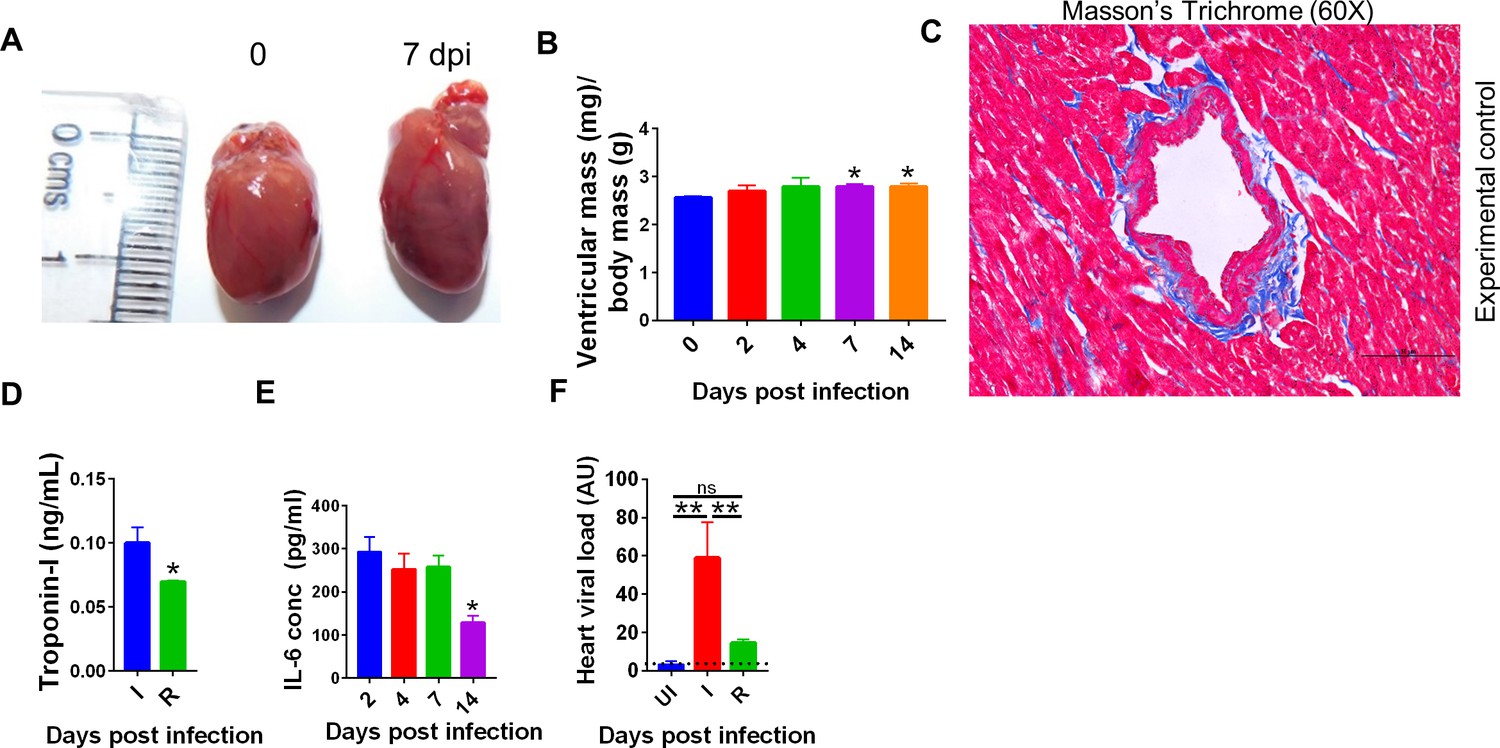
Pathological changes in hearts of severe acute respiratory syndrome coronavirus-2 (SARS-CoV-2)-infected hamsters.
(A) Heart ventricular hypertrophy on 7 days post infection (dpi). (B) Ventricular mass by body mass ratio. (C) Masson’s trichrome (MT)-stained heart image from the experimental control sample. (D) Serum cardiac troponin I (cTnI) levels in the presence or absence of remdesivir-administered hamsters serum samples (t-test, nonparametric Mann–Whitney test). (E) IL-6 conc. in the serum of infected hamsters as detected by ELISA (F) Relative heart viral load in the presence or absence of remdesivir control. *p<0.05, **p<0.01 (one-way ANOVA, nonparametric Kruskal–Wallis test for multiple comparison).
Figure 4
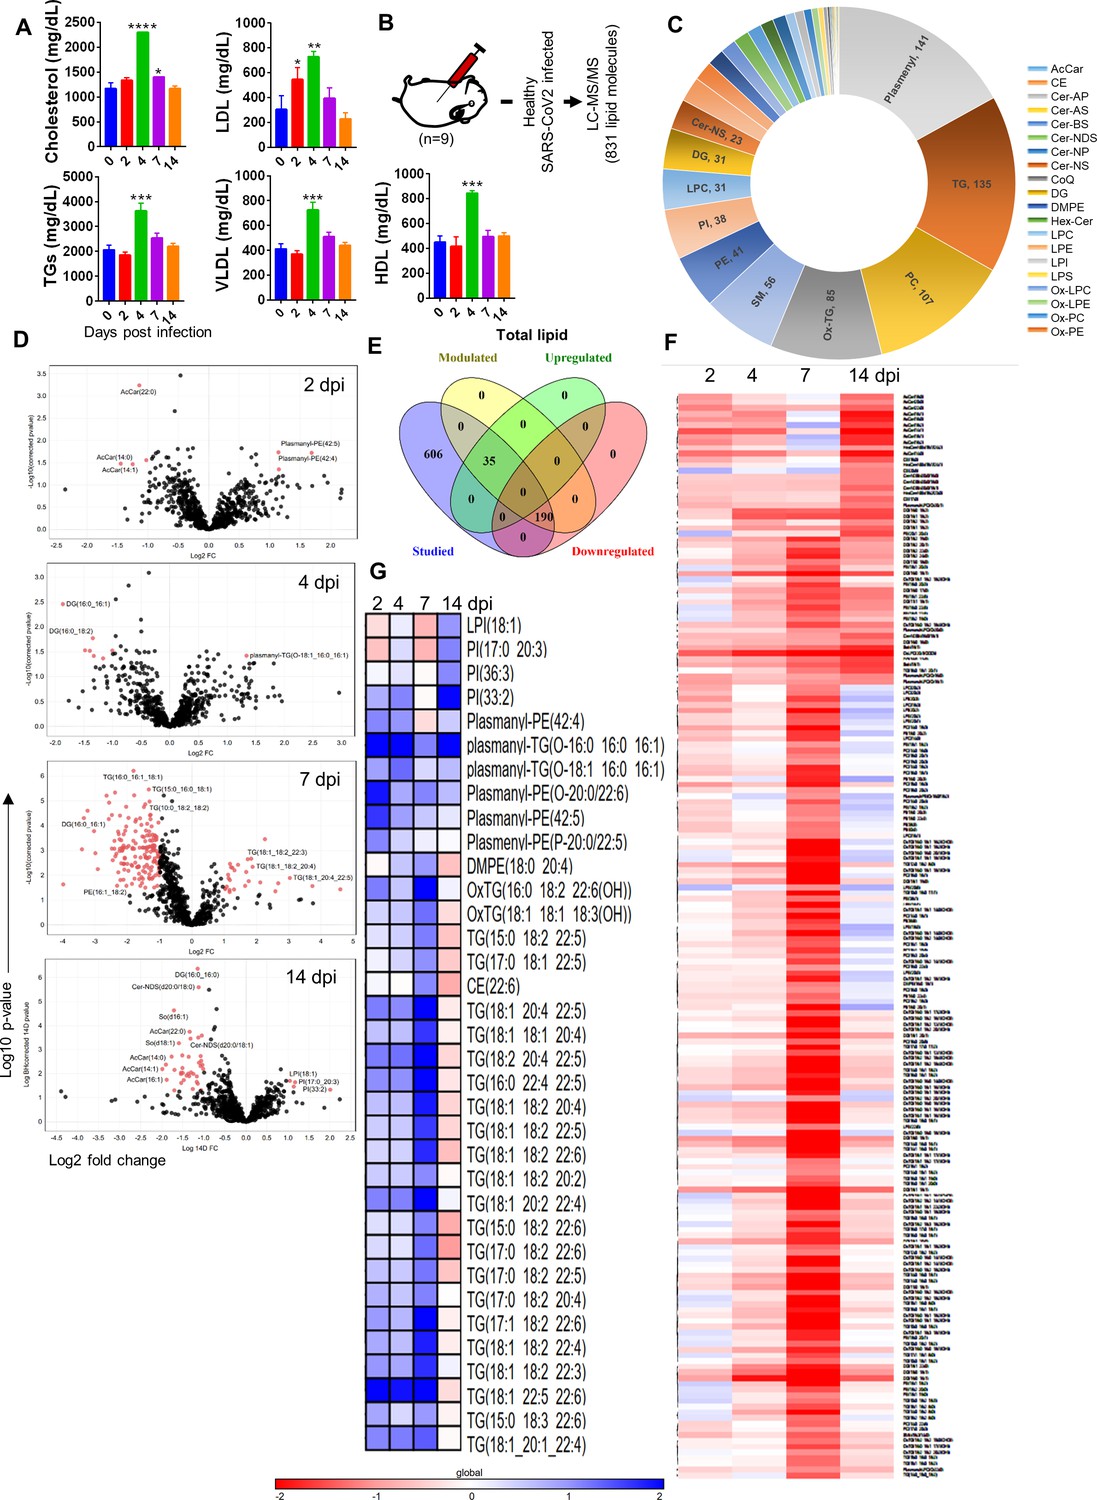
Serum lipid profile of severe acute respiratory syndrome coronavirus-2 (SARS-CoV-2)-infected hamsters.
Lipid profiles from the serum samples of infected and uninfected hamsters were evaluated by biochemical and liquid chromatography-tandem mass spectrometry (LC/MS-MS) profiling. (A) Serum lipid profile measured by biochemical assay. (B) Schematic representation of lipidomics analysis from hamster serum samples. (C) Classification of detected lipid in this study. (D) Volcano plot showing log2 fold change (x-axis) against -log10 p-value (after false discovery rate [FDR] correction, Benjamini–Hochberg method) for 2, 4, 7, and 14 days post infection (dpi) vs. healthy control with significantly modulated lipids shown as red dots. (E) Venn diagram for differentially regulated lipids. (F, G) Heatmap showing log2 fold change of significantly modulated lipids at 2, 4, 7, and 14 dpi upregulated (F) or downregulated (G). *p<0.05, **p<0.01, ***p<0.001, ****p<0.0001 (one-way ANOVA, nonparametric Kruskal–Wallis test for multiple comparison). Panels (F) and (G) contain all lipids present significantly modulated in at least one or more time points.
Figure 5
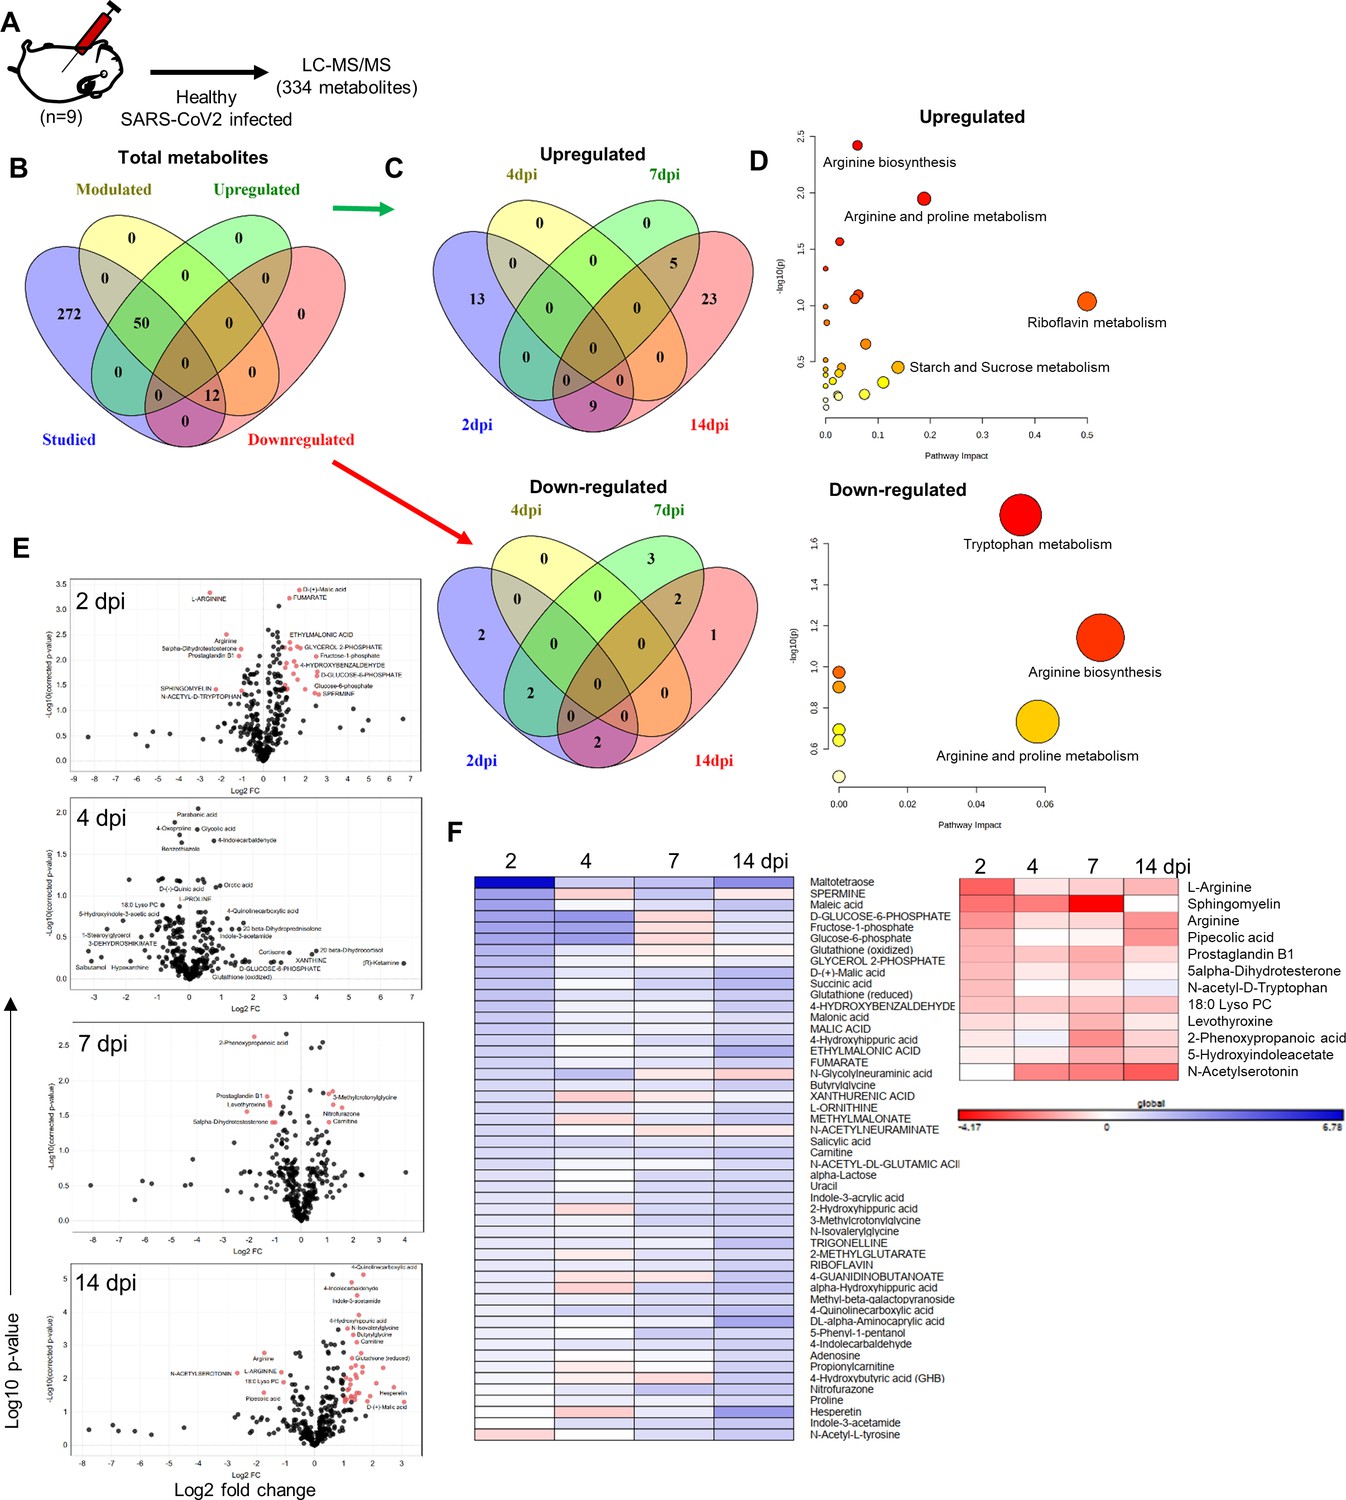
Serum metabolomics profile of severe acute respiratory syndrome coronavirus-2 (SARS-CoV-2)-infected hamsters.
(A) Schematic representation of metabolomics analysis from the serum samples of infected and uninfected hamsters. (B) Venn diagrams for differentially regulated metabolites identified in this study classified as (C) upregulated and downregulated metabolites. (D) Metabolic pathways perturbed by changes in metabolomics profile. (E) Volcano plot showing log2 fold change (x-axis) against -log10 p-value (after false discovery rate [FDR] correction, Benjamini–Hochberg method) for 2, 4, 7, and 14 days post infection (dpi) vs. healthy control with significantly modulated metabolites shown as red dots. (F) Heatmap for log2 fold changes of significantly modulated serum metabolites at 2, 4, 7, and 14 dpi upregulated (left) or downregulated (right). Panel (F) contains all metabolites present significantly modulated in at least one or more time points.
Figure 6
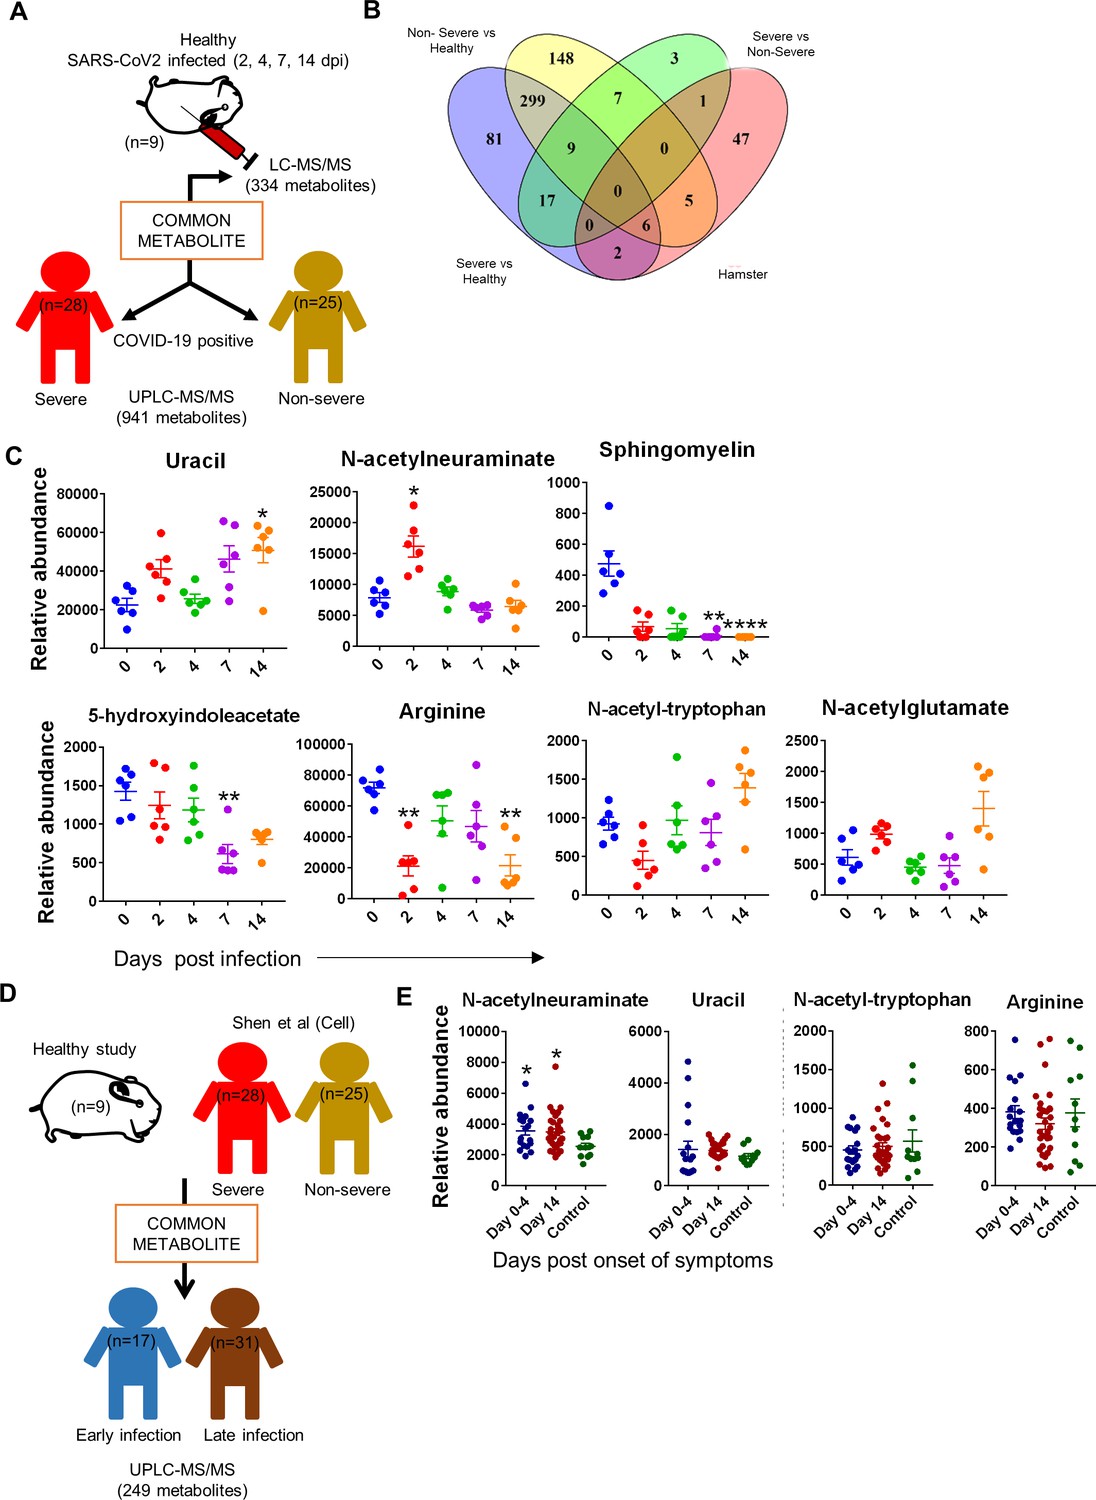
Identification of serum metabolic biomarker for severe acute respiratory syndrome coronavirus-2 (SARS-CoV-2)-infected hamsters.
Serum metabolomics profile obtained from hamster study was then used to overlay with previously published and in-house-generated metabolomics profile database to identify serum metabolomics biomarker associated with infected hamsters. (A) Schematic representation of analysis methodology for comparative analysis between hamster and Shen et al., 2020 database. (B) Venn diagram for correlation with Shen et al., 2020 showing metabolites common between severe, nonsevere, and hamster study. (C) Relative abundance dot plot for metabolites common between severe, nonsevere, and hamster study. (D) Schematic representation of analysis methodology for comparative analysis between hamster, severe, nonsevere, early, and late phase infection metabolomics profile. (E) Dot plot for the relative abundance of metabolites common between hamster and human metabolomics profiles. *p<0.05, **p<0.01 (one-way ANOVA, nonparametric Kruskal–Wallis test for multiple comparison).
Figure 7
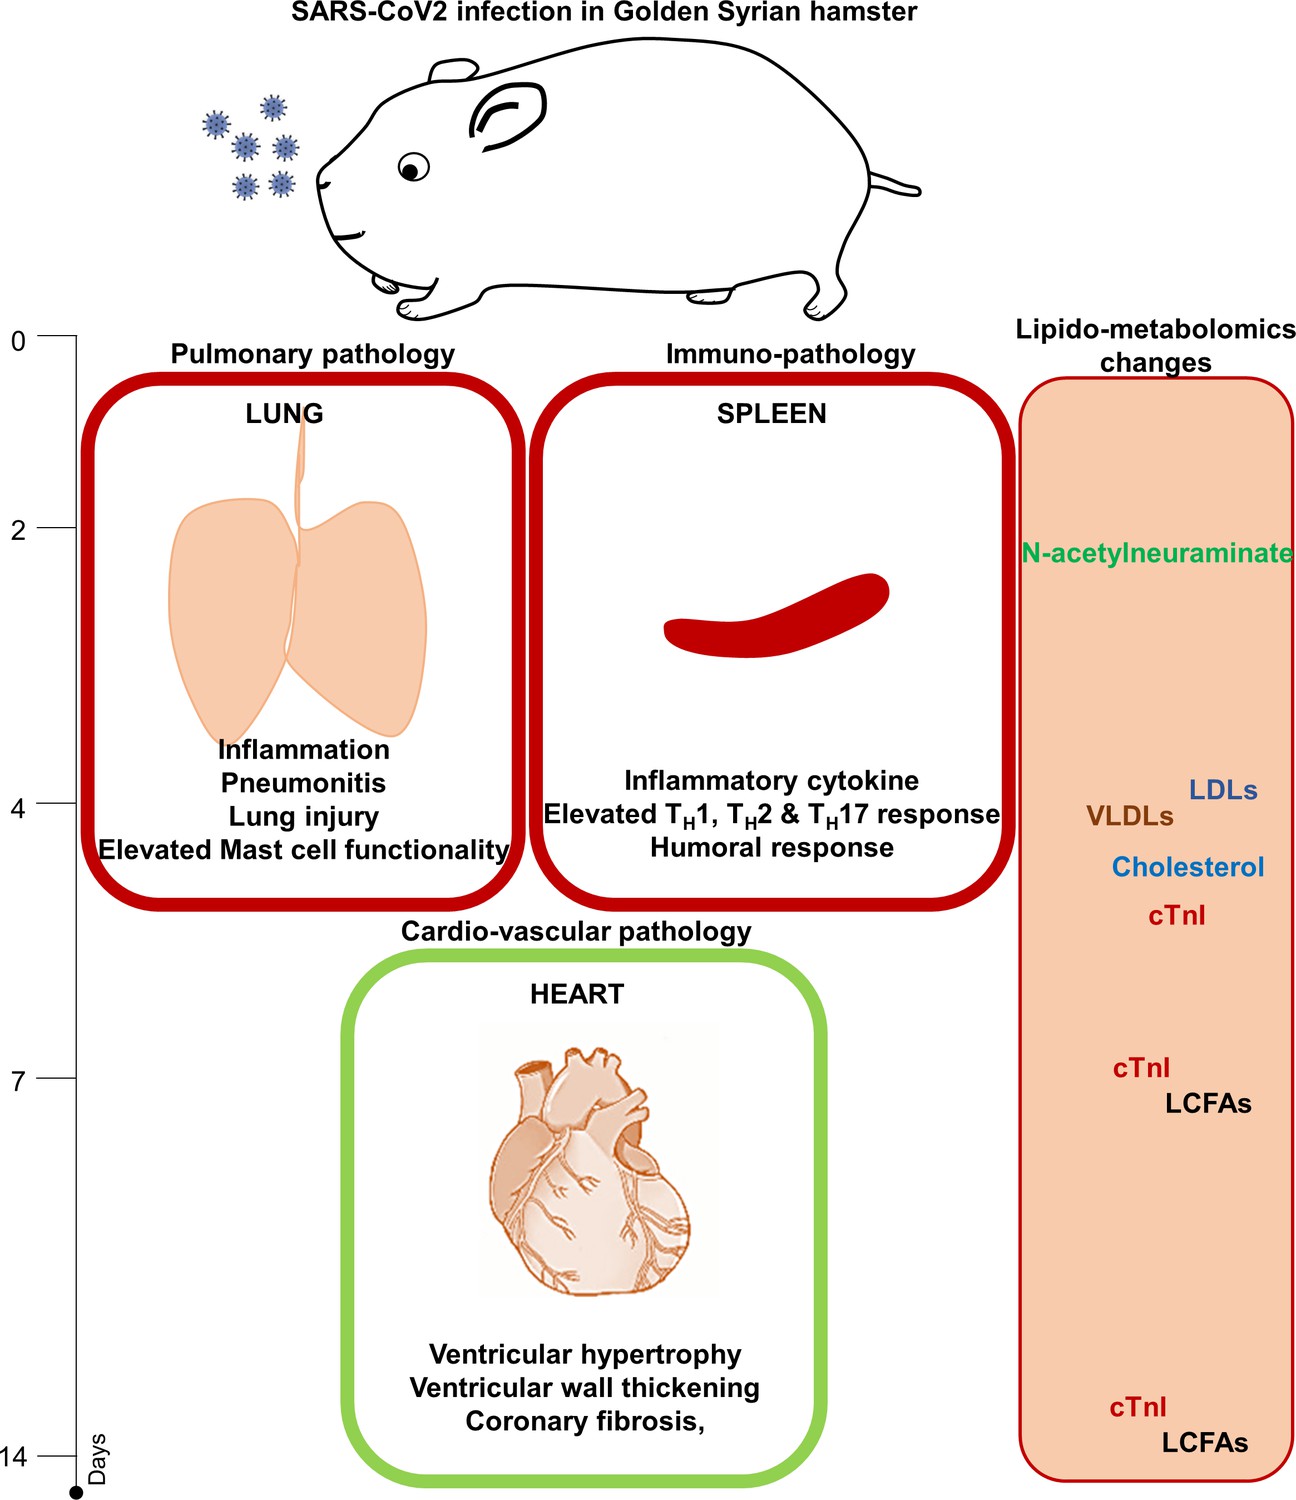
Summary Figure showing the study outline and important findings of the study.
Additional files
Download links
A two-part list of links to download the article, or parts of the article, in various formats.
Downloads (link to download the article as PDF)
Open citations (links to open the citations from this article in various online reference manager services)
Cite this article (links to download the citations from this article in formats compatible with various reference manager tools)
Golden Syrian hamster as a model to study cardiovascular complications associated with SARS-CoV-2 infection
eLife 11:e73522.
https://doi.org/10.7554/eLife.73522


