The MIDAS domain of AAA mechanoenzyme Mdn1 forms catch bonds with two different substrates
- Laboratory of Chemistry and Cell Biology, The Rockefeller University, United States
- Laboratory of Mass Spectrometry and Gaseous Ion Chemistry, The Rockefeller University, United States
- Laboratory of Nanoscale Biophysics and Biochemistry, The Rockefeller University, United States
Figures
Figure 1 with 2 supplements
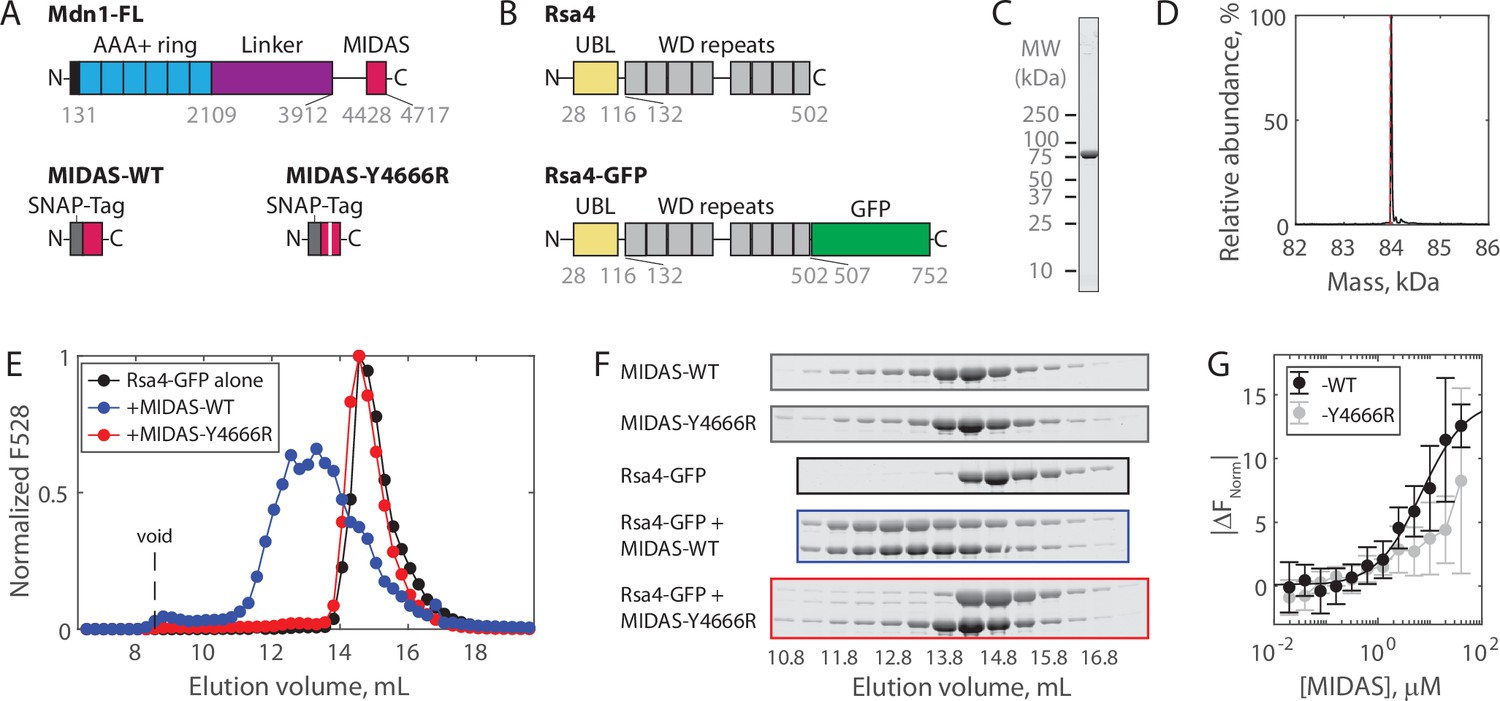
Solution measurements of MIDAS-Rsa4 interaction.
(A) Domain diagrams (drawn to scale) of full-length Mdn1 (top), and the SNAP-tagged MIDAS constructs (bottom). (B) Domain diagrams (drawn to scale) highlighting the position of the ubiquitin-like (UBL) and WD repeat domains within the assembly factor Rsa4, as well as the added green fluorescent protein (GFP) tag. (C) SDS-PAGE gel (Coomassie staining) of final purified Rsa4-GFP. (D) Native mass spectrometry analysis of Rsa4-GFP. Expected mass (with loss of N-terminal methionine) 83.962 kDa (red dotted line), measured mass 83.981 ± 0.001 kDa (mean ± standard deviation, SD). Full spectrum in Figure 1—figure supplement 1. (E) Elution profile (monitored by GFP fluorescence) of Rsa4-GFP (40 μM prior to injection) either alone or pre-mixed with MIDAS-WT or MIDAS-Y4666R (no GFP label; 60 μM) on a Superdex 200 Increase size exclusion column. (F) SDS-PAGE gels (Coomassie staining) corresponding to the elution profiles shown in panel E. See also Figure 1—figure supplement 2. (G) Microscale thermophoresis data showing the binding of MIDAS protein to Rsa4-GFP (50 nM). All data shown as mean ± SD for n = 4 independent experiments including at least two separate preparations of each protein used. The MIDAS-WT data were fitted to a binding isotherm (black curve). MIDAS-Y4666R data connected by lines to guide the eye.
-
Figure 1—source data 1
Source data for size exclusion chromatography, microscale thermophoresis (MST), and mass photometry assays shown in Figure 1 and its supplements.
- https://cdn.elifesciences.org/articles/73534/elife-73534-fig1-data1-v1.xlsx
-
Figure 1—source data 2
All raw TIFF files for SDS-PAGE gels corresponding to size exclusion chromatography coelution assays.
- https://cdn.elifesciences.org/articles/73534/elife-73534-fig1-data2-v1.zip
Figure 1—figure supplement 1

Preparation of recombinant Rsa4-GFP.
(A) SDS-PAGE gel (Coomassie staining) of final purified Rsa4-GFP. (B) Raw and deconvolved native mass spectrometry spectra for Rsa4-GFP. (C) Mass photometry measurements of Rsa4-GFP (1510 measured molecules). Measured mass shown inset at mean ± SD of fitted Gaussian (black line).
Figure 1—figure supplement 2
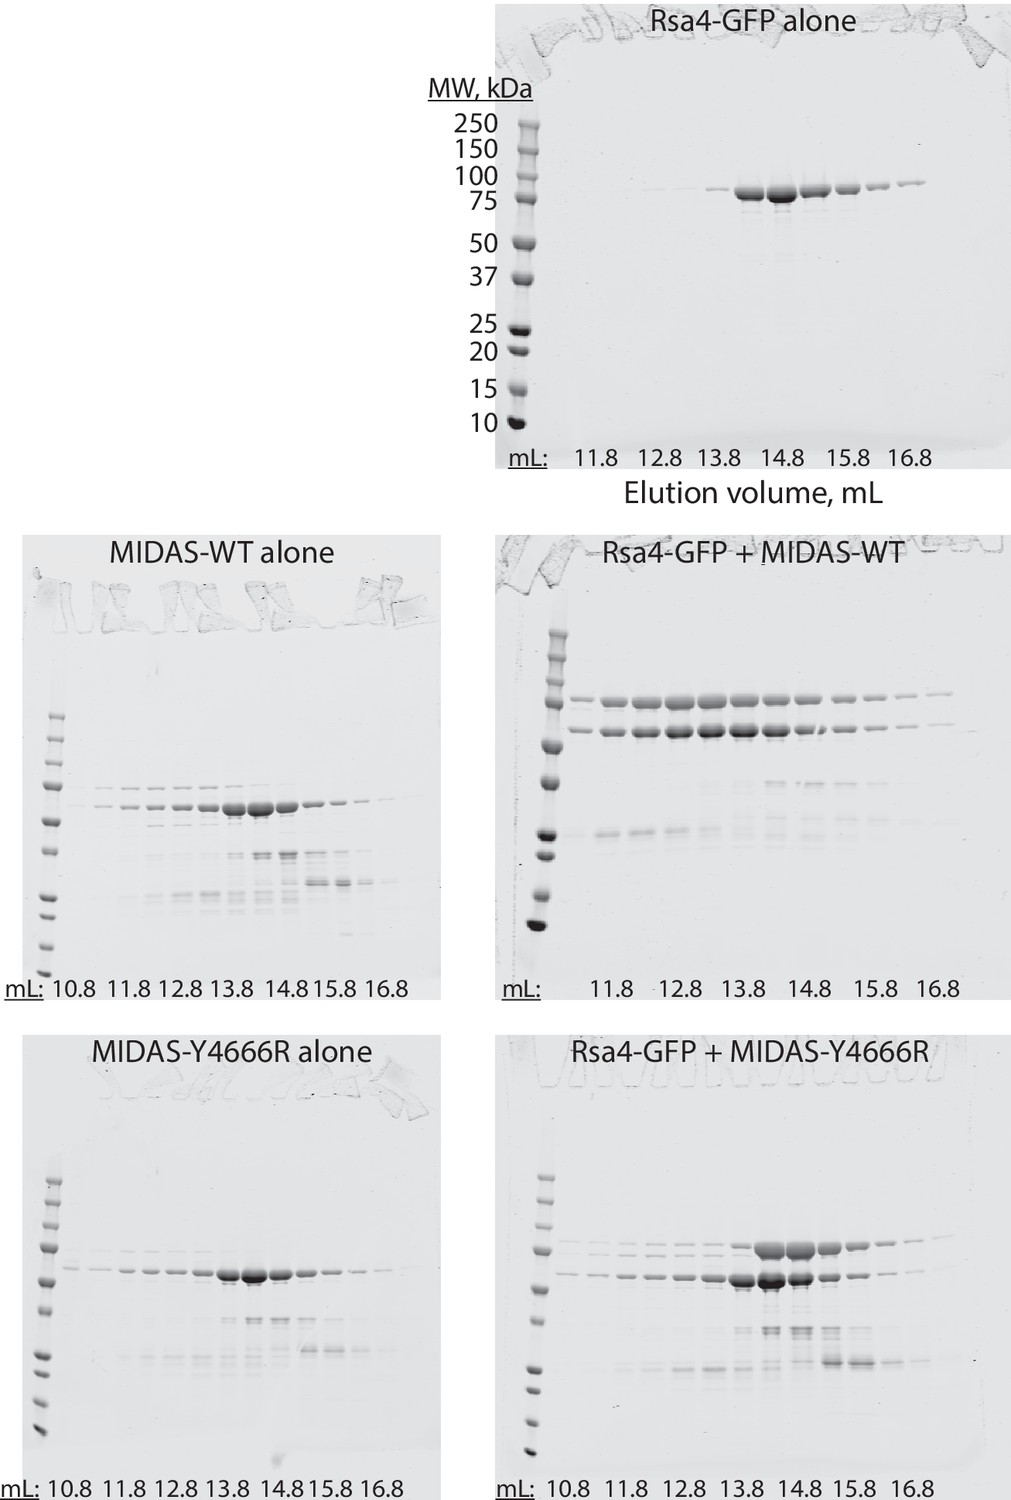
Full gels for Rsa4-GFP size exclusion chromatography experiments.
Uncropped SDS-PAGE gels (Coomassie staining) showing size exclusion chromatography results for the listed proteins. The same molecular weight ladder was used for all gels. Corresponds to Figure 1E–F.
Figure 2 with 1 supplement
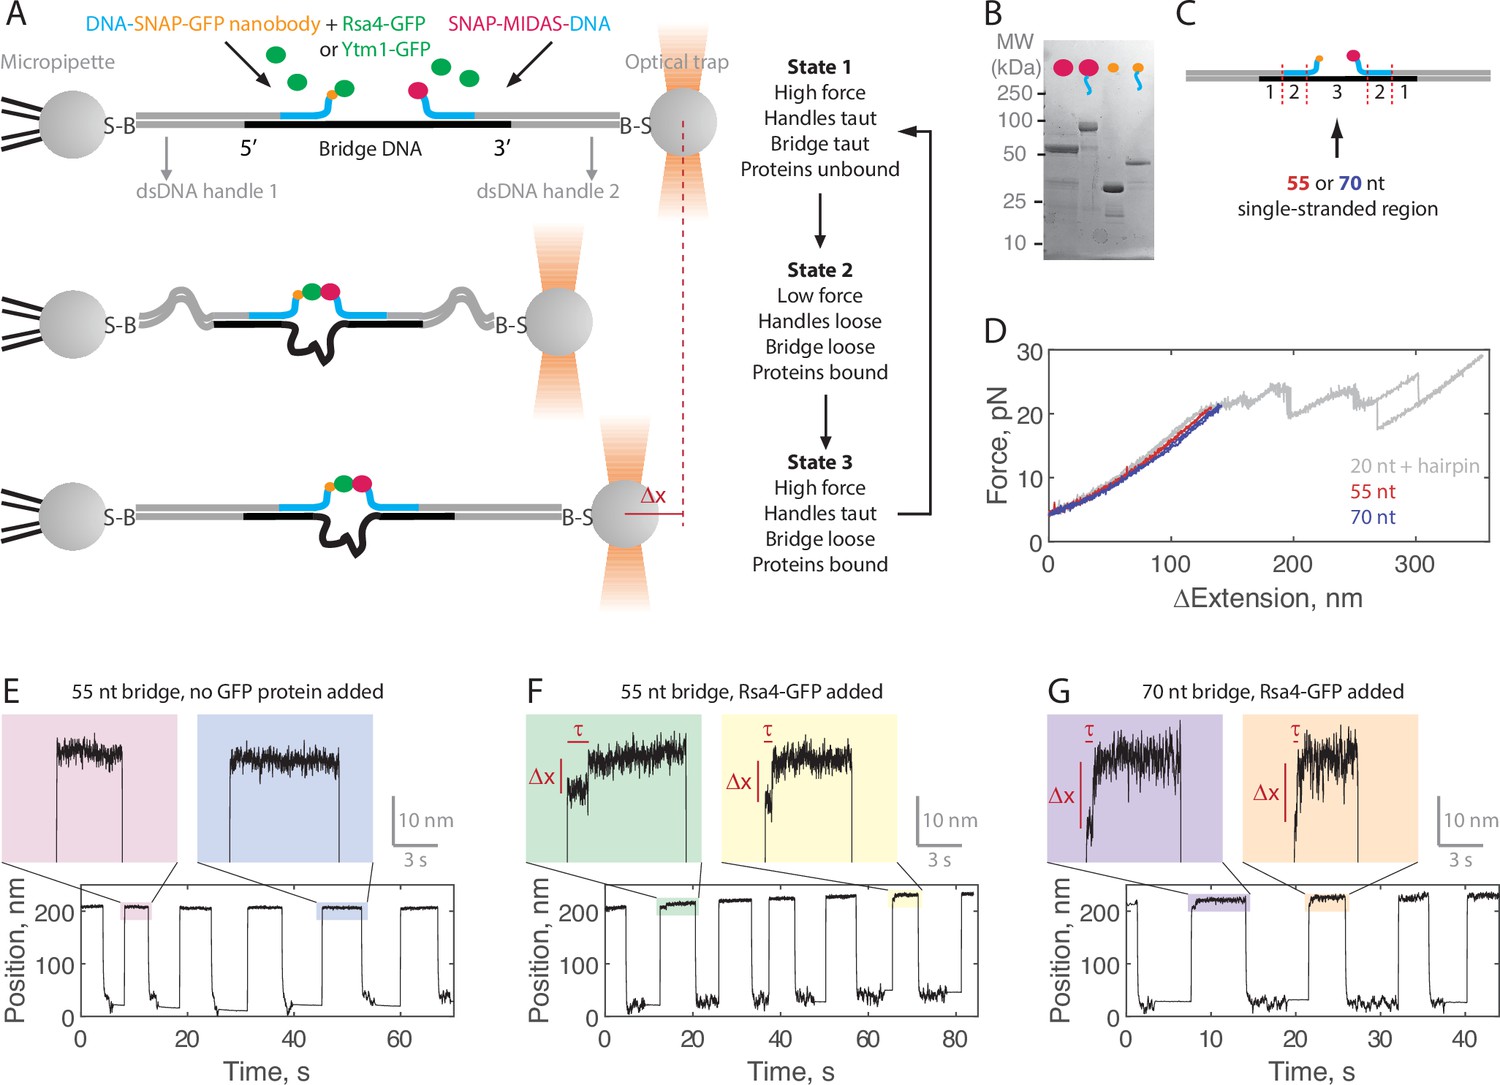
Single-molecule assay for measuring the MIDAS-Rsa4 interaction under load.
(A) Single-molecule optical tweezers ‘force jump’ assay design. Two 1.5 kilobase-pair double-stranded (dsDNA) handles are attached to 2.1 μm beads via biotin-streptavidin (B–S) linkage. The handles have 31–33 nucleotide (nt) overhangs, to which a single-stranded (ssDNA) ‘bridge’ is annealed. A copy of green fluorescent protein (GFP) nanobody and MIDAS protein, each conjugated to a DNA oligonucleotide (blue), are then annealed to the bridge. Rsa4-GFP, free in solution, can bind to the GFP nanobody. Dissociation of the MIDAS-UBL interaction under load can be read out as a positional change (Δx) when the optical trap (in constant force mode) is switched from a low to a high applied force. (B) SDS-PAGE gel (Coomassie staining) showing the covalent attachment of ssDNA oligonucleotides to the SNAP-tagged MIDAS-WT (pink) and SNAP-tagged GFP nanobody (orange). (C) Sections of the DNA bridge. Section 1 (31–33 nt) anneals to the dsDNA handles, section 2 (30 nt) anneals the protein-bound DNA oligonucleotides, and section 3 remains single-stranded. Different lengths of section 3 (55 or 70 nt) are expected to produce Δx events of different magnitude. (D) Example force-extension curves of the DNA handles connected by the 55 nt (red) and 70 nt (blue) bridge. Also shown is a hairpin (gray) which anneals to the dsDNA handles with a 20 nt region leftover; here the distinct unfolding/refolding pattern at loads above 20 pN enables identification of a single ‘tether’ (two dsDNA handles connected by a bridge) between the two beads. Data generated on tethers whose force-extension curves did not overlap with that of the hairpin standard in the 4–20 pN (ΔExtension = 0 when Force = 4 pN) range were not used. (E) Example force jump data (0.5 and 6 pN low and high force) on the 55 nt bridge with all components added except a GFP-labeled assembly factor. In some instances, force feedback was released at the low force level to reduce large fluctuations. Only two position levels were observed. (F) Example force jump data on the 55 nt bridge with Rsa4-GFP (20 nM) added. On some jumps (highlighted), an intermediate position is observed. (G) Similar to panel F, with the 70 nt bridge construct.
-
Figure 2—source data 1
Source data for example force jump plots.
- https://cdn.elifesciences.org/articles/73534/elife-73534-fig2-data1-v1.xlsx
Figure 2—figure supplement 1

Fraction of active tethers.
Fraction of verified single tethers that displayed Δx events with Rsa4-GFP present (38/91 and 28/67 on the 55 and 70 nt bridge constructs, respectively) or no GFP protein present (0/13 and 0/22). At least ten jumps and two different high-force levels were tested for each tether. Data pooled from at least three independent experimental days and shown as total with propagated Poisson counting error.
Figure 3 with 6 supplements

The Mdn1 MIDAS domain forms a catch bond with Rsa4.
(A) Distributions of MIDAS-Rsa4 bond lifetimes (6 pN total force, 55 nt bridge construct) with either MIDAS-WT (n = 57 events from 14 molecules) or MIDAS-Y4666R (n = 29 events from 17 molecules). Survival probability is defined as one minus the empirical cumulative density function. For all distributions, the final data point was moved from y = 0 to y = 0.01 to enable semilog plotting. Black lines show fits to a single exponential. (B) Distributions of MIDAS-Rsa4 bond lifetimes on the 55 nt bridge construct at 4 pN (n = 26 events from eight molecules), 6 pN (n = 57 events from 14 molecules), and 12 pN (n = 29 events from five molecules) total applied force. (C) Distributions of MIDAS-Rsa4 bond lifetimes on the 70 nt bridge construct at 4 pN (n = 33 events from 11 molecules), 6 pN (n = 27 events from seven molecules), and 12 pN (n = 11 events from five molecules) total applied force. (D) The average bond lifetime of MIDAS-Rsa4 binding as a function of total applied force. Data shown as mean ± standard error of the mean (SEM; n = 26–57 events from 38 total molecules for the 55 nt bridge and n = 11–33 events from 28 total molecules; note that events at more than one force could be collected on a given molecule), with dotted lines to guide the eye. (E) Mechanical circuit model describing the force jump assay. When the proteins (of inextensible length Lprot) are bound, force is partitioned between the top ‘loading’ strand (two 12 nt single-stranded regions) and the bottom bridge strand. In the equations shown inset, x designates extension along the loading stand spring. (F) The magnitude of Δx for Rsa4-MIDAS interactions as a function of total applied force. Individual measurements shown as small data points, mean ± SD (n = 11–57 events) shown in bold. Data generated with the 55 and 70 nt bridge constructs shown in red and blue, respectively. Black lines show output of the mechanical circuit model (see also Figure 3—figure supplement 4). (G) The average MIDAS-Rsa4 bond lifetime as a function of force applied across the proteins. Data generated with the 55 nt bridge construct shown in red and data generated with the 70 nt bridge construct shown in blue. Data points shown as mean ± SEM (n = 11–57 events). Black curve shows fit to the catch-slip Bell model.
-
Figure 3—source data 1
Source data for data generated in the force jump assay shown in Figure 3 and its supplements.
- https://cdn.elifesciences.org/articles/73534/elife-73534-fig3-data1-v1.xlsx
-
Figure 3—source data 2
MATLAB script that runs the mechanical circuit model of the force jump assay.
- https://cdn.elifesciences.org/articles/73534/elife-73534-fig3-data2-v1.zip
-
Figure 3—source data 3
Raw TIFF file for SDS-PAGE gel of Rsa4-SNAP.
- https://cdn.elifesciences.org/articles/73534/elife-73534-fig3-data3-v1.zip
Figure 3—figure supplement 1
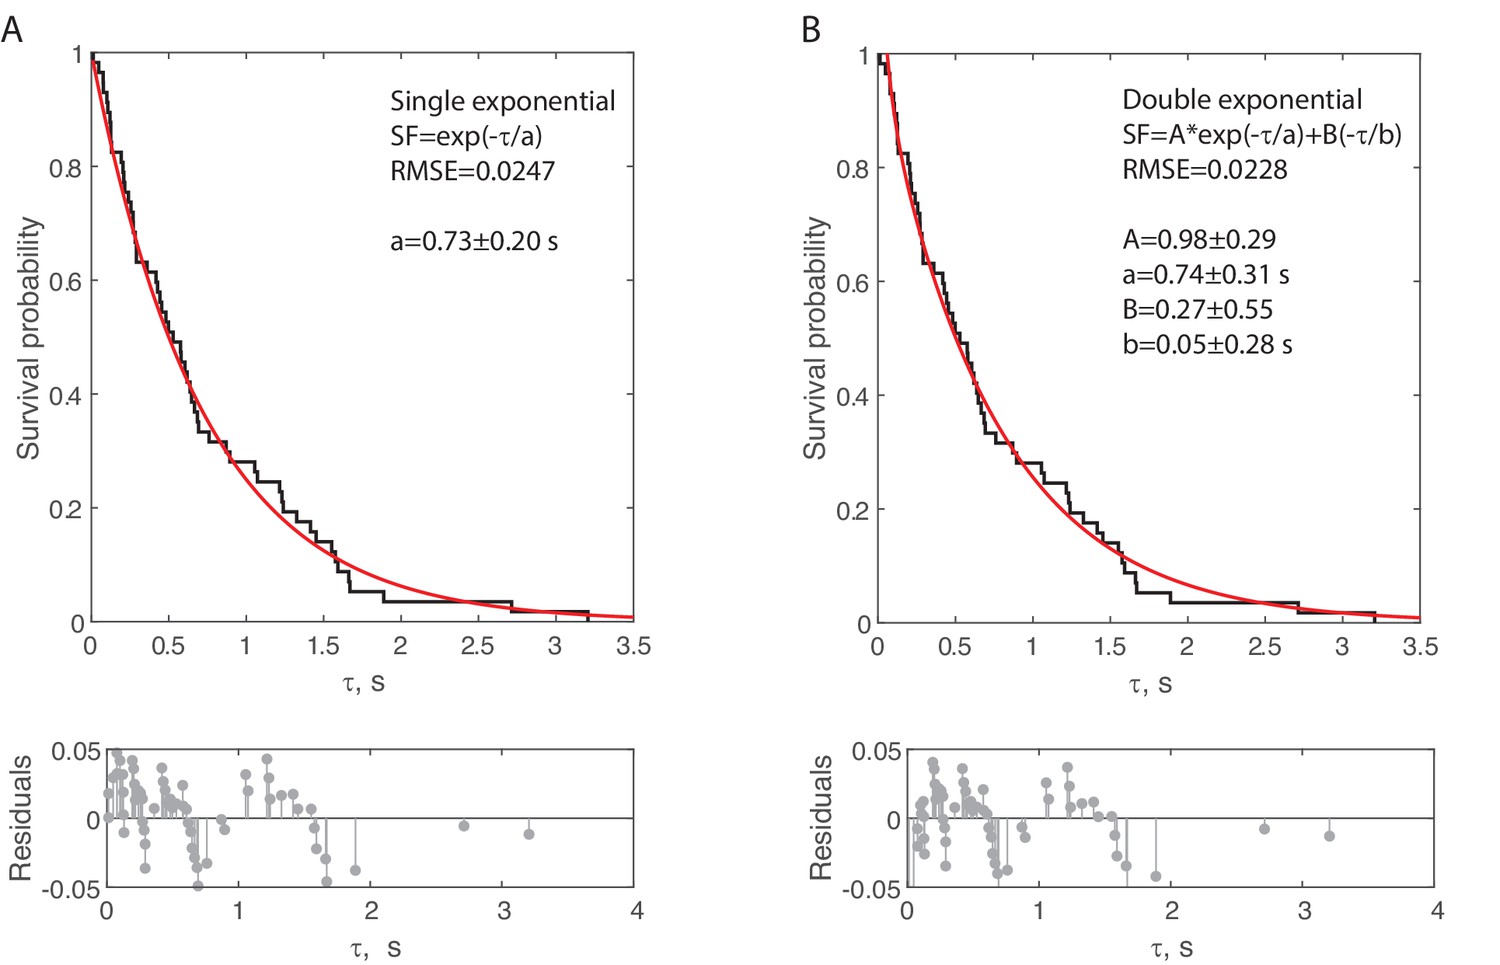
Comparing single and double exponential fits for bond lifetime data.
(A) Data for Rsa4-GFP binding to MIDAS on the 55 nt bridge construct at 6 pN total applied force (n = 57 events from 14 molecules). Raw data (black) with single exponential fit (equation inset) in red. Fitted parameters shown as fit with bootstrapped error. (B) The same data as in panel A, fitted with a double exponential (equation inset). Fitted parameters shown as fit with bootstrapped error. The marginal decrease in root mean square error (RMSE) between the single and double exponential fits supports the sufficiency of the former.
Figure 3—figure supplement 2
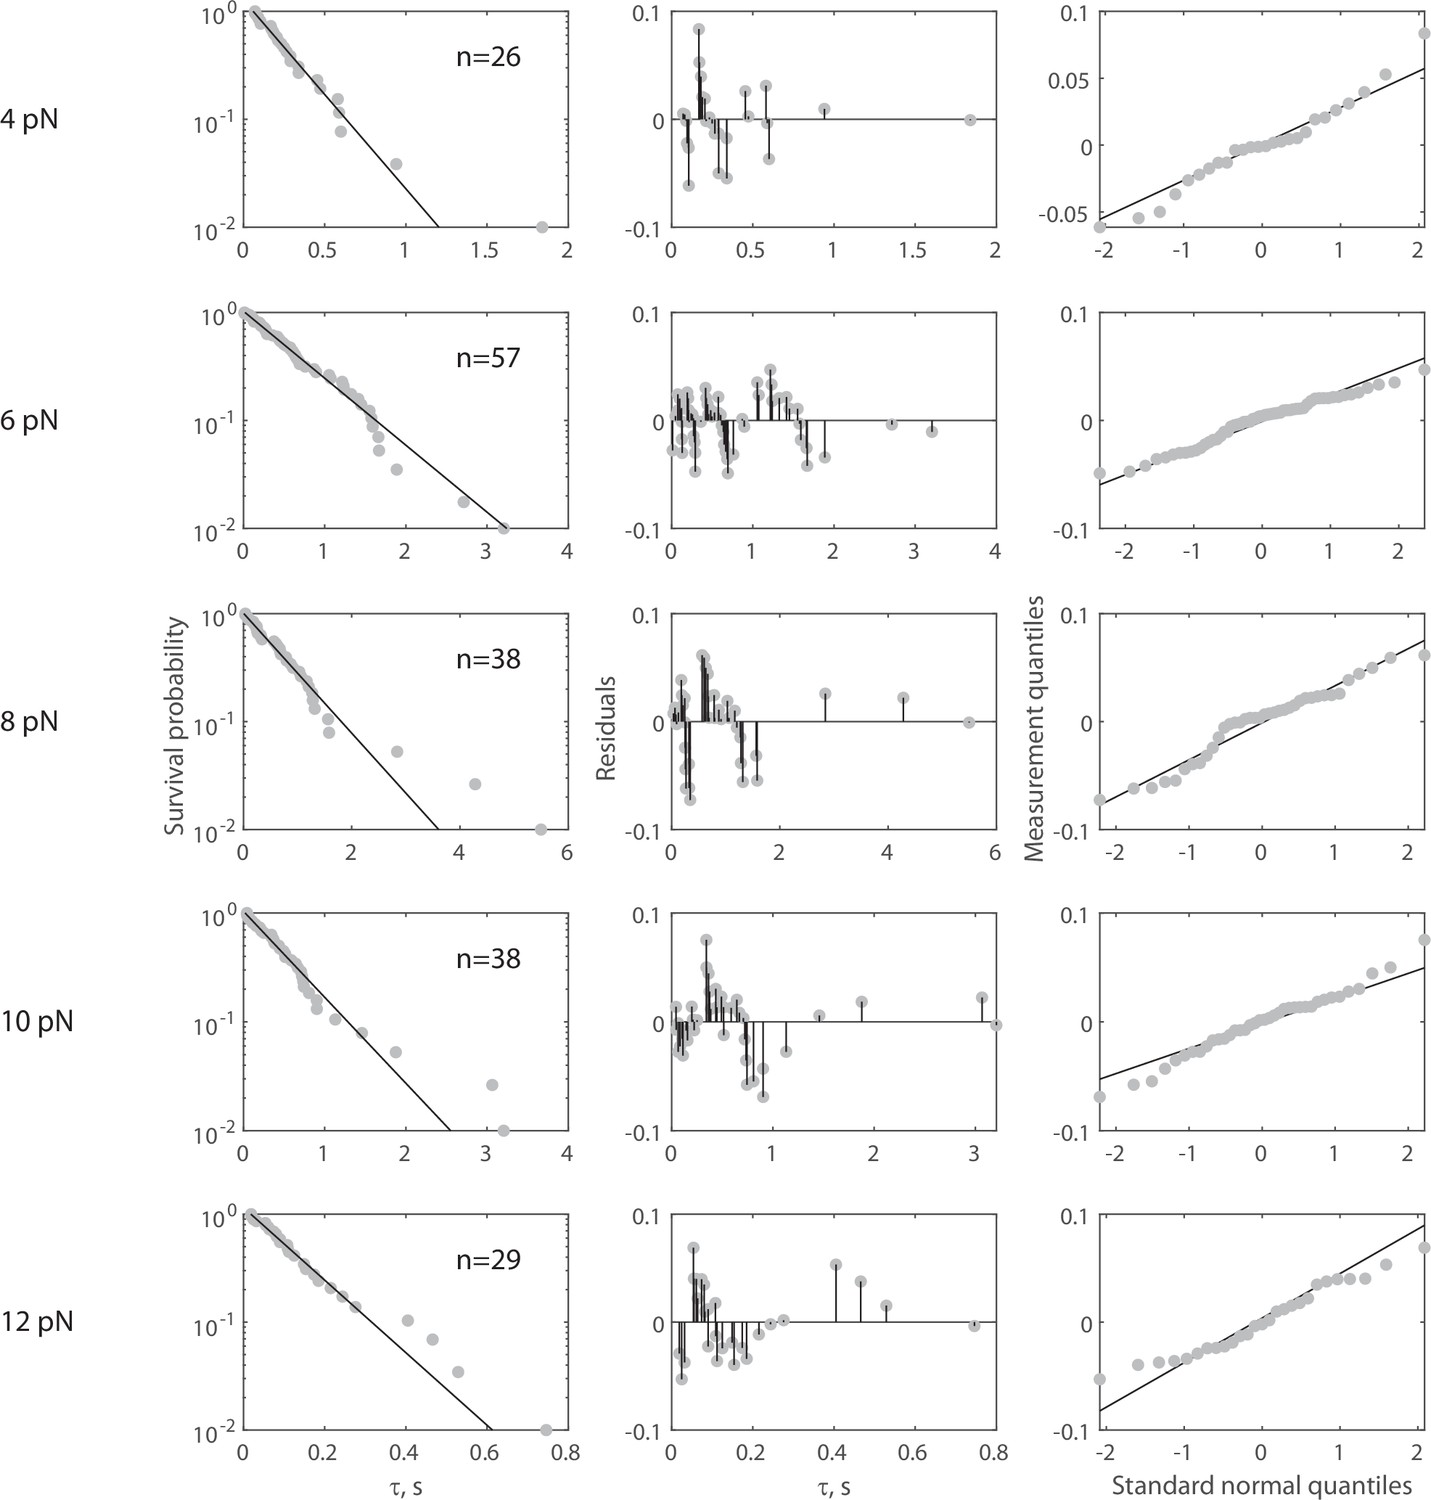
Complete force jump dataset for Rsa4-GFP on 55 nt bridge construct.
(Left column) Full dataset (at each FTot) for force jump assay on the 55 nt bridge constructs with Rsa4-GFP. Data in gray, fitted single exponential in black. The number of events (n) is labeled inset for each experiment. Pooled data collected from 38 molecules, with each distribution stemming from at least four molecules. For all distributions, the final data point was moved from y = 0 to y = 0.01 to enable semilog plotting. (Center column) Residuals from the fits in the left column. (Right column) QQ plots of residuals plotted in the center column.
Figure 3—figure supplement 3
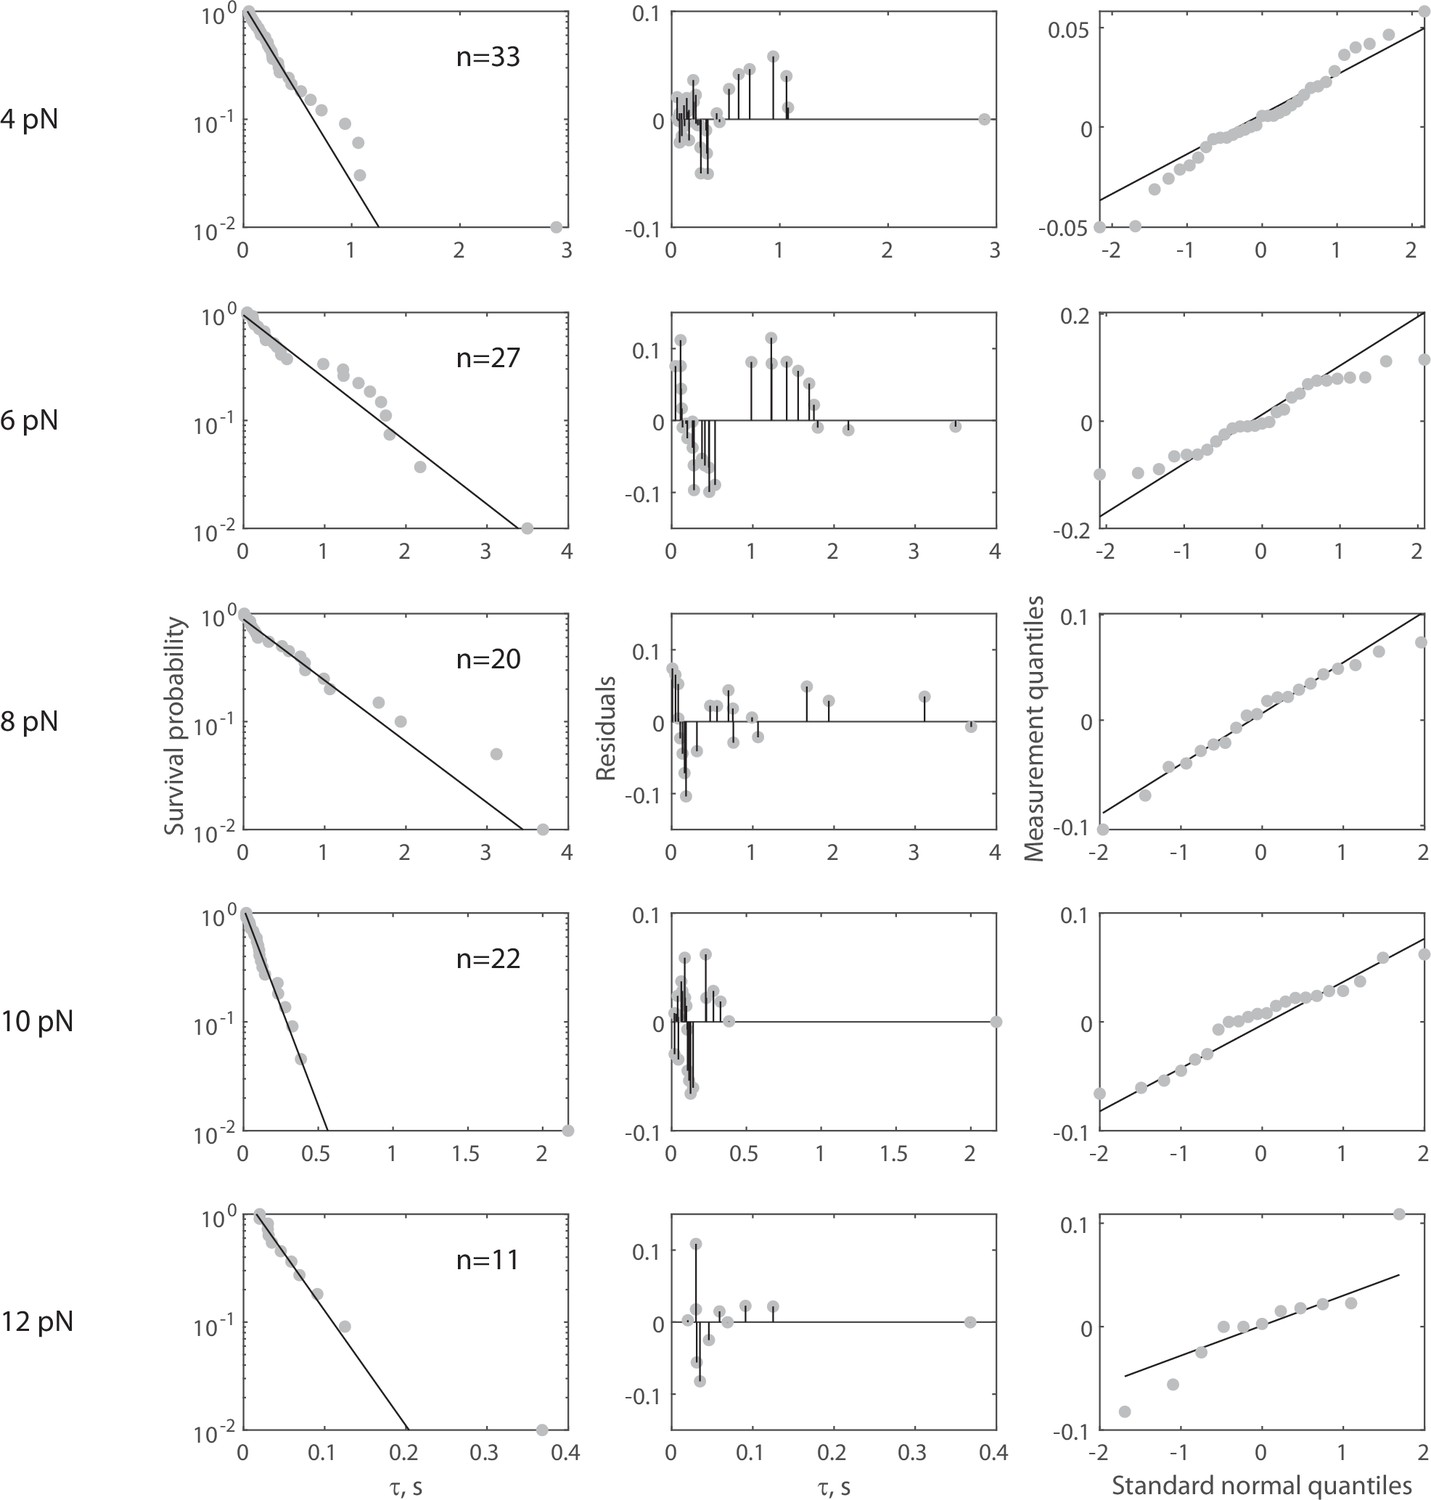
Complete force jump dataset for Rsa4-GFP on 70 nt bridge construct.
(Left column) Full dataset (at each FTot) for force jump assay on the 70 nt bridge constructs with Rsa4-GFP. Data in gray, fitted single exponential in black. The number of measurements (n) is labeled inset for each experiment. Pooled data collected from 28 molecules, with each distribution stemming from at least five molecules. For all distributions, the final data point was moved from y = 0 to y = 0.01 to enable semilog plotting. (Center column) Residuals from the fits in the left column. (Right column) QQ plots of residuals plotted in the center column.
Figure 3—figure supplement 4
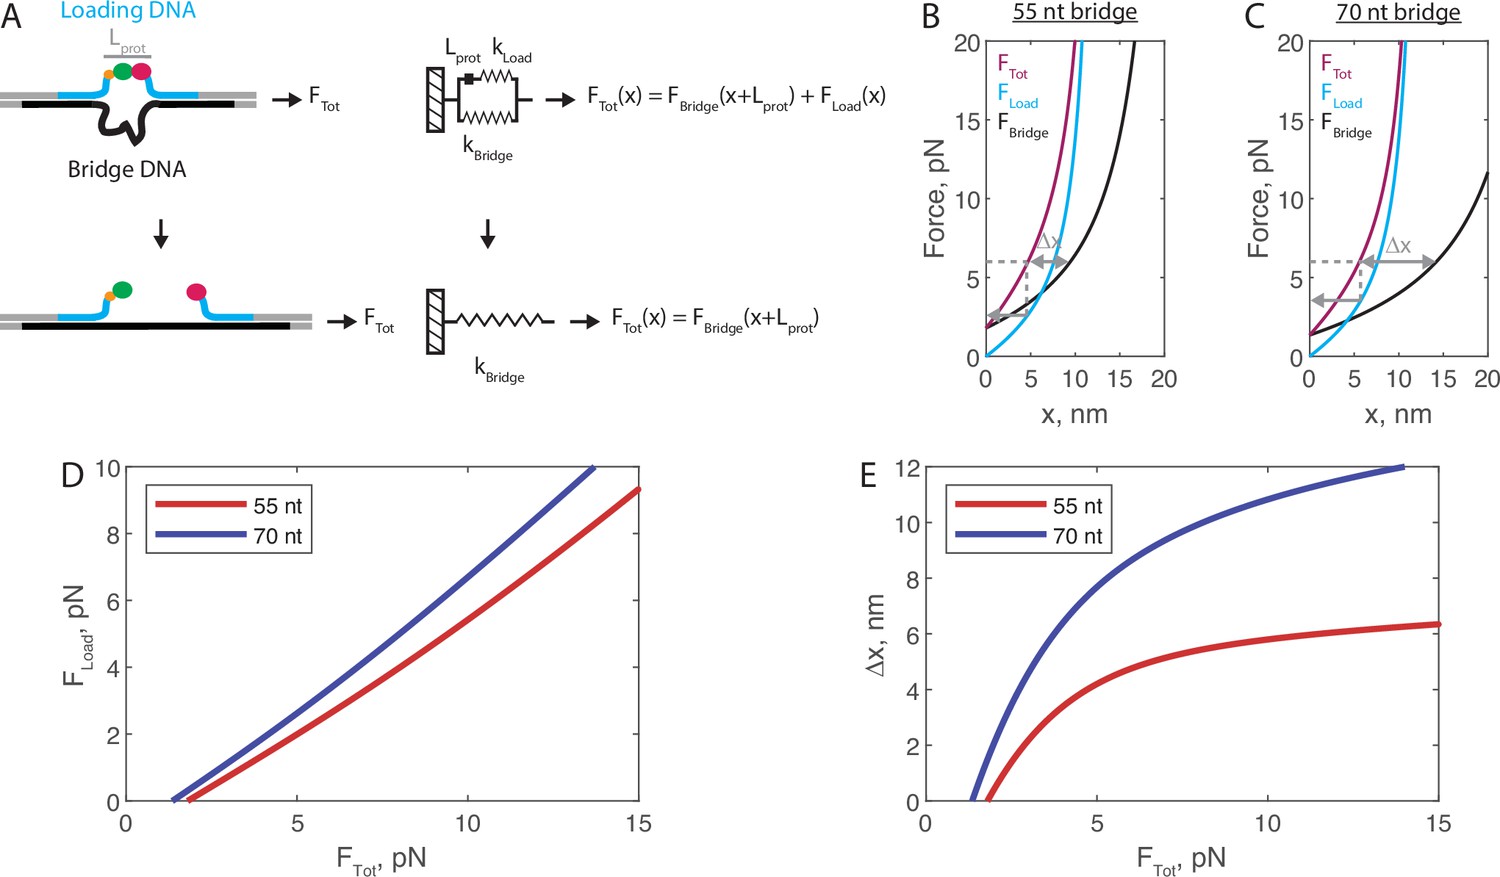
Mechanical circuit model for the force jump assay.
(A) Mechanical circuit model describing the force jump assay. When the proteins (of inextensible length Lprot) are bound, force is partitioned between the top ‘loading’ strand (two 12 nt single-stranded regions) and the bottom bridge strand. In the equations shown inset, x designates extension along the loading stand spring. (B) Modeled force-extension curves for the force jump assay using the 55 nt bridge construct. Gray lines show an example for 6 pN total applied force: the single-headed arrow shows the amount of force felt by the proteins, and the double-sided arrow shows the expected magnitude of Δx when the proteins dissociate. (C) Similar to panel B, using the 70 nt bridge construct. (D) Transfer function showing the calculated FLoad for a given Ftot. (E) Transfer function showing the calculated Δx for a given FTot.
Figure 3—figure supplement 5
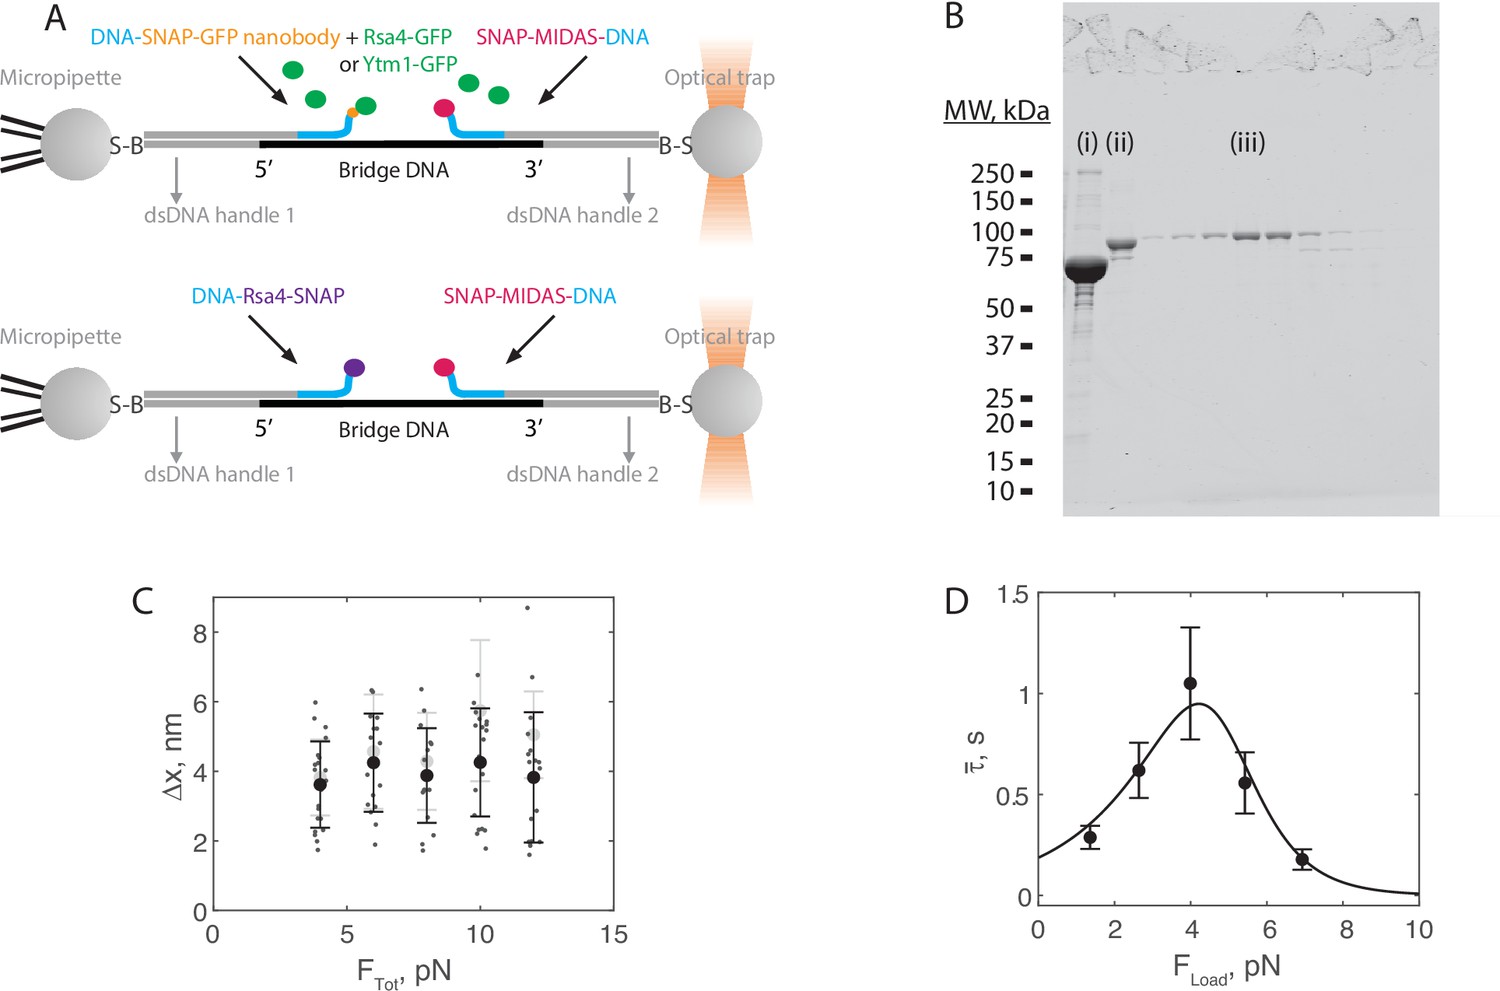
Force jump assay using Rsa4-SNAP.
(A) Assay diagram showing the use of Rsa-GFP (top) versus Rsa4-SNAP (bottom). Rsa4-SNAP is directly conjugated to an oligonucleotide and thereby bound to the bridge strand. Measurements using Rsa4-SNAP are meant to show that bond lifetimes are not dependent on the GFP-GFP nanobody connection. (B) SDS-PAGE gel (Coomassie staining) showing Rsa4-SNAP before (i) and after (ii) oligonucleotide conjugation. Product was run over a Superdex200 increase size exclusion column, and the peak fraction (iii) was used for assays. (C) The magnitude of Δx for MIDAS-Rsa4-SNAP interactions as a function of total applied force on the 55 nt bridge construct. Individual measurements shown as small data points, mean ± SD (n = 19–21 events pooled from 26 molecules, at least four molecules per force condition) shown in bold. Data generated using Rsa4-GFP shown in gray (mean ± SD only) for comparison. (G) The average MIDAS-Rsa4-SNAP bond lifetime as a function of force applied across the proteins. Data generated with the 55 nt bridge construct, and shown as mean ± SEM (n = 19–21 events pooled from 26 molecules, at least four molecules per force condition). Black curve shows catch-slip Bell model fit result for the Rsa4-GFP dataset (Figure 3G) for comparison.
Figure 3—figure supplement 6
Complete force jump dataset for Rsa4-SNAP on 55 nt bridge construct.
(Left column) Full dataset (at each FTot) for force jump assay on the 55 nt bridge construct with Rsa4-SNAP. Data in gray, fitted single exponential in black. The number of events (n) is labeled inset for each experiment. Pooled data collected from 26 molecules, with each distribution stemming from at least four molecules. For all distributions, the final data point was moved from y = 0 to y = 0.01 to enable semilog plotting. (Center column) Residuals from the fits in the left column. (Right column) QQ plots of residuals plotted in the center column.
Figure 4 with 5 supplements
The Mdn1 MIDAS domain also forms a catch bond with Ytm1.
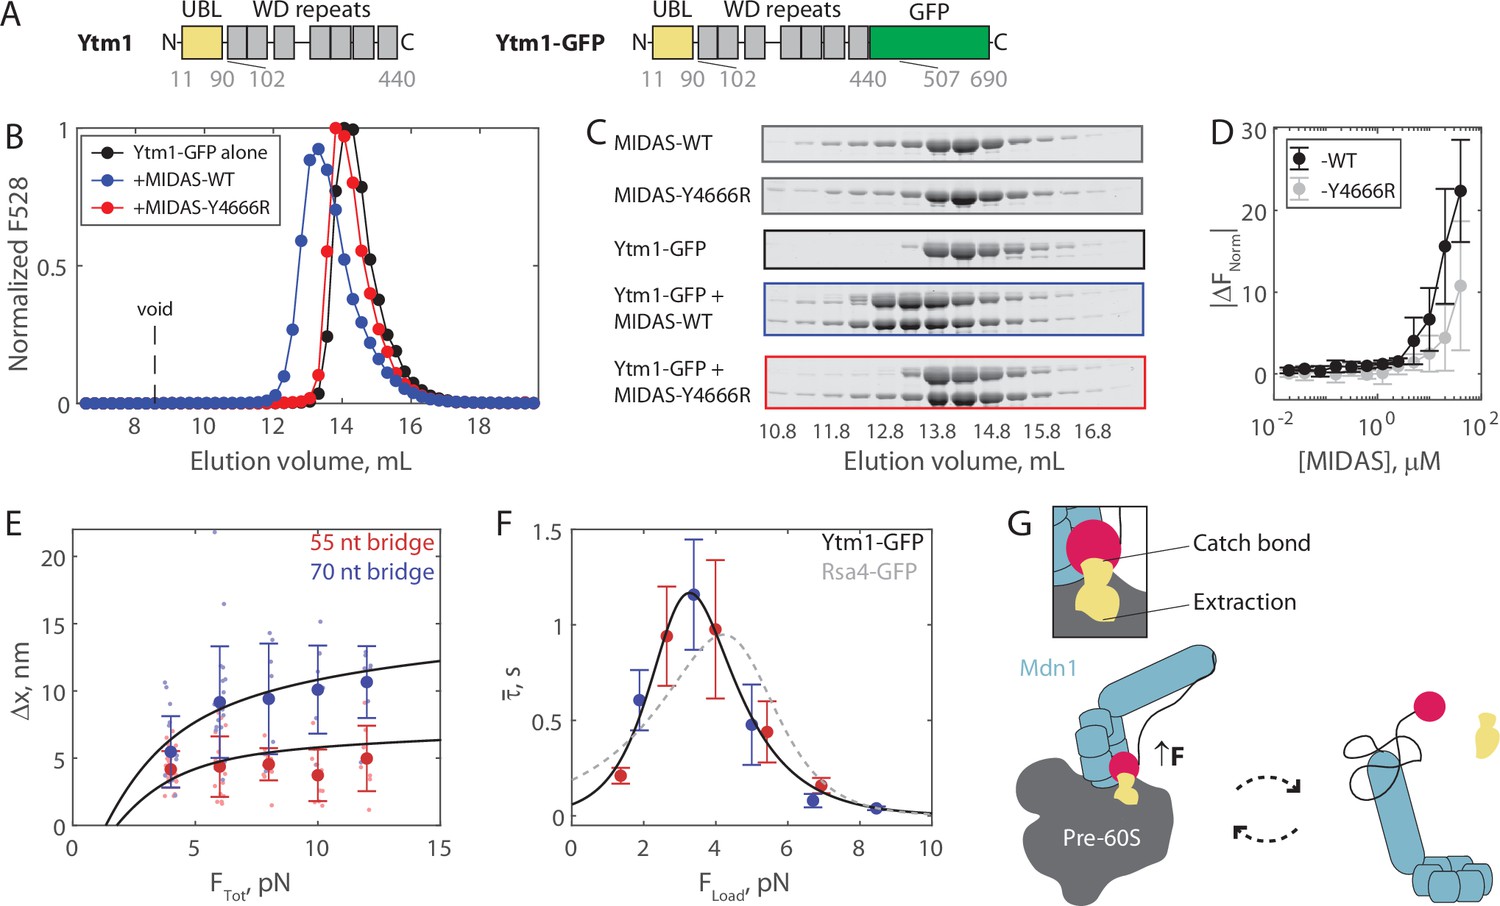
(A) Domain diagrams (drawn to scale) highlighting the position of the ubiquitin-like (UBL) and WD repeat domains within the assembly factor Ytm1, as well as the added green fluorescent protein (GFP) tag. (B) Elution profile (monitored by GFP fluorescence) of Ytm1-GFP (40 μM prior to injection) either alone or pre-mixed with MIDAS-WT or MIDAS-Y4666R (no GFP label; 60 μM) on a Superdex 200 Increase size exclusion column. (C) SDS-PAGE gels (Coomassie staining) corresponding to the elution profiles shown in panel B. (D) Microscale thermophoresis data showing the binding of unlabeled MIDAS protein to Ytm1-GFP (50 nM). All data shown as mean ± SD (n = 4). Data points connected by lines to guide the eye. (E) The magnitude of Δx for Ytm1-MIDAS interactions as a function of total applied force. Individual measurements shown as small data points, mean ± SD (n = 8–22 events from 30 total molecules on the 55 nt tether construct, and n = 8–22 events from 24 total molecules on the 70 nt tether construct) shown in bold. Black lines show output of the mechanical circuit model. Example traces with Ytm1-GFP in the force jump assay shown in Figure 4—figure supplement 3. (F) The average bond lifetime of MIDAS-Ytm1 binding as a function of force applied across the proteins. Data generated with the 55 nt bridge construct shown in red and data generated with the 70 nt bridge construct shown in blue. Data points shown as mean ± SEM (n = 8–22 events from 30 total molecules on the 55 nt tether construct, and n = 8–22 events from 24 total molecules on the 70 nt tether construct). All distributions in Figure 4—figure supplements 4 and 5. Black curve shows fit to the catch-slip Bell model. Gray dotted line shows the fit for MIDAS-Rsa4 binding (Figure 3G) for comparison. (G) Two-state diagram highlighting the MIDAS-UBL catch bond in ribosome biogenesis. Force generated by Mdn1 (blue) must be transmitted through its MIDAS domain (magenta) to mechanochemically remove an assembly factor, Rsa4 or Ytm1 (yellow), from the pre-60S particle (gray). One possibility is that stretching of the unstructured Mdn1 linker (black) builds tension (black arrow), which is transmitted along the MIDAS-UBL bond axis when the assembly factor is embedded in the pre-60S, engaging the catch bond (left side). Inset: tension strengthens the MIDAS-assembly factor bond, while simultaneously promoting assembly factor extraction from the pre-60S. Tension is relieved upon release from the pre-60S, disengaging the catch bond and thus promoting MIDAS-UBL dissociation (right side).
-
Figure 4—source data 1
Source data for size exclusion chromatography, microscale thermophoresis (MST), and force jump assays shown in Figure 4 and its supplements.
- https://cdn.elifesciences.org/articles/73534/elife-73534-fig4-data1-v1.xlsx
-
Figure 4—source data 2
All raw TIFF files for SDS-PAGE gels corresponding to size exclusion chromatography coelution assays.
- https://cdn.elifesciences.org/articles/73534/elife-73534-fig4-data2-v1.zip
Figure 4—figure supplement 1
Preparation of recombinant Ytm1-GFP.
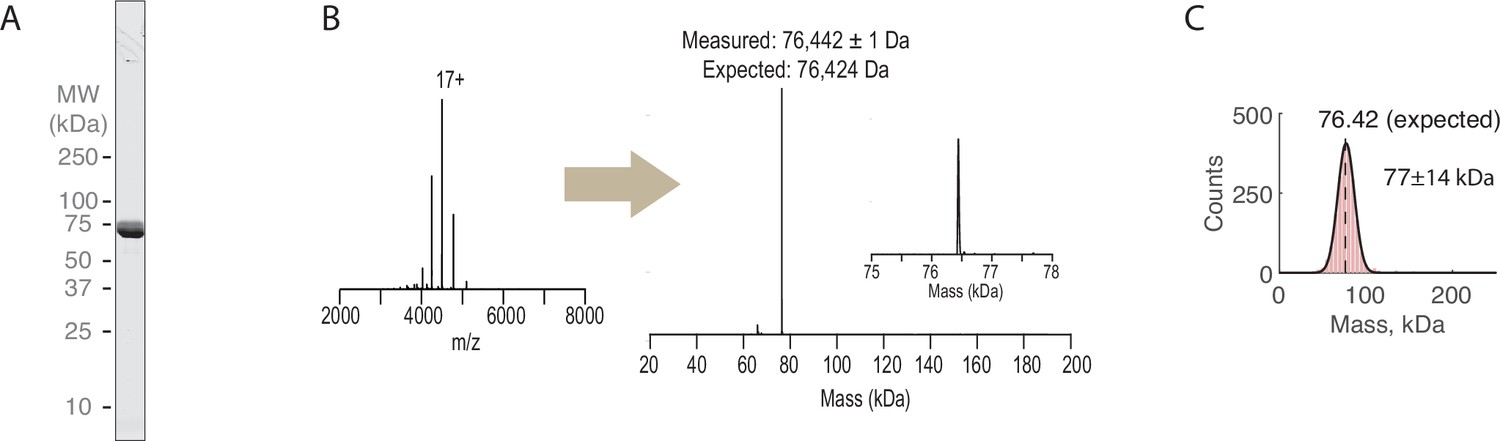
(A) SDS-PAGE gels (Coomassie staining) of final purified Ytm1-GFP. (B) Raw and deconvolved native mass spectrometry spectra for Ytm1-GFP. (C) Mass photometry measurements of Ytm1-GFP (2031 measured molecules). Measured mass shown inset at mean ± SD of fitted Gaussian (black line).
Figure 4—figure supplement 2
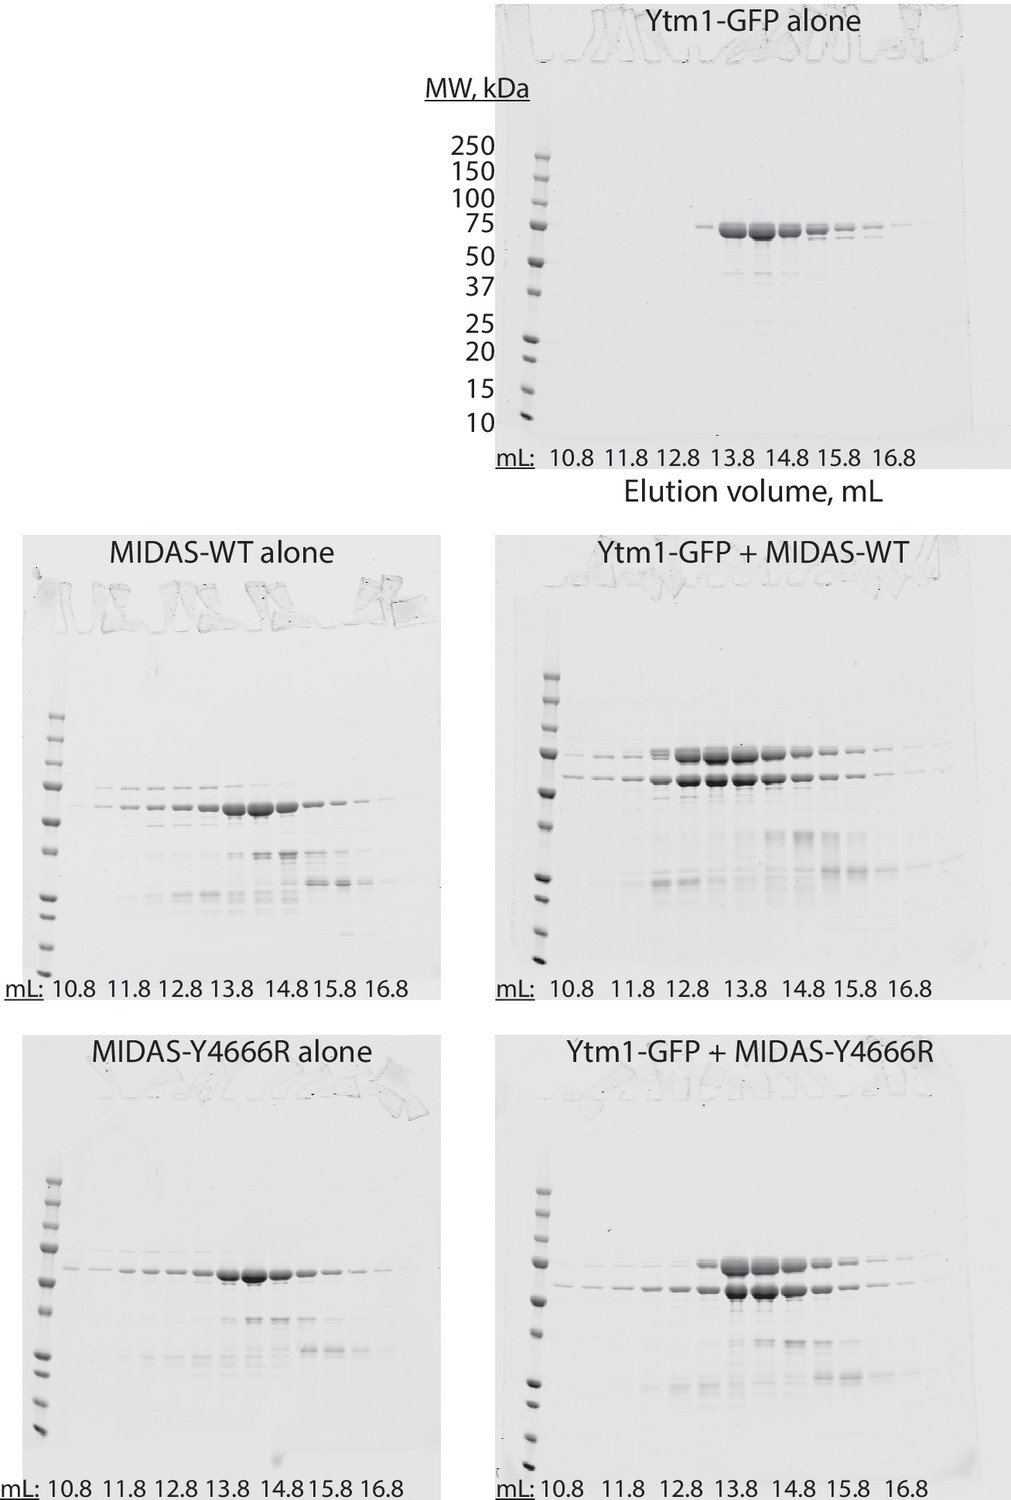
Full gels for Ytm1-GFP size exclusion chromatography experiments.
Uncropped SDS-PAGE gels (Coomassie staining) showing size exclusion chromatography results for the listed proteins. The same molecular weight ladder was used for all gels. Corresponds to Figure 4B–C.
Figure 4—figure supplement 3
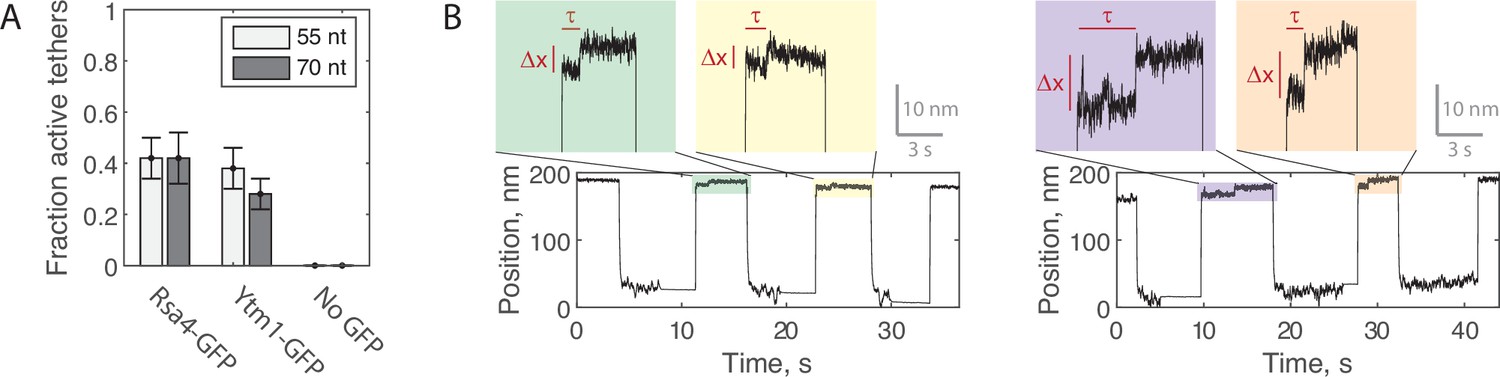
Force jump assay with Ytm1-GFP.
(A) Fraction of verified single tethers that displayed Δx events with Rsa4-GFP present (38/91 and 28/67 on the 55 and 70 nt bridge constructs, respectively), Ytm1-GFP present (30/78 and 24/86), or no GFP protein present (0/13 and 0/22). At least ten jumps and two different high-force levels were tested for each tether. Data pooled from at least three independent experimental days and shown as total with propagated Poisson counting error. (B) Example force jump data (6 pN total force) on the 55 nt bridge (left) and 70 nt bridge (right) with Ytm1-GFP (20 nM) added.
Figure 4—figure supplement 4
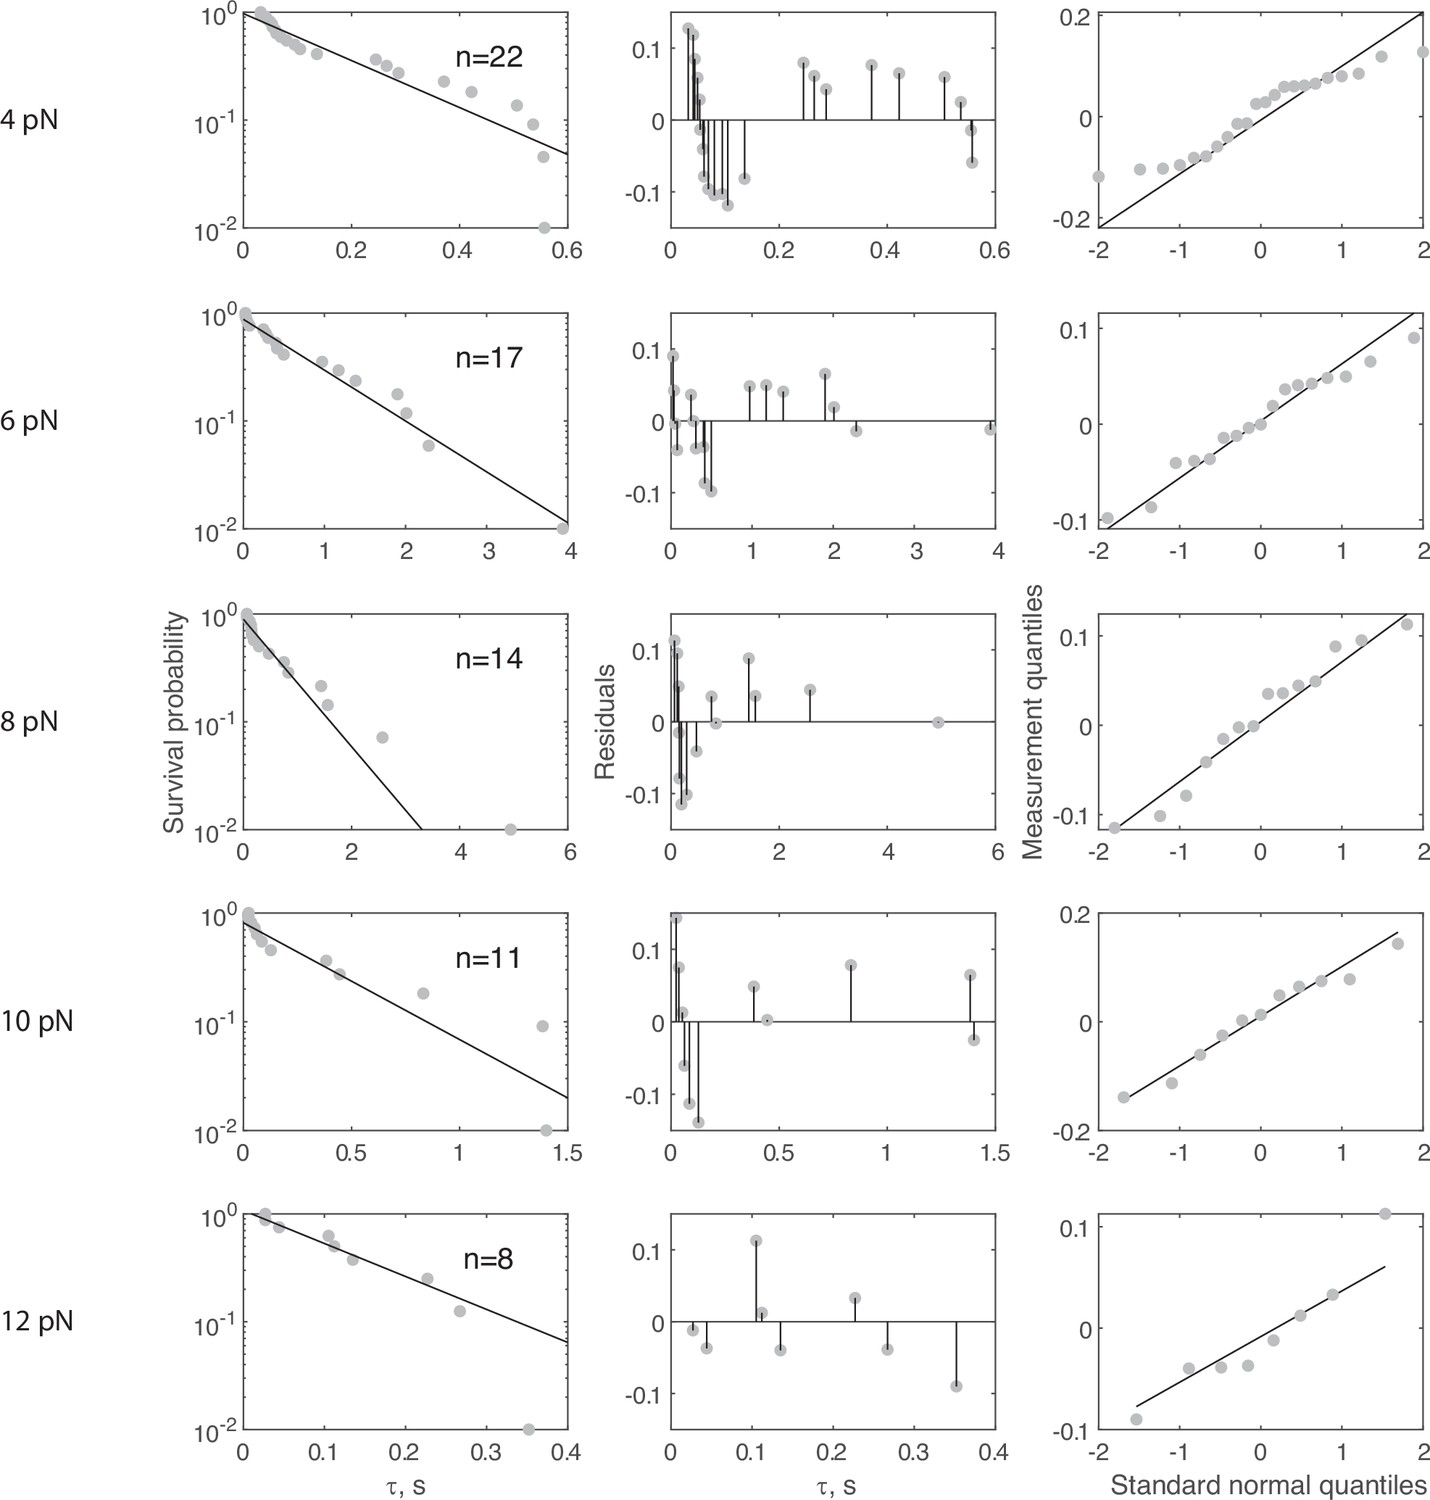
Complete force jump dataset for Ytm1-GFP on 55 nt bridge construct.
(Left column) Full dataset (at each FTot) for force jump assay on the 55 nt bridge constructs with Ytm1-GFP. Data in gray, fitted single exponential in black. The number of events (n) is labeled inset for each experiment. Pooled data collected from 30 molecules, with each distribution stemming from at least four molecules. For all distributions, the final data point was moved from y = 0 to y = 0.01 to enable semilog plotting. (Center column) Residuals from the fits in the left column. (Right column) QQ plots of residuals plotted in the center column.
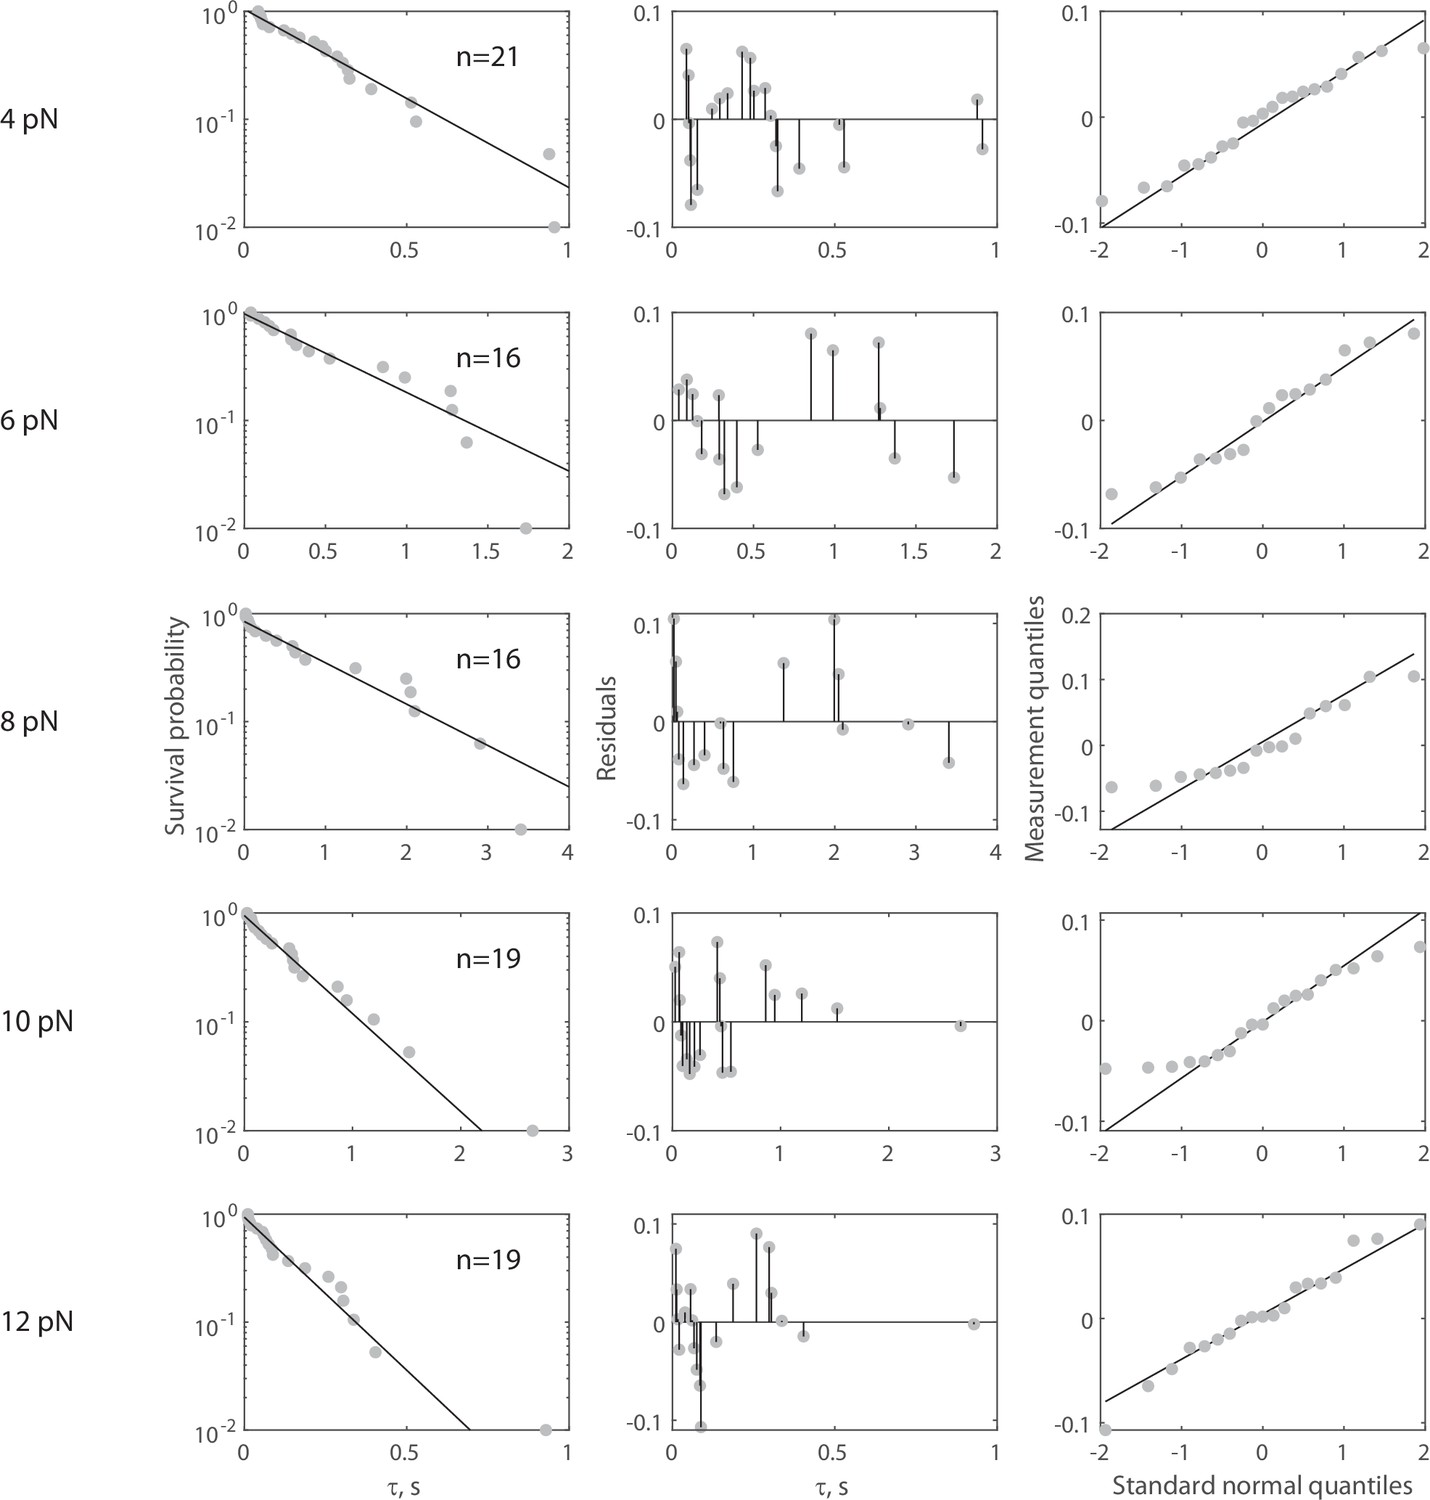
Figure 4—figure supplement 5

Complete force jump dataset for Ytm1-GFP on 70 nt bridge construct.
(Left column) Full dataset (at each FTot) for force jump assay on the 70 nt bridge constructs with Ytm1-GFP. Data in gray, fitted single exponential in black. The number of events (n) is labeled inset for each experiment. Pooled data collected from 24 molecules, with each distribution stemming from at least four molecules. For all distributions, the final data point was moved from y = 0 to y = 0.01 to enable semilog plotting. (Center column) Residuals from the fits in the left column. (Right column) QQ plots of residuals plotted in the center column.
Additional files
Download links
A two-part list of links to download the article, or parts of the article, in various formats.
Downloads (link to download the article as PDF)
Open citations (links to open the citations from this article in various online reference manager services)
Cite this article (links to download the citations from this article in formats compatible with various reference manager tools)
The MIDAS domain of AAA mechanoenzyme Mdn1 forms catch bonds with two different substrates
eLife 11:e73534.
https://doi.org/10.7554/eLife.73534


