Environmental enrichment enhances patterning and remodeling of synaptic nanoarchitecture as revealed by STED nanoscopy
- Optical Nanoscopy in Neuroscience, Center for Nanoscale Microscopy and Molecular Physiology of the Brain, University Medical Center Göttingen, Germany
- Max Planck Institute for Multidisciplinary Sciences, City Campus, Germany
- Department of NanoBiophotonics, Max Planck Institute for Multidisciplinary Sciences, Germany
- Department of Optical Nanoscopy, Institut für Nanophotonik Göttingen e.V., Germany
- Cluster of Excellence "Multiscale Bioimaging: from Molecular Machines to Networks of Excitable Cells" (MBExC), University of Göttingen, Germany
- Max Planck Institute for Dynamics and Self-Organization, Germany
- Göttingen Campus Institute for Dynamics of Biological Networks, Germany
Figures
Figure 1 with 1 supplement

Virtually crosstalk-free two-color in vivo stimulated emission depletion (STED) microscopy.
(A) Custom-designed in vivo STED microscope with pulsed 483 nm (Exc1) and 520 nm (Exc2) excitation and 595 nm STED laser. APD: avalanche photon detector, BP: bandpass filter, Det: detection, DM: dichroic mirror, OPO: optical parametric oscillator, QWP: quarter wave plate, VPP: vortex phase plate. See Material and methods section for details. (B) Excitation (dashed line) and emission (solid line) spectrum of EGFP and EYFP and wavelength regions for selective excitation and detection. (C) Cultured hippocampal neurons expressing the actin marker Lifeact (LA)-EGFP or LA-EYFP. Excitation of EGFP at 483 nm close to its excitation maximum (B) and detection at 498–510 nm (Det1) reduced the crosstalk to 5% in channel 2 (C). EYFP or Citrine was excited at 520 nm close to its maximum (B) and detected at 532–555 nm (Det2) which resulted in a low crosstalk of 8% in channel 1 (C). (D) In vivo STED microscopy image of apical dendrite in layer 1 of the visual cortex of an anesthetized mouse. Labeling of membrane (myr-EGFP-LDLR(Ct)) and PSD95 (PSD95.FingR-Citrine) visualized the spine morphology and PSD95 nanoorganization at superresolution (D, inset). Images are smoothed and represent maximum intensity projections (MIPs). No unmixing was performed due to the low crosstalk.
Figure 1—figure supplement 1
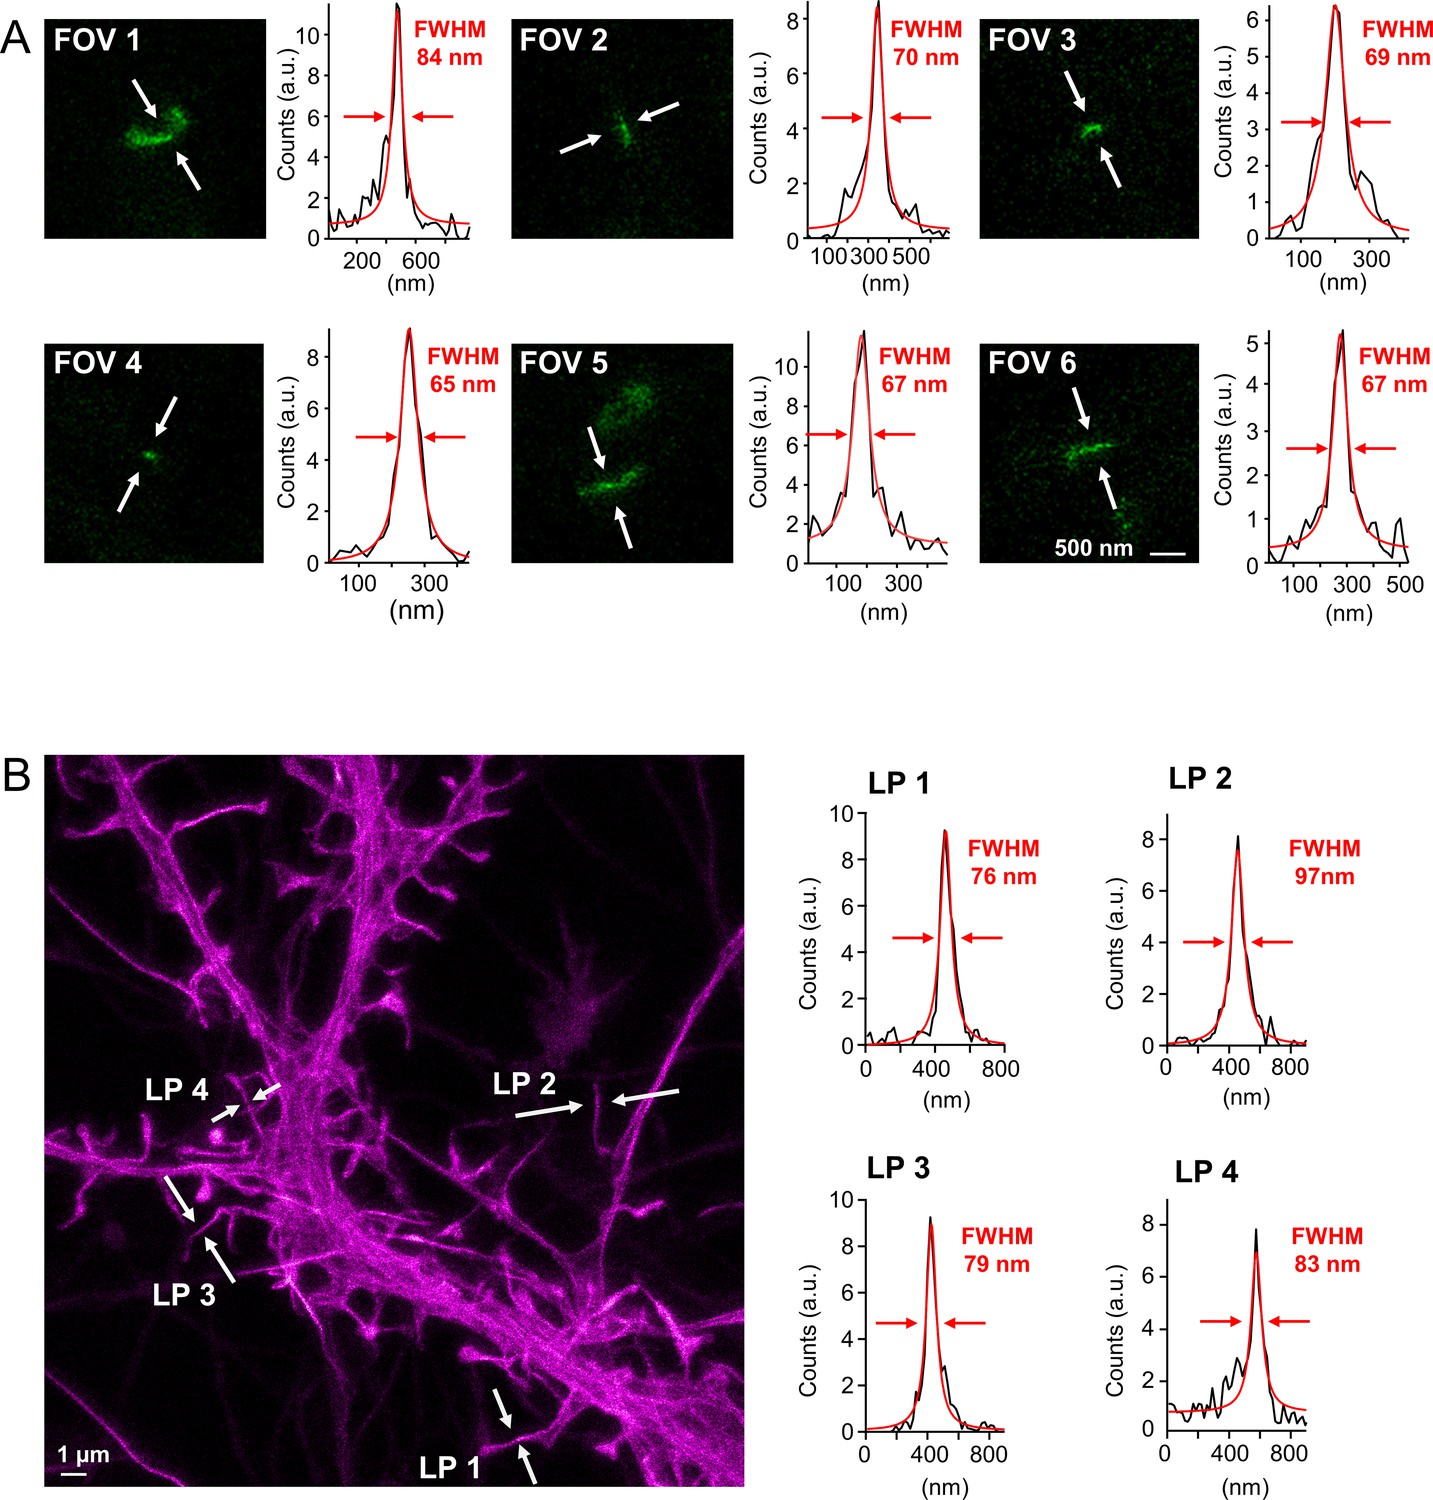
Resolving capability of the custom-built two-color in vivo stimulated emission depletion (STED) microscope.
(A) In vivo measurement of PSD95.FingR-Citrine. Fields of view (FOV) represent a selection of magnified PSD95 assemblies (green) from different STED image stacks. The resolving power was determined by fitting a Lorentzian function (red line) to the line profile (black line) which was averaged over three pixels at the indicated position (white arrows). The average of all determined full-widths at half-maximum (FWHM) is 70 nm, which is the upper estimate of the resolution of the custom-built STED microscope for Citrine. It is measured in the actual experiment and includes all potential distortions due to the tissue penetration of the excitation and STED beams and potential movement. (B) Live-cell STED microscopy of Lifeact-EGFP in neuronal cultures to determine the resolving power of the STED microscope for EGFP. Four line profiles (LP) were taken at different positions as described in (A) which are on average 84 nm in FWHM.
Figure 2 with 2 supplements
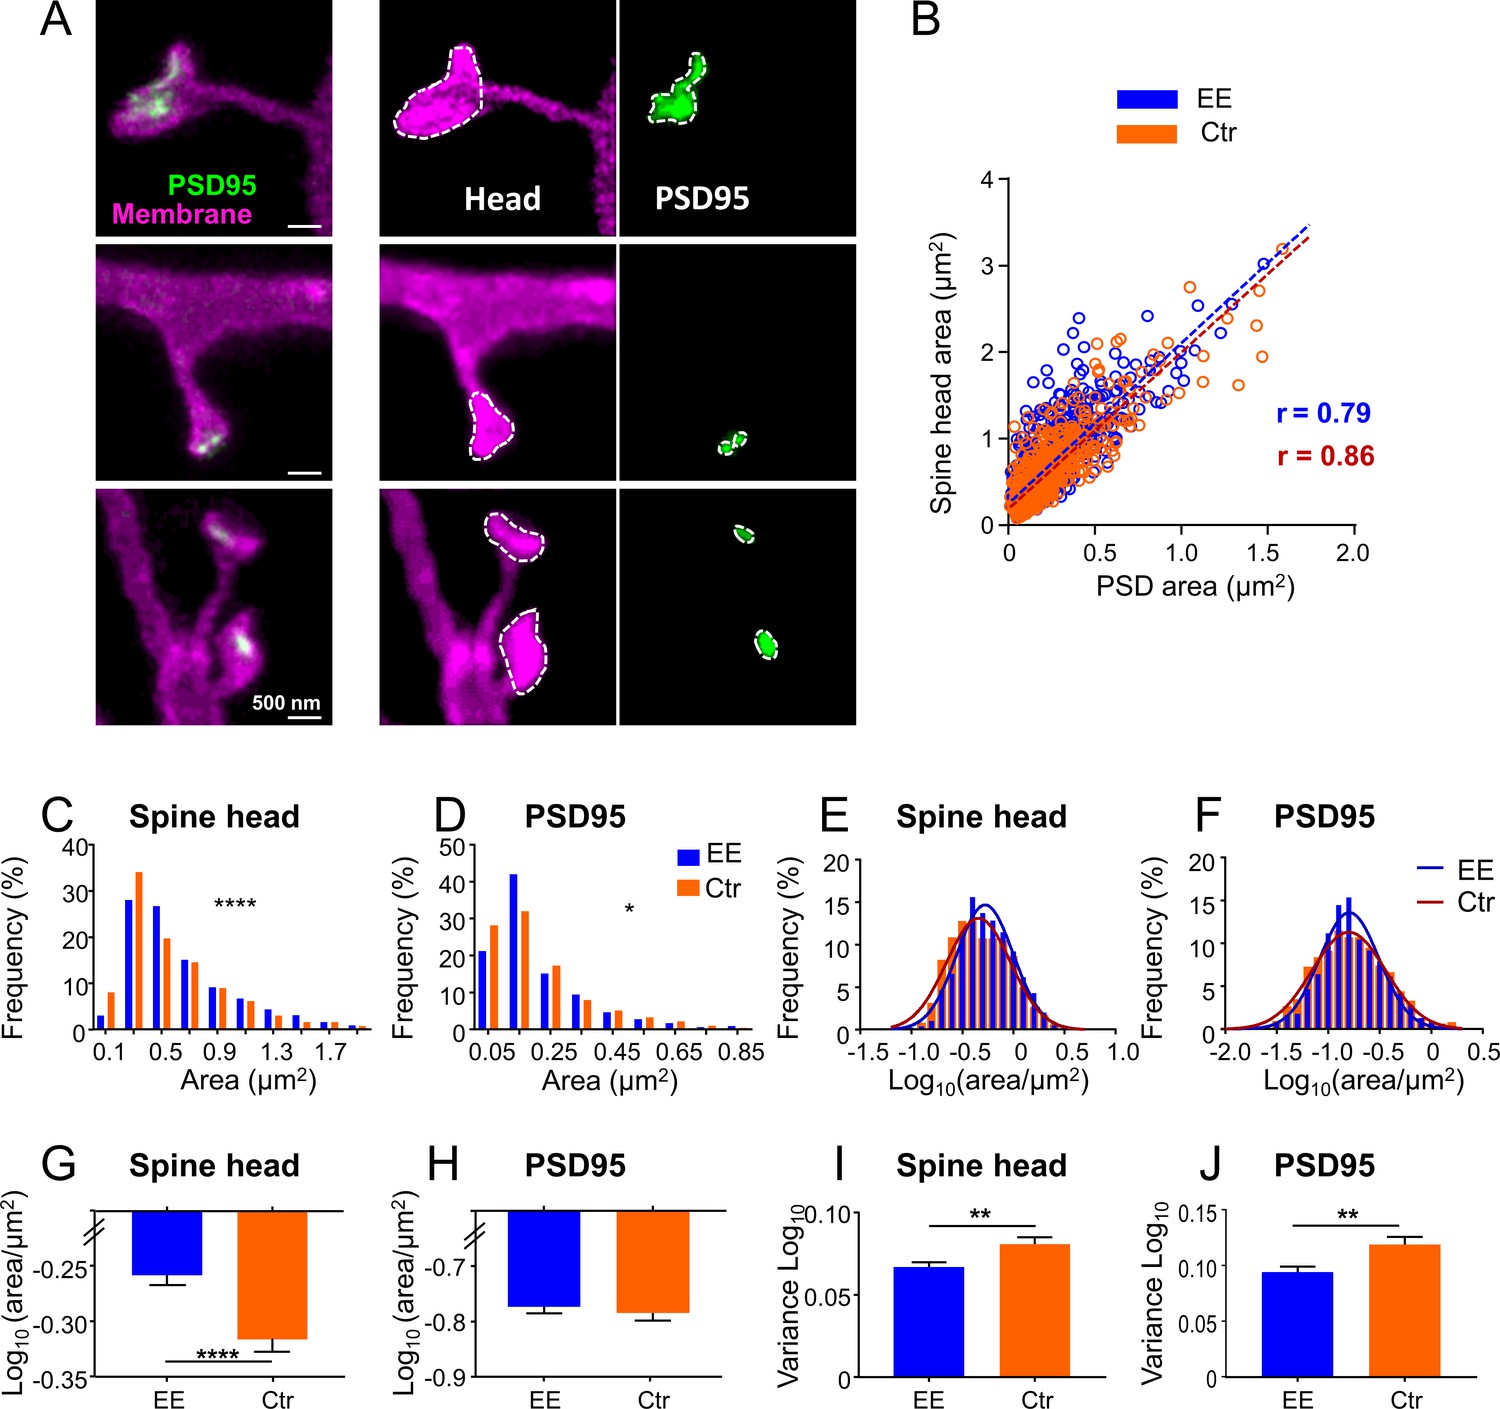
Size distributions of spine head and PSD95 area are sharper and show larger heads for mice housed in environmentally enriched (EE) than in standard (control [Ctr]) cages.
(A) Stimulated emission depletion (STED) images of dendritic spines (magenta) and associated PSD95 assemblies (green). Images are smoothed; maximum intensity projection (MIP) (left), contrast enhanced images for area analysis (middle, right). Spine heads (middle) and PSD95 assemblies (right) were encircled to compute the area. (B) Strong correlation of absolute spine head and PSD95 area in Ctr (orange) and EE (blue) housed mice. Linear regression lines are dashed and Pearson’s correlation coefficient r is displayed (EE and Ctr, deviation from zero: p < 0.0001). (C, D) Frequency distributions of spine head area (C) and PSD95 area (D) are positively skewed and significantly different between EE and Ctr housed mice (Kolmogorov-Smirnov test, C: ****p < 0.0001, D: *p = 0.013). Graphs display center of BIN, single large values are cut off. (E, F) Same data as shown in (C, D), but logarithmic values. Solid lines represent Gaussian functions fitted to the respective histogram. (G–J) Mean (G: EEspine: –0.259, Ctrspine: –0.317, H: EEPSD: –0.771, CtrPSD: –0.781) and variance (I, J) of logarithmic data shown in (E, F) + SEM (unpaired t-test with Welch’s correction: G: ****p < 0.0001, H: p = 0.54, I: **p = 0.006, J: **p = 0.003). Number of analyzed mice and spines: EE: 4x ♀-mice, nSpine/PSD95 = 795; Ctr: 4x ♀-mice, nSpine/PSD95 = 634.
-
Figure 2—source data 1
Spine head and PSD95 assembly sizes.
- https://cdn.elifesciences.org/articles/73603/elife-73603-fig2-data1-v2.xlsx
Figure 2—figure supplement 1
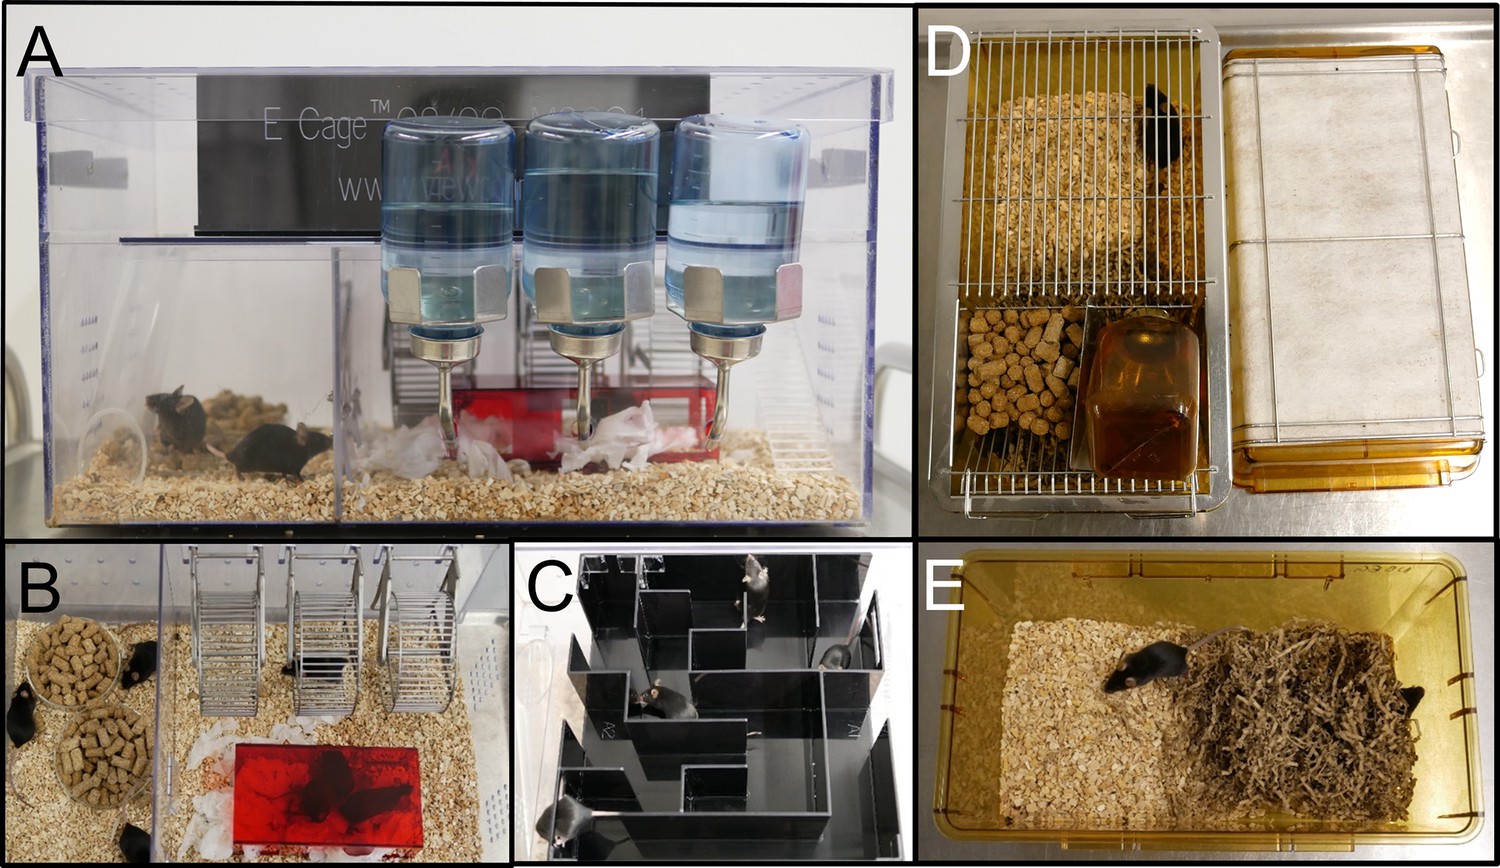
Housing conditions for enriched environment (EE) and control (Ctr) mice.
(A–C) Standardized environmental enrichment cage design in the commercially available Marlau cage; dimension: 570 × 370 × 320 mm3, 2 floors connected by a ladder and a tube. The cage contains three running wheels, a red house, nesting material (B) and on the second floor a maze (C), which is changed three times a week. (D, E) Ctr mice are raised in a standard cage of 365 × 207 × 140 mm3 (floor area 530 cm2) with nesting material only.
Figure 2—figure supplement 2
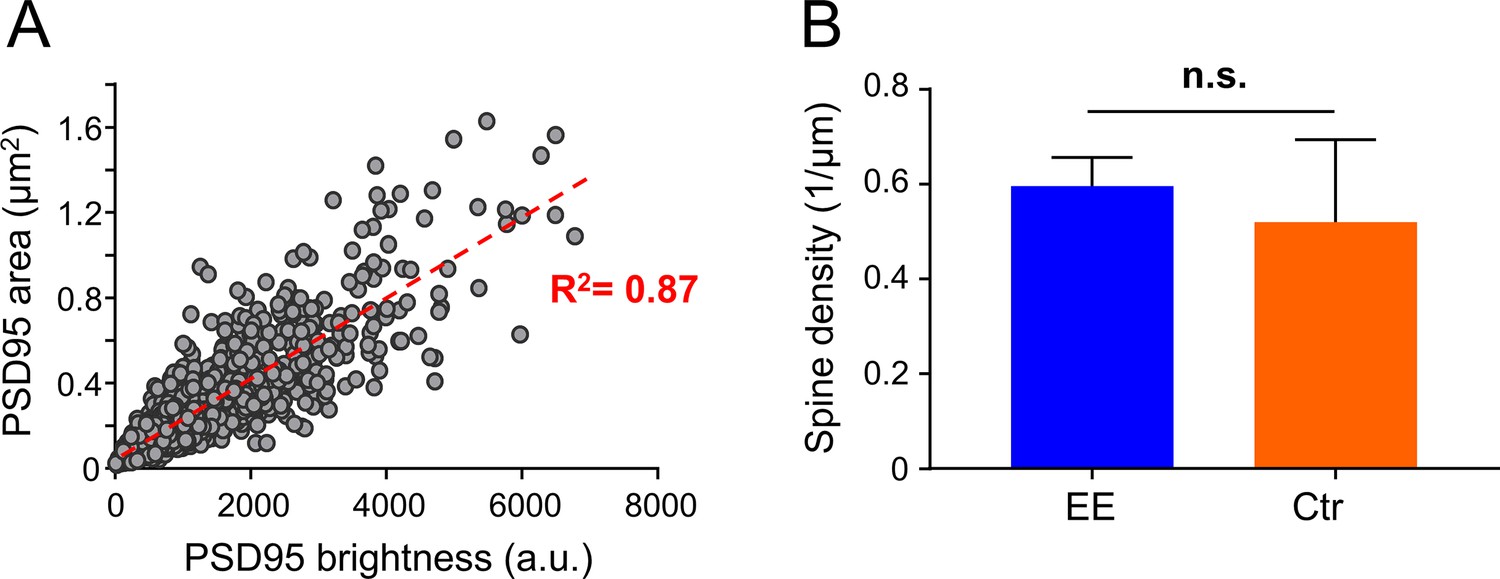
Correlation between PSD95 area and brightness; spine density.
(A) Analysis of PSD95 brightness. Correlation of all environmental enrichment (EE) and control (Ctr) PSD95 areas in µm2 and corresponding PSD95 brightness in arbitrary units (a.u.). The red dashed line represents a linear regression fit. Data of eight mice and in total n = 1763 post-synaptic densities (PSDs). (B) Spine density. Spine density in layer 1 of the visual cortex is not significantly different between EE and Ctr. Bars show median +95% CI (Mann-Whitney U test, p = 0.68). 4x ♀mice per group and nCtr = 59, nEE = 99 dendrites were analyzed.
Figure 3 with 1 supplement
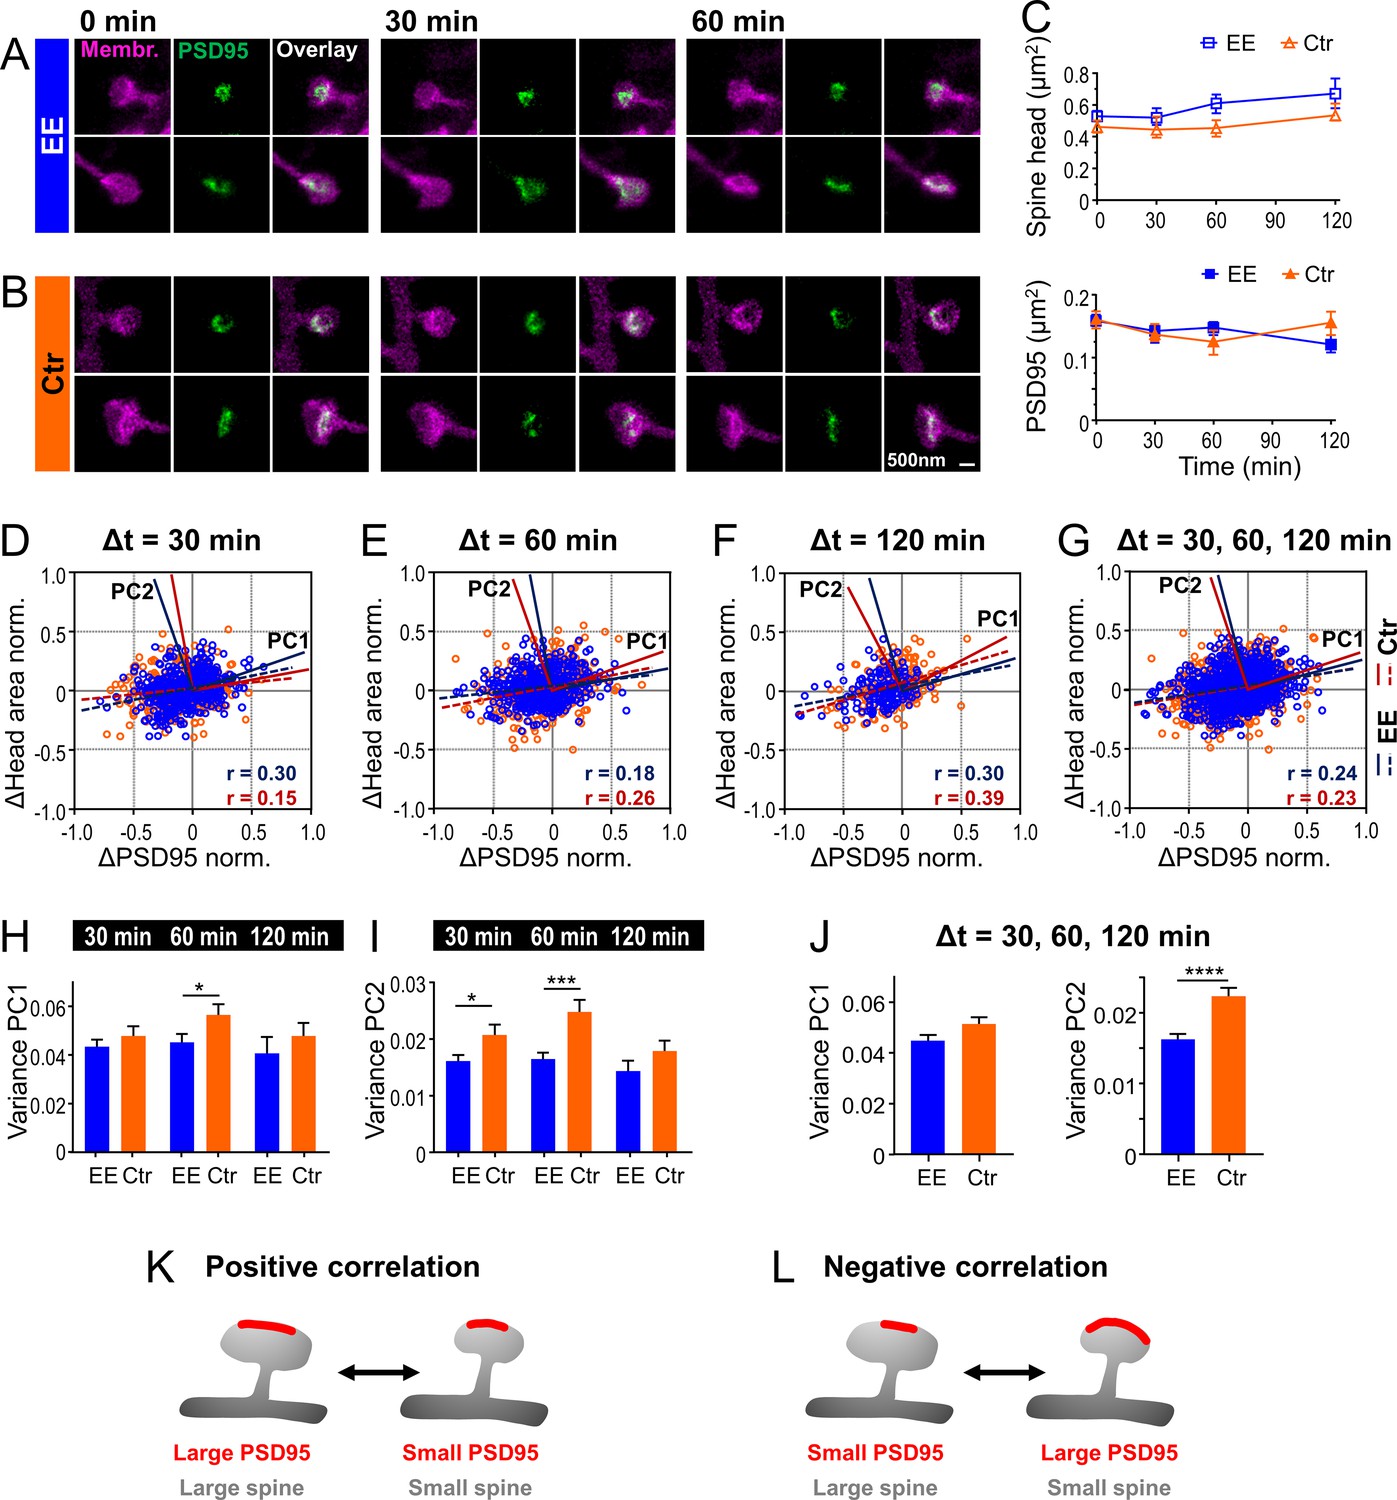
Temporal changes of spine head and PSD95 area are weakly positively correlated with a larger variability for control (Ctr) than environmental enrichment (EE) housed mice.
(A, B) Representative sections of spine heads and corresponding PSD95 of time-lapse in vivo two-color stimulated emission depletion (STED) microscopy images for EE (A) and Ctr (B) housed mice at time points of 0, 30, and 60 min. Images are smoothed and shown as maximum intensity projection (MIP). (C) Median ±95% confidence interval (CI) of spine head and PSD95 areas of Ctr (triangle, orange) and EE (square, blue) housed mice over time. (D–G) Normalized changes in spine head and PSD95 area after 30 min (D), 60 min (E), and 120 min (F) time intervals and compiled changes of all time intervals (G). Linear regression lines are dashed (deviation from zero: p < 0.0001) and Pearson’s correlation coefficient r is displayed. Solid lines represent the principal components 1 and 2 (PC1, PC2) of the principal component analysis (PCA) for Ctr (red) and EE (blue), respectively. (H–J) Variance along PC1 and PC2 of normalized changes plotted in (D–G); variance of PC1 (H), PC2 (I), and compiled variance over all time intervals (J) + SEM (unpaired t-test EE vs. Ctr; H: 30 min: p = 0.36, 60 min: *p = 0.045, 120 min: p = 0.40; I: 30 min: *p = 0.027, 60 min: ***p < 0.001, 120 min: p = 0.17; J: PC1: p = 0.063, PC2: ****p < 0.0001). (K, L) Illustration of temporal changes between spine head size and PSD95 area; positive correlation (K): growth and shrinkage of spine head size and area of PSD95 assemblies goes hand-in-hand; negative correlation (L): a growing PSD95 assembly on a shrinking spine and vice versa (K). (C–J) Number of analyzed mice and spines: 4x ♀-mice for EE and 4x ♀-mice for Ctr; number of spines with PSD95 assemblies: EE, t = 0: nSpine/PSD95 = 795, t = 30 min: 326, t = 60 min: 388, t = 120 min: 151; Ctr, t = 0: 634, t = 30 min: 233, t = 60 min: 285, t = 120 min: 189. Time intervals are pooled; for example, Δt = 30 min includes 0–30 and 30–60 min.
-
Figure 3—source data 1
Spine head and PSD95 assembly sizes for each time point.
- https://cdn.elifesciences.org/articles/73603/elife-73603-fig3-data1-v2.xlsx
Figure 3—figure supplement 1
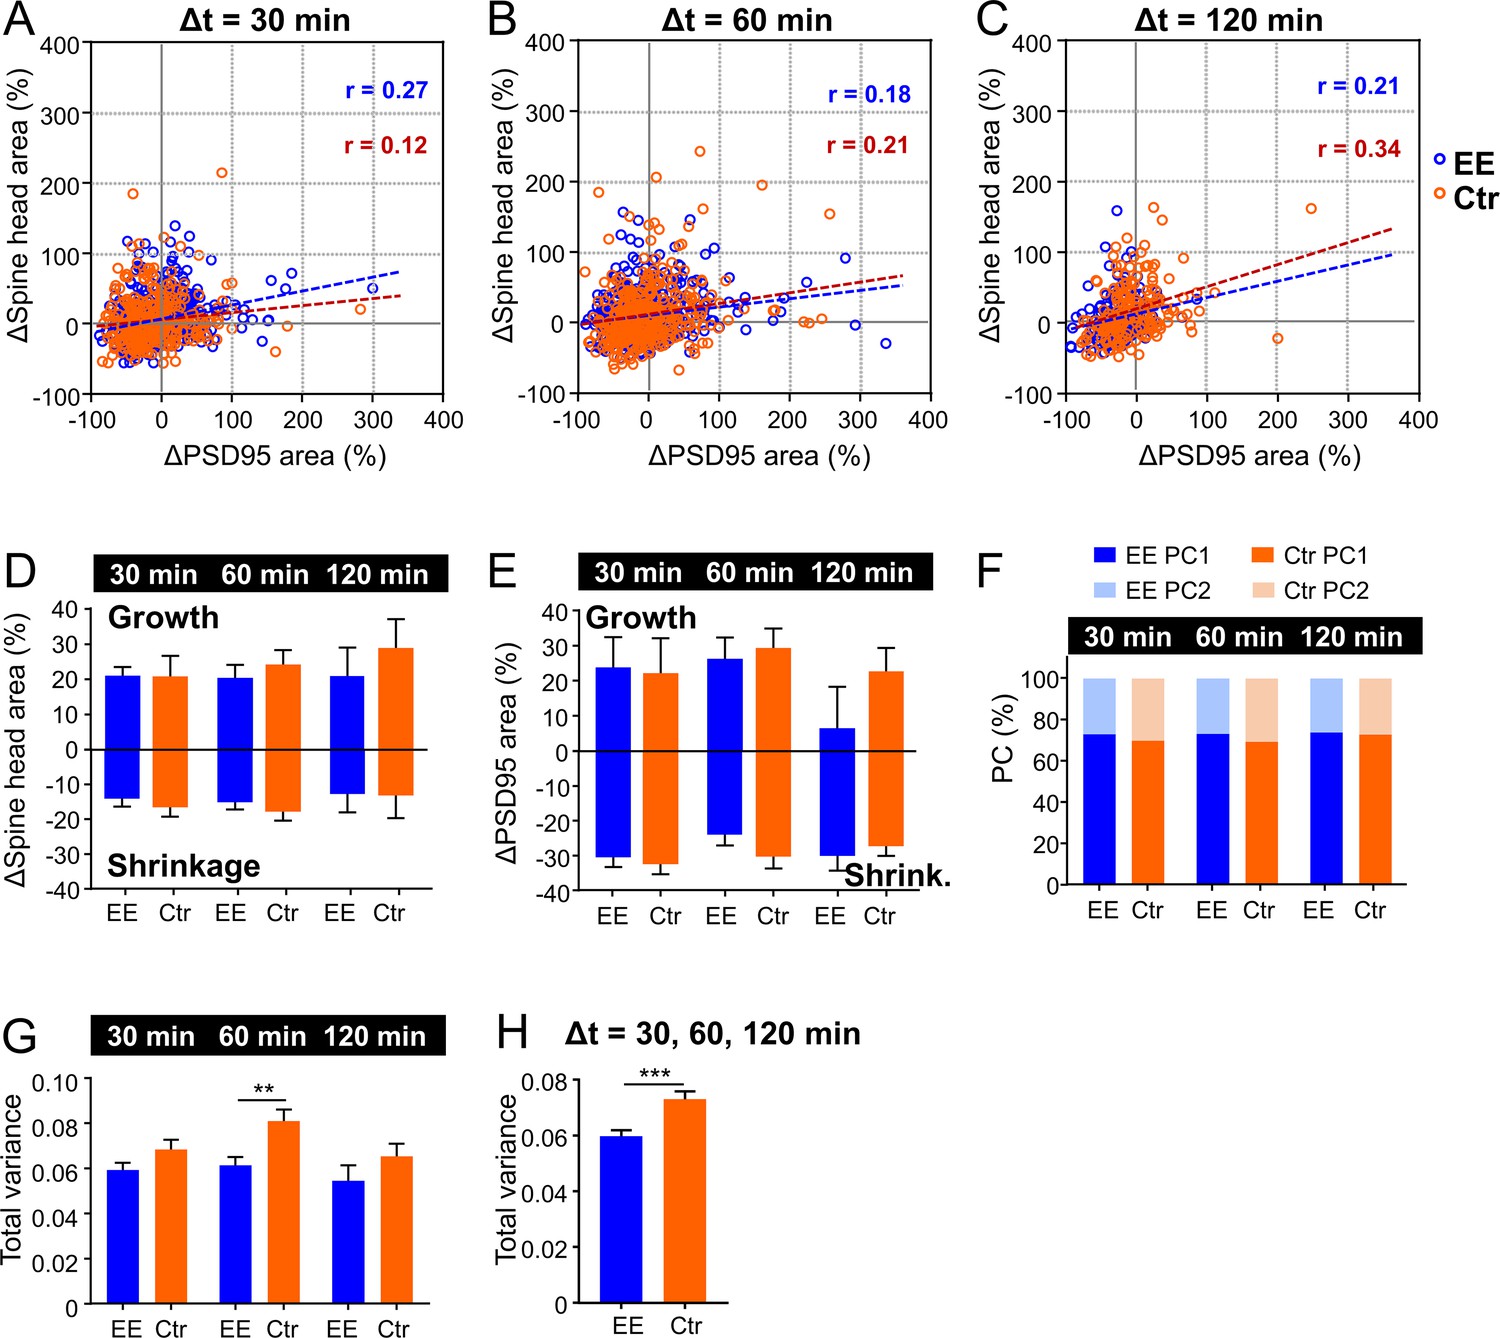
Temporal changes in spine head and PSD95 area over time course.
(A–C) Scatter plot of percentage changes over time intervals of 30, 60, and 120 min. Regression lines are dashed and Pearson’s correlation coefficient r is displayed (deviation from zero: p < 0.0001). (D, E) Average percentage change of growing and shrinking spine head area (D) and PSD95 area (E). (D) Spine head growth: 30 min, environmental enrichment (EE): 21%, control (Ctr): 21%; 60 min, EE: 21%, Ctr: 24%; 120 min, EE: 21%, Ctr: 29% (Kruskal-Wallis with Dunn’s multiple comparisons test; EE: 30 min vs. 60 min: p > 0.99 and vs. 120 min: p > 0.99, Ctr: 30 min vs. 60 min: p > 0.99 and vs. 120 min: p = 0.80); spine head shrinkage: 30 min, EE: –14%, Ctr: –17%; 60 min, EE: –15%, Ctr: –18%; 120 min, EE: –13%, Ctr: –13% (Kruskal-Wallis with Dunn’s multiple comparisons test; EE: 30 min vs. 60 min: p > 0.99 and vs. 120 min: p > 0.99, Ctr: 30 min vs. 60 min: p > 0.99 and vs. 120 min: p > 0.99). Neither growth nor shrinkage show a significant change over time. The average percentage spine head growth is not different between EE and Ctr (Kruskal-Wallis with Dunn’s multiple comparisons test; spine head, EE vs. Ctr for 30, 60, 120 min: p > 0.90), neither is the average shrinkage (Kruskal-Wallis with Dunn’s multiple comparisons test; spine head, EE vs. Ctr for 30, 60, 120 min: p > 0.10). (E) PSD95 growth: 30 min, EE: 24%, Ctr: 22%; 60 min, EE: 26%, Ctr: 29%; 120 min, EE: 6%, Ctr: 23%; PSD95 shrinkage: 30 min, EE: –30%, Ctr: –33%; 60 min, EE: –24%, Ctr: –30%; 120 min, EE: –30%, Ctr: –27%. Plots show median +95% CI. (F) Relative percentage of principal component 1 (PC1) and PC2 of total variance. Data from Figure 3H, I. (G, H) Mean of total variance of normalized changes of PSD95 assemblies and spine head area as plotted in Figure 3D–F for each time interval (G) and compiled variance (H) + SEM (unpaired t-test EE vs. Ctr; G: 30 min: p = 0.088, 60 min: **p = 0.0015, 120 min: p = 0.23; H: ***p < 0.001). (A–H) The same data set as in Figure 3D–G was analyzed.
Figure 4 with 1 supplement
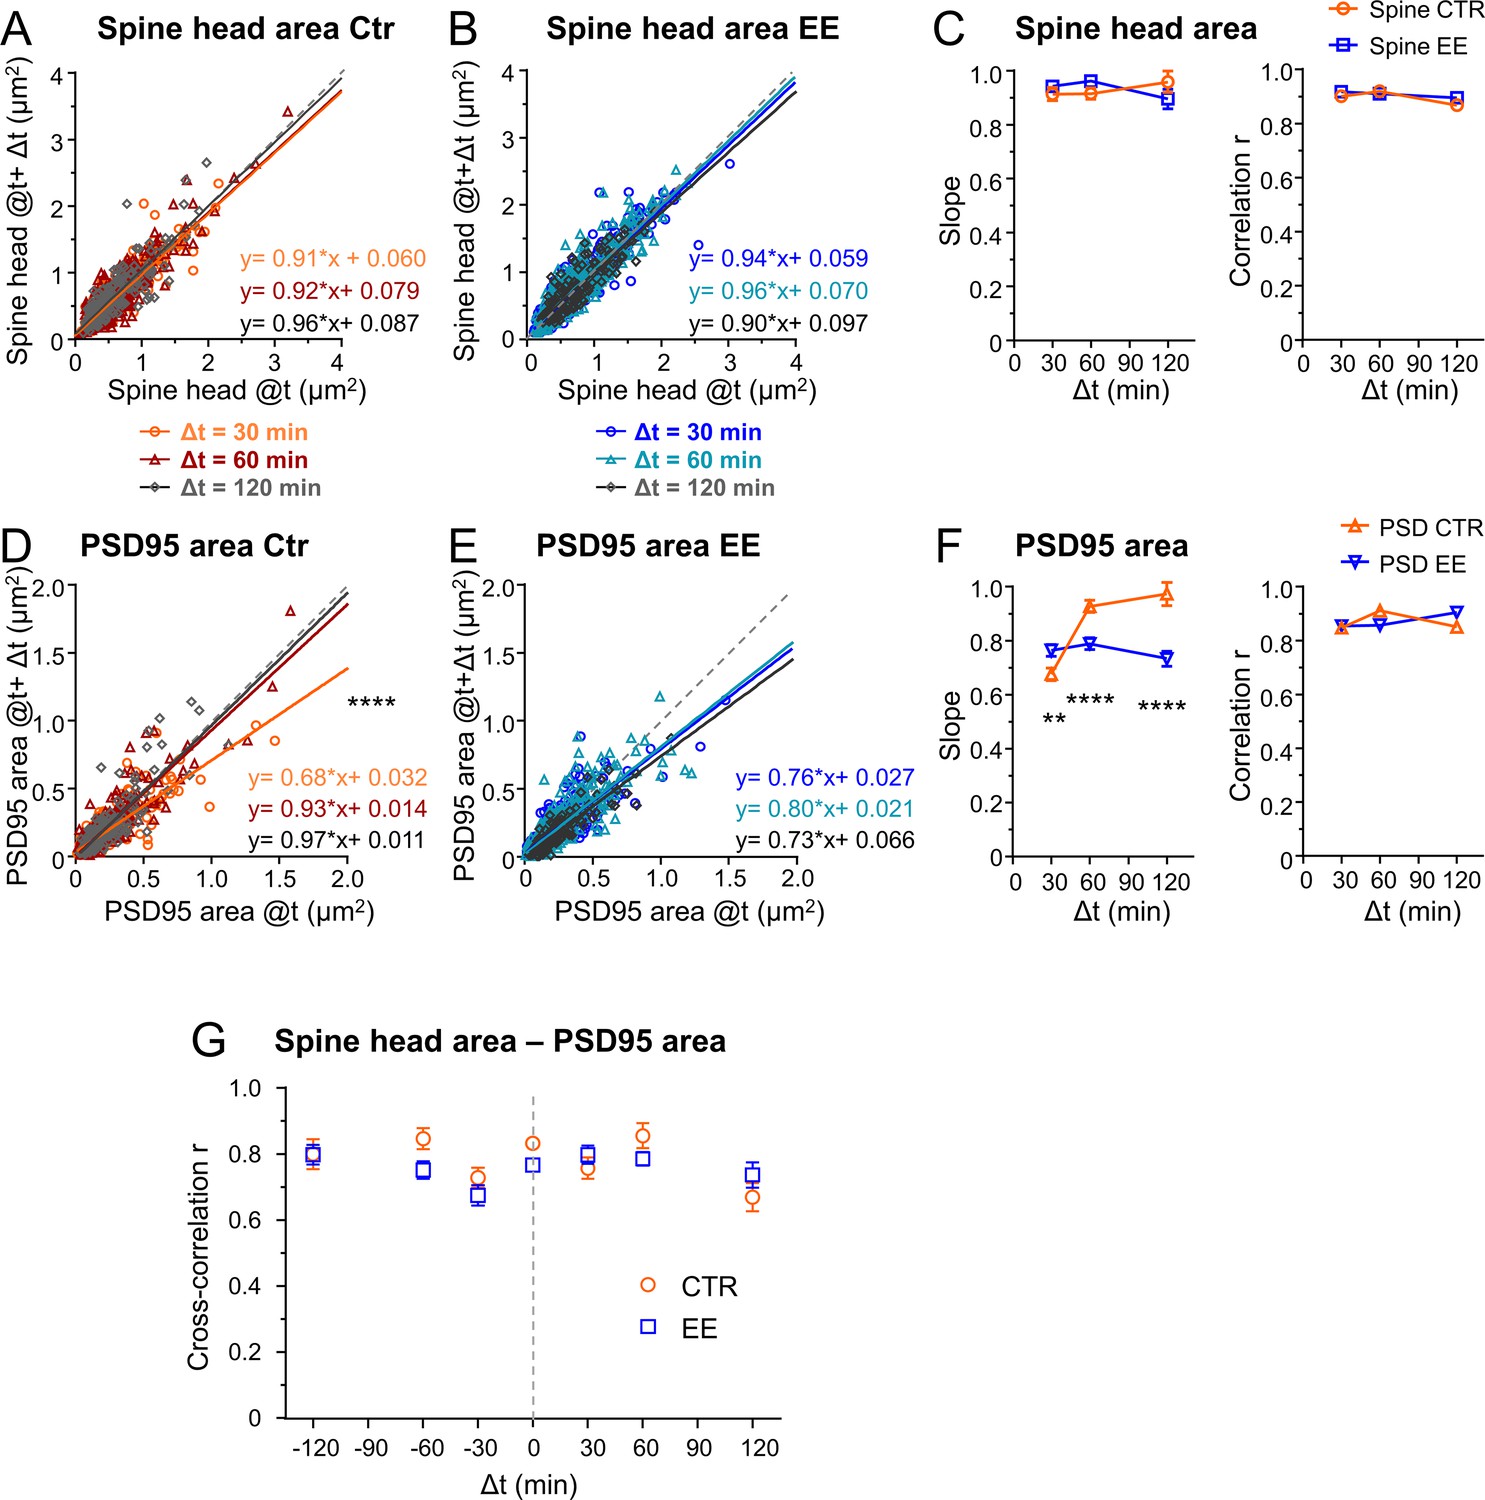
Environmental enrichment (EE) housed mice show an increase in multiplicative downscaling of PSD95 area over control (Ctr).
(A–F) Spine head and PSD95 area after different time intervals Δt of 30, 60, and 120 min as function of their initial area at time t (A, B, D, E). Solid lines show linear regression fits of the displayed equation; the identity line is dashed (analysis of covariance; are slopes equal? A: p = 0.53, B: p = 0.29, D: ****p < 0.0001, E: p = 0.39). (C) Slope ± SE of fit to spine head changes (A, B) (left, are slopes different? EE vs. Ctr: 30 min: p = 0.37, 60 min: p = 0.11, 120 min: p = 0.26) and Pearson’s correlation r (right) of linear regression. (F) Slope ± SE of fit to PSD95 area changes (D, E) (left, are slopes different? EE vs. Ctr: 30 min: **p < 0.01, 60 min: ****p < 0.0001, 120 min: ****p < 0.0001) and r value (right). (G) Cross-correlation between spine head and PSD95 area for EE and Ctr housed mice. Error bars are bootstrap ± SD. Same data set as in Figure 3; the same time intervals Δt are pooled.
Figure 4—figure supplement 1
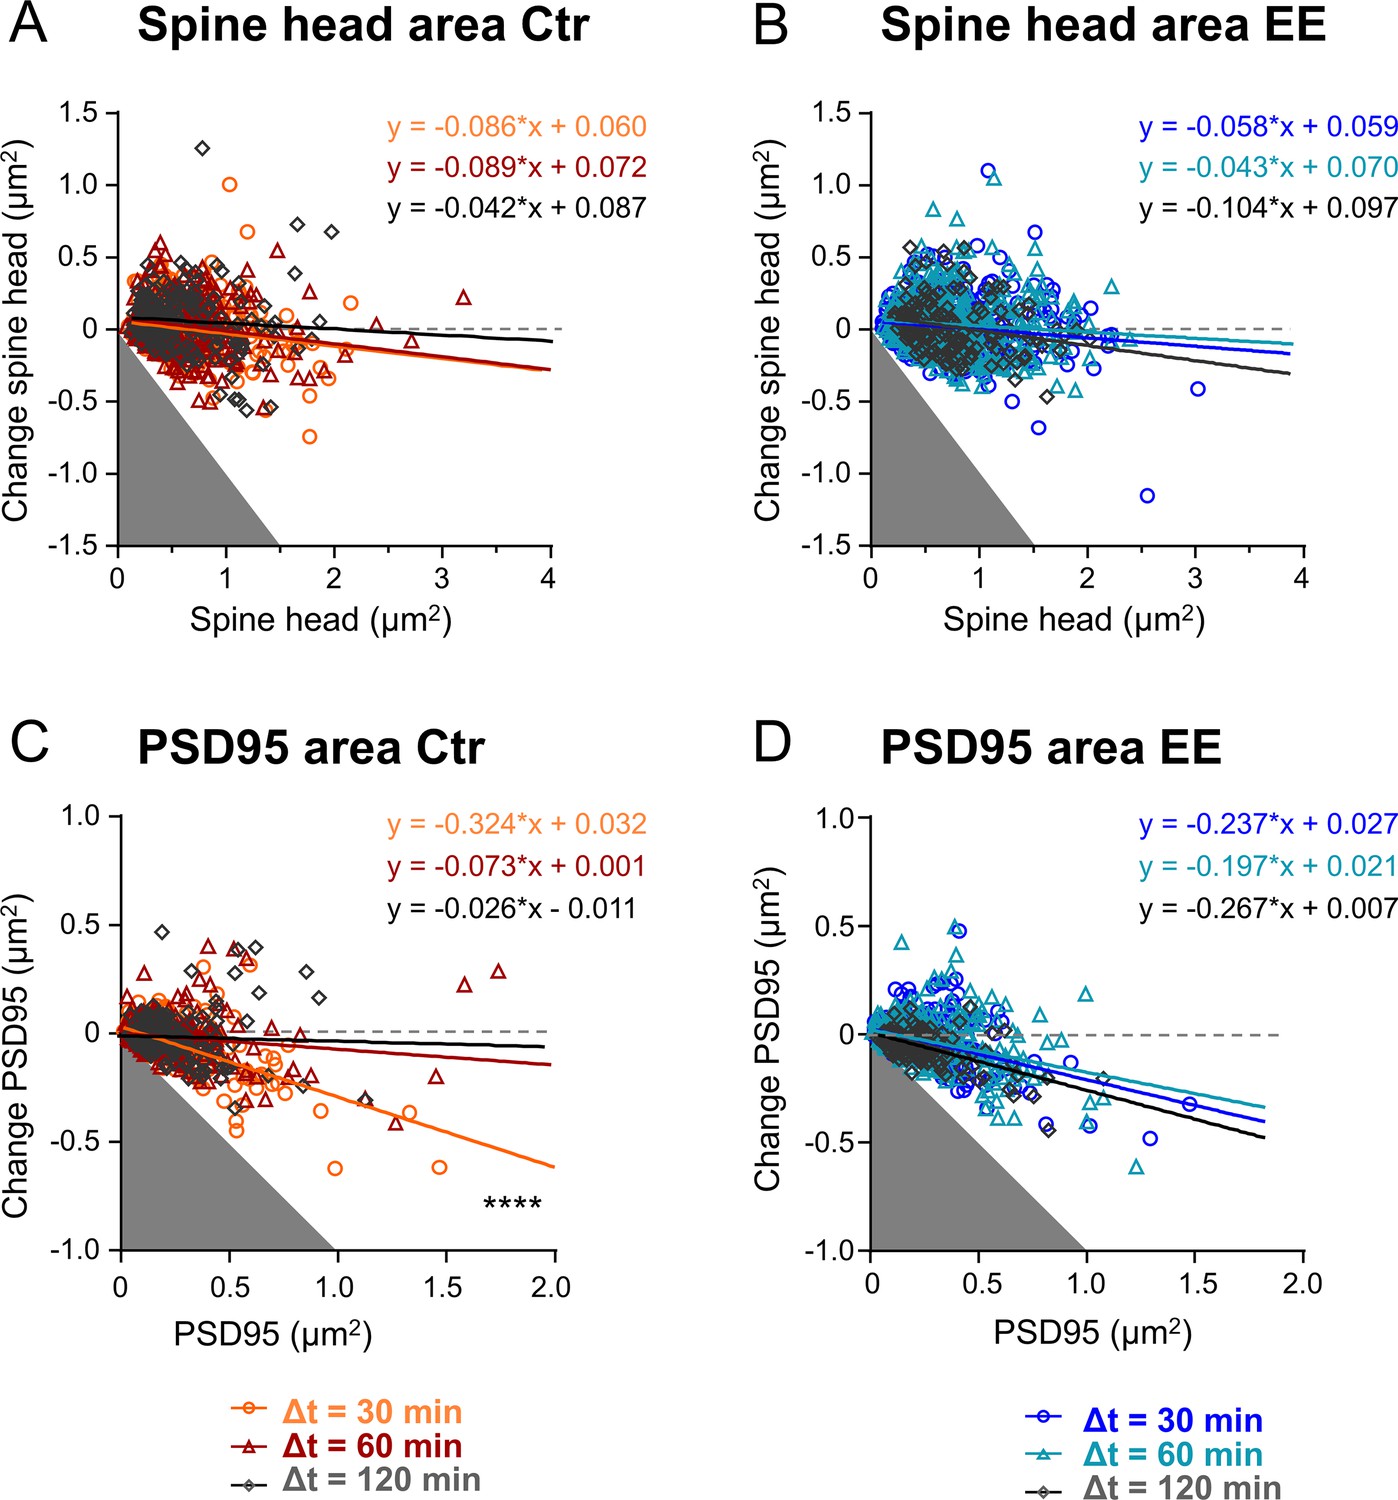
Size changes of environmental enrichment (EE) and control (Ctr) housed mice.
(A–D) Changes in area after time intervals Δt of 30, 60, and 120 min plotted as a function of their area at time point t for spine head area of Ctr housed mice (A), spine head area of EE housed mice (B), PSD95 area of Ctr housed mice, (C) and PSD95 area of EE housed mice (D). Straight lines show linear regression fit of the displayed equation. Analysis of covariance, slopes equal? A: P = 0.48, B: p = 0.35, C: ****p < 0.0001, D: p = 0.18. Same data as Figure 4.
Figure 5
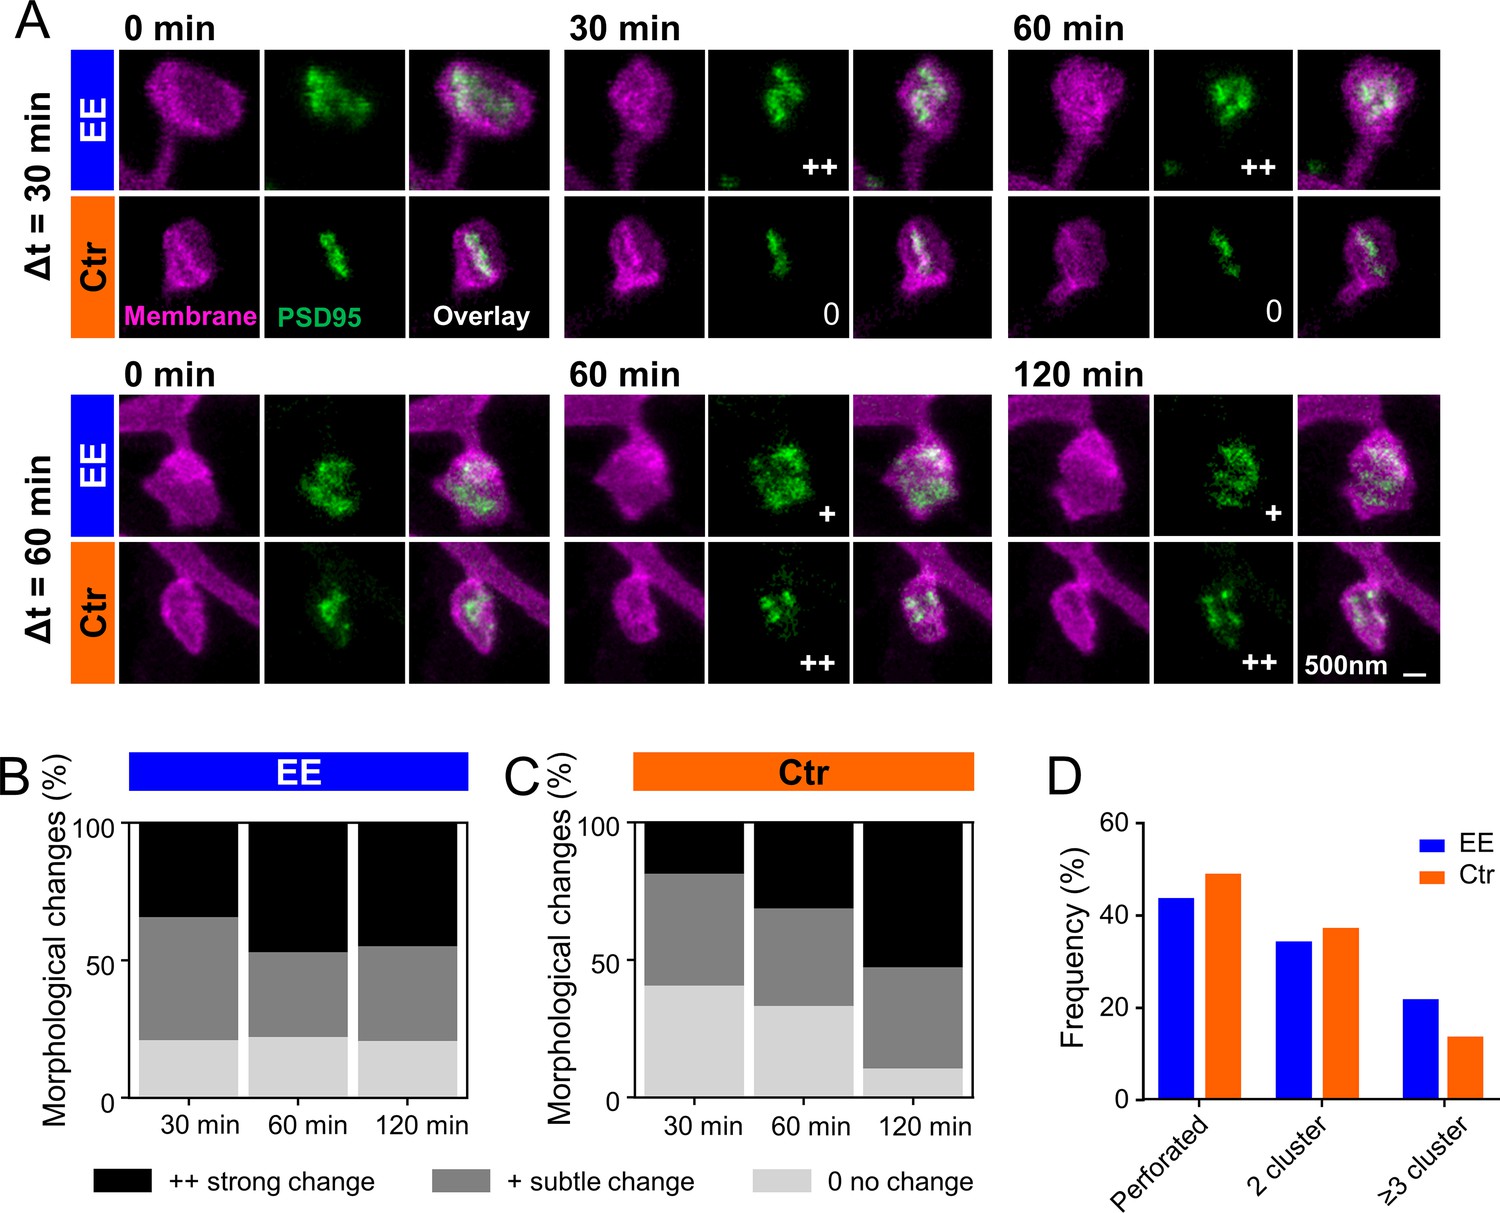
PSD95 nanopattern is different between environmental enrichment (EE) and control (Ctr) and changes faster for EE housed mice.
(A) Sections of two-color stimulated emission depletion (STED) images (smoothed, maximum intensity projection [MIP]) of EE and Ctr housed mice at the indicated time points showing the spine membrane (magenta) and PSD95 (green). Morphological change is indicated with: 0 = no change; + = subtle change; ++ = strong change. (B, C) Stacked histogram of the relative frequency of morphological changes in PSD95 nanopattern in EE (B) and Ctr (C) housed mice; all changes refer to t = 0 min. (D) Morphometry of PSD95 nanopattern of EE and Ctr housed mice at t = 0. (B–D) Number of analyzed PSD95 assemblies in EE: 30 min: n = 38, 60 min: n = 68, 120 min: n = 29; Ctr: 30 min: n = 27, 60 min: n = 48, 120 min: n = 38.
-
Figure 5—source data 1
Images of all analyzed perforated PSD95 assemblies.
- https://cdn.elifesciences.org/articles/73603/elife-73603-fig5-data1-v2.pdf
Author response image 1
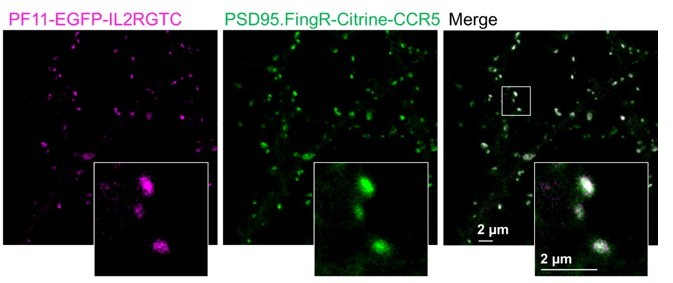
Double labelling of PSD95 with two different intrabodies, PSD95.Fing and PF11.
PF11 recognizes palmitoylated PSD95 (Fukata et al., 2013) and was cloned with the hSyn promoter and the orthogonal transcriptional regulation IL2RGTC (Gross et al., 2013) in the same pAAV backbone as PSD95.FingR. PF11 fused to EGFP and PSD95.FIngR fused to Citrine were co-expressed in cultured hippocampal neurons as described in (Wegner et al., 2017) and imaged with our two-color setup in confocal mode. Both labels show a very high degree of co-localization. Of note, in our hands the expression level of PF11 was not bright enough to record superresolution STED images but PSD95 nanodomains with PF11 labeling were shown in (Fukata et al., 2013). PF11 was a gift from Masaki Fukata, National Institute for Physiological Sciences, Japan.
Author response image 2
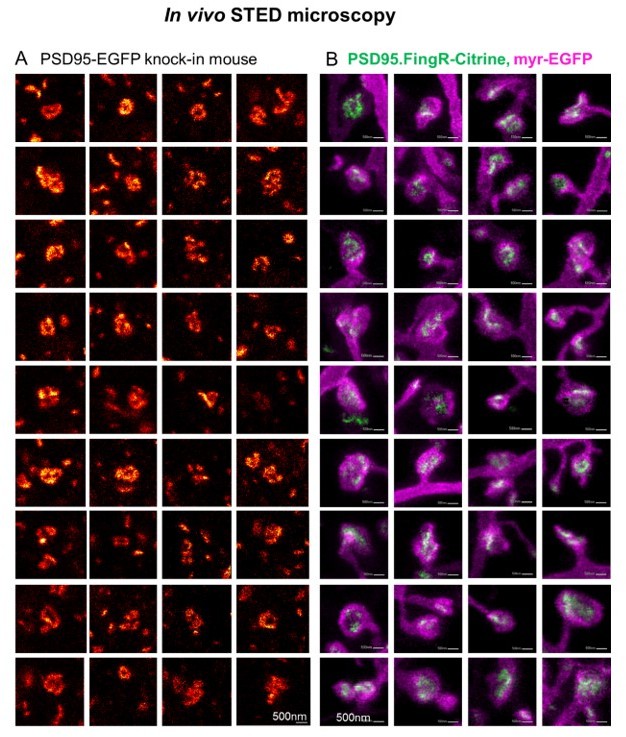
Side-by-side comparison of two different labelling schemata of PSD95 imaged by in vivo STED microscopy.
(A) Selection of PSD95 assemblies showing a nanopattern of PSD95-EGFP knock-in mouse as published in the supplementary material of (Wegner et al., 2018). (B) PSD95.FingR-Citrine (green) and membrane label (magenta) which were analyzed for Figure 5, this manuscript (Images are included in Figure 5–source data 1). (A, B) All images were recorded in the visual cortex of an anaesthetized mouse. The PSD95 nanopattern of the EGFP knock-in mouse (A) and viral expression of PSD95.FingR-Citrine (B) are very similar.
Author response image 3
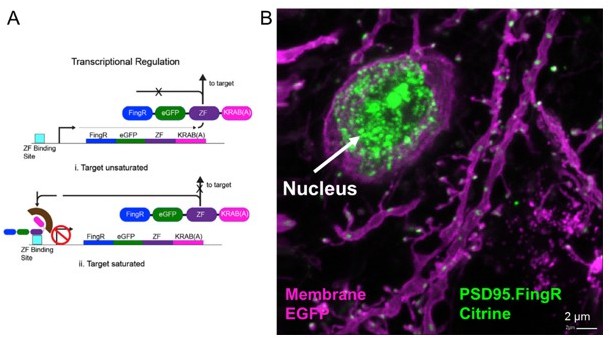
Transcriptional regulation of PSD95.FingR.
(A) PSD95.FingR expression is controlled by a negative feedback regulation so that once endogenous PSD95 binding sites are saturated, unbound PSD95.FingR moves to the nucleus due to a nuclear localization sequence that is part of the CCR5 zinc finger domain. Binding of the repressor KRAB-A to the promoter via the zinc finger inhibits further transcription and expression of PSD95.FingR. Thus we expect a similar brightness of the PSD95.FingR label when in saturation. Adapted from Figure 3G in (Gross et al., 2013). (B) After an in vivo experiment the mouse was perfused and the brain was sliced. A confocal image of layer 5 cortex shows a bright Citrine label of unbound PSD95.FingR in the nucleus indicating that the PSD95 binding sites in this pyramidal neuron were saturated. Since all measurements were performed at the same conditions we expect a similar brightness of PSD95 in all images.
Author response image 4

PSD95 assembly size from in vivo STED measurements in layer 1 mouse visual cortex for different cell types.
(A) Size/length measurement of ubiquitous PSD95 assemblies of a PSD95-EGFP knock-in mouse as published in Wegner et al., 2018. (B) Average of length and width of PSD95 assemblies of layer 5 pyramidal neurons labeled with PSD95.FingR. Data set Ctr mice, first time point.
Author response image 5
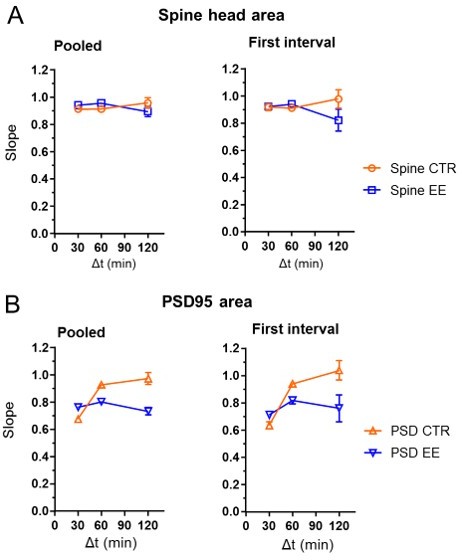
Slope of the linear regression as shown in the manuscript Fig.4C, F for pooled data and first time interval only.
The pooled data includes 0–30 min and 30–60 min data for Δt = 30 min. Δt = 60 min includes 0–60 min and 60–120 min of the hourly measurement interval and 0–60 min of the half hour measurement series. Pooled data for Δt = 120 min includes 0–120 min of the 2 hour time interval measurement and 0–120 min of the hourly measurement series. For comparison, we computed the linear regression for the first interval only, which are 0–30 min, 0–60 min and 0–120 min (right). There were no major differences between the pooled data (left) and the data for the first interval (right), except for a much larger error bar for the 120 min interval..
Tables
Table 1
Overview of the primers and endonucleases.
a: produced by PCR, b: generated by hybridization, P: phosphorylated; underlined nucleotides: restriction sites or part of them.
| Target construct | Primer | Restriction sites | DNA-insert |
|---|---|---|---|
| pAAV-hSyn-DIO-myrEGFP-LDLR(Ct) | 5´- agttatgctagcatgggctgtgtgcaatgtaaggataaag aagcaacaaaactgacgatggtgagcaagggcgaggag –3´ | NheI | Myristol (myr)-EGFPa |
| 5´- cgcaccggtcttgtacagctcgtccatg-3´ | AgeI | ||
| P-5´-ccggtcggaactggcgcctgaagaatatcaacagc atcaatttcgataaccccgtgtaccagaagaccacagaggat –3´ | AgeI | LDLR(Ct)-part1b | |
| P-5´-cagctcatcctctgtggtcttctggtacacggggttatcgaaa ttgatgctgttgatattcttcaggcgccagttccga –3´ | AgeI | LDLR(Ct)-part1b | |
| P-5´-gagctgcacatttgcaggtcccaagacgggtacacctatcc aagtcggcagatggtcagcctcgaggacgatgtggcctgagg –3´ | AscI | LDLR(Ct)-part2b | |
| P-5´- cgcgcctcaggccacatcgtcctcgaggctgaccatctgcc gacttggataggtgtacccgtcttgggacctgcaaatgtg –3´ | AscI | LDLR(Ct)-part2b |
Additional files
Download links
A two-part list of links to download the article, or parts of the article, in various formats.
Downloads (link to download the article as PDF)
Open citations (links to open the citations from this article in various online reference manager services)
Cite this article (links to download the citations from this article in formats compatible with various reference manager tools)
Environmental enrichment enhances patterning and remodeling of synaptic nanoarchitecture as revealed by STED nanoscopy
eLife 11:e73603.
https://doi.org/10.7554/eLife.73603


