Mechanical stimulation promotes enthesis injury repair by mobilizing Prrx1+ cells via ciliary TGF-β signaling
- Department of Sports Medicine, Xiangya Hospital, Central South University, China
- Key Laboratory of Organ Injury, Aging and Regenerative Medicine of Hunan Province, China
- Xiangya Hospital-International Chinese Musculoskeletal Research Society Sports Medicine Research Centre, China
- Hunan Engineering Research Center of Sport and Health, China
- Department of pediatric orthopedic, Hunan Children's hospital, China
- National Clinical Research Center for Geriatric Disorders, Xiangya Hospital, Central South University, China
- Department of Endocrinology, Xiangya Hospital, Central South University, China
- Department of Spine Surgery, Xiangya Hospital, Central South University, China
- Faculty of Pharmaceutical Sciences, Shenzhen Institute of Advanced Technology, Chinese Academy of Sciences, China
- Department of Orthopedics, Xiangya Hospital, Central South University, China
Figures
Figure 1 with 2 supplements
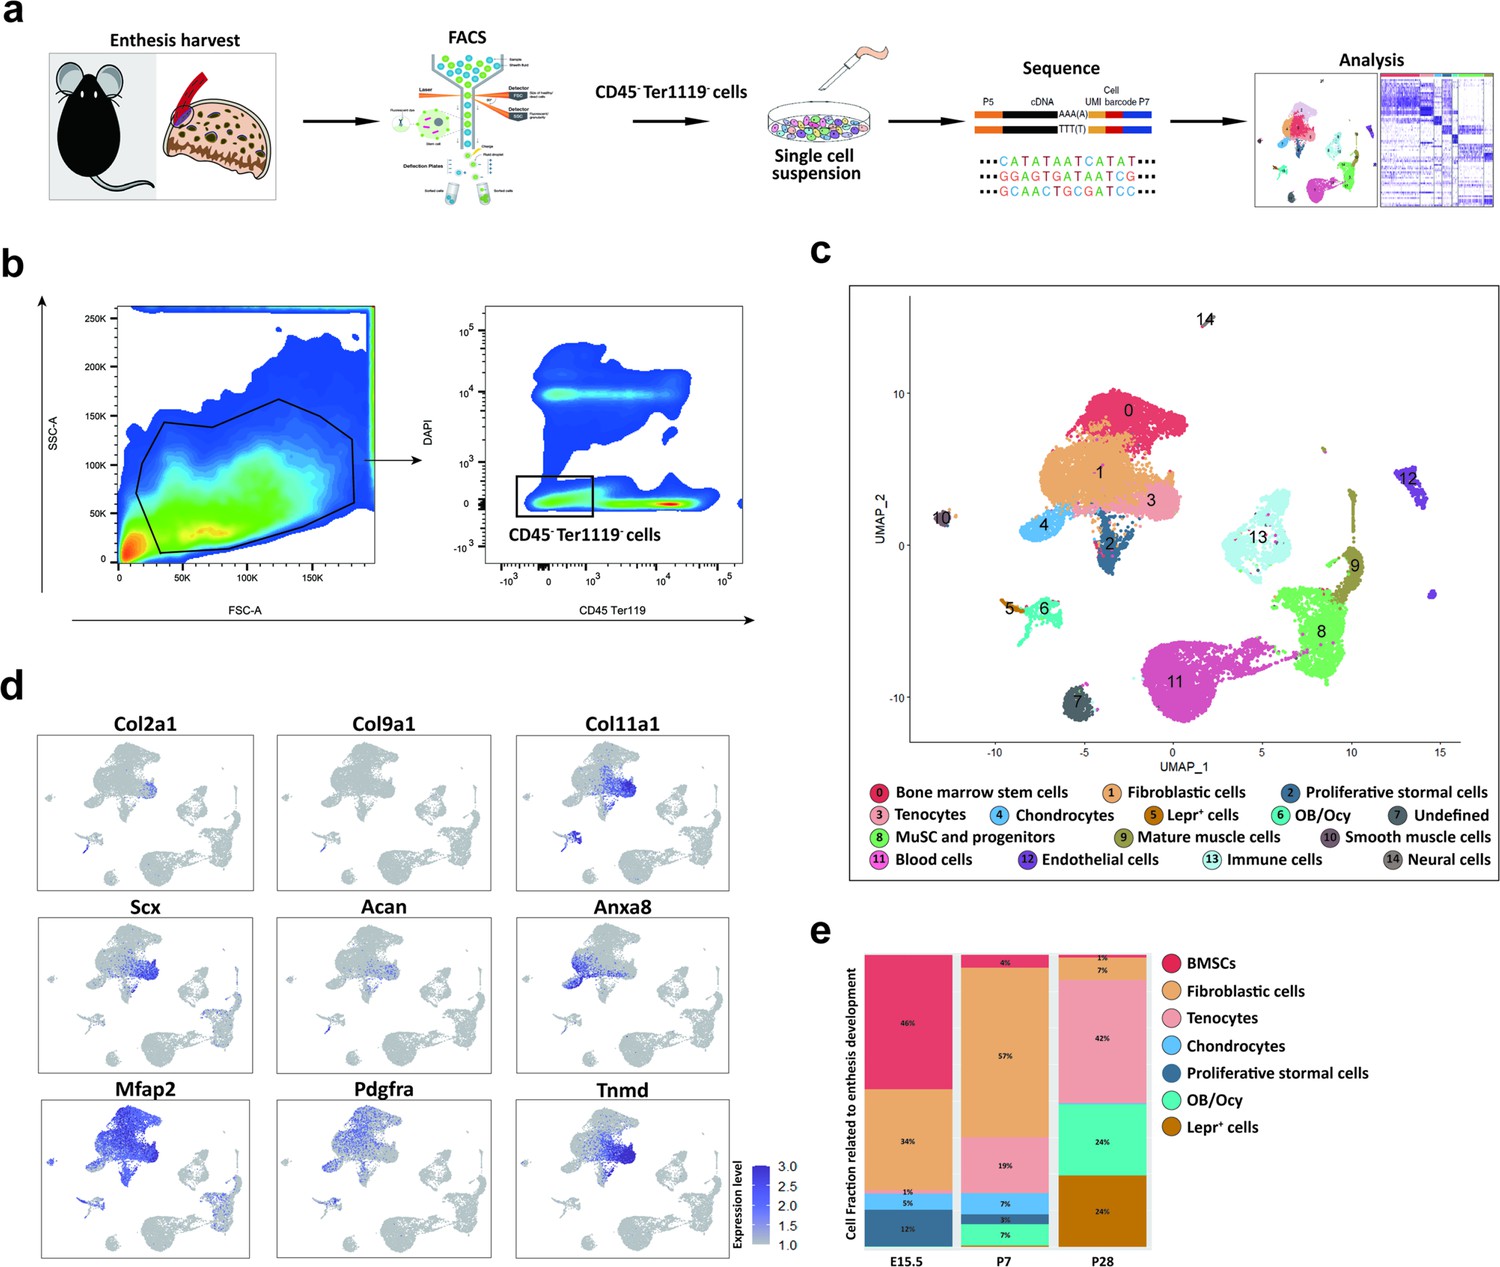
scRNA-seq analysis reveals the cell populations in the developing enthesis.
(a) The flow chart of scRNA-seq analysis. (b) Isolation of CD45-Ter119- cells by FACS. (c) All cell clusters visualized with uniform manifold projection (UMAP). (d) Feature plot of canonical marker genes enriched in clusters defines enthesis related clusters. (e) Enthesis development related cell composition at E15.5, P7, and P28.
-
Figure 1—source data 1
The single-cell matrix data of E15.5 mouse TBI.
- https://cdn.elifesciences.org/articles/73614/elife-73614-fig1-data1-v2.zip
-
Figure 1—source data 2
The single-cell matrix data of 1 w mouse TBI.
- https://cdn.elifesciences.org/articles/73614/elife-73614-fig1-data2-v2.zip
-
Figure 1—source data 3
The single-cell matrix data of 4 w mouse TBI part I.
- https://cdn.elifesciences.org/articles/73614/elife-73614-fig1-data3-v2.zip
-
Figure 1—source data 4
The single-cell matrix data of 4 w mouse TBI part II.
- https://cdn.elifesciences.org/articles/73614/elife-73614-fig1-data4-v2.zip
Figure 1—figure supplement 1
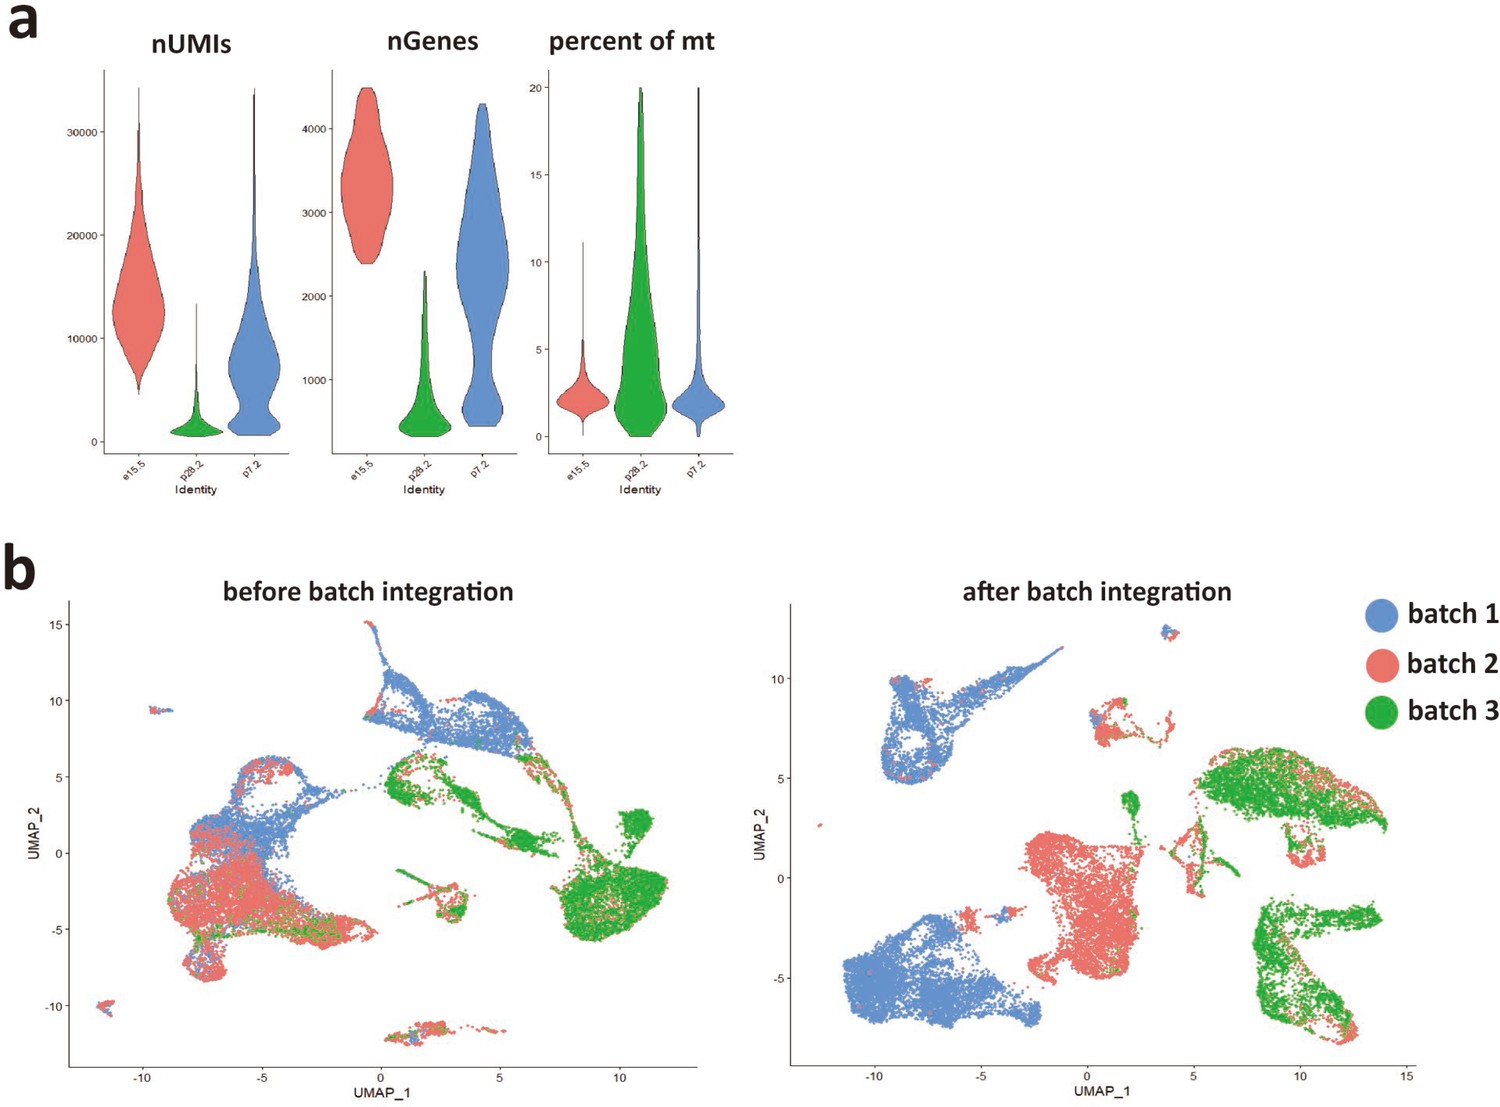
Quality control of unbiased scRNA-seq dataset.
(a) Metrics used to assess the quality of the scRNA-seq libraries. Cells with less than 200 genes and the top 10% cells were removed to minimize multiplet possibility. (b) Batch effect was eliminated after data integration using Seurat.
Figure 1—figure supplement 2
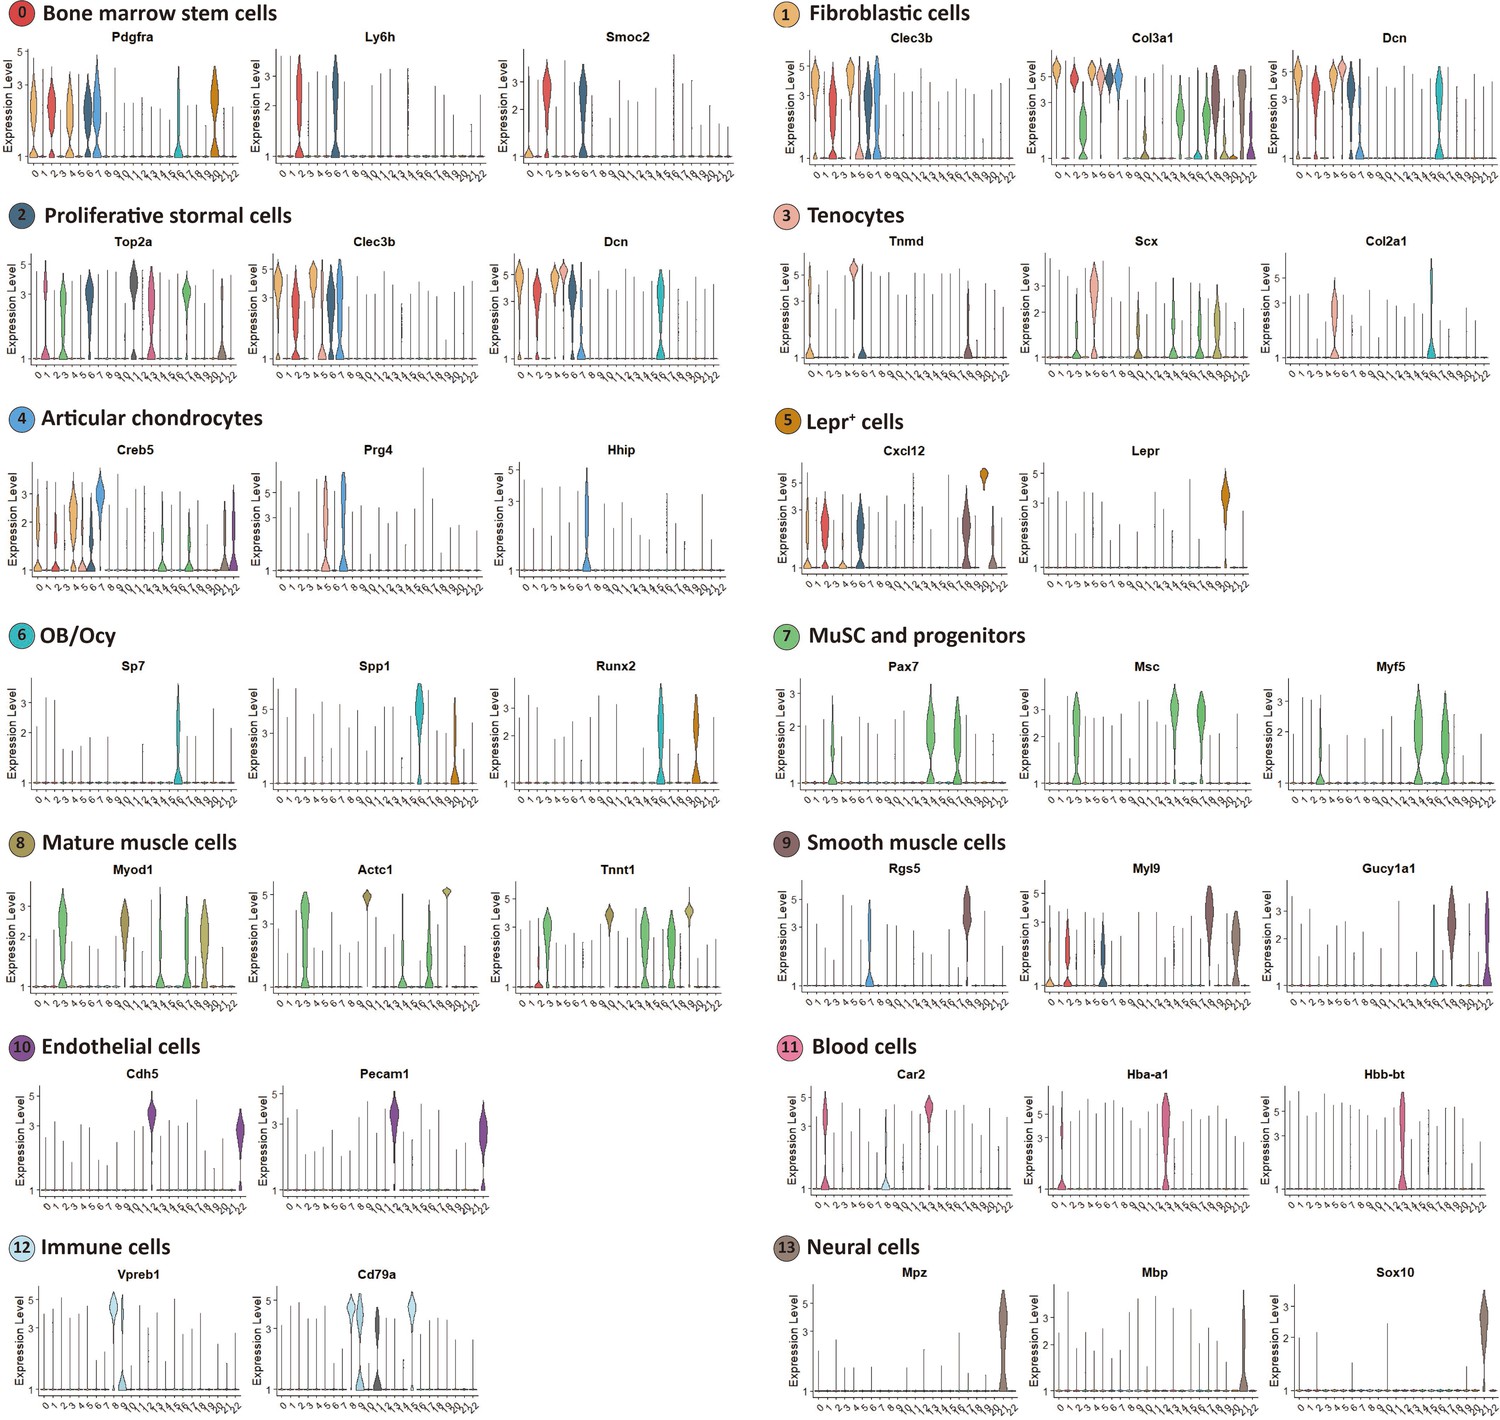
Gene expression defining clusters of E15.5, P7, P28 canonical correlation analysis.
Figure 2
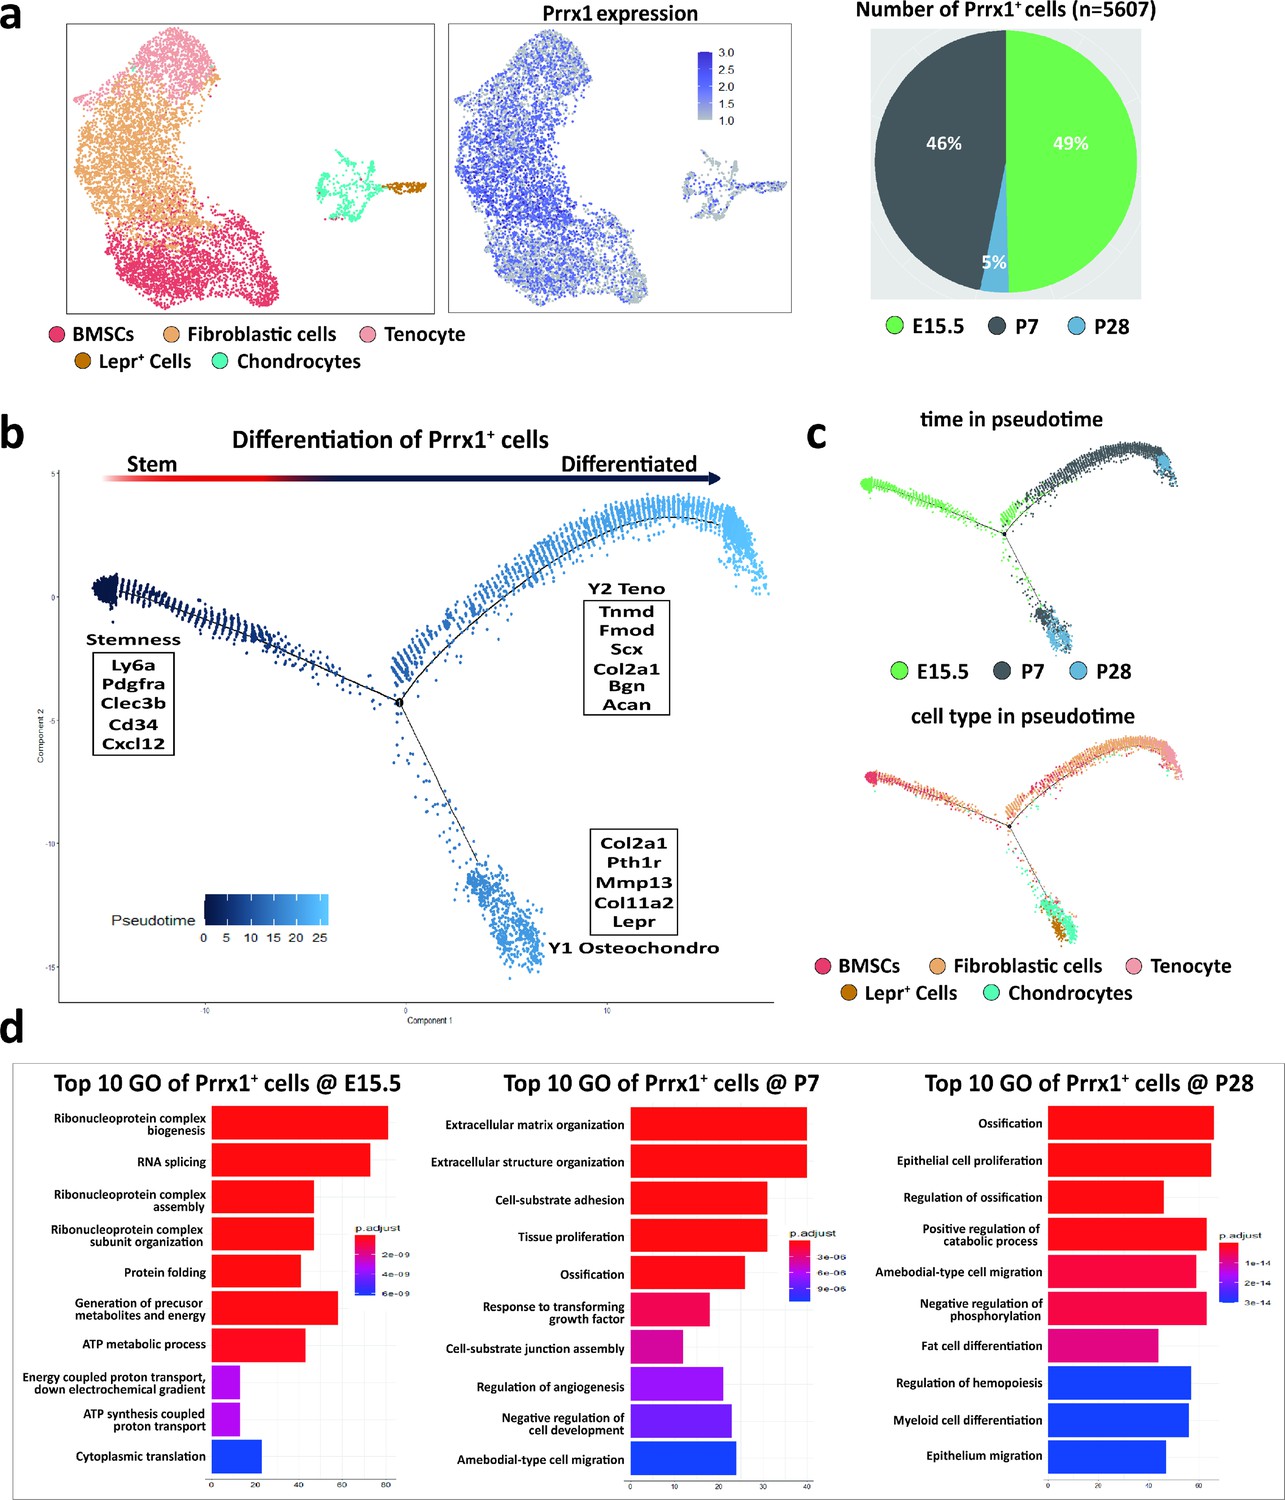
scRNA-Seq distinguishes Prrx1+ cells during enthesis development.
(a) 5607 Prrx1+ cells from mouse supraspinatus enthesis (E15.5, P7, and P28) were grouped into five distinct clusters (colors indicated). Each point represents an individual cell; Right panel shows the expression level of Prrx1 within enthesis-related clusters. (b) Differentiation trajectory of enthesis-related cells constructed by Monocle and was colored by pseudotime order. Branches on the 2D trajectory tree are indicated as tenogenic branch (Y1) and osteochondrogenic branch (Y2). (c) Upper panel was colored by real time-point and lower panel was colored by cell clusters, respectively. (d) The enriched GO terms (biological processes) of differentially expressed genes in enthesis development related Prrx1+ + at E15.5, P7, and P28, respectively.
Figure 3 with 1 supplement
Prrx1+ cells are involved in rotator cuff enthesis development and injury regeneration.
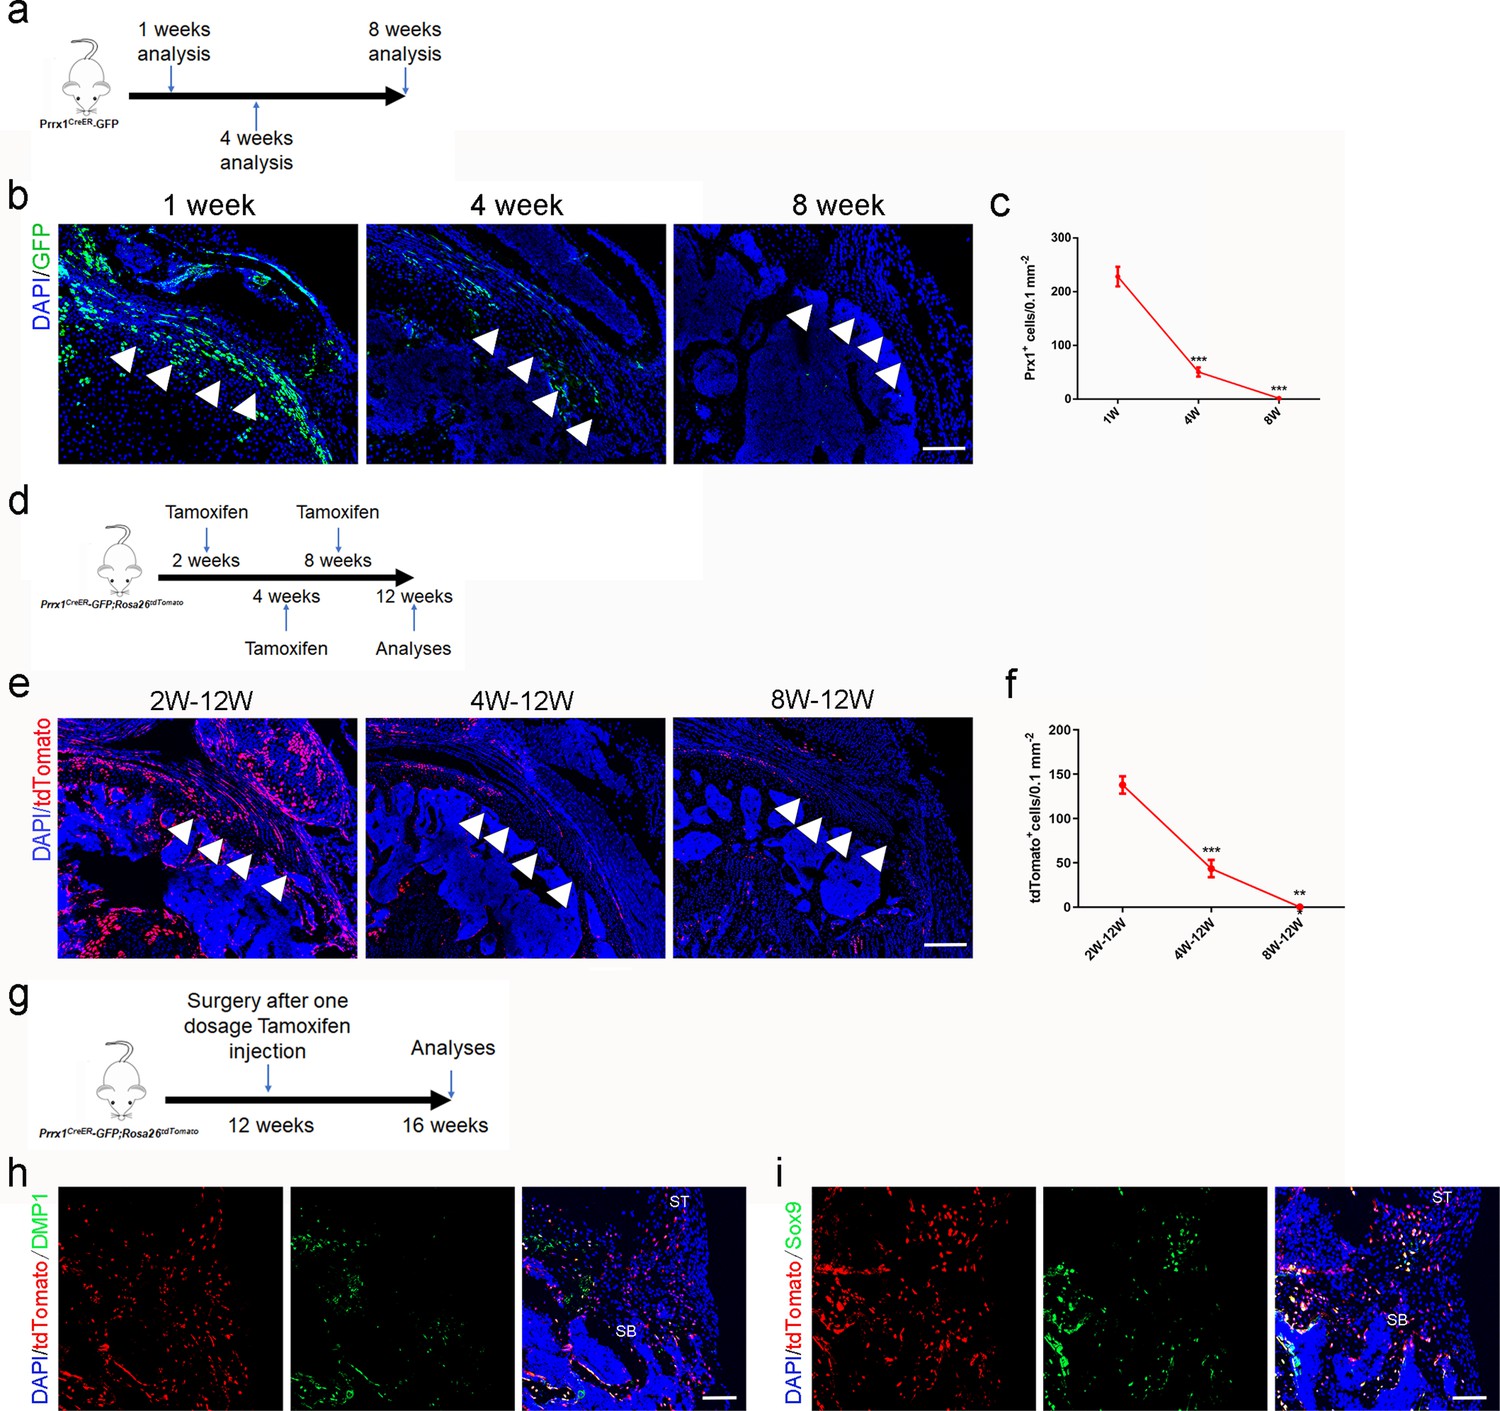
(a) Schematic diagram of Prrx1CreER-GFP mice, which were sacrificed at 1, 4, and 8 weeks after surgery for immunofluorescent analysis. (b) Representative immunofluorescent images of GFP staining of active Prrx1+ cells (green) and DAPI (blue) staining of nuclei in murine humeral head at postnatal 1, 4, and 8 weeks. Scale bars, 200 μm. (c) Quantitative analysis of the number of active Prrx1+ cells in enthesis. n = 6 per group. (d) Schematic diagram of Prrx1CreER-GFP; Rosa26tdTomato mice, which were sacrificed for immunofluorescent analysis at 12 weeks after tamoxifen administration at Postnatal 2, 4, and 8 weeks. (e) Representative immunofluorescent images of tdTomato+ cells (Prrx1+ cells, red) and DAPI (blue) staining of nuclei in murine humeral head at postnatal 12 weeks after injection with tamoxifen respectively at postnatal 2, 4, and 8 weeks. Scale bars, 200 μm. (f) Quantitative analysis of the number of tdTomato+ cells in enthesis. n = 6 per group. (g) Schematic diagram of Prrx1CreER-GFP; Rosa26tdTomato mice which were received acute enthesis injury and sacrificed for immunofluorescent analysis at 4 weeks after surgery after sigle dose tamoxifen injection. (h) Representative immunofluorescent images of tdTomato+ cells (Prrx1+ cells, red) in murine enthesis at postoperative 4 weeks. Scale bars, 100 μm. (i) Quantitative analysis of the number of tdTomato+ cells in enthesis. n = 6 per group. All data were reported as mean ± SD. The white triangles indicated the area of enthesis. SB, subchondral bone; ST: supraspinatus tendon. *p < 0.05, **p < 0.01, ***p < 0.001.
-
Figure 3—source data 1
The source data of quantitative analysis of the number of active Prrx1+ cells in enthesis for Figure 3c and quantitative analysis of the number of tdTomato+ cells in enthesis for Figure 3f.
- https://cdn.elifesciences.org/articles/73614/elife-73614-fig3-data1-v2.xlsx
Figure 3—figure supplement 1
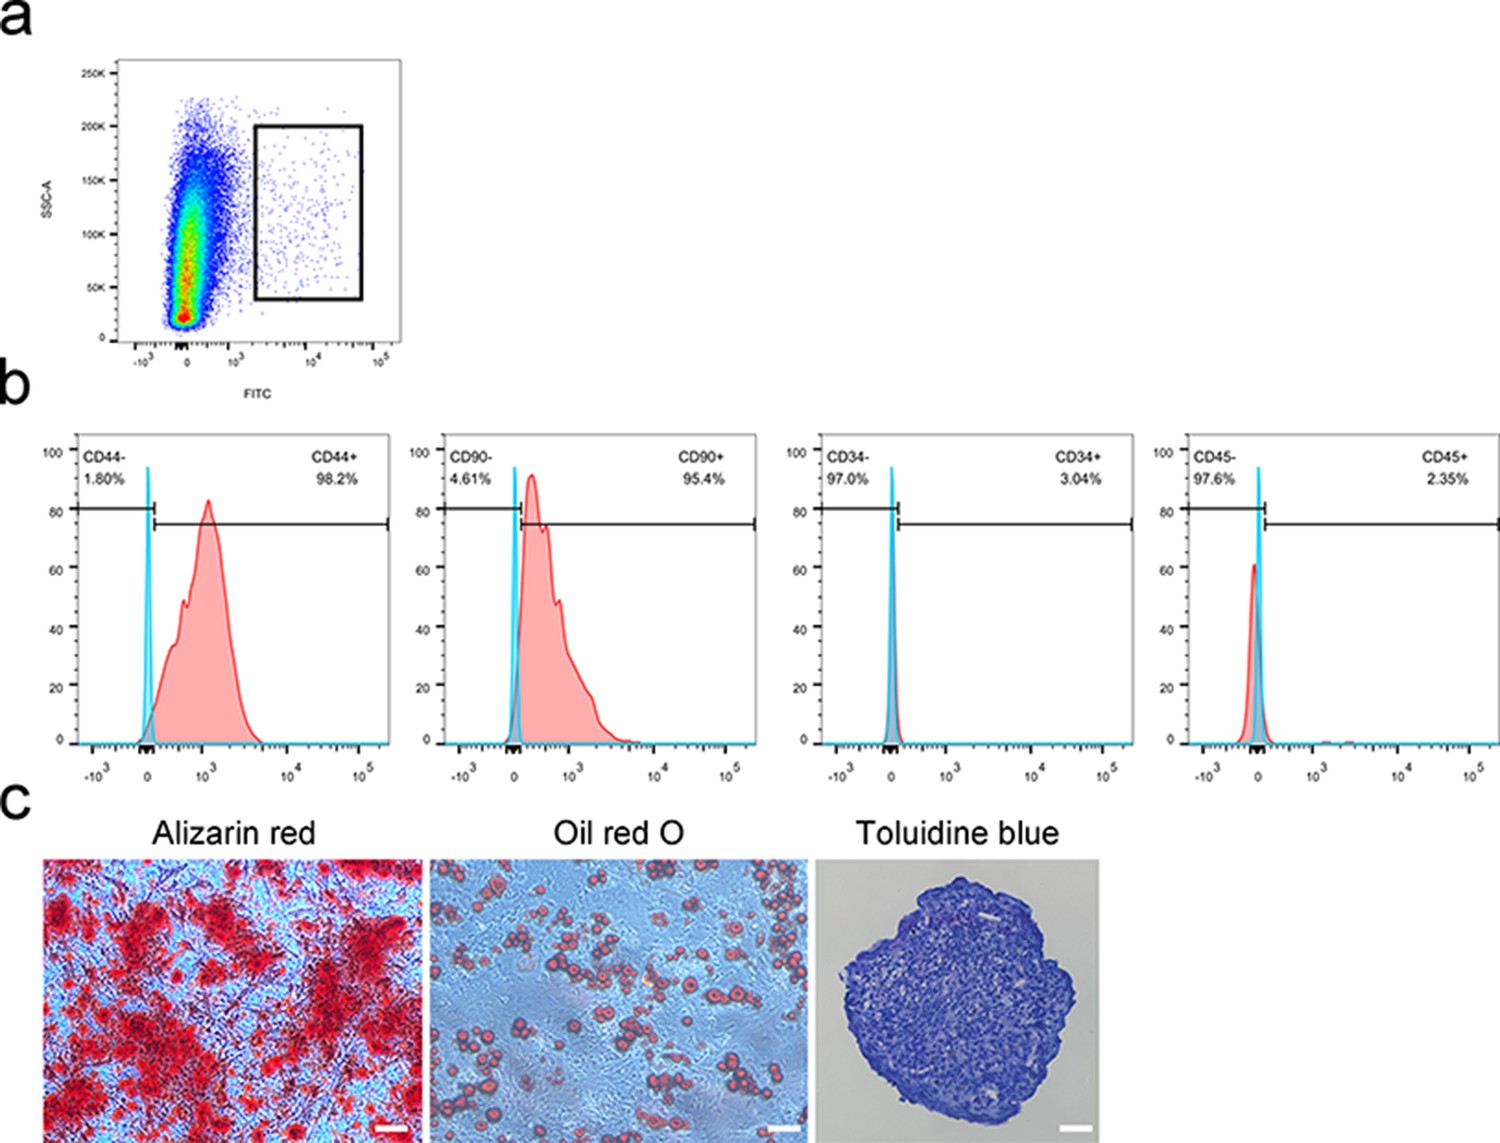
Prrx1+ cells and verified that it has the stem-like cell phenotype.
(a) Prrx1+ cells were isolated by Flow cytometry. (b) Flow cytometry analysis of Prrx1+ cells. (c) Induced differentiation analysis of Prrx1+ cells. Scale bar, 100 μm.
Figure 4
Proper mechanical stimulation could improve the enthesis injury repair.
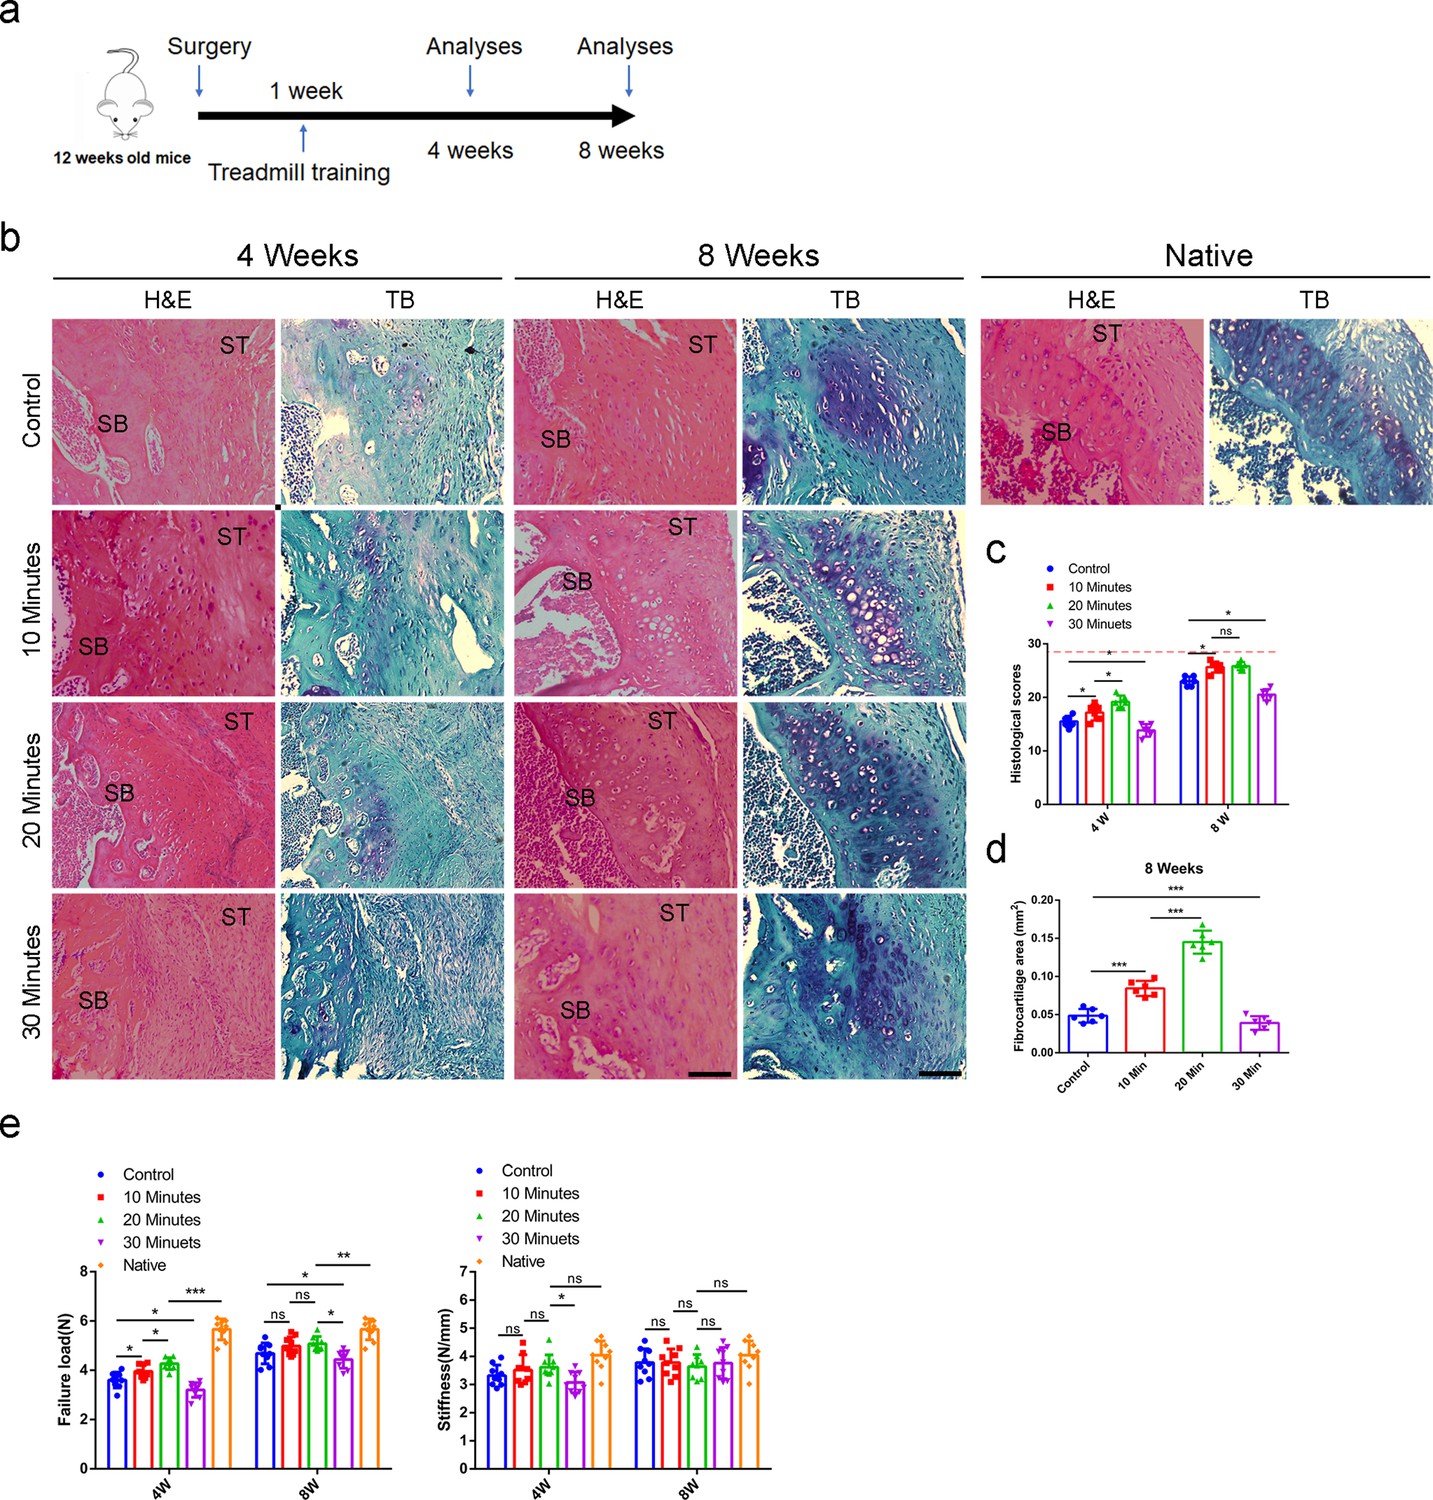
(a) Schematic diagram of mice, which were received enthesis surgery and sacrificed for immunofluorescent analysis at 4 and 8 weeks after surgery. (b) Representative image of H&E and Toluidine blue/Fast green staining of enthesis. Scale bar, 200 μm. (c) Quantitative analysis of H&E score. The red dolt line indicated the perfect histological score of 28. n = 6 per group. (d) Quantitative analysis of fibrocartilage thickness. n = 6 per group. (e) Quantitative analysis of Failure Load and stiffness. n = 9 per group. SB, subchondral bone; ST: supraspinatus tendon. Data were presented as mean ± SD. *p < 0.05, **p < 0.01, ***p < 0.001, ns p > 0.05.
-
Figure 4—source data 1
The source data of quantitative analysis of H&E score for Figure 4c.
- https://cdn.elifesciences.org/articles/73614/elife-73614-fig4-data1-v2.xlsx
Figure 5
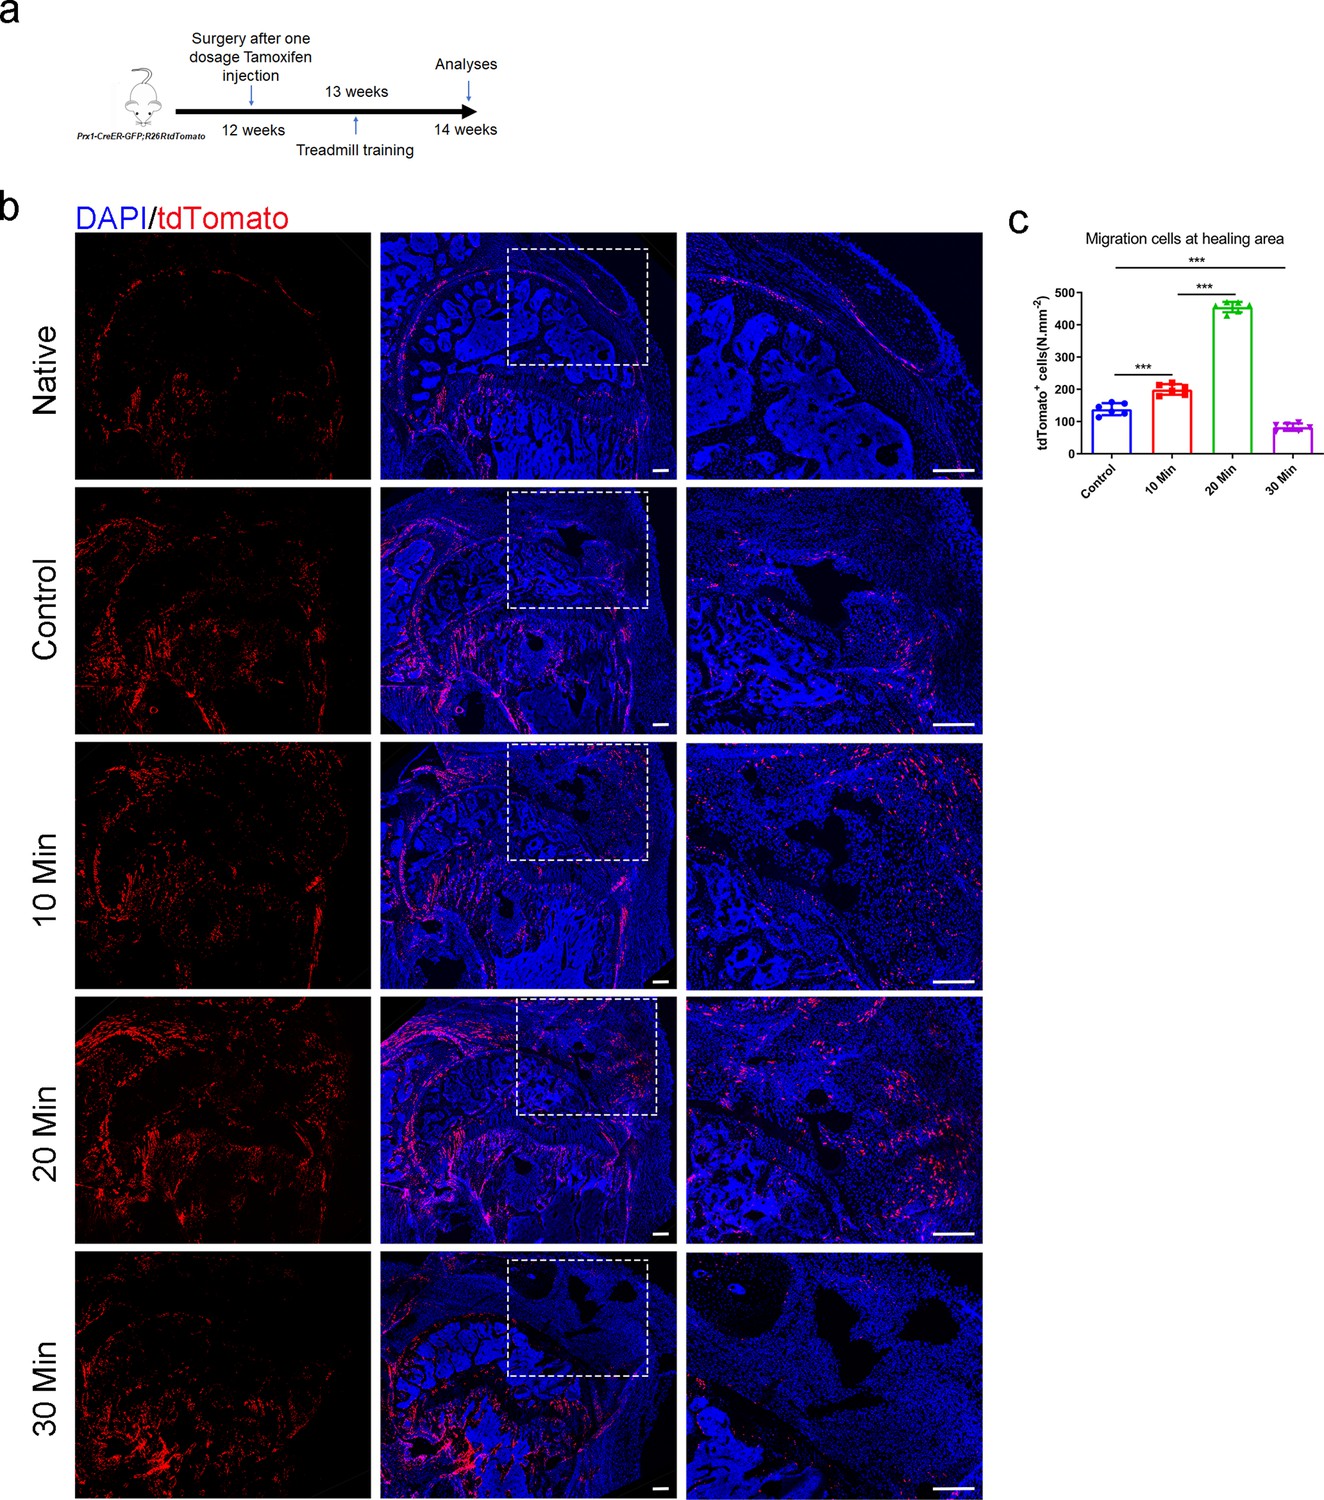
Proper mechanical stimuli could enhance the migration of Prrx1+ cells to participate in enthesis healing.
(a) Schematic diagram of Prrx1CreER-GFP; Rosa26tdTomato mice which were received enthesis surgery and sacrificed for immunofluorescent analysis at 14 weeks after surgery after sigle dose tamoxifen injection. (b) Representative immunofluorescent images of Tdtomato (red) staining of Prrx1+ cells and DAPI (blue) staining of nuclei under different mechanical stimuli. Scale bar, 200 μm. (c) Quantitative analysis of migration Prrx1+ cells at the healing area. n = 6 per group. Data were presented as mean ± SD. Scale bar, 200 μm. *p < 0.05, **p < 0.01, ***p < 0.001.
-
Figure 5—source data 1
The source data of quantitative analysis of migration Prrx1+ cells at the healing area for Figure 5c.
- https://cdn.elifesciences.org/articles/73614/elife-73614-fig5-data1-v2.xlsx
Figure 6 with 1 supplement
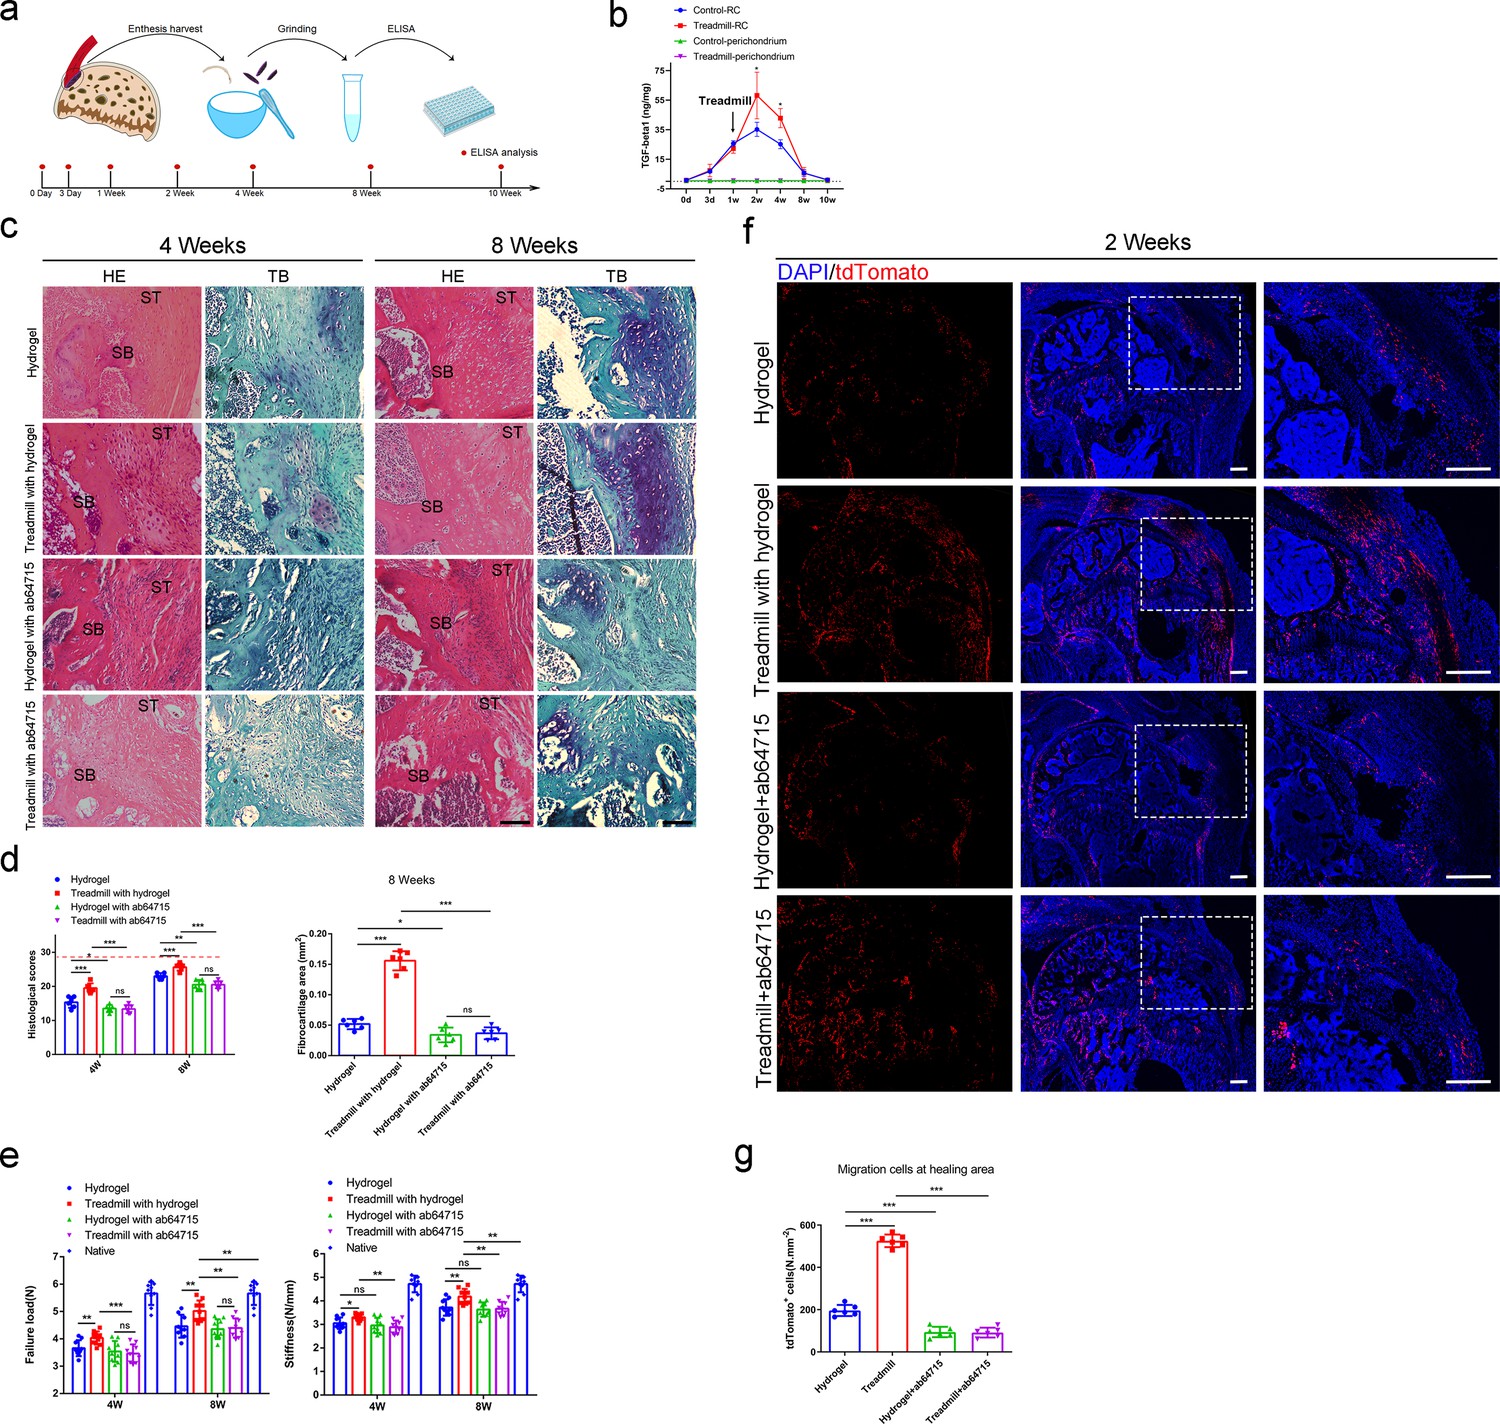
TGF-β1-mediated mechanical stimulation to enhance enthesis injury repair.
(a) Schematic diagram of ELISA analysis. (b) ELISA analysis of TGF-β1 concentration during the enthesis healing procedure. n = 3 per group. (c) Representative image of H&E and Toluidine blue/Fast green staining of enthesis. Scale bar, 200 μm. (d) Quantitative analysis of H&E score and fibrocartilage thickness. The red dolt line indicated the perfect histological score of 28. n = 6 per group. (e) Quantitative analysis of Failure Load and stiffness. n = 9 per group. (f) Representative immunofluorescent images of Tdtomato (red) staining of Prrx1+ cells and DAPI (blue) staining of nuclei under different mechanical stimuli at postoperative 2 weeks. Scale bar, 200 μm. (g) Quantitative analysis of migration Prrx1+ cells at the healing area. n = 6 per group. Data were presented as mean ± SD. *p < 0.05, **p < 0.01, ***p < 0.001.
-
Figure 6—source data 1
The source data of TGF-β1 concentration during the enthesis healing procedure for Figure 6b.
- https://cdn.elifesciences.org/articles/73614/elife-73614-fig6-data1-v2.xlsx
Figure 6—figure supplement 1
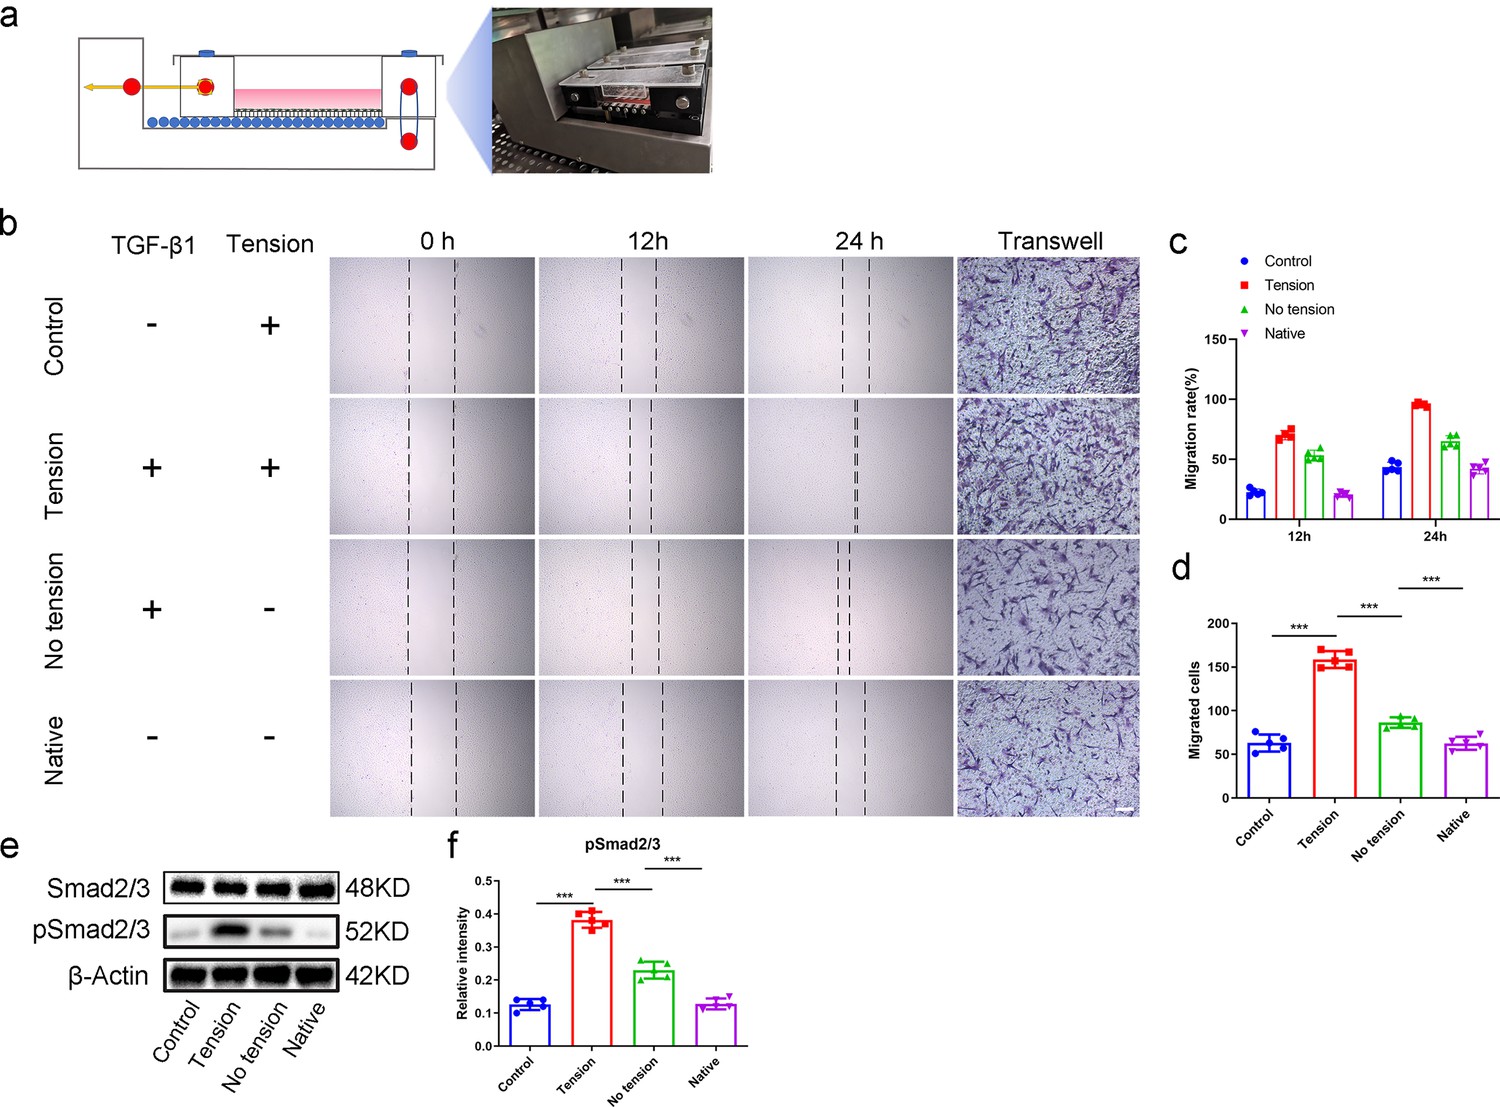
Mechanical stimulation could amplify the transmission of TGF-β signaling.
(a) Schematic image and gross view of the cell loading system. (b) Scratch assay and transwell assay of Prrx1 + cells. Scale bar, 100 μm. (c) Quantitative analysis of migration cells in a scratch assay. n = 5 per group. (d) Quantitative analysis of migration cells in transwell assay. n = 5 per group. (e) Western blot analysis of Smad2/3, phosphorylation of Smad2/3. (f) Quantitative analysis of western blot. n = 5 per group. Data were presented as mean ± SD. *p < 0.05, **p < 0.01, ***p < 0.001.
-
Figure 6—figure supplement 1—source data 1
The source data of quantitative analysis of migration cells in a scratch assay for Figure 6—figure supplement 1c.
The source data of quantitative analysis of migration cells in transwell assay for Figure 6—figure supplement 1d. The source data of quantitative analysis of western blot for Figure 6—figure supplement 1f.
- https://cdn.elifesciences.org/articles/73614/elife-73614-fig6-figsupp1-data1-v2.xlsx
-
Figure 6—figure supplement 1—source data 2
The the original files of the full raw unedited gels.
- https://cdn.elifesciences.org/articles/73614/elife-73614-fig6-figsupp1-data2-v2.zip
Figure 7
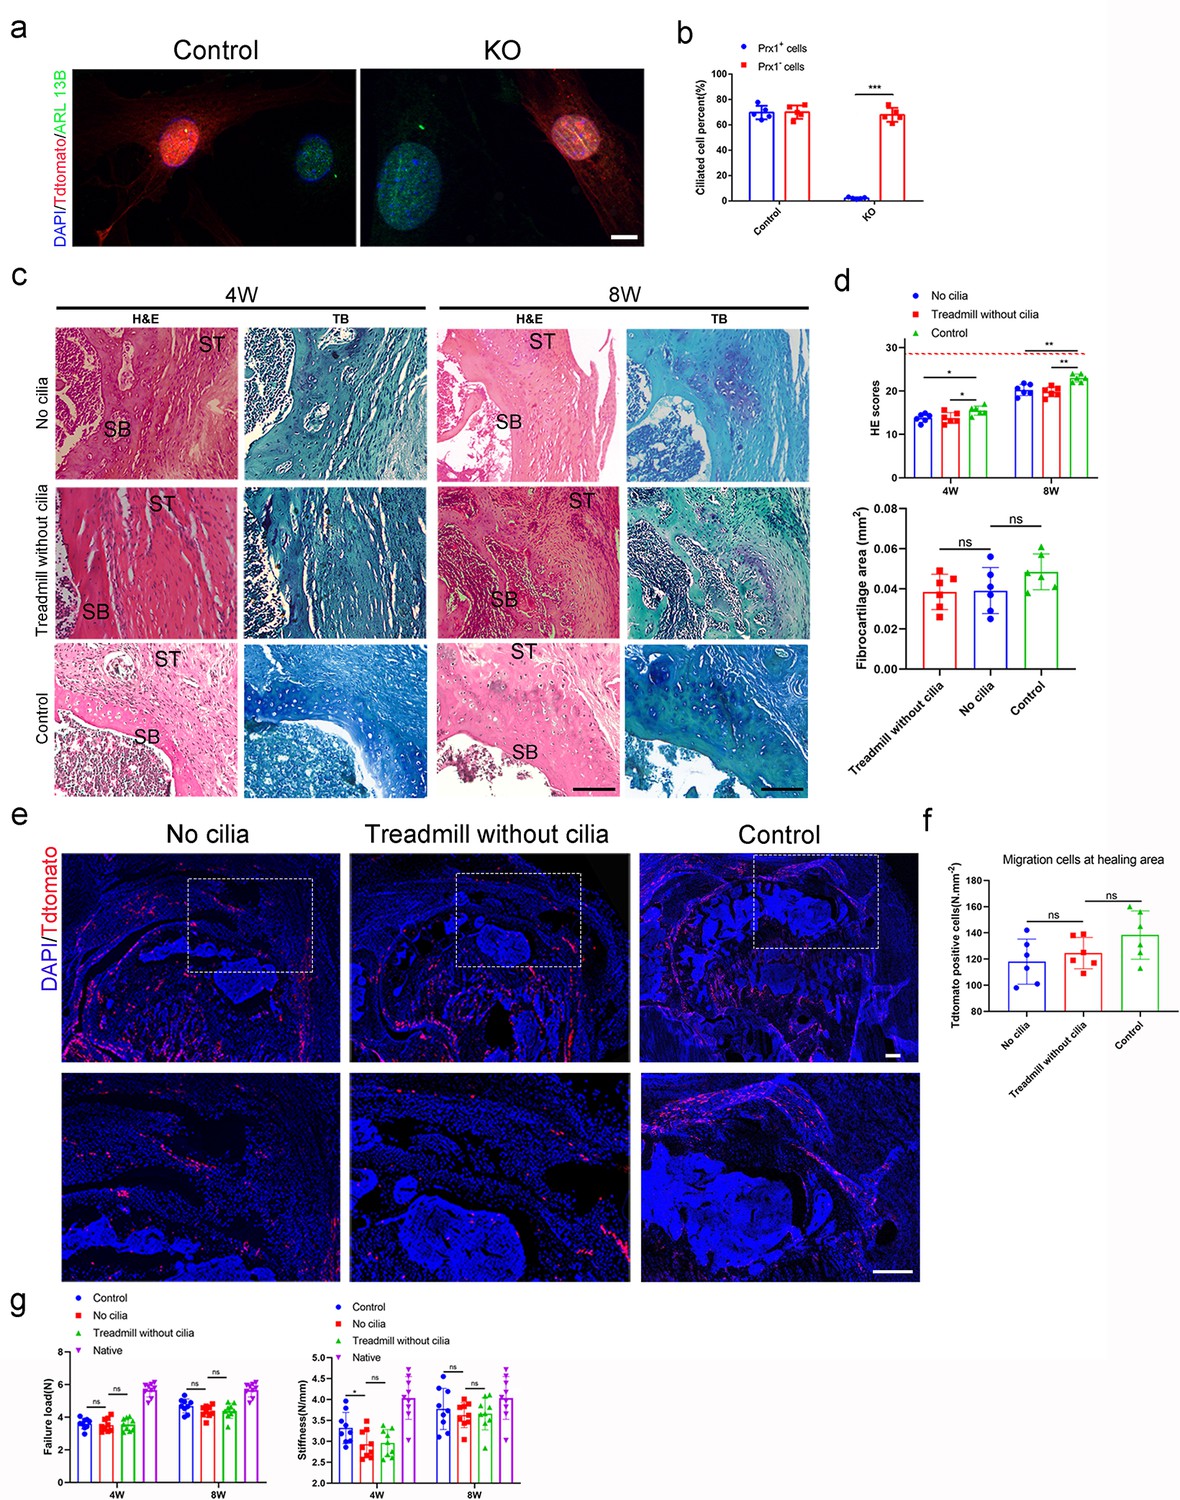
Primary cilia was essential for TGF-β signaling to promote enthesis injury repair.
(a) Representative immunofluorescence image of tdTamato (red) staining of Prrx1+ cells, ARL 13B (green) staining of primary cilia, and DAPI (blue) staining of nuclei. Scale bar, 5 μm. (b) Quantitative analysis of ciliated cell percent in Prrx1+ cells and Prrx1- cells. n = 5 per group. (c) Representative image of H&E and Toluidine blue/Fast green staining of enthesis. Scale bar, 200 μm. (d) Quantitative analysis of H&E score and fibrocartilage area at the enthesis. The red dotted line stands for perfect H&E scores of 28. n = 6 per group. (e) Representative immunofluorescence image of tdTamato (red) staining of Prrx1+ cells, DAPI (blue) staining of nuclei at the enthesis. Scale bar, 200 μm. (f) Quantitative analysis of Tdtomato+ cells in the healing area. n = 6 per group. (g) Quantitative analysis of load failure and stiffness of enthesis. n = 9 per group. SB, subchondral bone; ST: supraspinatus tendon. Data were presented as mean ± SD. ***p < 0.001.
-
Figure 7—source data 1
The source data of quantitative analysis of ciliated cell percent in Prrx1+ cells and Prrx1- cells for Figure 7b.
The source data of quantitative analysis of H&E score and fibrocartilage area at the enthesis for Figure 7d. The source data of quantitative analysis of Tdtomato+ cells in the healing area for Figure 7f. The source data of quantitative analysis of load failure and stiffness of enthesis for Figure 7g.
- https://cdn.elifesciences.org/articles/73614/elife-73614-fig7-data1-v2.xlsx
Figure 8 with 1 supplement
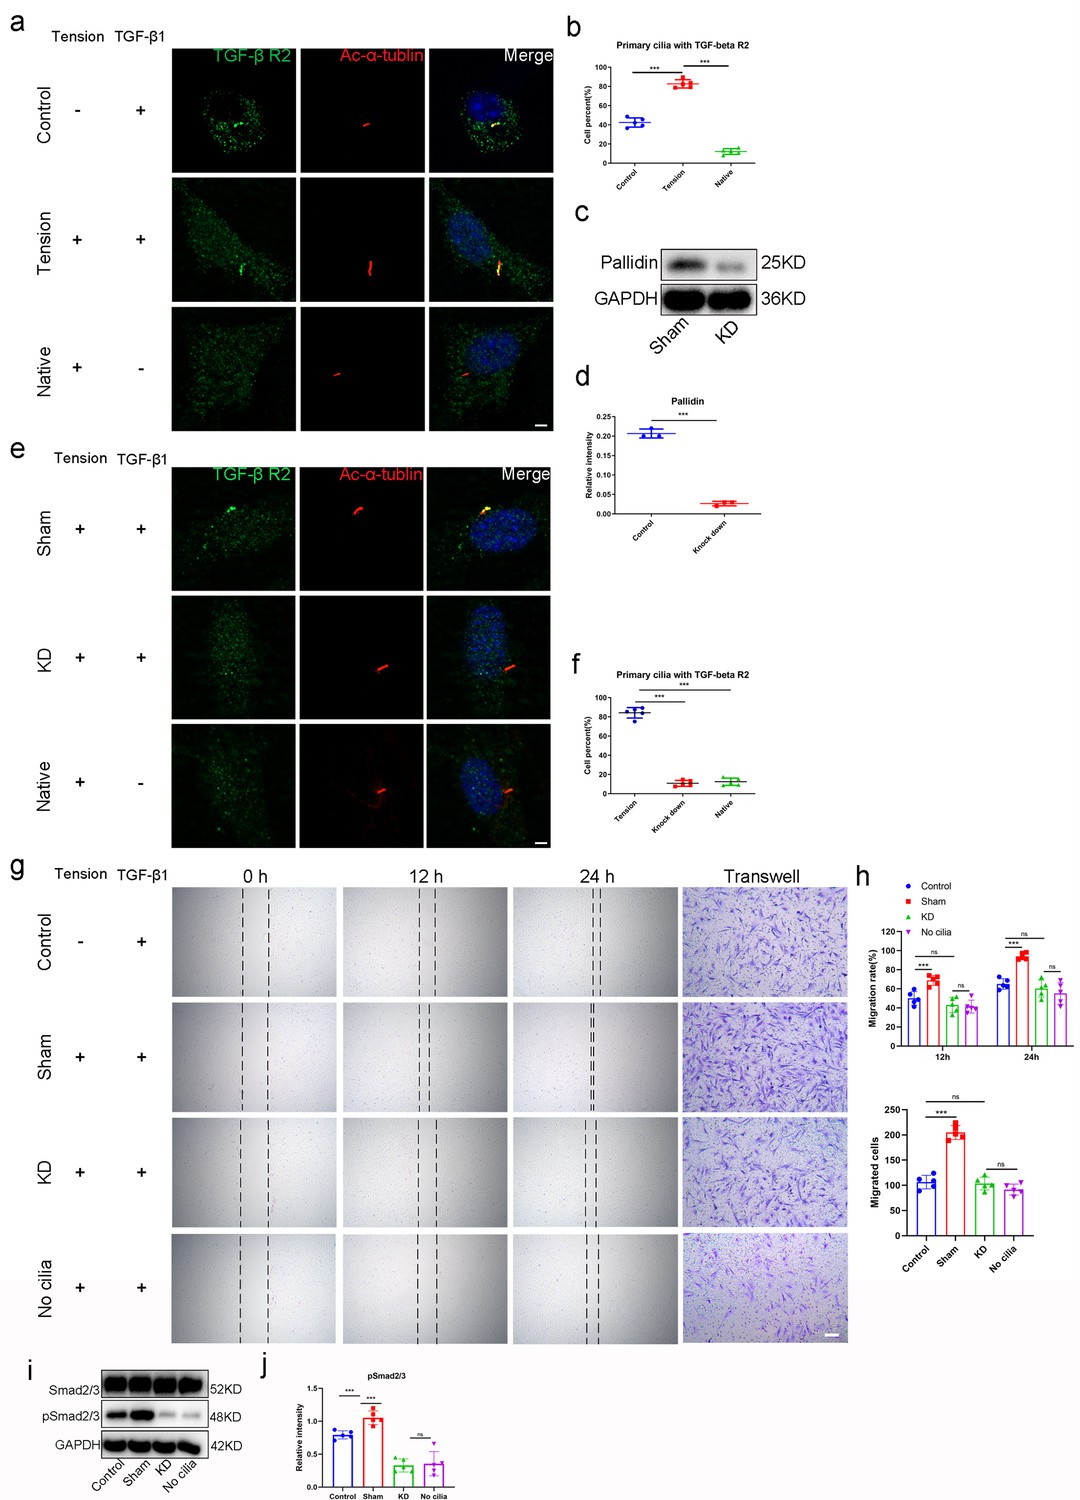
TGF-β1 enhanced the migration of Prrx1+ cells via ciliary TGF-β signaling.
(a) Representative image of immunofluorescent analysis of TGF-βR2 (green), Ac-α-tubulin (red) staining of primary cilia, and DAPI (blue) staining of nuclei stimulation by mechanical force with TGF-β1 (0.4 ng/ml) in Prrx1+ cells. Scale bar, 5 μm. n = 5 per group. (b) Quantitative analysis of cell percent that the TGF-βR2 was concentrated in the primary cilia. n = 5 per group. (c) Western blot analysis of Pallidin in groups treated with or without Pallidin-siRNA. (d) Quantitative analysis of western blot. n = 5 per group. (e) Representative image of immunofluorescent analysis of TGF-βR2 (green), Ac-α-tubulin (red) staining, and DAPI (blue) staining of nuclei stimulation by mechanical force with TGF-β1 (0.4 ng/ml) in Prrx1+ cells treated with or without Pallidin-siRNA. Scale bar, 5 μm. (f) Quantitative analysis of cell percent that the TGF-βR2 was concentrated in the primary cilia. n = 5 per group. (g) Scratch assay and transwell assay of Prrx1+ cells. Scale bar, 100 μm. (h) Quantitative analysis of scratch assay. n = 5 per group. (i) Western blot analysis of Smad2/3/pSmad2/3 signaling. (j) Quantitative analysis of western blot. n = 5 per group. Data were presented as mean ± SD. *p < 0.05, **p < 0.01, ***p < 0.001.
-
Figure 8—source data 1
The source data of quantitative analysis of cell percent that the TGF-βR2 was concentrated in the primary cilia for Figure 8b.
The source data of quantitative analysis of western blot for Figure 8d. The source data of quantitative analysis of cell percent that the TGF-βR2 was concentrated in the primary cilia for Figure 8f. The source data of quantitative analysis of scratch assay and transwell assay for Figure 8h. The source data of quantitative analysis of western blot for Figure 8j.
- https://cdn.elifesciences.org/articles/73614/elife-73614-fig8-data1-v2.xlsx
-
Figure 8—source data 2
The the original files of the full raw unedited gels.
- https://cdn.elifesciences.org/articles/73614/elife-73614-fig8-data2-v2.zip
Figure 8—figure supplement 1
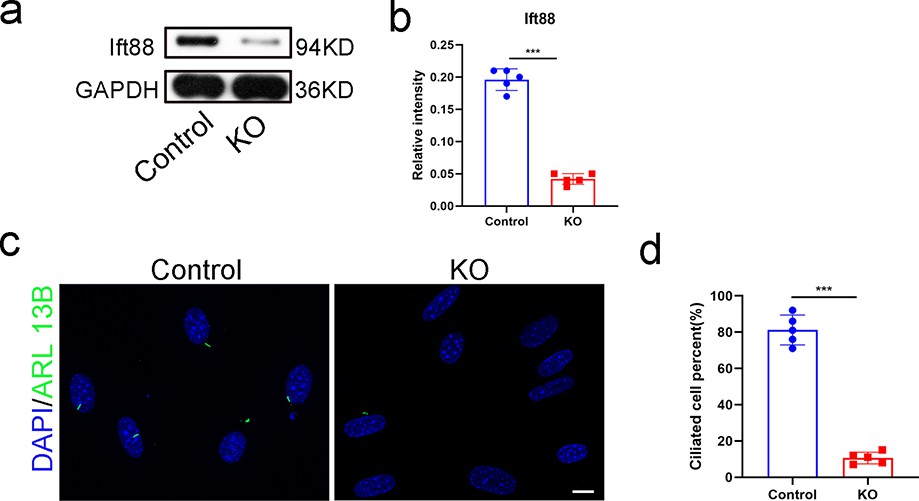
Knock out Ift88 in vitro.
(a) Western blot analysis of Ift88 in groups treated with or without lentivirus expressing Cre. (b) Quantitative analysis of western blot. n = 5 per group. (c) Representative image of immunofluorescent analysis of ARL13B (green) and DAPI (blue) staining of nuclei stimulationin Prrx1+ cells treated with or without lentivirus expressing Cre. Scale bar, 5 μm. (d) Quantitative analysis of cell percent that the ciliated cells. n = 5 per group. Data were presented as mean ± SD. *p < 0.05, **p < 0.01, ***p < 0.001.
-
Figure 8—figure supplement 1—source data 1
The source data of quantitative analysis of western blot for Figure 8b The source data of quantitative analysis of cell percent that the ciliated cells for Figure 8d.
- https://cdn.elifesciences.org/articles/73614/elife-73614-fig8-figsupp1-data1-v2.xlsx
-
Figure 8—figure supplement 1—source data 2
The the original files of the full raw unedited gels.
- https://cdn.elifesciences.org/articles/73614/elife-73614-fig8-figsupp1-data2-v2.zip
Additional files
Download links
A two-part list of links to download the article, or parts of the article, in various formats.
Downloads (link to download the article as PDF)
Open citations (links to open the citations from this article in various online reference manager services)
Cite this article (links to download the citations from this article in formats compatible with various reference manager tools)
Mechanical stimulation promotes enthesis injury repair by mobilizing Prrx1+ cells via ciliary TGF-β signaling
eLife 11:e73614.
https://doi.org/10.7554/eLife.73614


