Sequence and structural conservation reveal fingerprint residues in TRP channels
- Instituto de Fisiologia, Facultad de Medicina, Universidad Austral de Chile, Chile
- Institute for Computational Molecular Science and Department of Biology, Temple University, United States
- School of Cellular and Molecular Medicine, University of Bristol, United Kingdom
- Instituto de Ciencias Ambientales y Evolutivas, Facultad de Ciencias, Universidad Austral de Chile, Chile
- Integrative Biology Group, Universidad Austral de Chile, Chile
- Millennium Nucleus of Ion Channel-associated Diseases (MiNICAD), Chile
- Janelia Research Campus, Howard Hughes Medical Institute, United States
Figures
Figure 1 with 4 supplements
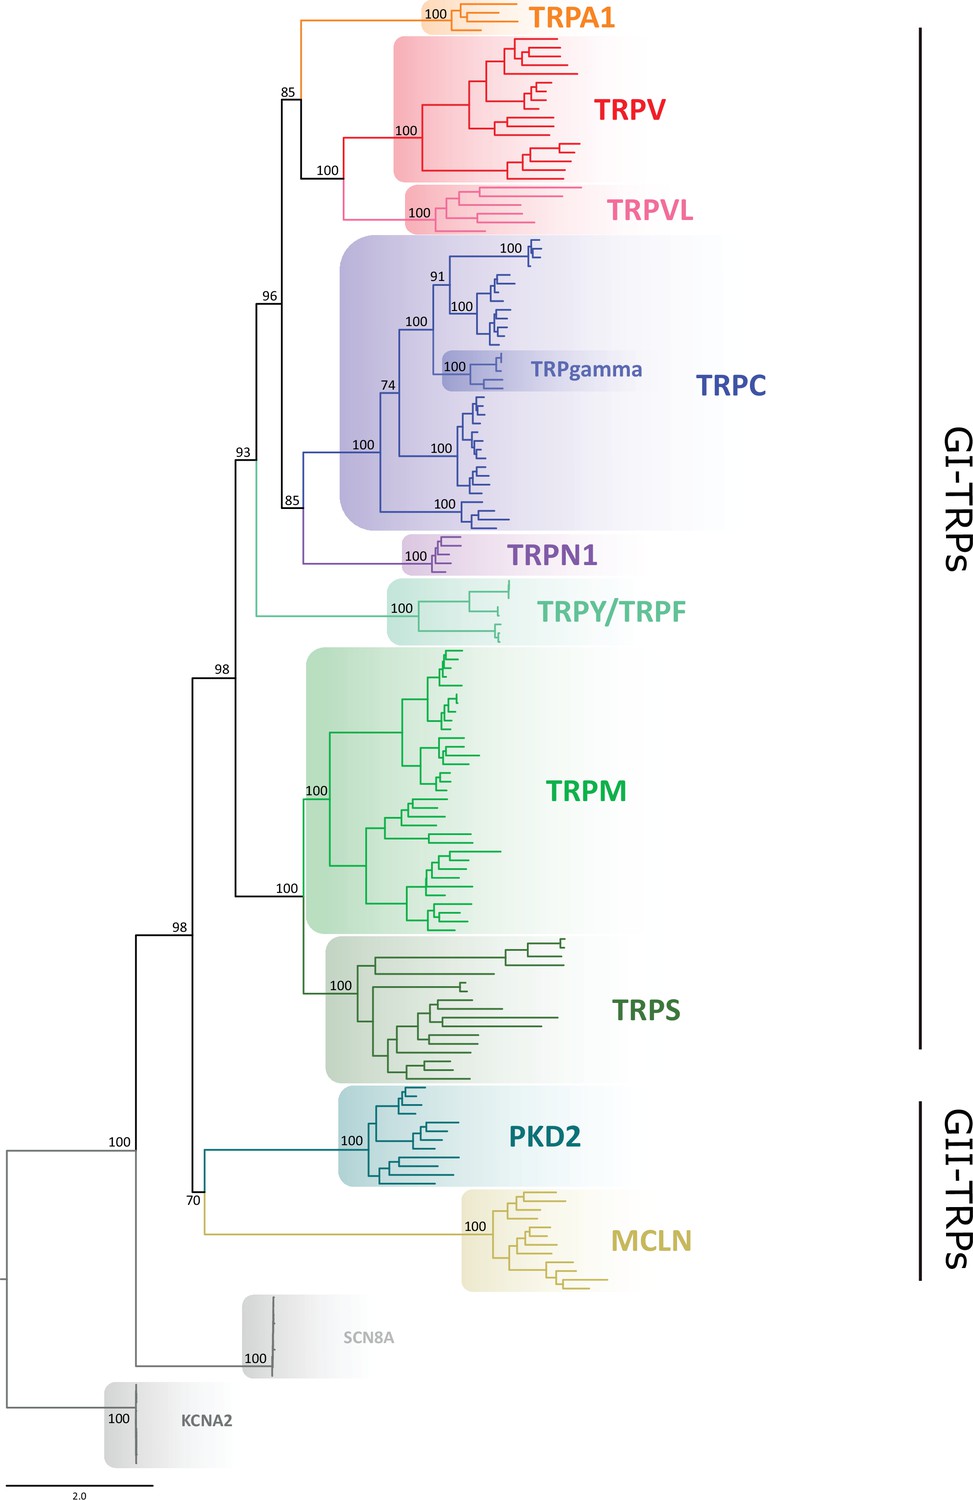
Maximum likelihood tree showing relationships among TRP channels.
The scale denotes substitutions per site and colors represent lineages. Numbers on the nodes correspond to support values from the ultrafast bootstrap routine. Potassium voltage-gated channel subfamily A member 2 (KCNA2) and sodium voltage-gated channel alpha subunit 8 (SCN8A) sequences were included as an outgroup. TRP, transient receptor potential.
Figure 1—figure supplement 1
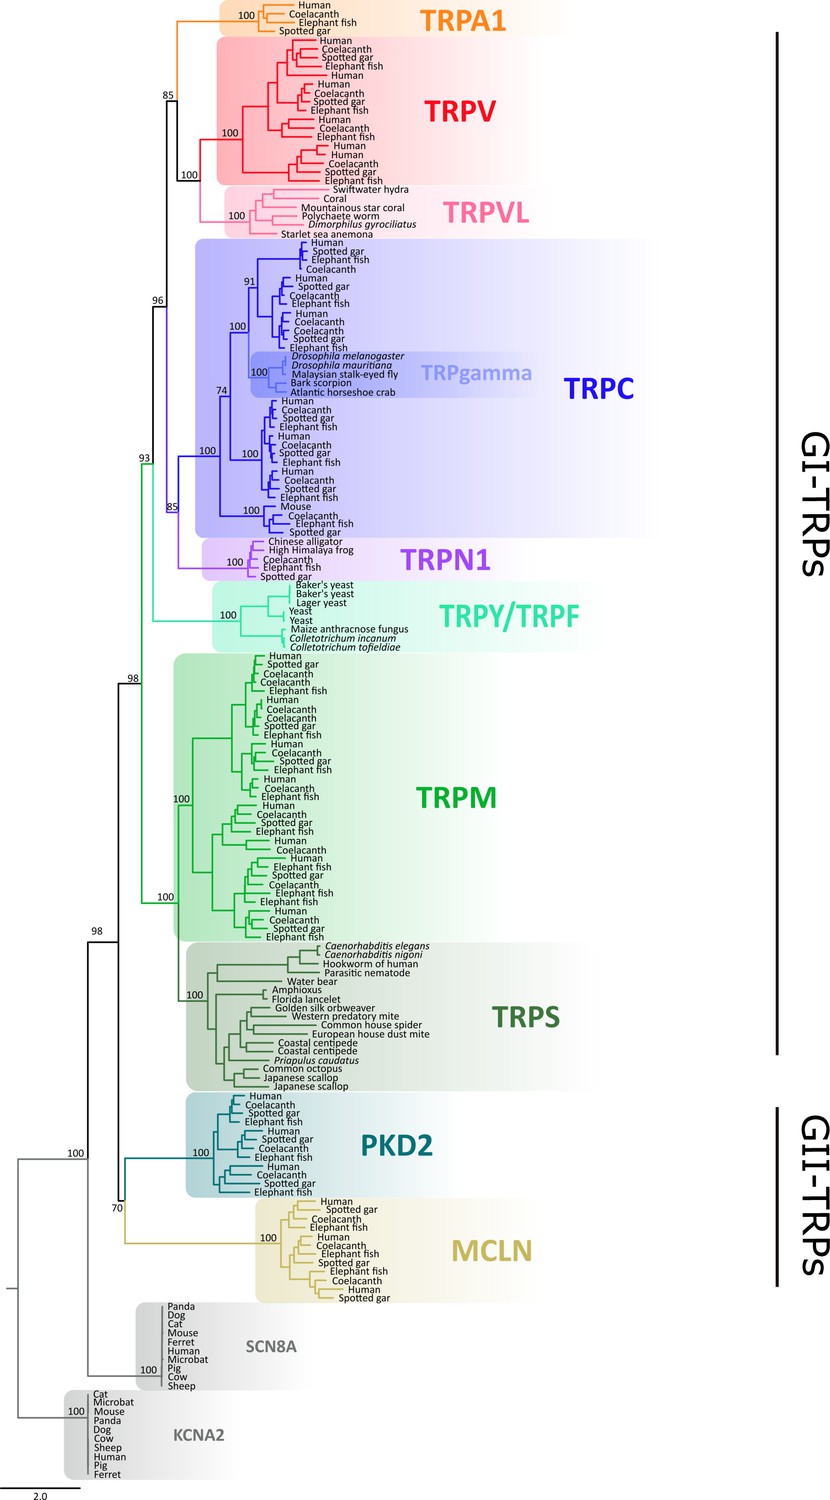
Maximum likelihood tree showing relationships among TRP channels with species indicated.
Numbers on the nodes correspond to support values from the ultrafast bootstrap routine. The scale denotes substitutions per site and colors represent lineages. Potassium voltage-gated channel subfamily A member 2 (KCNA2) and sodium voltage-gated channel alpha subunit 8 (SCN8A) sequences were included as an outgroup. TRP, transient receptor potential.
Figure 1—figure supplement 2
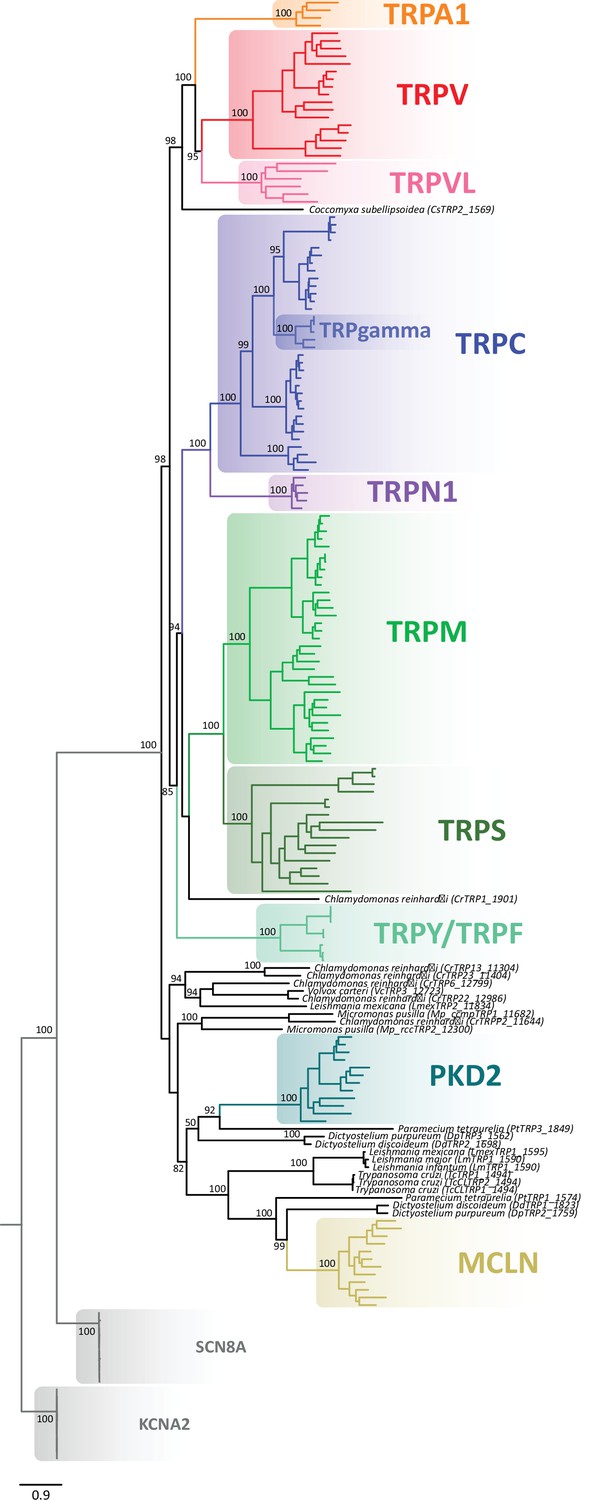
Maximum likelihood tree showing relationships among TRP channels and the putative TRPs from unicellular organisms.
Numbers on the nodes correspond to support values from the ultrafast bootstrap routine. The scale denotes substitutions per site and colors represent lineages. Potassium voltage-gated channel subfamily A member 2 (KCNA2), and sodium voltage-gated channel alpha subunit 8 (SCN8A) sequences were included as an outgroup. TRP, transient receptor potential.
Figure 1—figure supplement 3
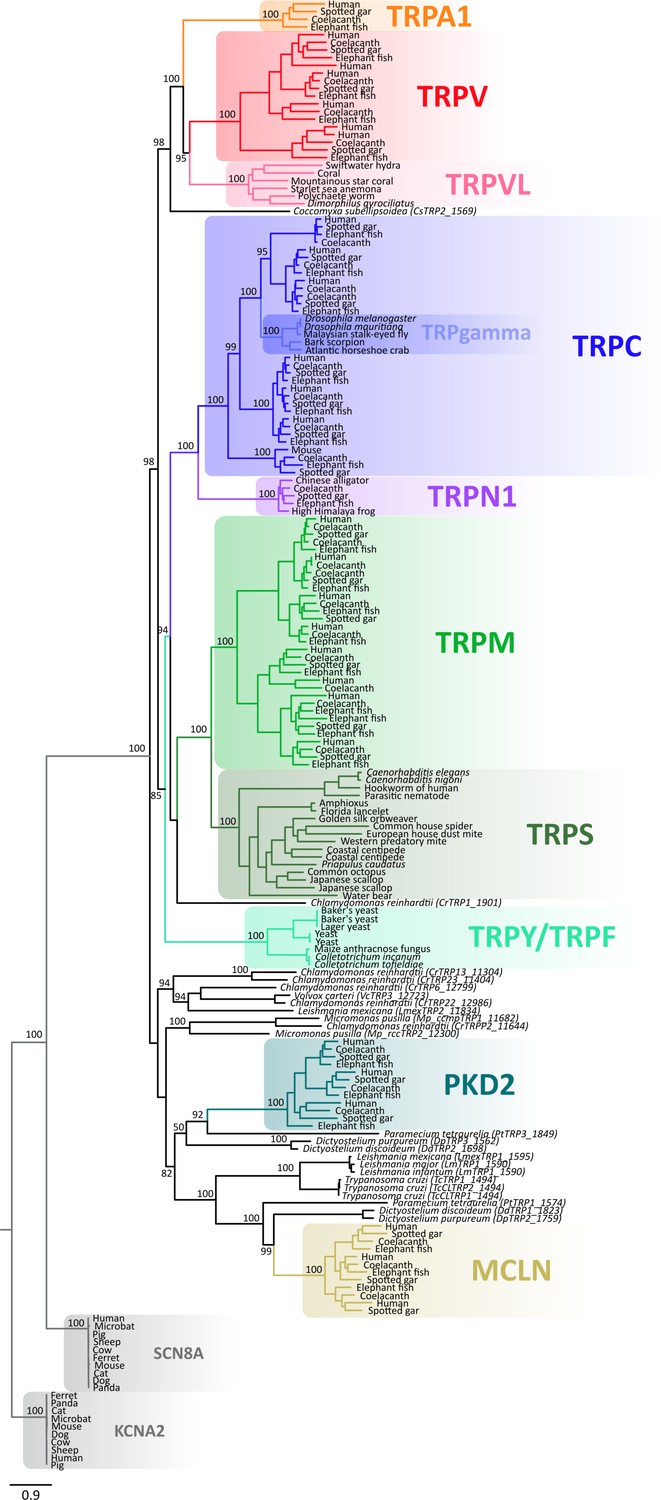
Maximum likelihood tree showing relationships among TRP channels and the putative TRPs from unicellular organisms with all species indicated.
Numbers on the nodes correspond to support values from the ultrafast bootstrap routine. The scale denotes substitutions per site and colors represent lineages. Potassium voltage-gated channel subfamily A member 2 (KCNA2) and sodium voltage-gated channel alpha subunit 8 (SCN8A) sequences were included as an outgroup. TRP, transient receptor potential.
Figure 1—figure supplement 4
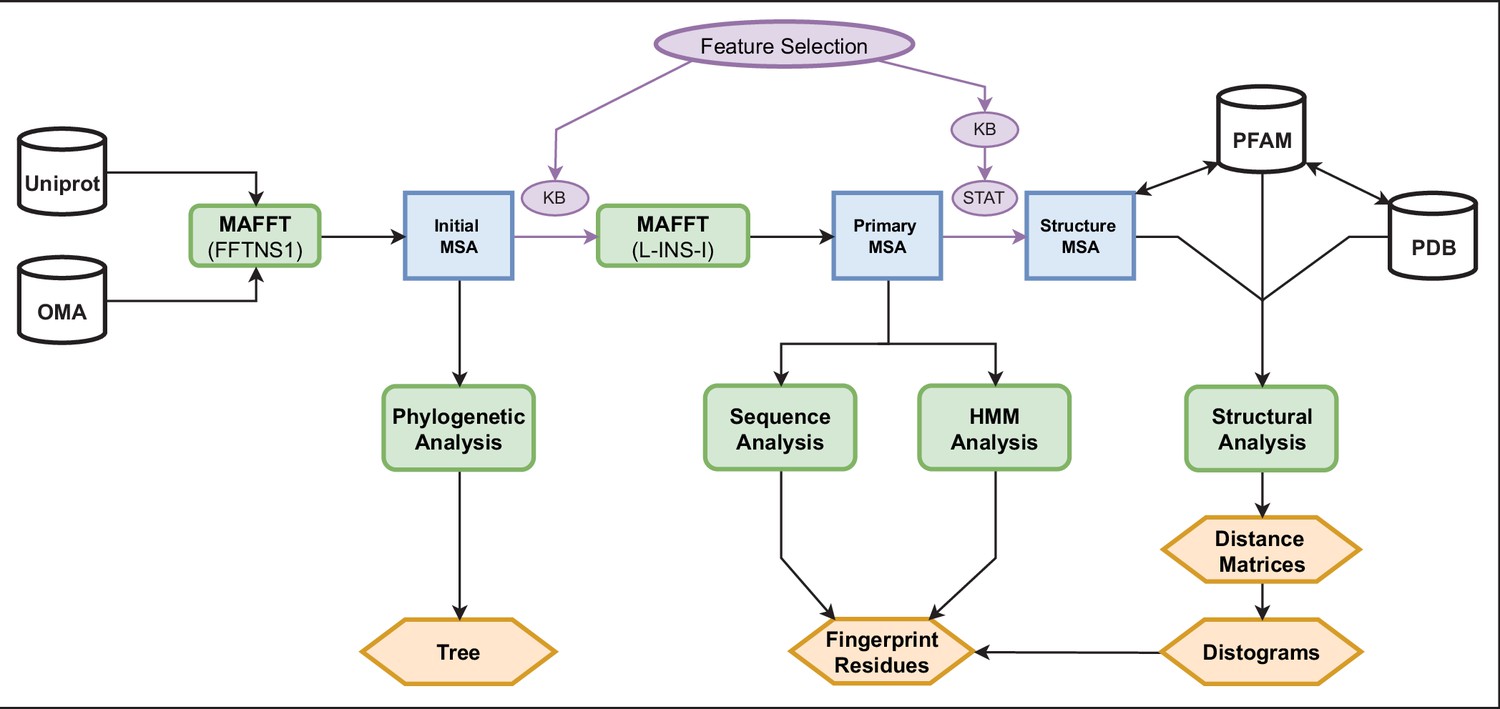
Pipeline diagram.
Our analyses begin by pulling TRP sequences from the Uniprot and OMA databases (upper left). From this set of sequences (1615), we handpicked 58 individuals for phylogenetic analysis and produced an initial MSA with the whole set (blue) by using MAFFT (FFTNS1). Knowledge-based feature selection (purple) was implemented to retain only those positions between the pre-TM1 and TDh regions, and then performed another MAFFT (L-INS-I) to produce a new MSA, defined as primary, containing 1481 sequences. From this primary MSA, we identified the fingerprint residues (orange) using two separate analyses, a Fourier analysis and an HMM analysis (bottom-center). From the primary MSA, we used feature selection to create a third and final MSA, the structure MSA (138 structures). The knowledge-based feature selection for this MSA trimmed the positions to include only those within the borders of the individual helices, and nothing in between them. The statistical feature selection removed any positions with a gap frequency above 4%. The sequences in this MSA were all from Uniprot only and were mapped on a residue-by-residue basis to their corresponding PDB structures using a Uniprot-PDB index provided by PFAM. From this sequence-structure map, pairwise cβ-cβ (or cα in the case of glycine) distance matrices were computed, and from these the various distograms (mean, variance, and normalized variance) were computed (orange). These distograms were used to corroborate the existence of the fingerprint residues identified by frequency and HMM Analyses. HMM, hidden Markov model; MSA, multiple sequence alignment; TRP, transient receptor potential.
Figure 2 with 3 supplements
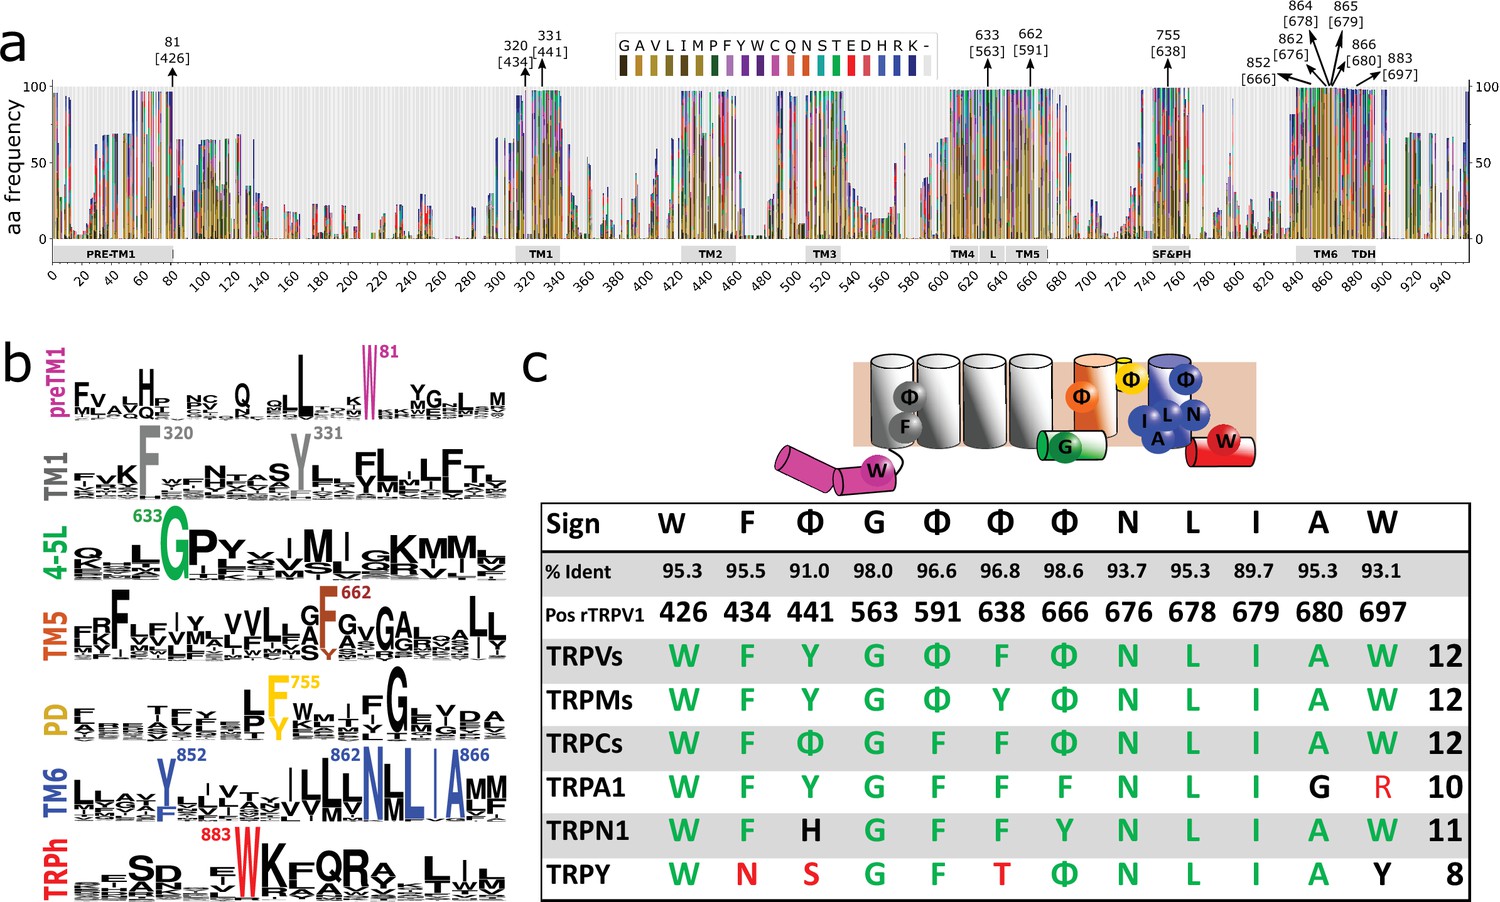
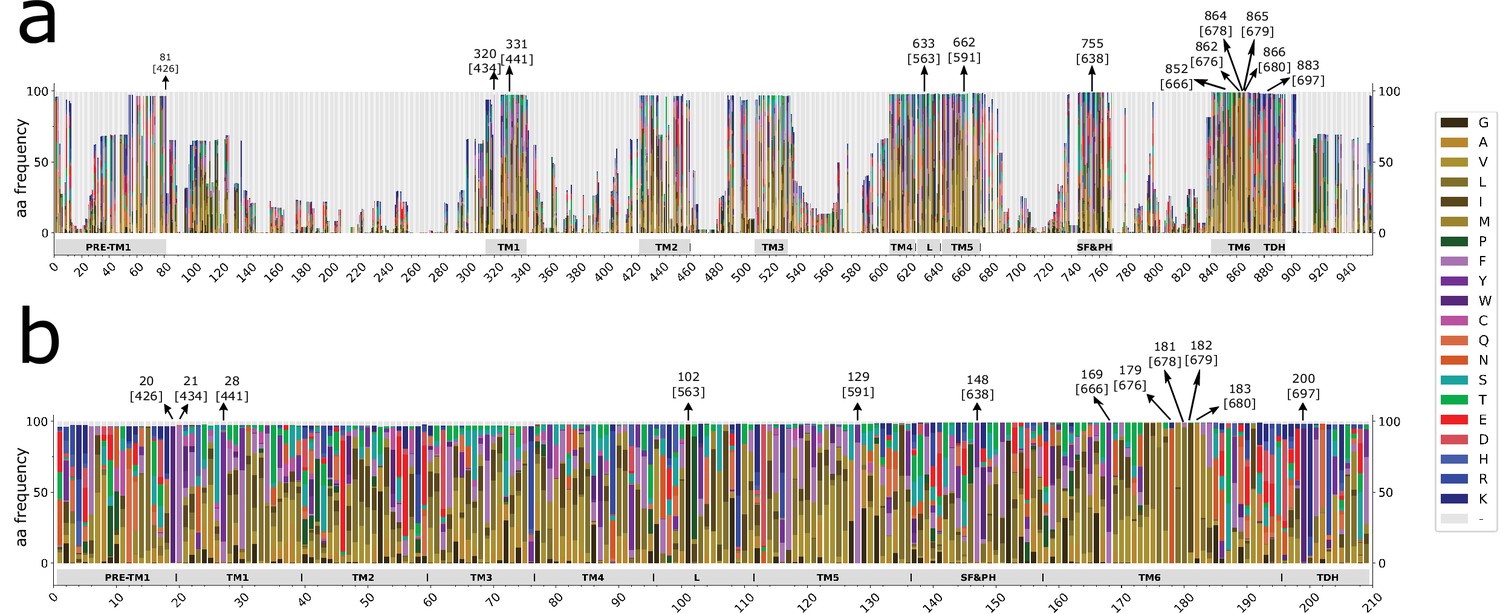
Conserved residues in GI-TRPs.
(a) Stacked histogram showing the amino acidic probability in each position of the MAFFT alignment. Gray boxes depict the trans-membrane helices (TM1–TM6) and features such as pre-TM1, the TM4–TM5 linker (L), the Selectivity Filter and Pore Helix (SF&PH) and the TRP domain helix (TDH). Numbers over the arrows indicate the position in the alignment, and in brackets the corresponding position in the rat TRPV1 primary sequence. (b) Sequence logos for the TRP family, depicting highly conserved residues (>90% identity). (c) Upper: Cartoon of a TRP channel monomer depicting the location of conserved residues in the secondary structure. Φ denotes six carbon aromatic residues (i.e., Tyr or Phe). Bottom: Table summarizing the highly conserved positions in alignment and in the corresponding position in the rat TRPV1 primary sequence, along with the percentage of identity. Consensus residues for each subfamily are indicated. The last column corresponds to the total number of fingerprint residues for each subfamily. Green residues correspond to identities while black represents homology. Red shades denote non-conserved residues. TRP, transient receptor potential.
Figure 2—figure supplement 1
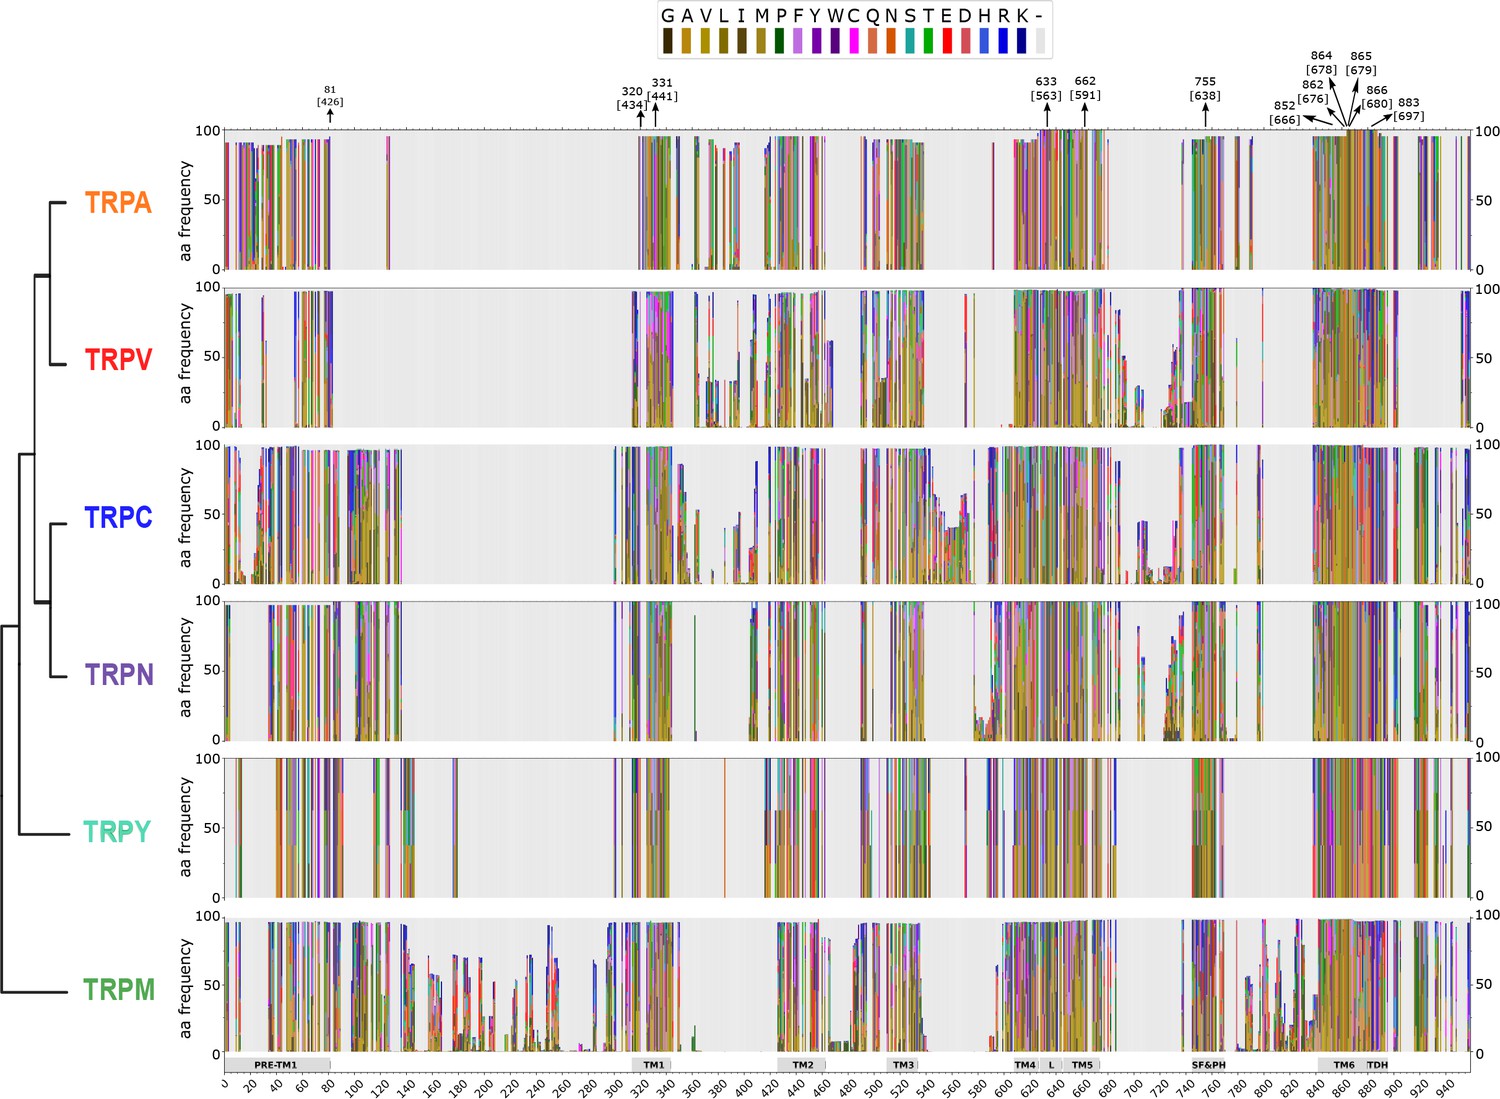
Stacked histograms showing the amino acid frequency in each position on the MAFFT alignment for the different TRP subgroups.
Gray boxes depict the trans-membrane helices (TM1–TM6) and features like pre-TM1, the TM4–TM5 linker (L), the Selectivity Filter and Pore Helix (SF&PH) and the TRP domain helix (TDH). Numbers over the arrows localize the position in the alignment, and in brackets the corresponding position in the rat TRPV1 primary sequence. TRP, transient receptor potential.
Figure 2—figure supplement 2
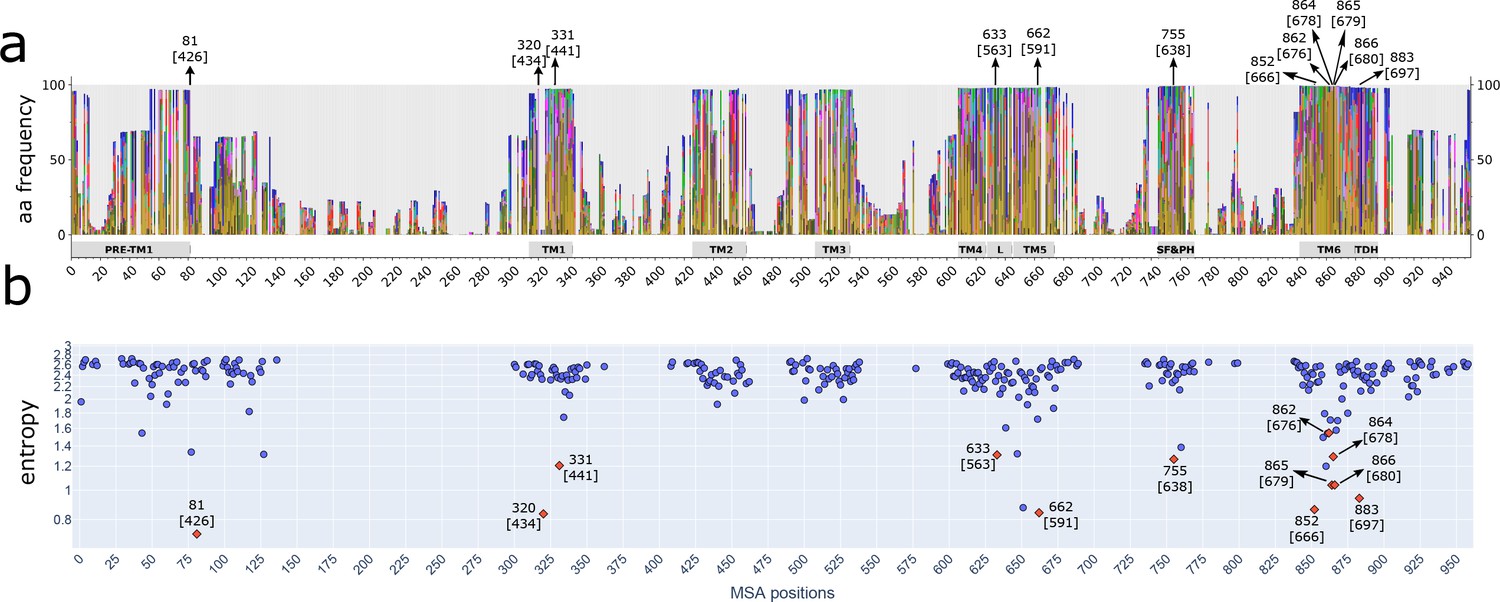
Different strategies of alignment reveal the same highly conserved residues.
(a) Stacked histograms showing the amino acidic probability in each position on the MAFFT alignment. Gray boxes depict the trans-membrane helices (TM1–TM6) and features such as pre-TM1, the TM4–TM5 linker (L), the Selectivity Filter and Pore Helix (SF&PH) and the TRP domain helix (TDH). Numbers over the arrows localize the position in the respective alignment, and in brackets the corresponding position in the rat TRPV1 primary sequence. (b) Shannon entropy of the amino acid distribution corresponding to each position in the alignment; the calculation is carried out using the emission probabilities from a hidden Markov model trained on the multiple sequence alignment. Low entropy values indicate conserved positions. TRP, transient receptor potential.
Figure 2—figure supplement 3
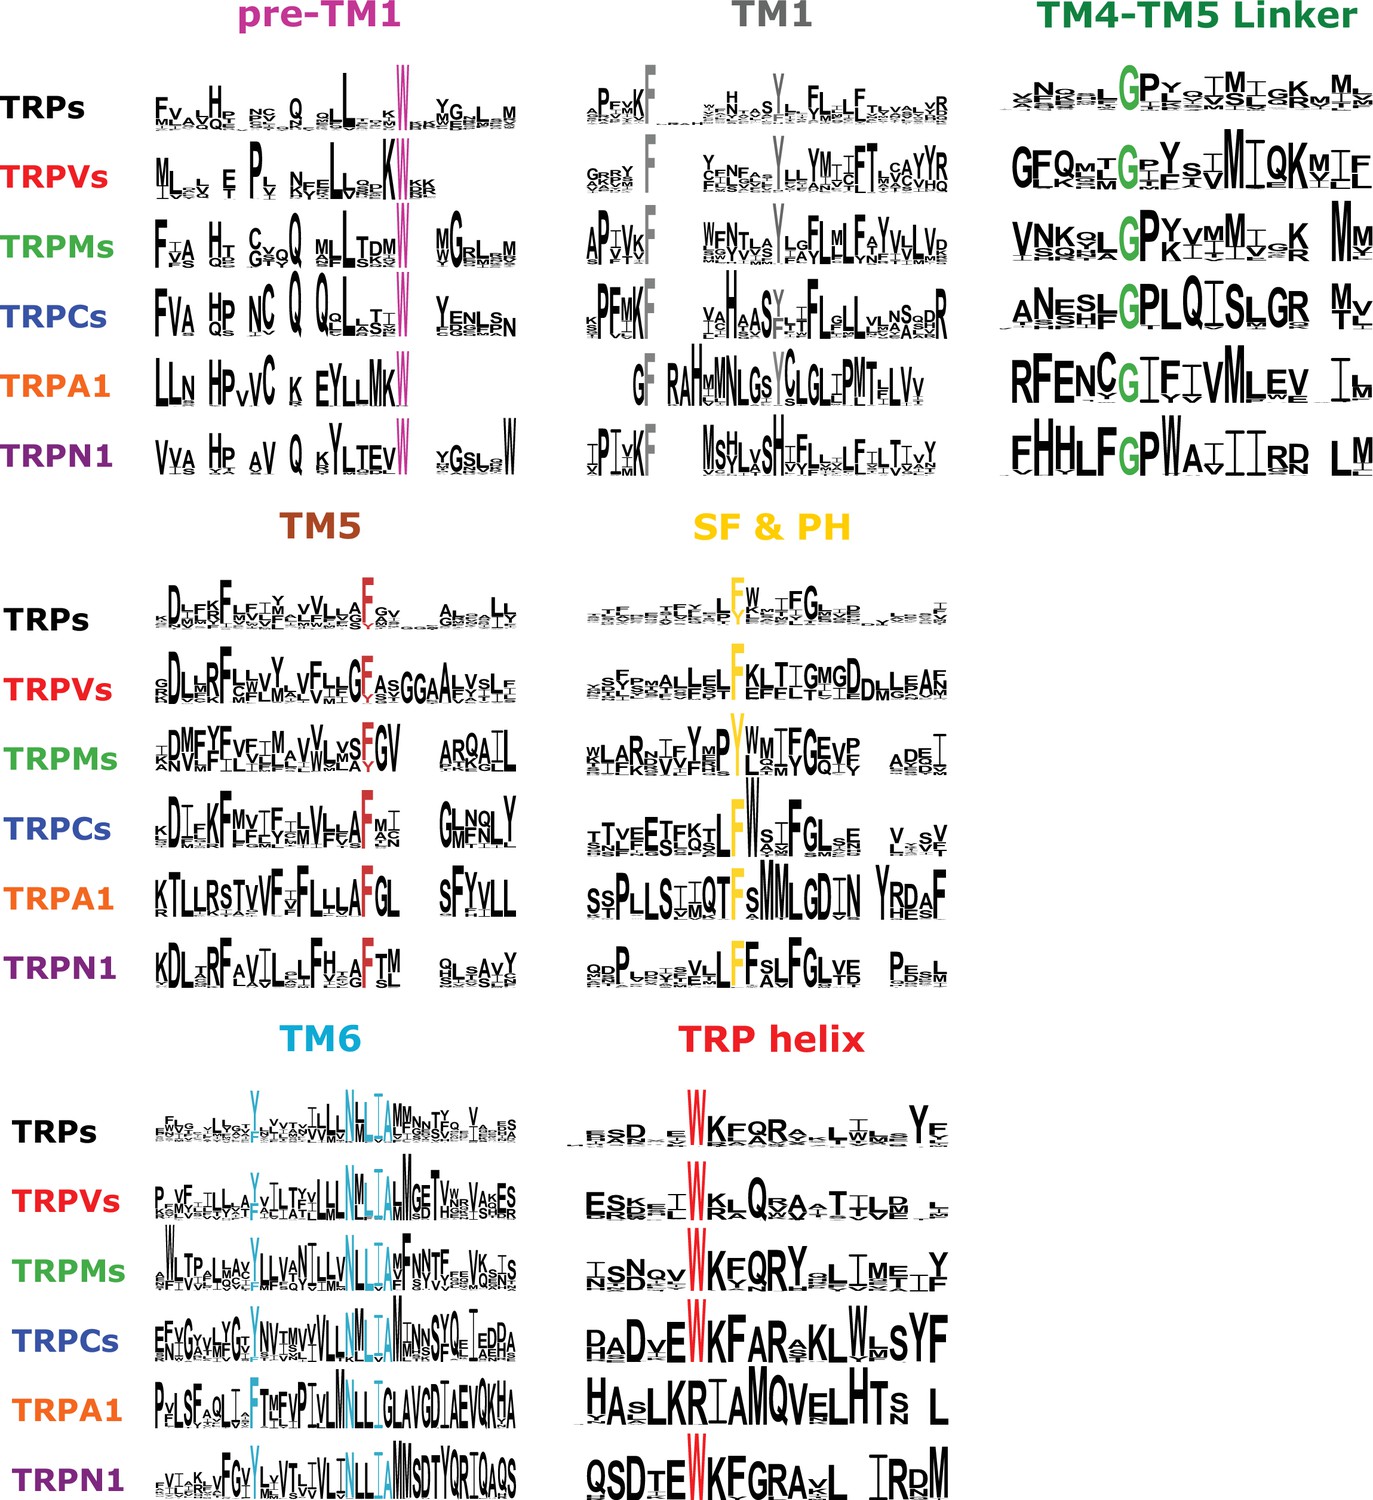
Sequence logos for the TRP family and the analyzed subfamilies, depicting highly conserved residues (>90% identity) for the MAFFT alignment.
TRP, transient receptor potential.
Figure 3 with 4 supplements

Spatial distribution of TRP channel signature residues.
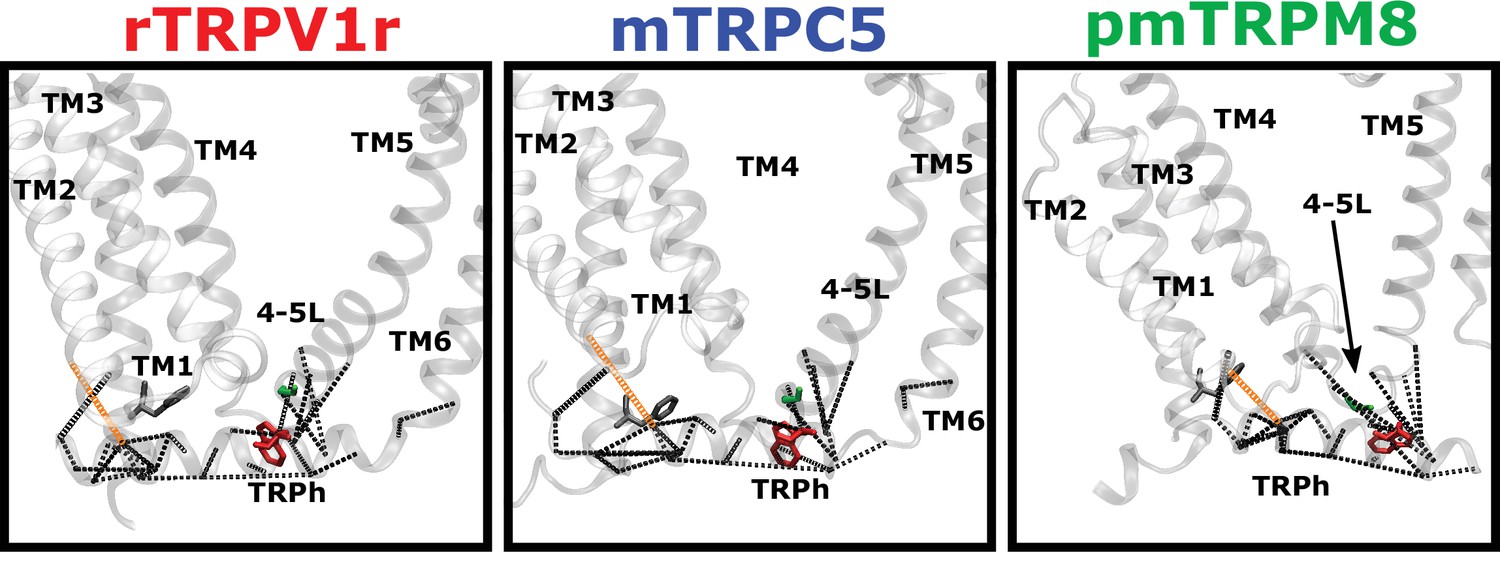
(a) Conservation rates for each position in the alignment, calculated on Consurf (see Materials and methods), mapped on rTRPV1 structure (PDB: 7LP9) (b) Highly conserved (>90%) residues are arranged in three well-defined patches, highlighted as insets and dubbed P1, P2, and P3. The structural data and residue numbering corresponds to rat TRPV1 (PDB: 7LP9). For clarity, only one protomer is shown. Backbone and residues follow the code color used in Figure 2b. 4–5L: TM4–TM5 linker; SF&PH: selectivity filter and pore helix; TRPh: TRP helix. (c) Structural alignment performed over representative channels (rTRPV1, PDB:7LP9; mTRPC5, PDB:6AEI; pmTRPM8, PDB: 6O6A; hTRPA1, PDB:3J9P; dmTRPN1, PDB:5VKQ; CrTRP1, PDB:6PW4) reveals a consistency in the position of signature residues. (d, e) Distogram of mean distances (d) and normalized variance of mean distances (e) between pair of residues on transmembrane segments, revealing the proximity of signature residues of same patches (brighter areas in (d)) and the low variability on the distances of the same pairs (brighter areas in (e)). Blue, green, and red lines identify the P1, P2, and P3 residues, respectively, and squares locate the intersection between these residues. TRP, transient receptor potential.
Figure 3—figure supplement 1
Position of signature residues in structural alignment.
By mapping the signature residues in the structural alignment released in Huffer et al., 2020, we further confirmed the high level of conservation in the 3D position of the signature residues. Red letters identify residues with different identities compared with the signature. Red and blue shade boxes depict a shift to amino or carboxyl direction with respect to white boxes in the structural alignment. These shifts arouse from displacements throughout the helix axis or its rotation in each particular structure. In 87.8% of the structures, it is necessary to use one-position shift to help coincide with the alignment of primary sequences. In yellow are the positions where there are no aligned residues (gap).
Figure 3—figure supplement 2
Coevolution analysis.
Residue pairs with high coevolution scores (top 5%) are connected by red lines. Coevolution scores were calculated using an asymmetric pseudo-likelihood maximization direct coupling analysis algorithm (aplmDCA). Signature residues are drawn in blue licorice representation (rTRPV1, PDB: 7LP9; paTRPM8, PDB:6O6A; mTRPC5, PDB:6AEI).
Figure 3—figure supplement 3
Stacked histograms showing the amino acidic probability in each position on MAFFT alignment.
(a) Complete sequence histogram. (b). Parsed alignment used for building distance matrices. The parsed alignment contains highly conserved residues with a gap frequency<0.01. Gray boxes depict the trans-membrane helices (TM1–TM6) and features like pre-TM1, the TM4–TM5 linker (L), the Selectivity Filter and Pore Helix (SF&PH) and the TRP domain helix (TDH). Numbers over the arrows localize the position in the respective dataset, and in brackets the corresponding position in the rat TRPV1 primary sequence. TRP, transient receptor potential.
Figure 3—figure supplement 4
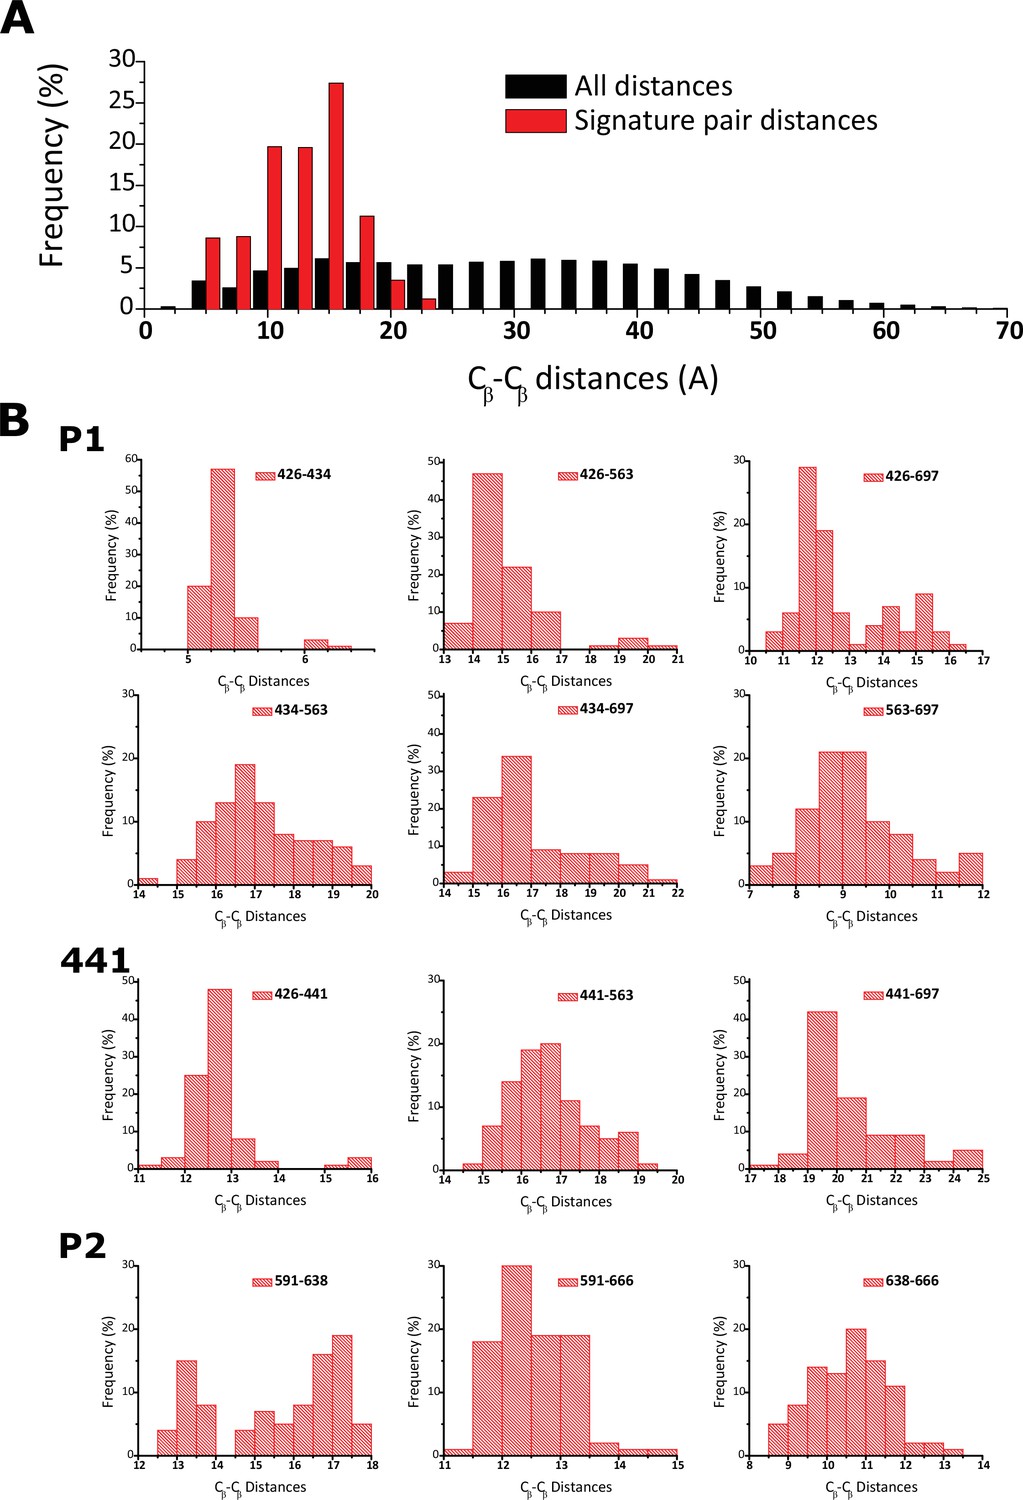
Fingerprint residues remain at close distance.
(a) Frequency histogram depicting the distribution of pairwise distances in all analyzed structures for all the residues analyzed in the distograms (black) and also the fingerprint residues (red). (b) Individual frequency histograms for the mean distances depicted in the distogram presented in Figure 3d.
Figure 4 with 2 supplements

Aromatic residue distribution in LBD.
(a) Aromatic residues facing the internal space shared by the four first transmembrane helices (core). The interacting aromatic (distance<5A) in rTRV1 (PDB:7LP9) and rKv1.2 (PDB:2R9R) are depicted in blue. In violet residues with no other aromatic at <5A. Right: surface representation of the sidechain of aromatic residues shown as licorice in the left. (b) Histogram of aromatic residues in the alignment, on the positions facing the core. At the bottom are depicted the positions in the alignment, and a (+1) or (–1) indicates that in one of the subfamilies the aromatic is immediately after or before the labeled position (shared for the rest of the subfamilies). (c) Comparison between AC volumes presented next to a schematic view of the topology obtained in our phylogenetic analysis. Blue: aromatic residues >50% conserved in the respective subfamily; red: aromatic residues >50% conserved in the respective subfamily and signature residue; black: not conserved residue present in the used structure; orange: not aromatic residue in the used structure, but present as an aromatic in >50% in the respective subfamily. Inset: Aromatic core in rTRPV1. The specific positions of the aromatics are indicated. Used structures: rTRPV1, PDB:7LP9; mTRPC5, PDB:6AEI; pmTRPM8, PDB: 6O6A; hTRPA1, PDB:3J9P; CrTRP1, PDB:6PW4; mTPC1, PDB:6C96. AC, aromatic core; LBD, ligand-binding domain.
Figure 4—figure supplement 1
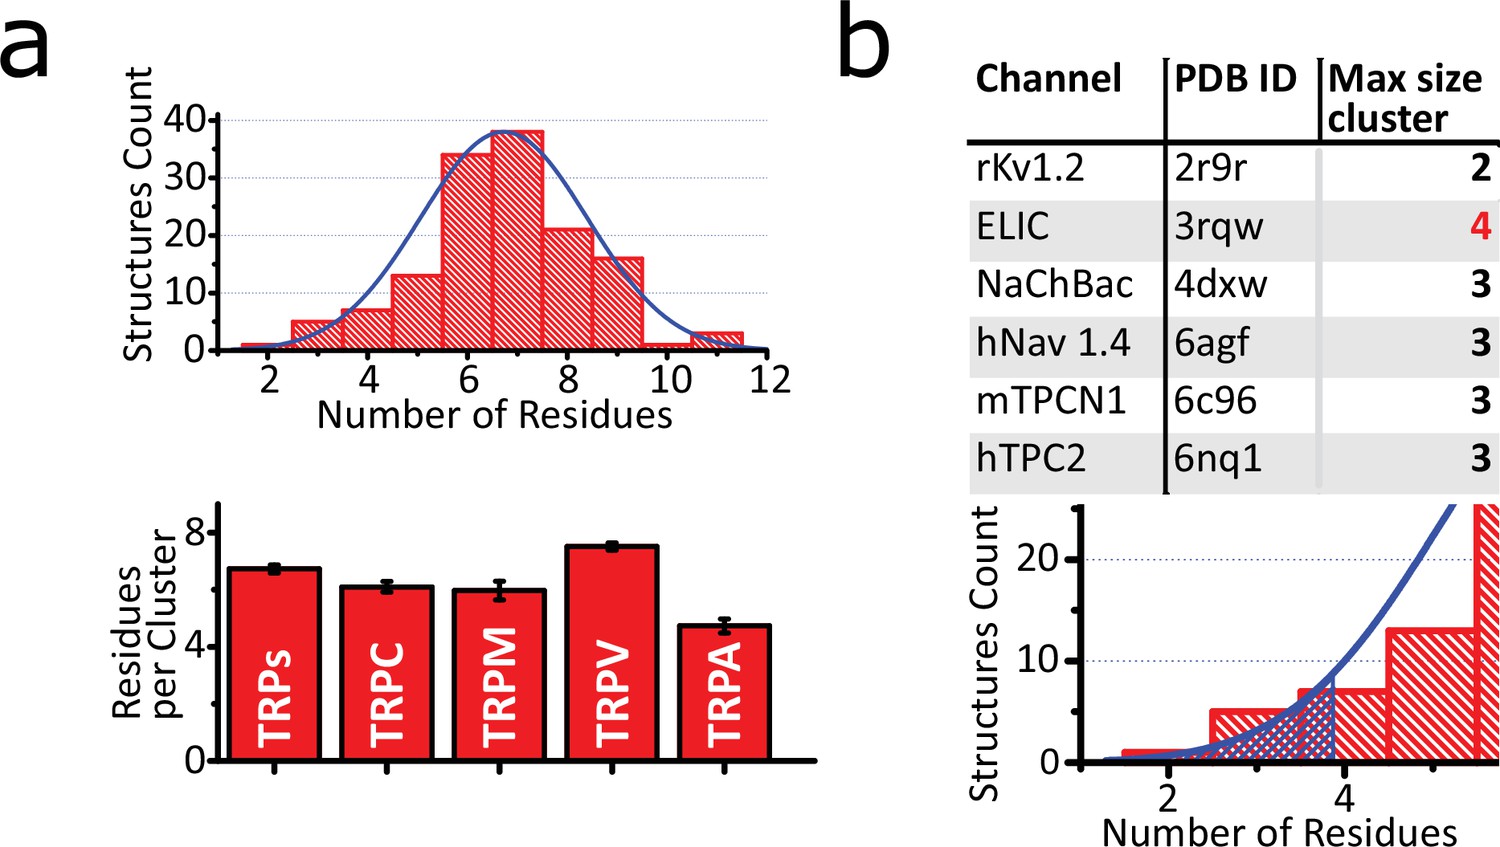
Characterization of aromatic core.
(a) Upper: Histogram of the number of aromatic residues contained in the bigger cluster of each structure, fitted to a Gaussian function (center at x=6.78 and width=2.87). Bottom: Average size of the core per subfamily. Graph shows means ± SEM. The size sample for each subfamily depends on the structure files availability (TRPs n=128; TRPA n=8; TRPC n=10; TRPM n=28; TRPV n=80) (b) Upper: Table of size of the larger cluster on non-TRP channels. Bottom: Hatch pattern showing the threshold of p<0.05 for the fitted Gaussian curve. TRP, transient receptor potential.
Figure 4—figure supplement 2
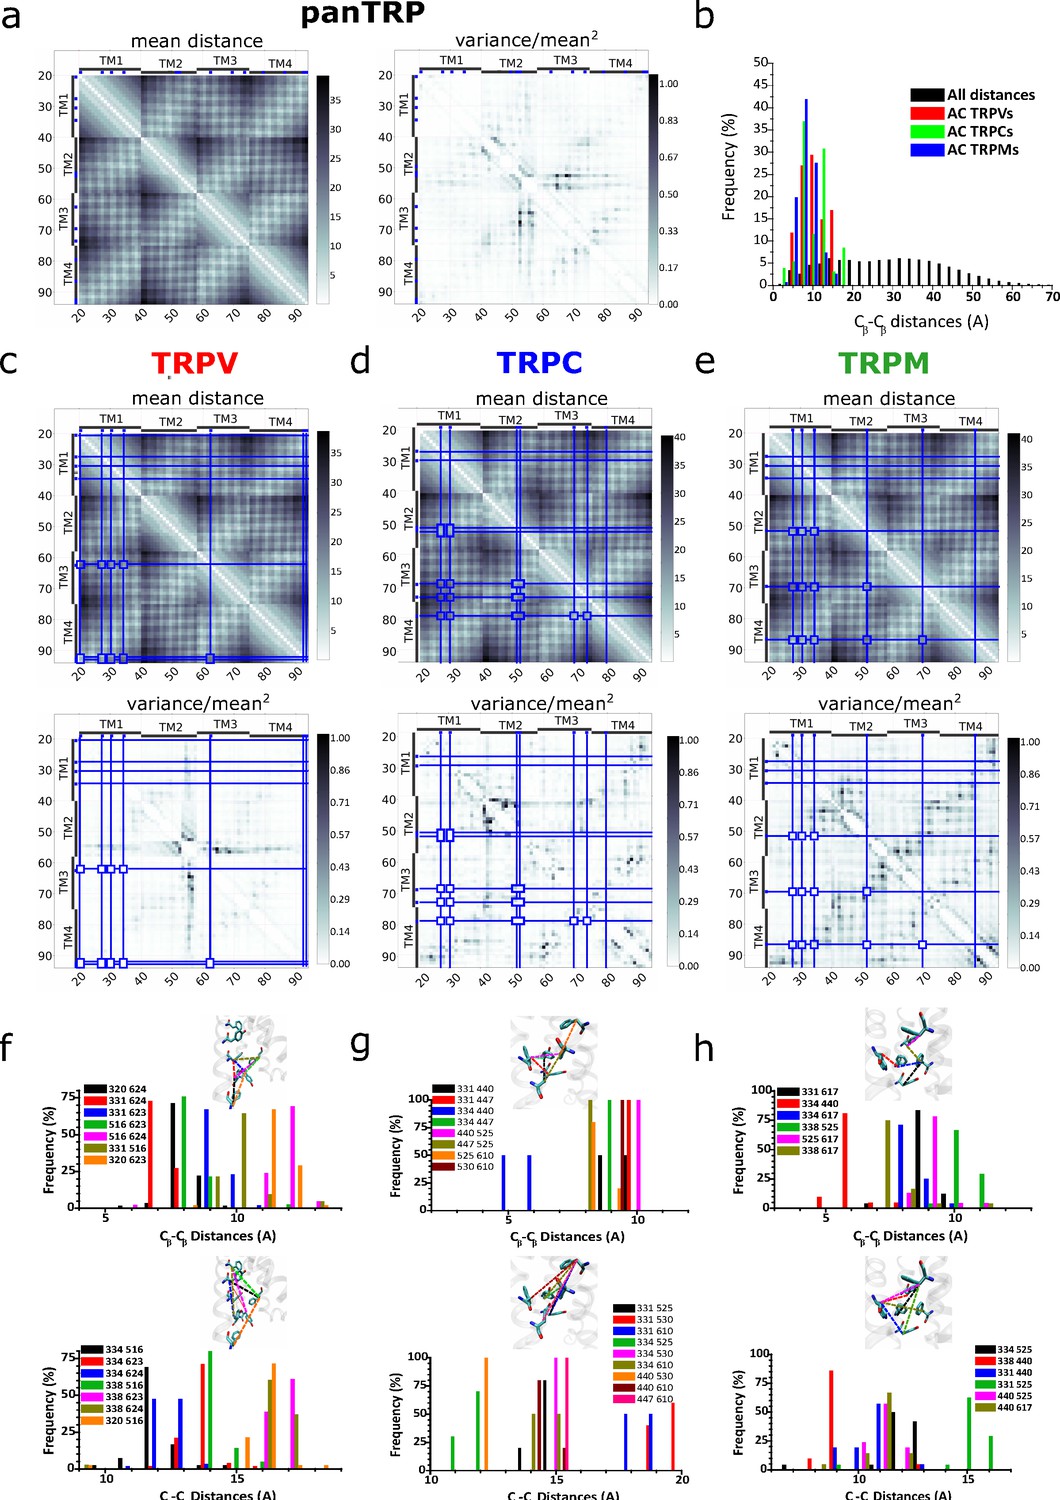
Distograms of mean distances and normalized variance of mean distances between pairs of residues within the TM1–TM4 region.
(a) Mean distance and variance distograms obtained for pan-TRP. (b) Frequency histogram for pairwise distances in all analyzed structures highlighting the AC residues (colored bars). (c–e) Distograms corresponding to TRPV, TRPC, and TRPM subgroups. Blue lines depict the position of the conserved aromatics (>50%) for each subfamily. (f–h) Individual frequency histograms for the pairwise distances depicted in the corresponding insets and the distgrams (c–e). AC, aromatic core; TRP, transient receptor potential.
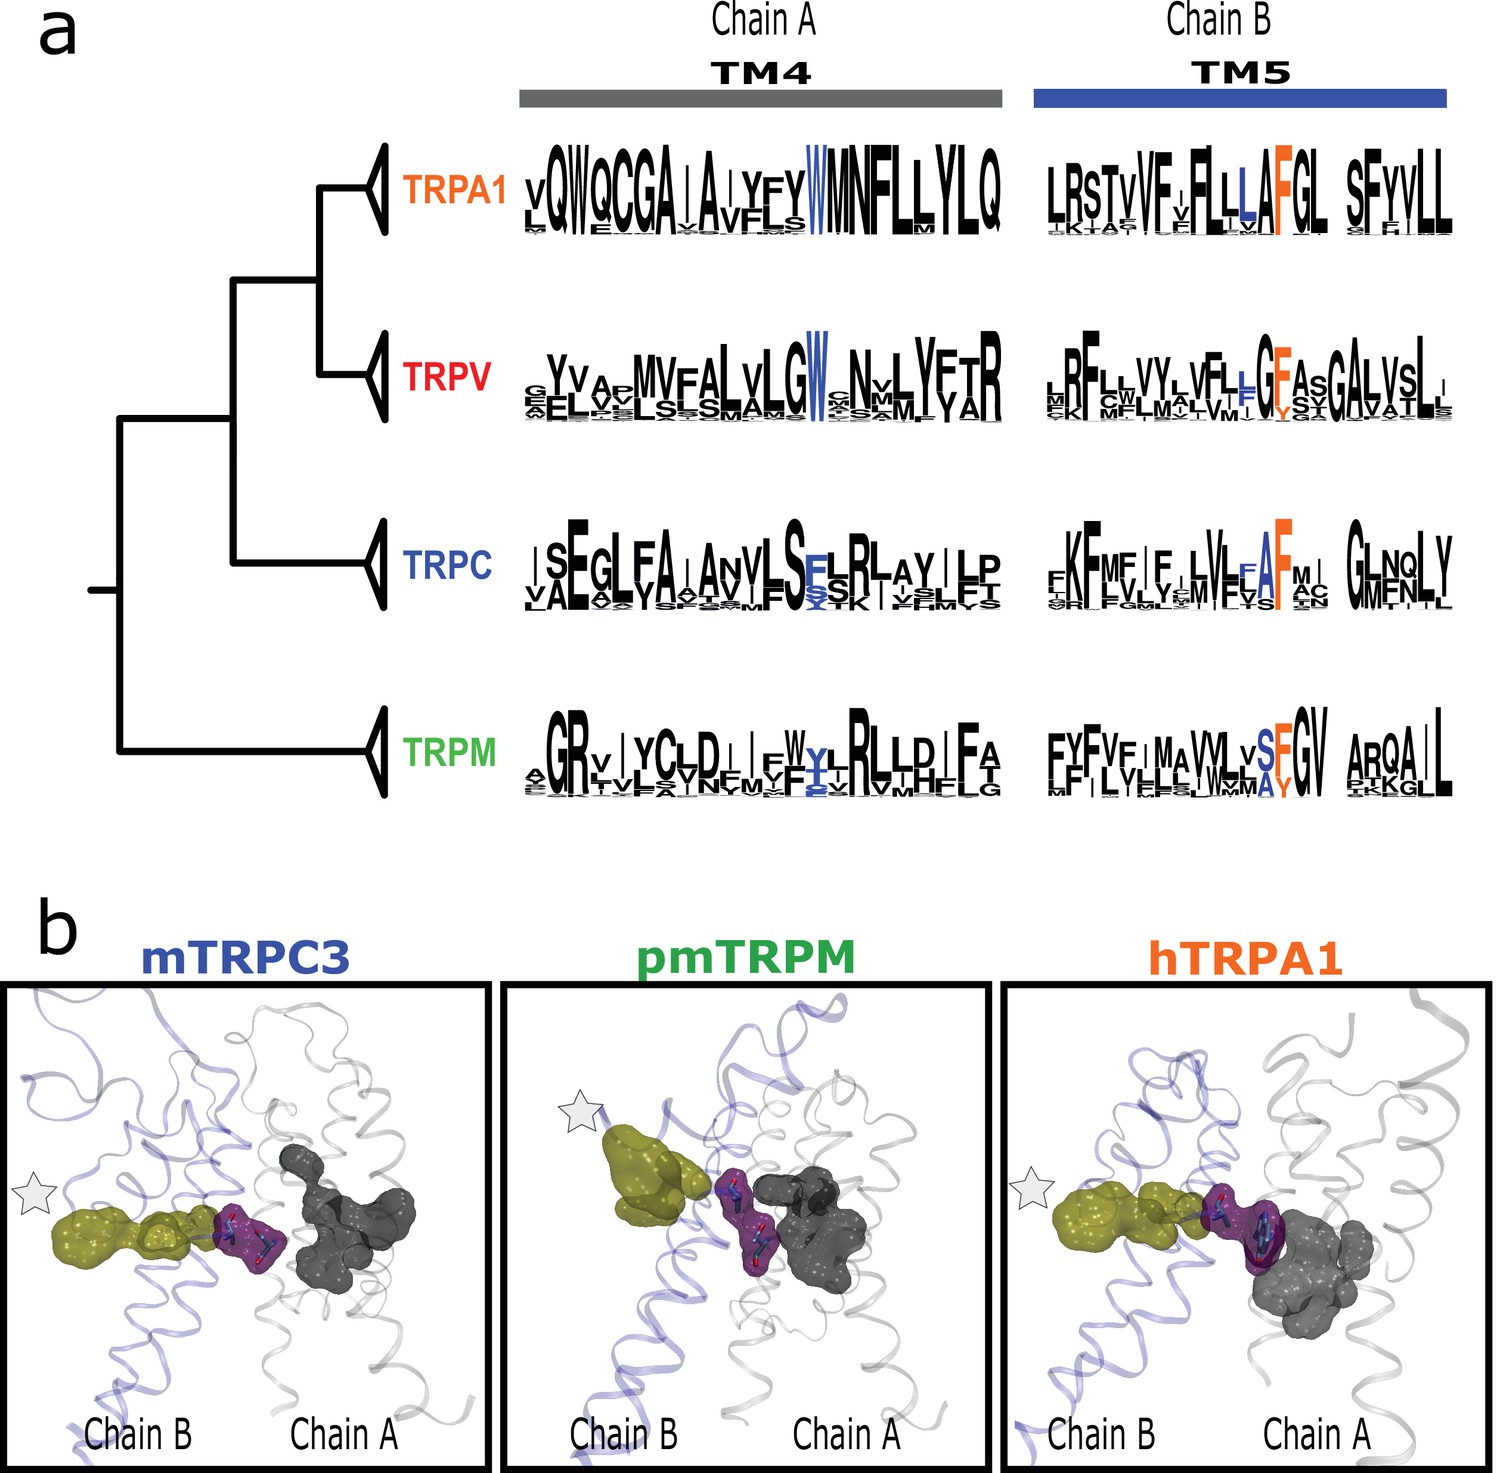
Figure 5 with 1 supplement
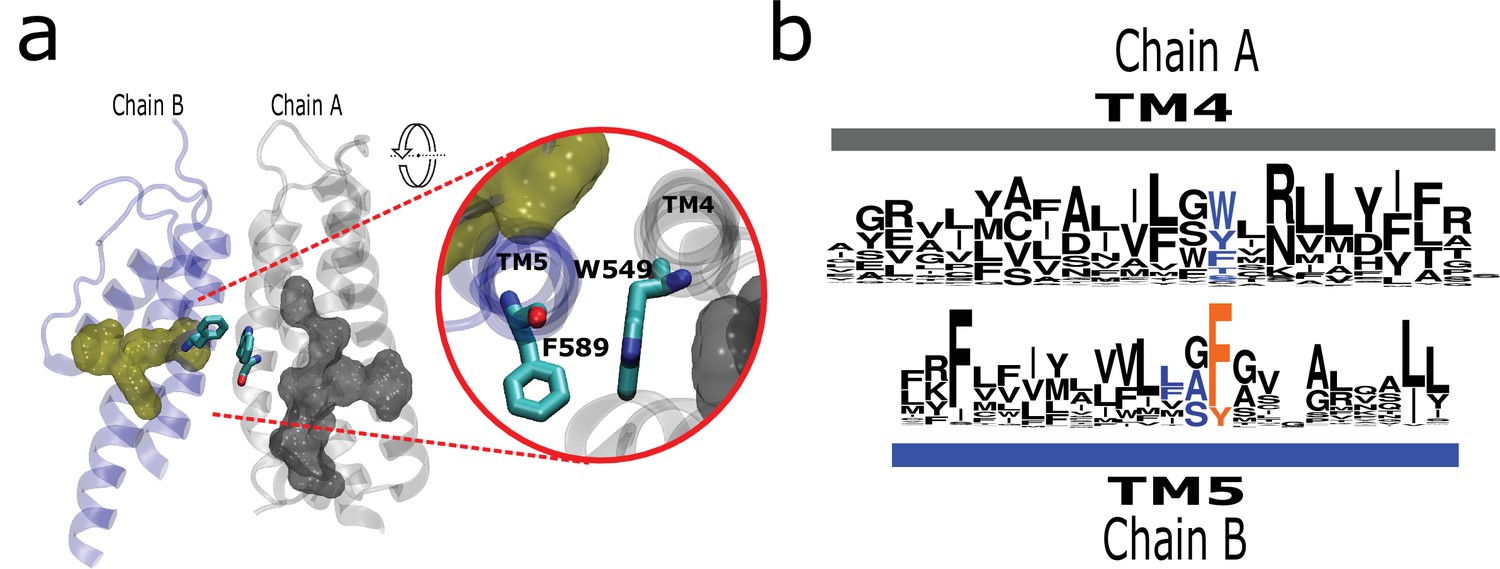
The AC connects to aromatics in P2 from neighboring subunits.
(a) A conserved intermolecular connection between residues (licorice) in helices at opposite faces to the AC (gray surface) and P2 (yellow surface). Inset: Upper view of residues establishing the inter-subunit interaction (rTRPV1, PDB:7LP9). (b) Sequence logos showing the position of residues involved in the putative intermolecular interaction in blue, and the fourth signature residue in orange. AC, aromatic core.
Figure 5—figure supplement 1
Inter-subunit interaction is conserved in subfamilies.
(a) Residues connecting TM4 and TM5 from neighboring subunits align on the same position in TM4 and at one or two positions from the fourth signature residue in TM5. (b) Lateral view of the interaction between LBD and PD from different subunits for two channels from different subfamilies. LBD, ligand-binding domain; PD, pore domain.
Figure 6
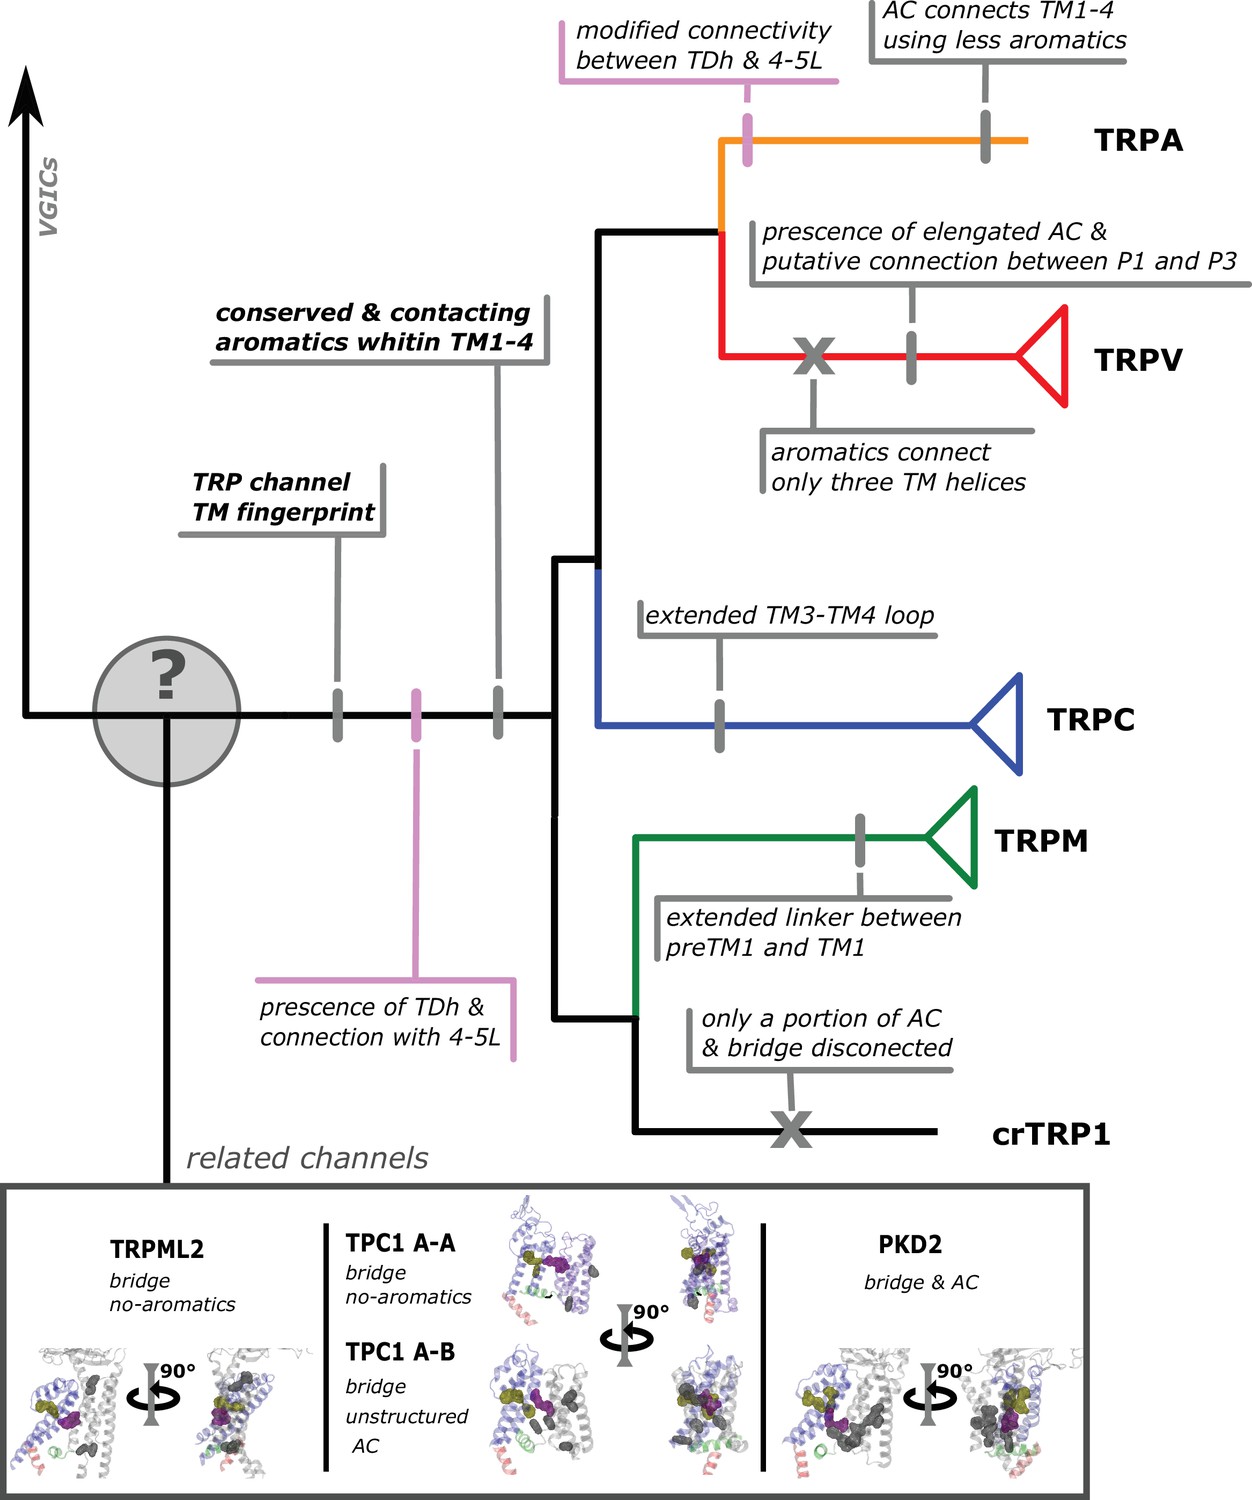
Conserved modifications observed in TRP proteins.
The different channels studied in this work are presented next to a schematic view of the topology obtained in our phylogenetic analysis. Unique TRP features are highlighted. Previous observations confirmed here are indicated in pink shades. Novel observations from the present work are indicated in gray shades. Lines represent presence while crosses represent absence or loss. TRP, transient receptor potential.
Tables
Table 1
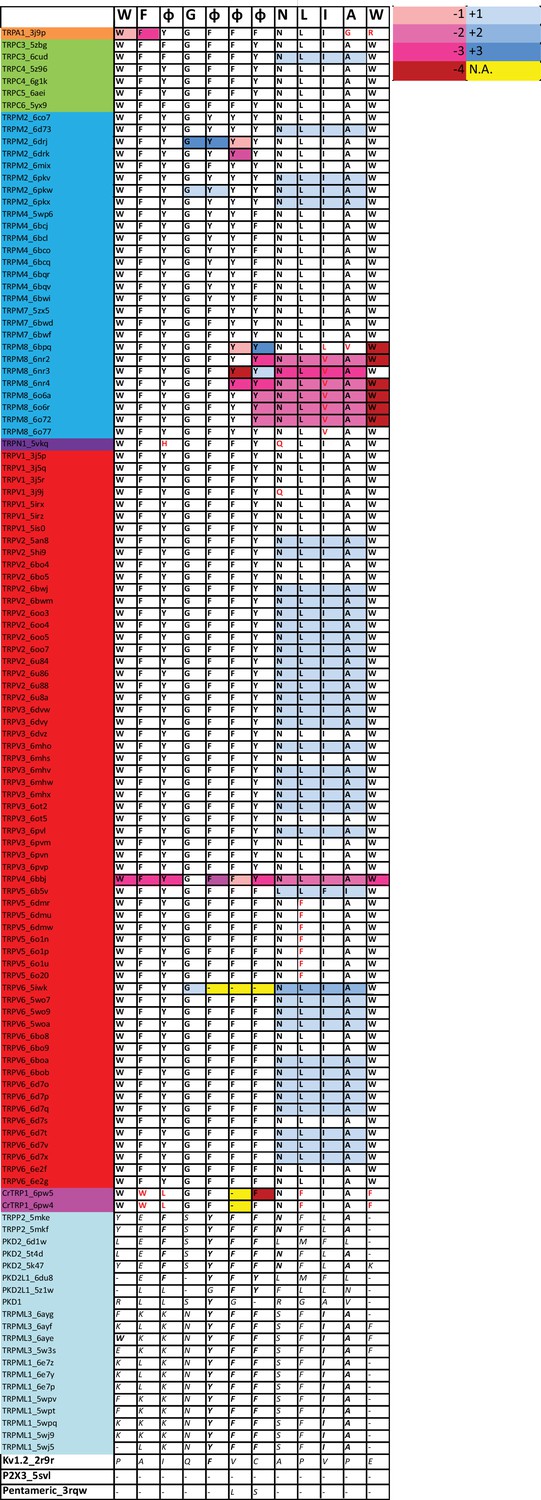
Table summarizing the percentage of identity of highly conserved positions in the alignment and in the corresponding positions in rTRPV1, pm TRPM8, mTRPC5, hTRPA1, and dmTRPN1.
Residues in the corresponding position of the two unicellular GI-TRPs identified (i.e., CrTRP1 and CsTRP1) are indicated. Corresponding residues in GII-TRPs and non-TRP channels are also indicated. The last column corresponds to the total number of fingerprint residues for consensus. Residues in solid black correspond to identities while italics represents homology. Red shades denote non-conserved residues.
| W | F | Φ | G | Φ | Φ | Φ | N | L | I | A | W | ||
|---|---|---|---|---|---|---|---|---|---|---|---|---|---|
| % Ident | 95.3 | 95.5 | 91.0 | 98.0 | 96.6 | 96.8 | 98.6 | 93.7 | 95.3 | 89.7 | 95.3 | 93.1 | |
| Pos Align | 81 | 320 | 331 | 633 | 662 | 755 | 852 | 862 | 864 | 865 | 866 | 883 | |
| Pos rTRPV1 | 426 | 434 | 441 | 563 | 591 | 638 | 666 | 676 | 678 | 679 | 680 | 697 | |
| Pos pmTRPM8 | 677 | 733 | 740 | 848 | 875 | 902 | 957 | 967 | 969 | 970 | 971 | 988 | |
| Pos mTRPC5 | 315 | 367 | 374 | 504 | 531 | 576 | 608 | 618 | 620 | 621 | 622 | 639 | |
| Pos hTRPA1 | 711 | 716 | 726 | 857 | 884 | 909 | 944 | 954 | 956 | 957 | 958 | 975 | |
| Pos dmTRPN1 | 1260 | 1304 | 1311 | 1427 | 1454 | 1501 | 1541 | 1551 | 1553 | 1554 | 1555 | 1572 | |
| TRPVs | W | F | Y | G | Φ | F | Φ | N | L | I | A | W | 12 |
| TRPMs | W | F | Y | G | Φ | Y | Φ | N | L | I | A | W | 12 |
| TRPCs | W | F | Φ | G | F | F | Φ | N | L | I | A | W | 12 |
| TRPA1 | W | F | Y | G | F | F | F | N | L | I | G | R | 10 |
| TRPN1 | W | F | H | G | F | F | Y | N | L | I | A | W | 11 |
| TRPY | W | N | S | G | F | T | Φ | N | L | I | A | Y | 8 |
| TRPS | W | Φ | Y | G | G | W | Y | T | L | F | A | W | 7 |
| TRPVL | W | - | N | G | Φ | F | W | N | F | I | A | A | 7 |
| Unicelular | |||||||||||||
| CrTRP1 | W | W | L | G | F | Q | F | N | F | I | A | F | 7 |
| CsTRP2 | W | W | Y | N | F | F | Y | N | L | I | A | F | 9 |
| TRP-GII | |||||||||||||
| hPKD2 | - | F | - | S | Y | F | F | N | F | L | A | - | 6 |
| mTRPML1 | F | F | H | N | Y | F | F | S | F | I | A | T | 6 |
| Non-TRP | |||||||||||||
| chTPCN1 I | W | Y | - | R | F | F | Y | N | L | L | A | L | 8 |
| Nav1.4 II | W | F | L | N | F | F | V | N | F | L | A | - | 7 |
| hTPCN2 II | W | F | Y | A | F | W | W | N | F | L | A | Q | 6 |
| hP2×3 | W | Y | Y | D | T | F | G | N | L | K | G | Y | 6 |
| Cav1.2 III | - | F | N | K | F | F | Y | N | F | V | G | C | 5 |
| Navab | - | - | - | R | F | F | F | N | V | V | A | - | 5 |
| KvAP | W | F | Y | G | - | - | - | - | V | V | C | W | 5 |
| Kv11.1 | E | Y | W | D | H | T | S | D | V | V | A | W | 3 |
| Kv1.2 | Y | F | G | G | - | - | - | P | L | S | S | - | 3 |
| Shaker | A | V | F | K | F | W | A | P | I | V | S | - | 2 |
| Cav1.2 III | T | T | F | S | F | W | A | P | I | V | S | - | 2 |
Table 2
Summary of structural-functional studies and the reported effects of site directed mutagenesis in signature residues.
First column indicates the equivalent signature residue in the rTRPV1 sequence. Second column indicates the channel member studied. Third and fourth columns correspond to the type of study used to determine functional effects. MDS, molecular dynamics simulations; SDM, site-directed mutagenesis.
| TRPV1 position | Channel | Residue | Evidence source | Effect | Reference |
|---|---|---|---|---|---|
| W426 | rTRPV1 | W426A | SDM | Insensitive to Capsaicin | Zheng et al., 2018a |
| hTRPV3 | W433 | Structure | Part of the 2-APB binding pocket | Zubcevic et al., 2019 | |
| rTRPV1 | W426A | SDM | Impaired Voltage and Capsaicin response | Zheng et al., 2018b | |
| rTRPM8 | W682A | SDM | Impaired Voltage and Menthol response | Zheng et al., 2018a | |
| hTRPA1 | W711 | Structure | Interaction site with phospholipids | Suo et al., 2020 | |
| F434 | drTRPC4 | F366 | Structure | Part of cholesterol binding pocket | Vinayagam et al., 2018 |
| faTRPM8 | F738 | Structure | Part of the Icilin and WS-12 binding pocket | Izquierdo et al., 2021 | |
| F/Y441 | TRPV1 | Y441S | SDM | Nonfunctional | Boukalova et al., 2013 |
| rTRPM8 | Y745H | SDM | Critical on Menthol Sensitivity. | Bandell et al., 2006 | |
| Y745H | SDM | Low response to Mentol, but normal response to temperature. Critical on inhibition SKF96365-mediated of Cold- and voltage-activation, but just partially on other inhibitor | Malkia et al., 2009 | ||
| Y745H | SDM | Low response to Mentol, but normal response to temperature | Nguyen et al., 2021 | ||
| hTRPC3 | Y374 | Structure | Part of the inhibitor, clemizole, binding pocket | Song et al., 2021 | |
| G563 | rTRPV1 | G563S/C | SDM | Gain of Function | Boukalova et al., 2010 |
| G563S/A | SDM | Gain of Function, Inhibition by proton of Max current induced by capsaicin | Boukalova et al., 2013 | ||
| mTRPV1 | G564S | SDM | Gain of Function | Duo et al., 2018 | |
| rTRPV3 | G573S/C | SDM | Gain of Function | Xiao et al., 2008 | |
| G573S/C | SDM | Gain of Function, Olmsted Syndrome | Lin et al., 2012 | ||
| mTRPV3 | G573S | SDM | Non responsive to Menthol, Camphor and APB and mildly responsive to temperature | Nguyen et al., 2021 | |
| rTRPV1 | G563S | SDm | Non responsive to Camphor and APB and mildly responsive to temperature | Nguyen et al., 2021 | |
| mTRPC4/5 | G503S/G504S | SDM | Gain of Function | Beck et al., 2013 | |
| hTRPC3 | G552 | Structure | Coupled W673 from TRP domain | Fan et al., 2018a | |
| hTRPC3 | G552 | Structure | Coupled W673 from TRP domain | Fan et al., 2018a | |
| F/Y591 | rTRPV1 | F591 | MDS | Part of the vanilloid binding pocket | Elokely et al., 2016 |
| F591A | SDM | Low Capsaicin response, non response to pH and not RTX binding | Ohbuchi et al., 2016 | ||
| hTRPM4 | Y944 | Structure | Forming face to face π-stack with F1027 on TM5 | Duan et al., 2018 | |
| F/Y638 | rTRPV1 | F638A | SDM | Gain of Function, NMDG/Na selectivity raised | Munns et al., 2015 |
| F638W | SDM | Enhanced the sensitivity to the acylpolyamine toxins AG489 and AG505 | Kitaguchi and Swartz, 2005 | ||
| rTRPV2 | F601 | Structure | Part of the cannabidiol binding pocket | Pumroy et al., 2019 | |
| rTRPM8 | Y908A/W | SDM | Not responsive to Cold and Menthol but responsive to Icilin | Bidaux et al., 2015 | |
| Y908F | SDM | Totally responsive to Cold and Menthol and Icilin | Bidaux et al., 2015 | ||
| zfTRPC4 | F572 | Structure | Stabilizes the pore through an hydrophobic contact with neighbor protomer | Vinayagam et al., 2018 | |
| mTRPC5 | F576A | SDM | Nonfunctional, dominant negative | Strübing et al., 2003 | |
| hTRPC5 | F576A | SDM | Differential effect on agonists: Not responsive to AM237, but responsive elgerin | Wright et al., 2020 | |
| hTRPA1 | F909A | SDM | Affect different agonists and antagonists responses | Chandrabalan et al., 2019 | |
| F909T | SDM | Abolish the A-967079-inhibition of AITC-evoked response | Paulsen et al., 2015 | ||
| Y/F666 | rTRPV1 | Y666A | SDM | Nonfunctional (present in membrane) | Susankova et al., 2007 |
| mTRPV3 | Y661C | SDM | Not responsive to Temp, but responsive to agonist (2-APB and Camphor) | Grandl et al., 2008 | |
| hTRPV4 | Y702L | SDM | Not responsiveness to Temp, Agonist and Swelling | Klausen et al., 2014 | |
| hTRPM6 | Y1053C | SDM | Causes hypomagnesemia with secondary hypocalcemia, Decreased Current amplitude in heterologus expression in HEK293 | Lainez et al., 2014 | |
| hTRPM4 | F1027 | Structure | Forming face to face π-stack with Y944 on TM5 | Duan et al., 2018 | |
| hTRPA1 | F909A | SDM | Affect different agonists responses | Chandrabalan et al., 2019 | |
| N676 | rTRPV1 | N676 | MDS | Gating relies on the rotatory motion of N676 | Kasimova et al., 2018 |
| N676A | SDM | Nonfunctional (present in membrane) | Susankova et al., 2007 | ||
| N676F | SDM | Not responsive to Temp and Agonist (Cap/RTX) and reduced response to pH | Kuzhikandathil et al., 2001 | ||
| hTRPA1 | N944A | SDM | Abolished inhibition by AZ868 and A-967079, but not by HC-030031 | Klement et al., 2013 | |
| L678 | rTRPV1 | L678A | SDM | Low response to Agonist (Cap) and Temp, but normal response to both at the same time | Susankova et al., 2007 |
| L678P | SDM | Not responsive to Temp and Agonist (Cap/RTX) and reduced response to pH | Kuzhikandathil et al., 2001 | ||
| TRPV3 | L768F | SDM | Olmsted Syndrome and Erythromelalgia (gain of function) | Duchatelet et al., 2014 | |
| TRPC3 | L654 | Structure | Constriction site in the lower region of the pore | Fan et al., 2018a | |
| I679 | rTRPV1 | I697 | Structure | Constriction site in the lower region of the pore | Liao et al., 2013 |
| I697 | Structure | Constriction site in the lower region of the pore | Cao et al., 2013a | ||
| I697 | Structure | Constriction site in the lower region of the pore | Gao et al., 2016 | ||
| I697 | Structure | Constriction site in the lower region of the pore | Chugunov et al., 2016 | ||
| I697 | Structure | Constriction site in the lower region of the pore | Susankova et al., 2007 | ||
| mTRPM4 | I1036 | Structure | Constriction site in the lower region of the pore | Guo et al., 2017 | |
| hTRPM4 | I1040 | Structure | Constriction site in the lower region of the pore | Autzen et al., 2018 | |
| drTRPC4 | I617 | Structure | Constriction site in the lower region of the pore | Vinayagam et al., 2018 | |
| rTRPV4 | I715 | SDM | Hydrophobic single-residue gate. Higer resting currents | Zheng et al., 2018a | |
| mTRPC4 | I617N | SDM | Hydrophobic single-residue gate. Higer resting currents | Zheng et al., 2018b | |
| rTRPM8 | V976S | SDM | Hydrophobic single-residue gate. Higer resting currents | Zheng et al., 2018a | |
| A680 | rTRPV1 | A680 | MDS | Change of Solvatation | Chugunov et al., 2016 |
| rTRPV4 | A716S | SDM | Not responsive to agonists (4αPDD, Hypotonicity and AA), cause SMD Kozlowski type, and Metatropic Dysplasia | Krakow et al., 2009 | |
| hTRPVA1 | G955A | SDM | Slower inactivation rate. Lower rectification rates | Benedikt et al., 2009 | |
| G958R | SDM | Inward-rectifier, constitutively active at resting potential, and impaired response to AITC | Benedikt et al., 2009 | ||
| W697 | rTRPV1 | W697 | Structure | It forms a hydrogen bond with the main chain carbonyl oxygen of F559 at the beginning of the S4–S5 linker | Liao et al., 2013 |
| W697A | SDM | Low Response to Cap/Em | Valente et al., 2008 | ||
| W697x | SDM | Low Response to Cap/Em, Affect allosteric activation | Gregorio-Teruel et al., 2014 | ||
| TRPV3 | W692G | SDM | Gain of Function, Olmsted Syndrome | Lin et al., 2012 | |
| TRPV4 | W733R | SDM | Gain of Function, limited agonist response, and not inactivation to long depolarization | Teng et al., 2015 | |
| TRPC3 | W673 | Structure | It is extensively coupled with the S4–S5 linker through interactions with G552 | Fan et al., 2018a | |
| TRPC4 | W674 | Structure | Coupled with the S4–S5 linker through interactions with G553 and P546 on TM4 | Fan et al., 2018b |
Table 3
Summary of mutation effects reported in the literature for residues forming part of the AC and the conserved residue at TM4 connecting TM4 with TM5.
First column indicates the equivalent signature residue in the rTRPV1 sequence. Second column indicates the channel studied. Third row corresponds to the effect of the mutation and/or proposed function.
| TRPV1 position | Channel | Mutation | Effect | Reference |
|---|---|---|---|---|
| F/Y444 | rTRPV1 | Y444S | Nonfunctional | Boukalova et al., 2013 |
| mTRPM3 | Y885T | Impaired non-canonical current induced by pregnenolone sulfate +clotrimazol | Held et al., 2018 | |
| F448 | rTRPV1 | F448L | Decreased pH response but maintain all Cap responsiveness | Boukalova et al., 2013 |
| mTRPM3 | Y888T | Similar to wt response to pregnenolone sulfate +clotrimazol | Held et al., 2018 | |
| Y/F554 | rTRPV1 | Y554A | Nonfunctional (Cap 10 µM, –70 to 200 mV, 48 °C) | Boukalova et al., 2010 |
| Y554F | Normal responsiveness | Boukalova et al., 2010 | ||
| Y554A | Not responsiveness to pH, Cap and RTX | Elokely et al., 2016 | ||
| Y554A | Increased sensitivity and affinity to 2-APB | Singh et al., 2018a | ||
| rTRPV2 | Y514A | Increased sensitivity and affinity to 2-APB | Singh et al., 2018b | |
| rTRPV3 | Y564A | Increased affinity to 2-APB | Singh et al., 2018a | |
| Y/F555 | rTRPV1 | Y555S | Nonfunctional (Cap 10 µM, –70 to 200 mV, 48 °C) | Boukalova et al., 2010 |
| Y555F | Normal responsiveness | Boukalova et al., 2010 | ||
| W549 | rTRPV1 | W549A | Not responsive to Cap (and RTX an others) and pH | Ohbuchi et al., 2016 |
| rTRPV1 | W549A | Interaction with vanillyl moiety of RTX or Capsaicin | Gavva et al., 2004 | |
| hTRPV4 | W568A | Impaired responsiveness to heat and agonists (4α-PDD and BAA); but responsive to swelling and endogen lipids | Vriens et al., 2007 | |
| mTRPM3 | W982R | Abolished non-canonical current induced by pregnenolone sulfate +clotrimazol | Held et al., 2018 | |
| mTRPM3 | W982F | Similar to wt response to pregnenolone sulfate +clotrimazol | Held et al., 2018 | |
| hTRPA1 | Y840F | Reduced potency of ligand (GNE551) | Liu et al., 2021 | |
| hTRPA1 | Y840W/H/L/A | Completely abolished potence of ligand (GNE551) | Liu et al., 2021 | |
| hTRPA1 | Y840A | Impaired response to AITC and almost abolished to β-Eudesmol | Ohara et al., 2015 |
Additional files
-
MDAR checklist
- https://cdn.elifesciences.org/articles/73645/elife-73645-mdarchecklist1-v3.docx
-
Supplementary file 1
Accession numbers of the TRPs genes used in this study.
- https://cdn.elifesciences.org/articles/73645/elife-73645-supp1-v3.xlsx
Download links
A two-part list of links to download the article, or parts of the article, in various formats.
Downloads (link to download the article as PDF)
Open citations (links to open the citations from this article in various online reference manager services)
Cite this article (links to download the citations from this article in formats compatible with various reference manager tools)
Sequence and structural conservation reveal fingerprint residues in TRP channels
eLife 11:e73645.
https://doi.org/10.7554/eLife.73645


