Parallel processing by distinct classes of principal neurons in the olfactory cortex
- Department of Neurobiology, Duke University Medical School, United States
Figures
Figure 1 with 6 supplements
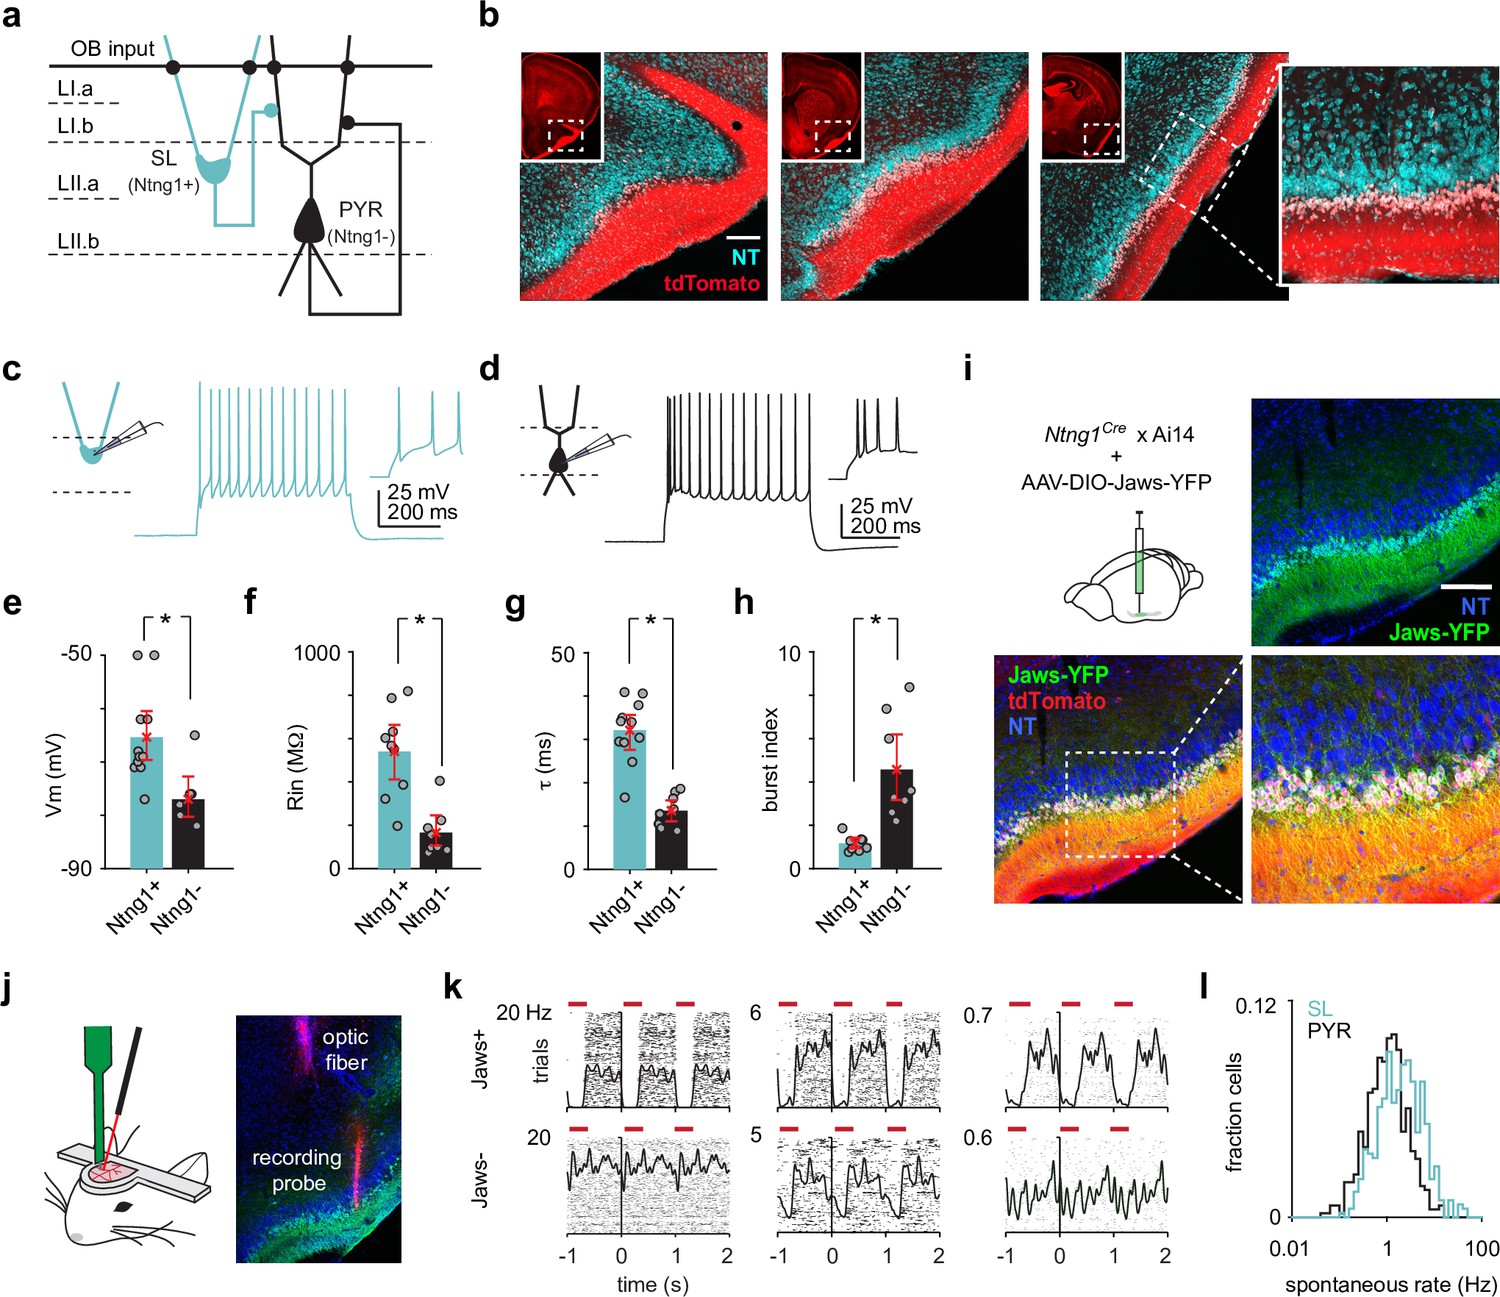
Semilunars (SLs) can be optogenetically identified from extracellular recordings of awake, head-fixed Ntng1Cre mice.
(a) Schematic of SL and pyramidal (PYR) connectivity and input sources within piriform cortex (PCx). (b) Coronal sections from a Ntng1Cre/Ai14 mouse brain showing tdTomato labeling from anterior to posterior PCx. tdTomato labeling is restricted to superficial layer II of PCx. Scale bar is 200 μm. (c) Whole-cell current-clamp recordings were obtained from acute brain slices isolated from Ntng1Cre/Ai14 mice. Example voltage responses to direct current injections for a Ntng1+ (tdTomato+) cell. (d) As in (a). but for a Ntng1- (unlabeled) cell. (e) Resting membrane potentials of Ntng1+ and Ntng1- cells (Ntng1+: –65.4 mV [–70,–60], n = 11 cells; Ntng1-: –77.0 mV [–80.6,–72.9], n = 7 cells; p=5.27 × 10⁻⁴, unpaired t-test). (f) Input resistances of Ntng1+ and Ntng1- cells (Ntng1+: 541 MΩ [415, 669], n = 9 cells; Ntng1-: 166 MΩ [104, 243], n = 8 cells; p=2.15 × 10⁻⁴, unpaired t-test). (g) Membrane time constants of Ntng1+ and Ntng1- cells (Ntng1+: 32.1 ms [27.7, 35.8], n = 11 cells; Ntng1-: 13.6 ms [11.2, 16.0], n = 8 cells; p=1.29 × 10⁻⁵, unpaired t-test). (h) Burst indices of Ntng1+ and Ntng1- cells (Ntng1+: 1.16 [0.926, 1.41], n = 8 cells; Ntng1-: 4.57 [3.12, 6.19], n = 8 cells; p=1.43 × 10⁻⁴, unpaired t-test). (i) Coronal section of anterior PCx from an experimental Ntng1Cre/Ai14 mouse showing selective and robust expression of the inhibitory opsin, Jaws, in SLs. Scale bar is 200 μm. (j) Schematic of recording probe and optic fiber positioning for opto-tagging (left). Histology showing actual positioning of the recording probe and optic fiber in PCx after both were painted with DiI (right). (k) Raster plots with trials aligned to the onset of each light pulse for six example units that were later categorized as either Jaws+ (top) or Jaws- (bottom). (l) Distribution of spontaneous spike rates for SLs (blue, n = 426 cells) and PYRs (black, n = 464 cells).
Figure 1—figure supplement 1
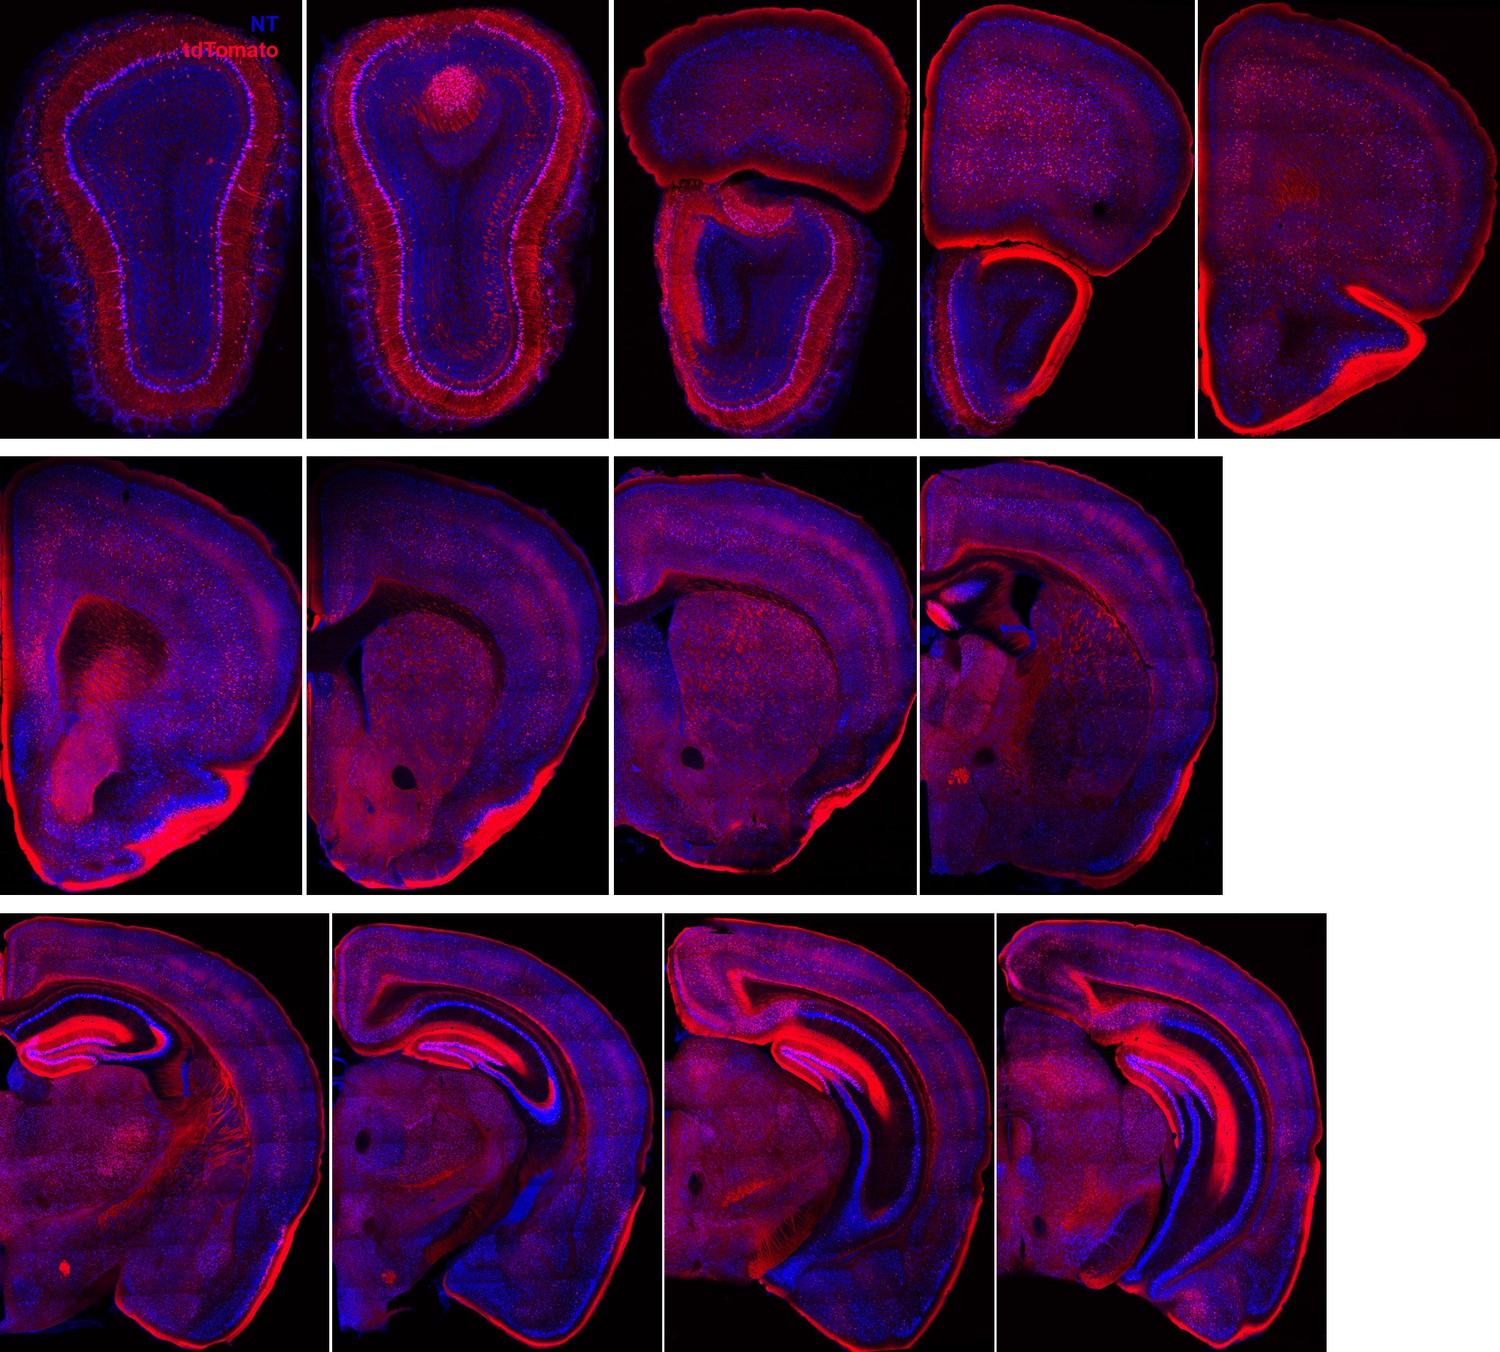
Ntng1+/Cre+ neurons throughout the brain.
A series of coronal sections through a Ntng1Cre/Ai14 mouse showing Ntng1 expression patterns throughout the brain.
Figure 1—figure supplement 2
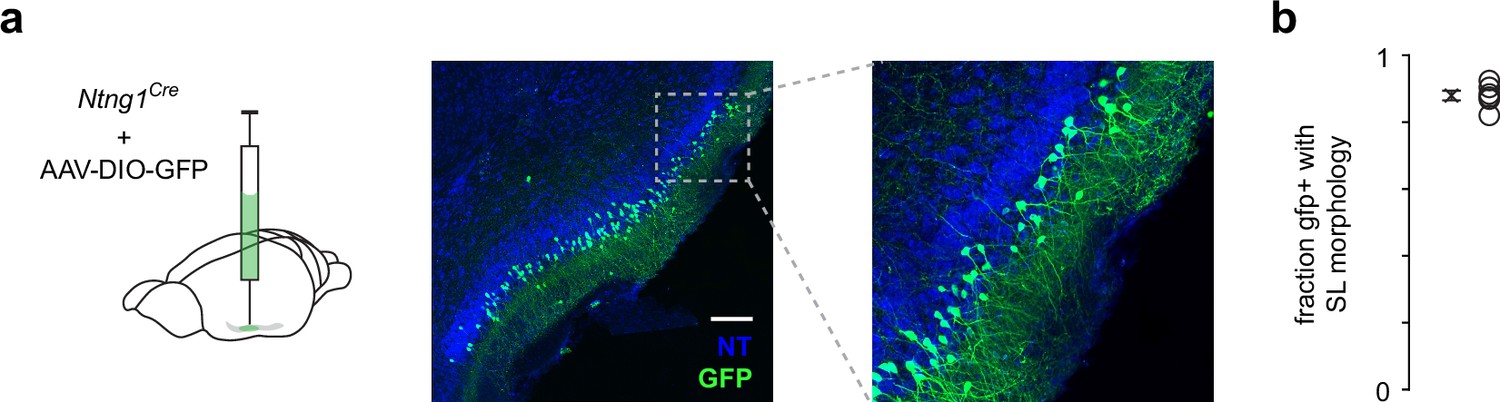
Ntng1+ cells have similar laminar and morphological properties as semilunars (SLs).
(a) A low titer of Cre-dependent GFP was injected into anterior piriform cortex (PCx) to sparsely label a small subset of Ntng1+ neurons. This allowed better visibility or GFP+ cell morphology and laminar location. Scale bar is 200 μm. (b) Quantification of the fraction of GFP+ cells that have SL morphology (half-moon-shaped somata, two prominent apical dendrites, no basal dendrites) and were located in layer IIa.
Figure 1—figure supplement 3
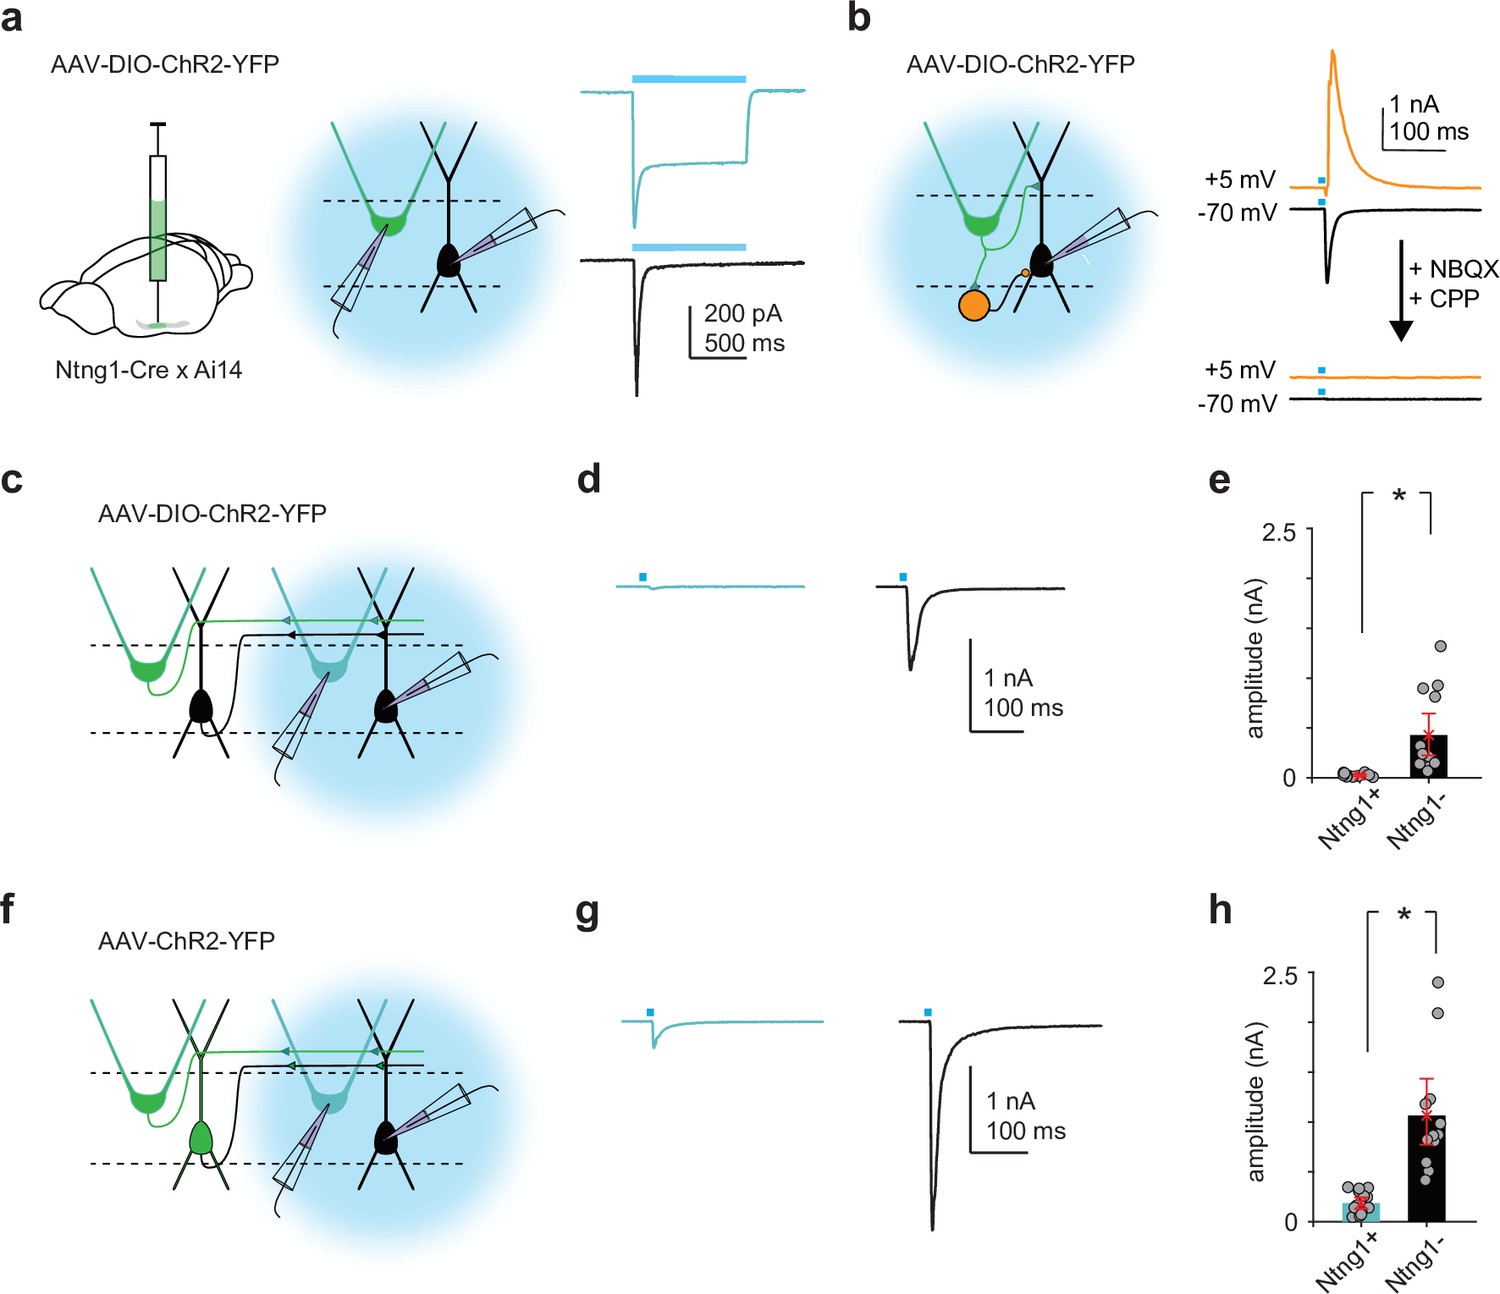
Ntng1+ and Ntng1- cells have similar synaptic connectivity properties as semilunars (SLs) and pyramidals (PYRs).
(a) Left and middle: experimental schematic. Cre-dependent ChR2 was injected focally into anterior piriform cortex (PCx) of Ntng1Cre/Ai14 mice. Whole-cell voltage-clamp recordings were obtained from ChR2-expressing Ntng1+ (tdTomato+) and Ntng1- cells while illuminating the slice with blue (473 nm) light. Right: large, sustained photocurrents were recorded in Ntng1+/tdTomato+ cells (blue) but not in Ntng1-/tdTomato- cells (black). Disynaptic EPSCs were recorded in Ntng1- cells. (b) Left: experimental schematic. Light-evoked synaptic responses in Ntng1- cells to strong, brief (1 ms) light pulses were recorded while holding the cell at –70 mV, to isolate excitatory postsynaptic currents, and at +5 mV, to isolate inhibitory postsynaptic currents. Right: light-driven activation of Ntng1+/ChR2+ cells evoked large, transient inward and outward responses in Ntng1- cells at –70 mV and +5 mV, respectively. Responses at both holding potentials were completely blocked by glutamate receptor antagonists (10 μM NBQX and 10 μM CPP). Ntng1+ cells are therefore glutamatergic. (c) Experimental schematic. As in (a), but whole-cell recordings were obtained from Ntng1+ cells that were located away from the injection site (i.e., cells that were not expressing ChR2). (d) Example EPSC traces evoked in Ntng1+/ChR2- (blue) and Ntng1- (black) cells by light-driven activation of Ntng1+/ChR2+ cells. (e) Summary plot of EPSC amplitude in Ntng1+ (25.3 pA [16.4, 34.8], n = 12 cells, three mice) and Ntng1- cells (429 pA [234, 647], n = 13 cells, three mice) in response to light-driven activation of Ntng1+/ChR2+ cells. (f) Experimental schematic. As in (a) and (c) but a non-conditional ChR2 was injected focally into anterior PCx. (g) Example EPSC traces evoked in Ntng1+/ChR2- (blue) and Ntng1-/ChR2- (black) cells by light-driven activation of all ChR2+ cells. (h) Summary plot of EPSC amplitude in Ntng1+ (187 pA [125, 245], n = 14 cells, three mice) and Ntng1- cells (1060 pA [771, 1402], n = 12 cells, three mice) in response to light-driven activation of all ChR2+ cells.
Figure 1—figure supplement 4
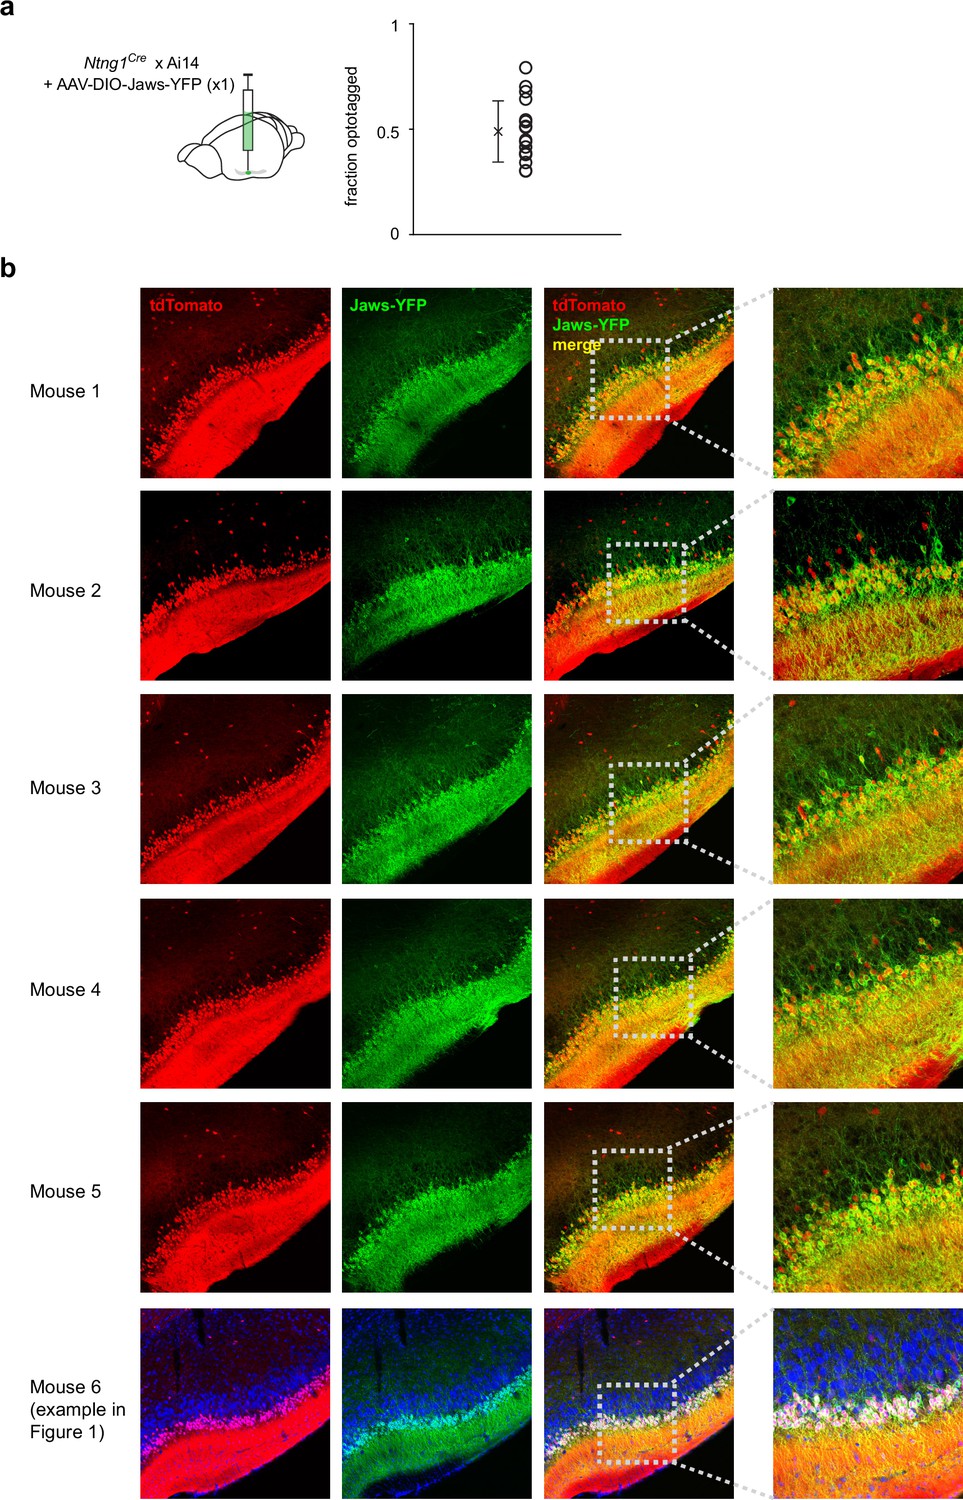
Jaws expression is consistent across mice.
Figure 1—figure supplement 5
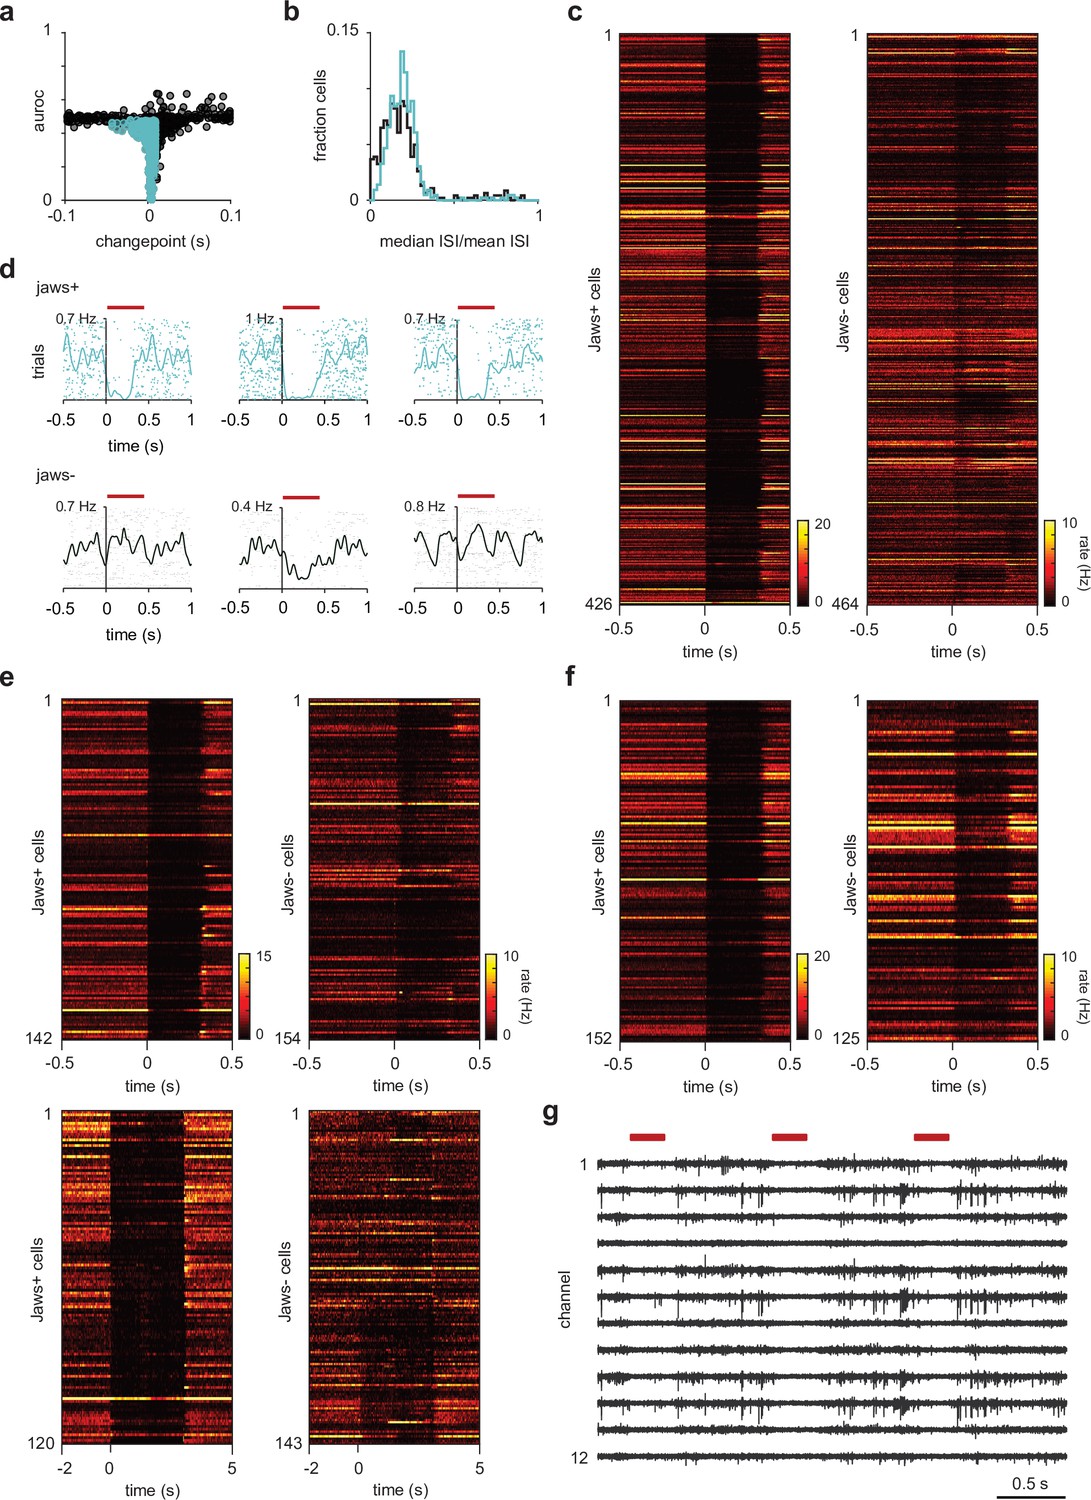
Semilunars (SLs) are identified using inhibitory opto-tagging.
(a) Selection criteria for identifying light-responsive cells – cells were categorized as SL if (1) their spike counts during the light-on epoch of 300 ms was reliably (area under the receiver operating characteristic curve [auROC] < 0.5) and significantly (Wilcoxon rank-sum test, p<1 × 10⁻⁷) lower than during the 300 ms epoch prior to light onset and (2) their light-evoked suppression occurred within 10 ms of light onset (change point < 10 ms). (b) Distribution of burst indices for SLs (blue) and pyramidals (PYRs) (black). Burst indices for each cell were determined by dividing the median interspike interval (ISI) during a 4 s period between odor delivery (spontaneous spiking) by the mean ISI. Although there were more PYRs that were ‘bursty,’ the distributions for SLs and PYRs were largely overlapping, thus burst indices could not be used as an additional method for cell classification. (c) Heatmaps of trial-averaged responses during opto-tagging as a function of time for all SLs and PYRs used in the odor response properties characterization experiments. Across all recorded cells, SLs show rapid and strong suppression during the light-on epoch. (d) Additional example cells with low spontaneous firing rates that were reliably identified as SLs using inhibitory opto-tagging. (e) Heatmaps of trial-averaged responses during opto-tagging as a function of time for all SLs and PYRs used in the optogenetic suppression experiments. In 5/9 experiments, SLs were identified using the criteria described in (a) (top). In the remaining 4/9 experiments, we delivered 60 light pulses to opto-tag SLs, thus we could not reliably determine the change points for these cells. However, we still observe rapid and strong suppression in cells categorized as SLs in these experiments. (f) Heatmaps of trial-averaged responses during opto-tagging as a function of time for all SLs and PYRs used in the chemogenetic suppression experiments. (g) Raw voltage traces, high-pass filtered at 500 Hz using a three-pole Butterworth filter from a representative experiment (showing 12/32 channels). Red bars indicate light pulses. We do not observe light-induced artifacts.
Figure 1—figure supplement 6
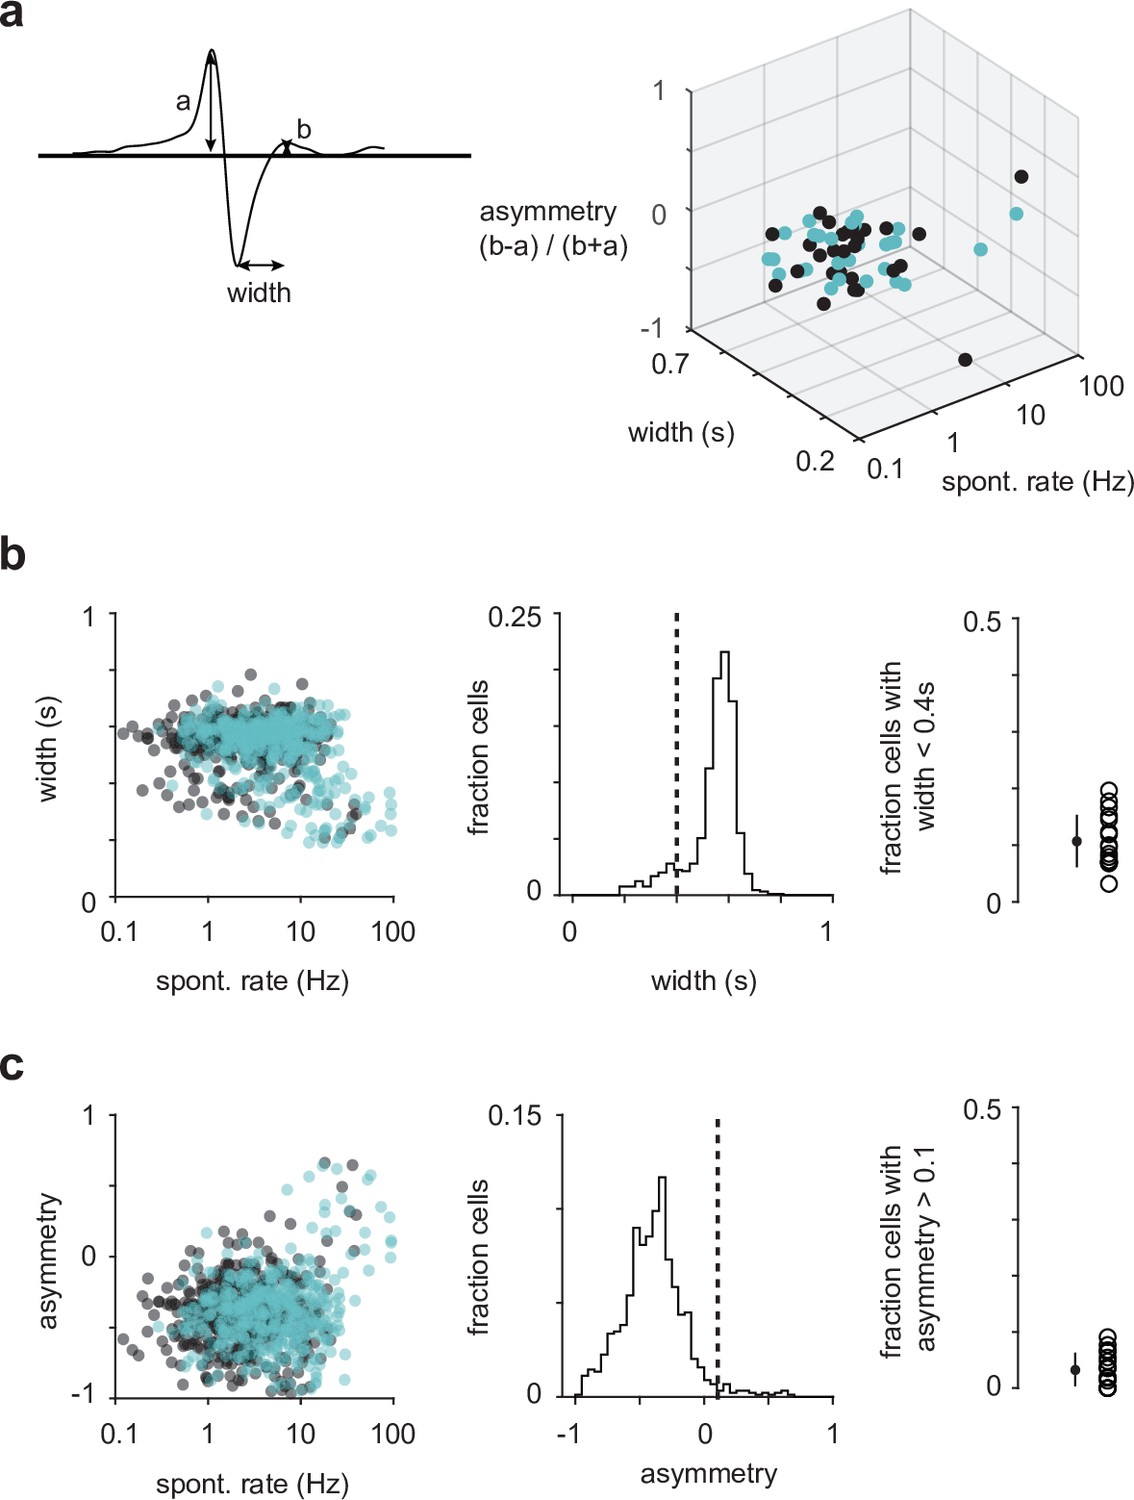
Waveform analyses do not unambiguously distinguish between excitatory and inhibitory neurons.
(a) An example spike waveform with annotated characteristics used in the analysis (left). Waveform characteristics of semilunars (SLs) (blue) and pyramidals (PYRs) (black) from one example experiment (right). There appears to be a cluster of high-firing rate cells that have narrow spike width in the top-right corner of the 3D plot. However, some of these cells are SL, which we have shown in slice recordings to be glutamatergic (Figure 1—figure supplement 3b). (b) Spike widths of all recorded SLs and PYRs plotted against their spontaneous firing rates (left). The percentage of cells across all experiments that have spike width less than 0.4 s (Sturgill and Isaacson, 2015) is 10.7% (middle and right). (c) Spike asymmetry of all recorded SLs and PYRs plotted against their spontaneous firing rates (left). The percentage of cells across all experiments that have spike asymmetry greater than 0.1 is 3.31% (middle and right).
Figure 2 with 1 supplement
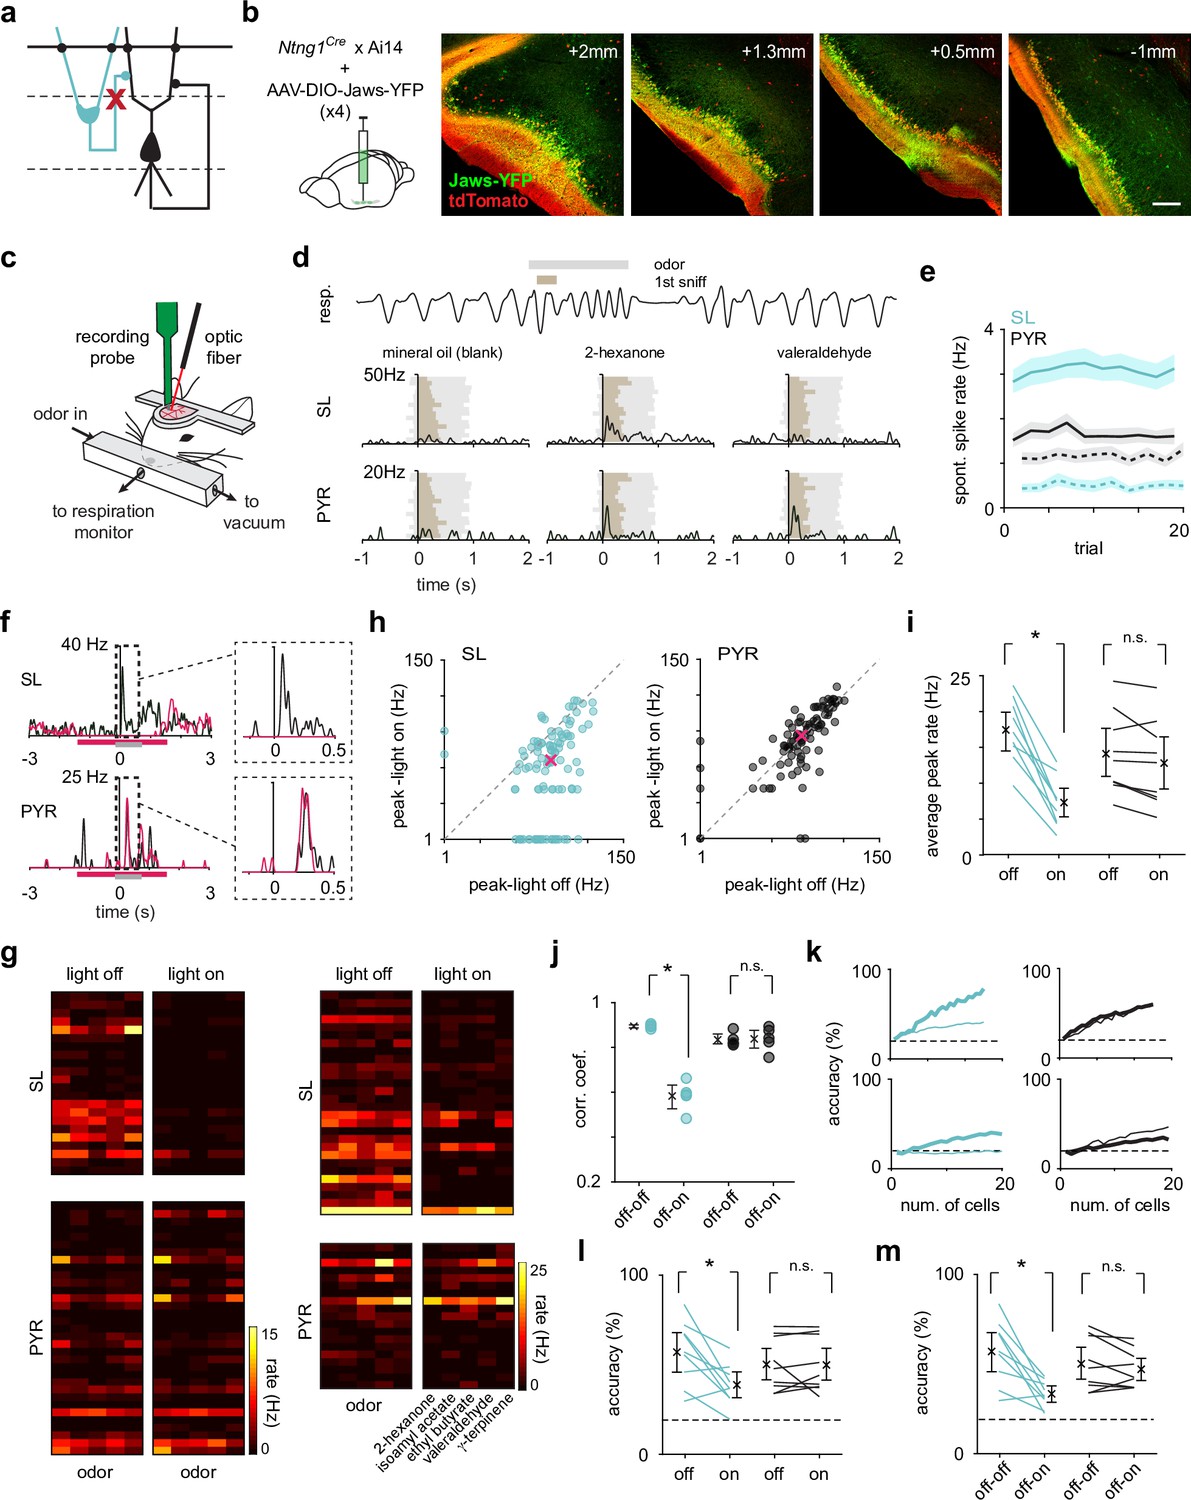
Optogenetic suppression of SLs does not weaken or reshape PYR odor responses.
(a) SLs were selectively optogenetically suppressed during recording to reveal the role of SL input on PYRs. (b) The inhibitory opsin, Jaws, was injected in three-four sites along the anterior-posterior axis (left to right) of PCx to maximize SL suppression throughout PCx. Scale bar is 200 μm. (c) Schematic of experimental setup for recording odor responses from awake, head-fixed Ntng1Cre mice. (d) Example respiration trace from one odor trial (top). A 1-s-long odor pulse (gray) is triggered on exhalation. Spiking activity was aligned to the onset of the inhalation of the first subsequent sniff (brown). Example trial-averaged SL and PYR responses (PSTHs) to the control stimulus and two different odors. (e) Average spontaneous spike rate of SLs (blue) and PYRs (black) during light off (solid line) and light on (dotted line) trials. (f) Example odor response from one SL and one PYR cell during light-on (magenta trace) and light-off (black trace) trials. The magenta bar indicates when the light was on, and the gray bar indicates when the odor was presented. (g) Heatmaps of trial-averaged spike rates in the first sniff for SL and PYR cell-odor pairs from two example experiments, one with complete (left) and one with incomplete (right) SL suppression. Light-on and light-off trials are plotted separately. (h) Odor-evoked response peaks for significantly activated SLs (blue, n = 101 cell-odor pairs) and PYRs (black, n = 97 cell-odor pairs) during light-on trials plotted against light-off trials. Median response peak is shown in magenta. (i) Mean odor-evoked response peaks within each experiment for each condition for all activated SLs and PYRs. Each point is an experiment (n = 9). (j) Pearson’s correlation coefficients of response vectors between the light-on and light-off conditions (off-on, n = 5 odors) or in just the light-off condition (off-off, n = 5 odors) for each odor. Firing rates in the first sniff following odor presentation for individual neurons were averaged within the two trial sets (light-off and light-on). Then, the pseudopopulation response vector consisting of trial-averaged light-off responses was correlated with the pseudopopulation response vector consisting of trial-averaged light-on responses. (k) Odor classification accuracy determined using a linear support vector machine for SLs (blue) and PYRs (black) for two example experiments as a function of cell number in the light-on (thick line) and light-off (thin line) conditions separately. The decoder was asked to classify responses (spike counts in a 500 ms time window beginning at odor inhalation) on a single trial to the panel of five odors. (l) Summary plot for within condition decoding (as in k) for a size-matched population of SLs and PYRs for individual experiments. Each point is an experiment (n = 9). (m) Odor classification accuracy for SLs and PYRs in each experiment, where the classifier was trained on trials from the light-off condition and tested on trials from the light-on condition. Each point is an experiment (n = 9).
Figure 2—figure supplement 1
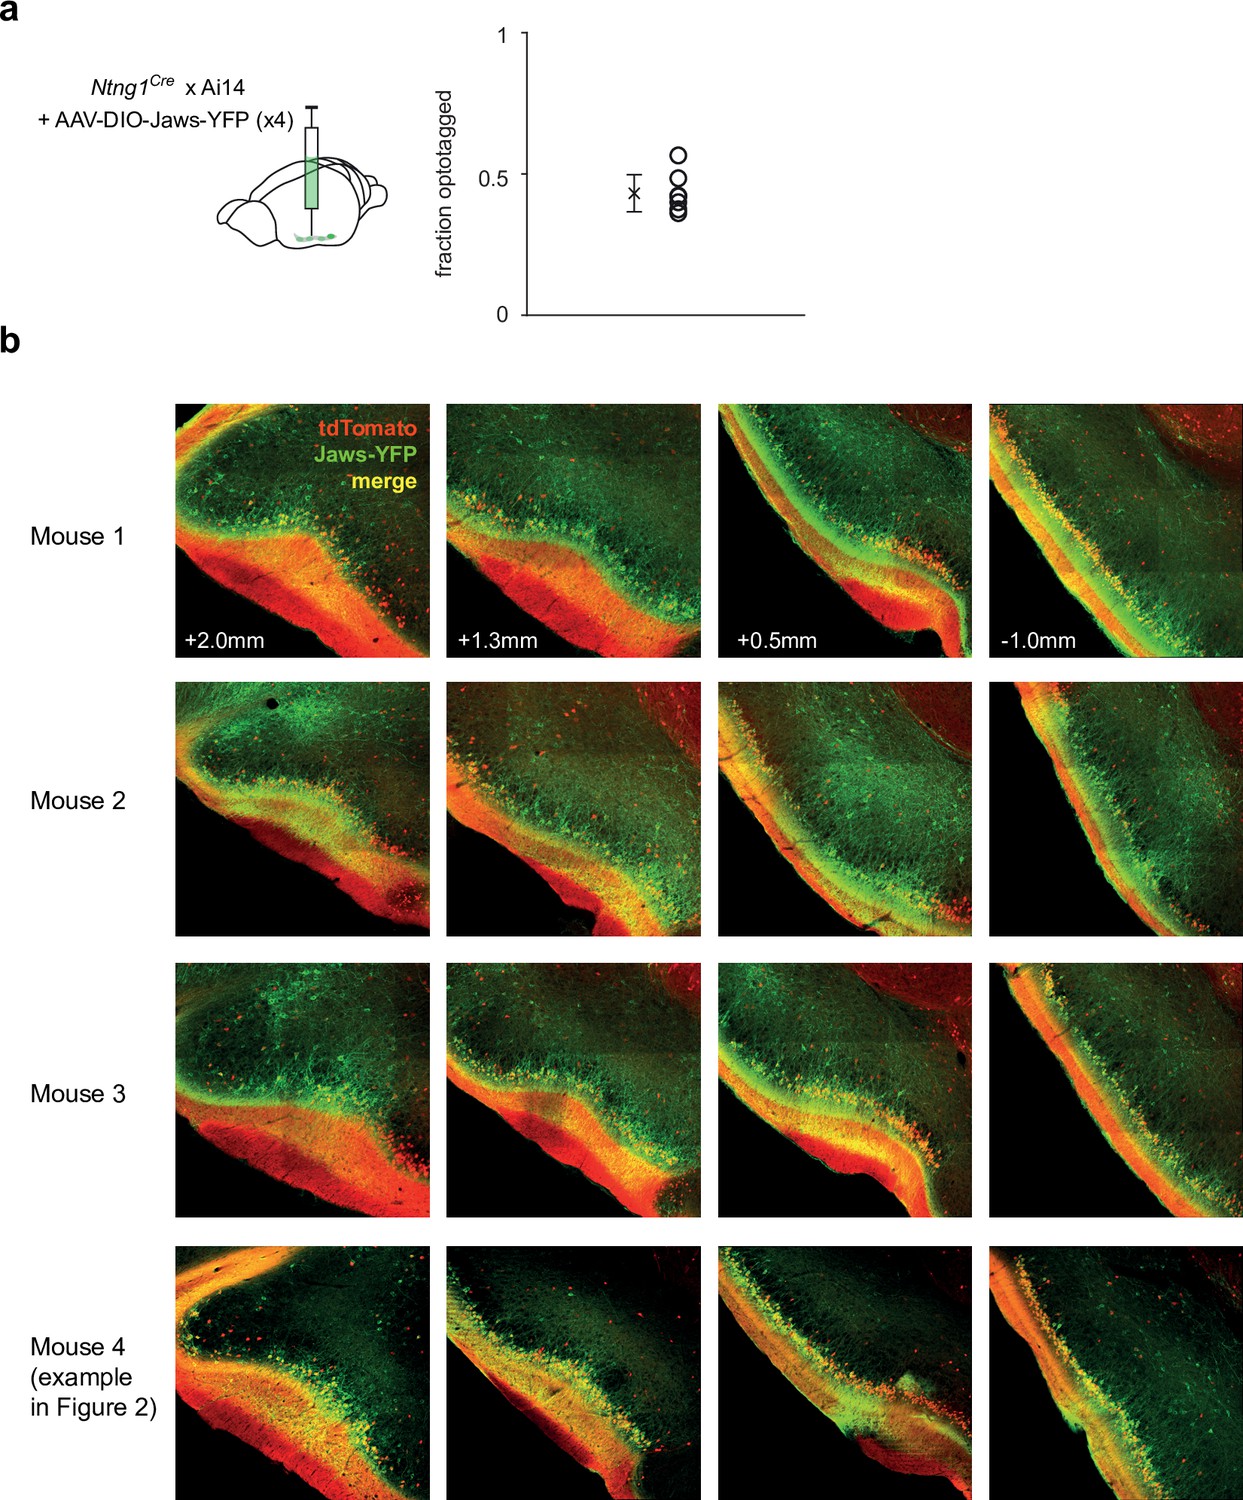
Spread and efficacy of Jaws expression in optogenetic suppression experiments.
(a) Fraction of recorded cells that were categorized as semilunars (SLs) in each experiment. (b) Histology from 4/6 mice that were used in the optogenetic suppression experiments showing robust Jaws expression (YFP+) along the anterior-posterior axis of piriform cortex (PCx).
Figure 3 with 1 supplement

Chemogenetic suppression of SLs does not weaken or reshape PYR odor responses.
(a) SLs were selectively suppressed throughout PCx during recordings using the inhibitory DREADD, hm4di. (b) Coronal sections showing selective expression of hm4di-mCherry and Archaerhodopsin (Arch) in SLs. AAVs expressing Cre-dependent hm4di was injected in four sites along the anterior-posterior axis (left to right) of PCx to maximize SL suppression. Arch was co-injected into one of the sites for opto-tagging. Scale bar is 200 μm. (c) The average spontaneous spike rate of SLs (left) and PYRs (right) as a function of trials from the experimental and two control groups. CNO/C21 was administered intraperitoneally during the recording, in the 21st trial (dotted line). Confidence intervals are shown. (d) Odor response of an example SL and PYR from an experimental mouse (hm4di/Arch + CNO/C21). CNO/C21 trials are shown in magenta and baseline trials in black. Each tick is a spike, and each row of ticks is a trial. (e) Heatmaps of trial-averaged spike rates in the first sniff for SL and PYR cell-odor pairs from an example experiment with baseline and CNO/C21 trials plotted separately. (f) Odor-evoked response peak firing rates for significantly activated SLs (blue, n = 124 cell-odor pairs) and PYRs (black, n = 96 cell-odor pairs) during CNO/C21 trials plotted against baseline trials. Median response peak is shown in magenta. Only the experimental group (hm4di/Arch + CNO/C21) is plotted. (g) Mean odor-evoked response peak firing rates within experiments for all activated SLs and PYRs. Each point is an experiment (n = 5). Only the experimental group (hm4di/Arch + CNO/C21) is plotted. (h) Correlation coefficients of response vectors between baseline and CNO/C21 trials (filled circles, n = 6 odors) or alternating baseline trials (open circles, n = 6 odors) for each odor for SLs (left) and PYRs (right) for the experimental (magenta) and two control groups (green and orange).
Figure 3—figure supplement 1
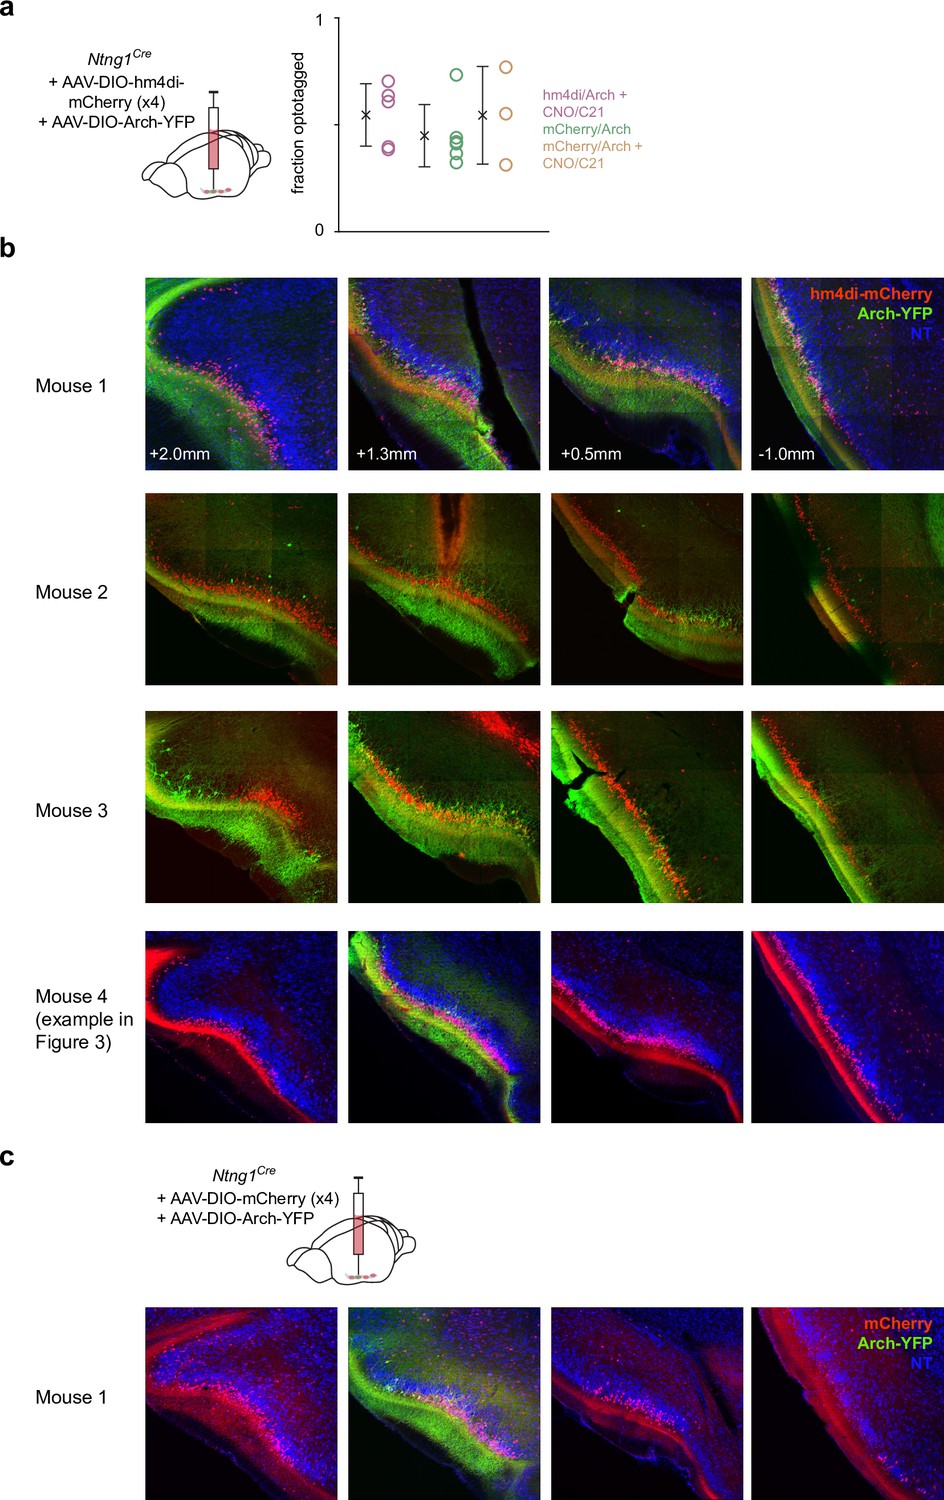
Spread and efficacy of hm4di expression in chemogenetic suppression experiments.
(a) Fraction of recorded cells that were categorized as semilunars (SLs) in each experiment. (b) Histology from 4/4 mice from the experimental group showing robust hm4di expression (mCherry+) along the anterior-posterior axis of piriform cortex (Pcx). (c) Histology from one example mouse from the control group where Cre-dependent mCherry was injected instead of hm4di.
Figure 4
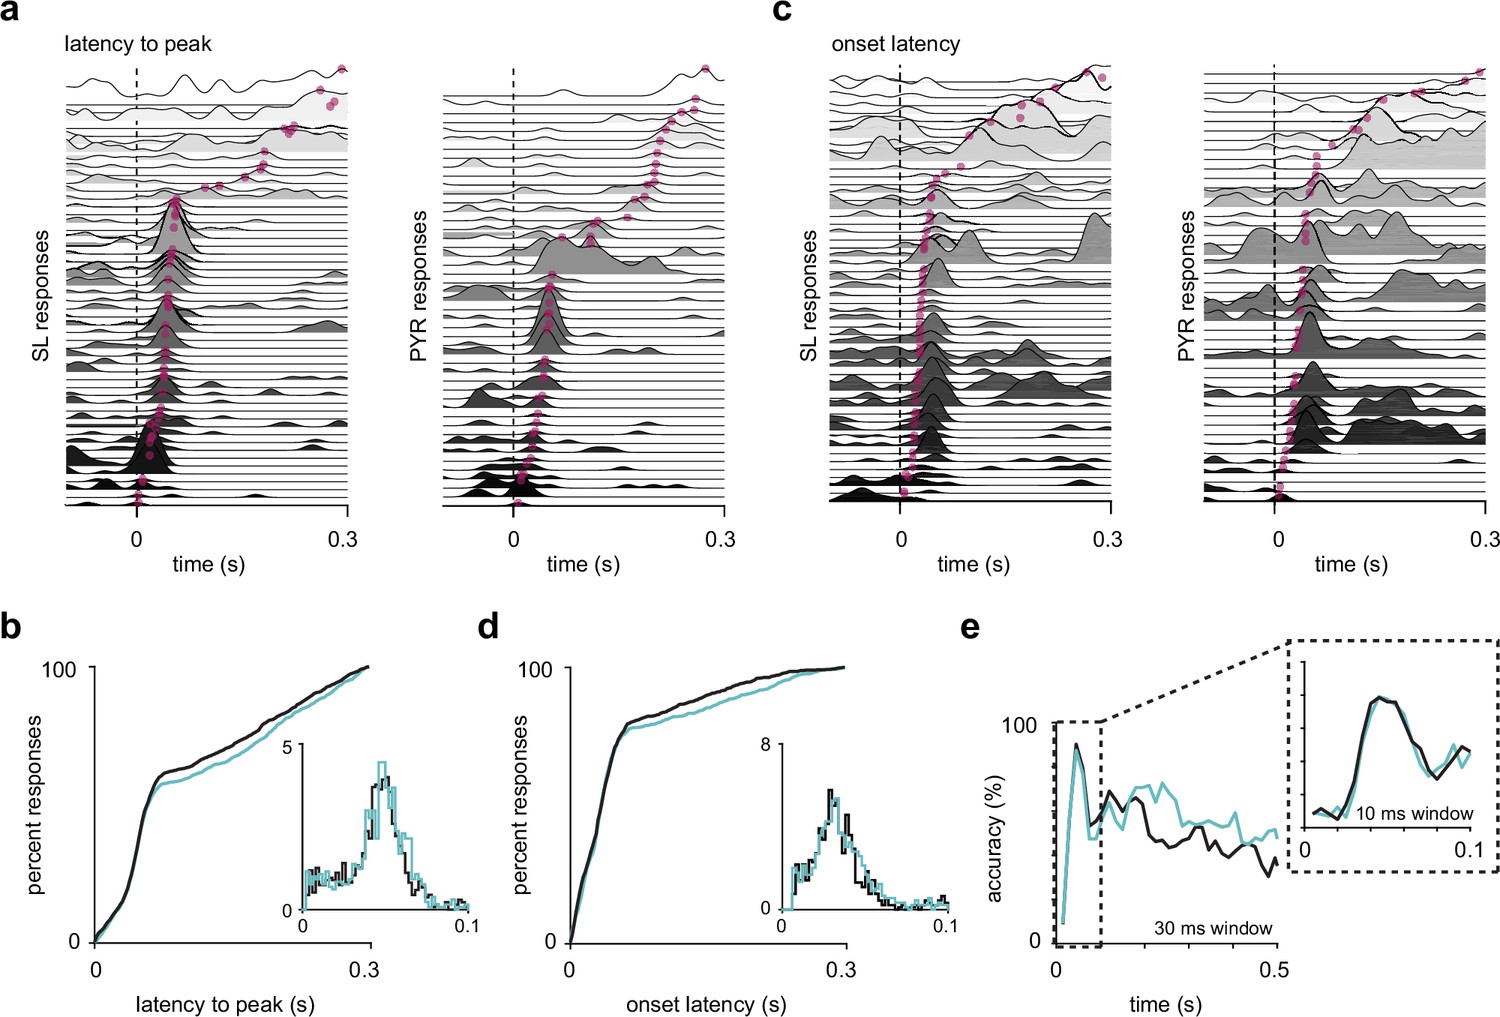
Semilunars (SLs) and pyramidals (PYRs) have similar response latencies.
(a) SL and PYR odor responses from one example experiment sorted by latency to response peak. Dotted line at t = 0 s marks inhalation onset. Magenta dots indicate the time of response peaks. (b) Cumulative distribution of latencies to peak for active (response index > 0) SL (blue, n = 1352) and PYR (black, n = 1305) cell-odor pairs. Inset shows histogram of latencies to peak within 100 ms of inhalation onset. (c) As in (a) but sorted by onset latencies. Magenta dots indicate the time at which each odor response reaches 2 SD above pre-odor baseline. (d) As in (b) but showing onset latencies for SL (blue, n = 918) and PYR (black, n = 865) cell-odor pairs. (e) Odor classification accuracy using a linear support vector machine in a sliding window of either 30 ms or 10 ms (inset).
Figure 5 with 1 supplement
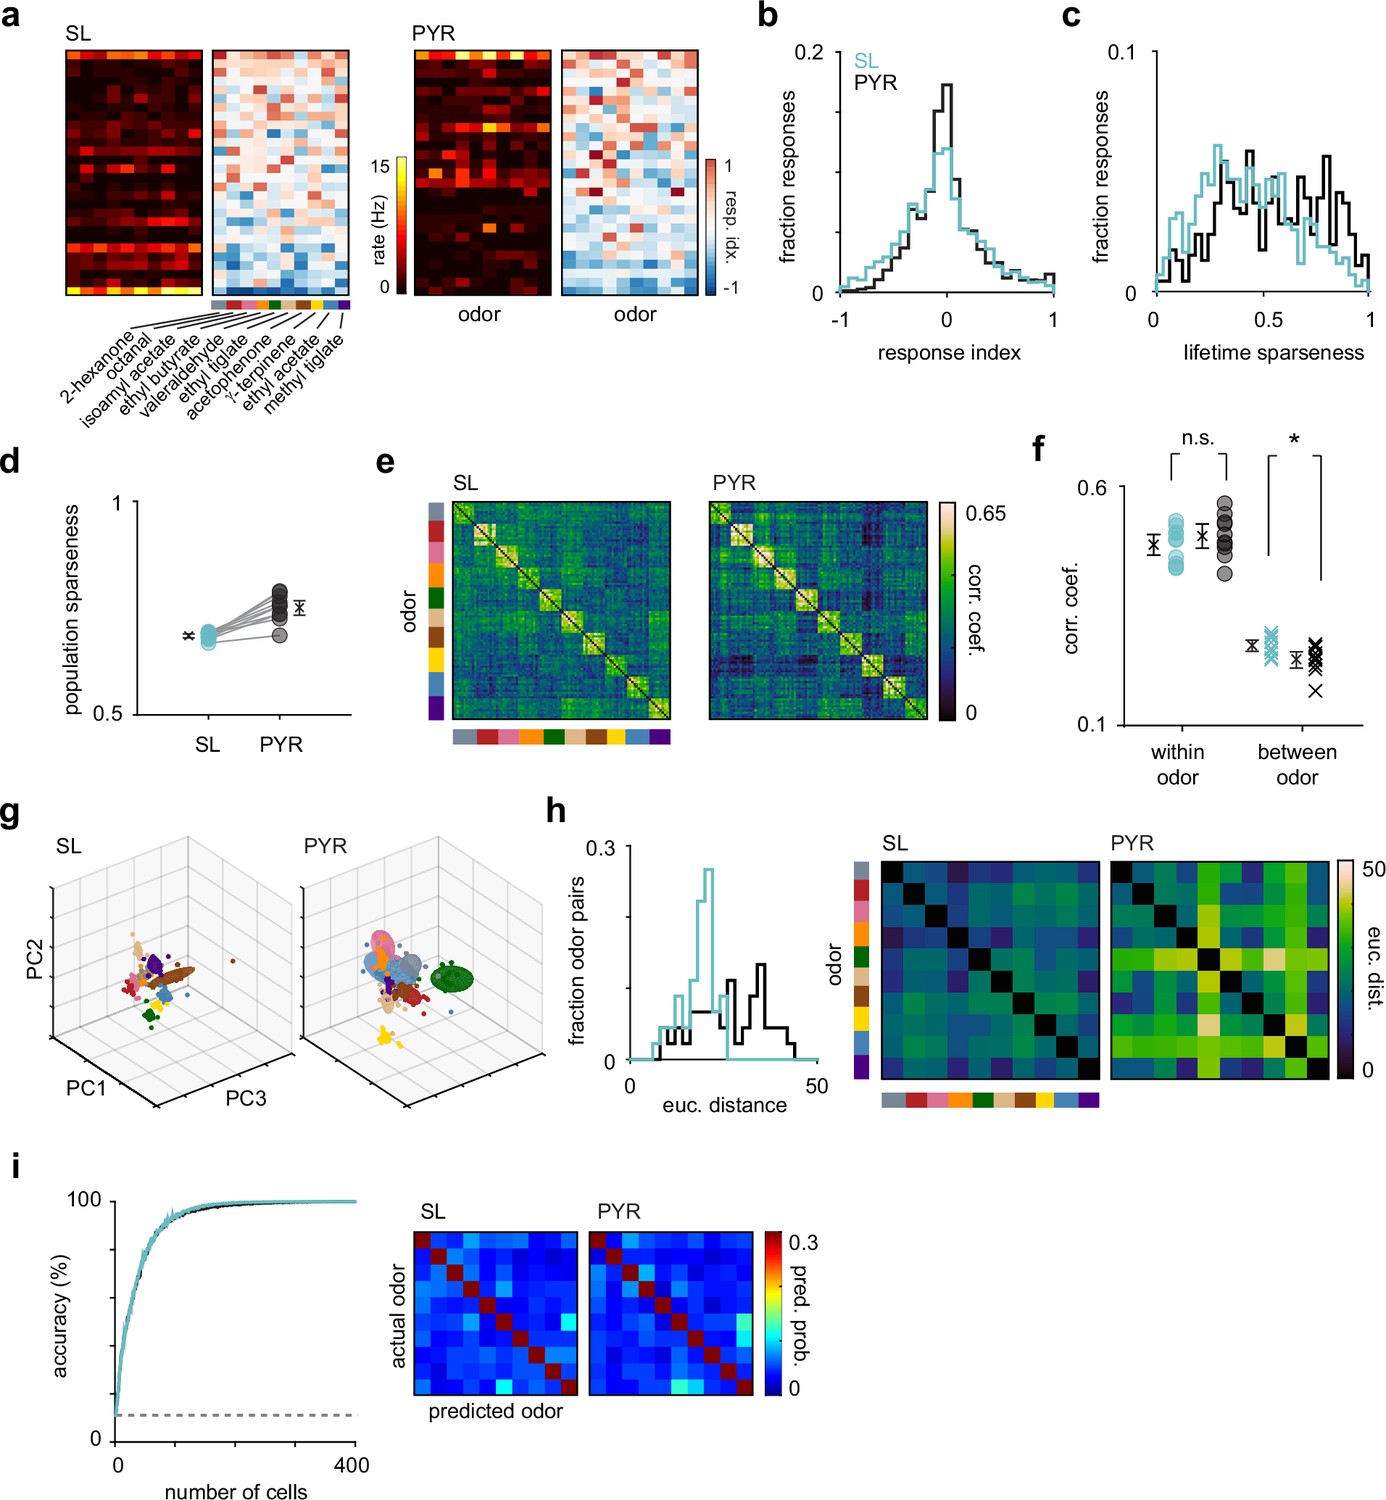
Odor response properties of semilunars (SLs) and pyramidals (PYRs).
(a) Heatmaps of spike rates in the first sniff and response indices for cell-odor pairs from an example experiment for SLs and PYRs sorted by number of activated responses. (b) Distribution of response indices for SL (blue, n = 4260) and PYR (black, n = 4640) cell-odor pairs across all experiments. (c) Distribution of lifetime sparseness for SLs (blue, n = 426 cells) and PYRs (black, n = 464 cells). (d) Population sparseness for SL and PYRs. Each circle is the average across experiments for an odor (n = 10 odors). (e) Trial-by-trial z-scored spike count correlation (Pearson’s) matrices sorted by odor for SLs and PYRs. Correlation matrices were generated for each experiment individually and then averaged across experiments. (f) Mean correlation across trials within each odor (circles) for SLs (blue) and PYRs (black) and between odors (crosses). (g) Principal components analysis was performed on z-scored SL (left) and PYR (right) pseudopopulation responses. Responses were projected onto the first three principal components. Each colored sphere represents an odor centered on the mean and encompasses one standard deviation. Colored dots indicate individual trials. (h) Distribution of Euclidean distances between the mean of the first six principal components for pairs of odors for SLs (blue) and PYRs (black). Distances are shown as confusion matrices on the right. (i) SL (blue) and PYR (black) odor classification accuracy determined using a linear support vector machine as a function of pseudopopulation size. The decoder was asked to classify responses on a single trial to the panel of 10 odors. Classification accuracy was averaged across 100 iterations for each pseudopopulation size. Dashed line indicates chance performance. Confusion matrices, averaged across 100 iterations, on the right show the probability that an odor was predicted.
Figure 5—figure supplement 1
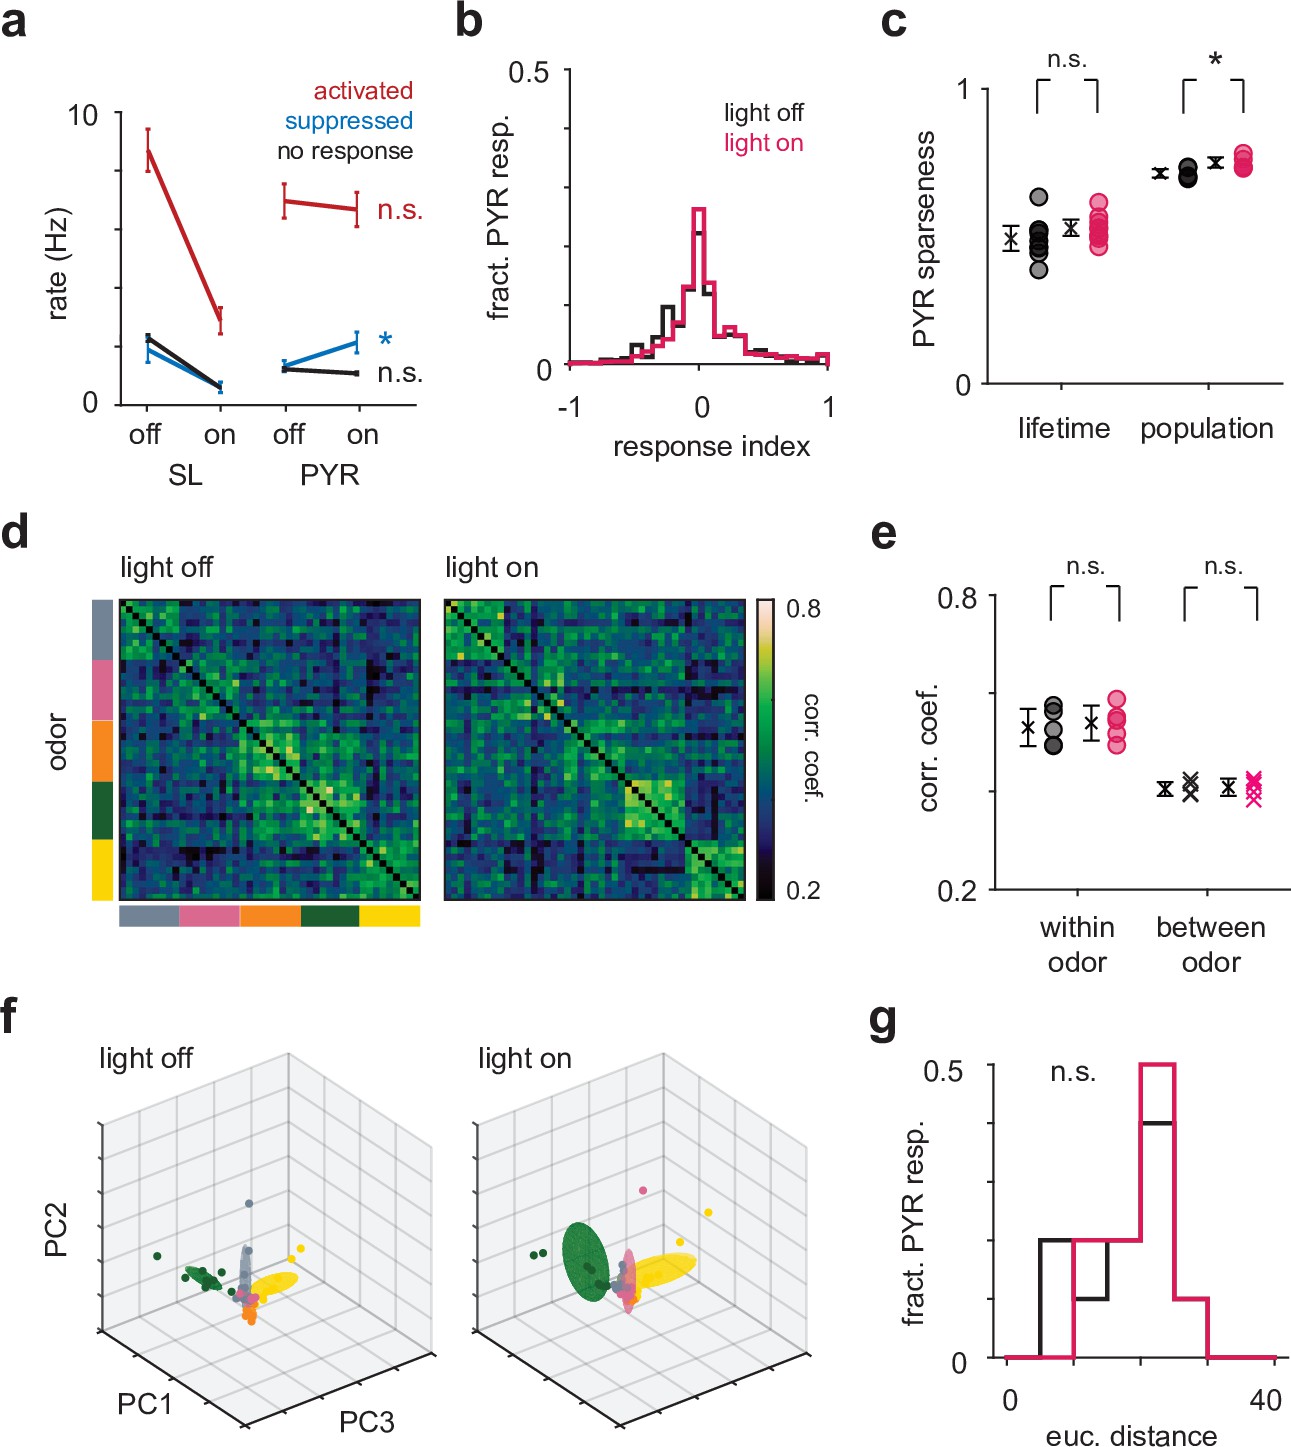
Optogenetic suppression of semilunars (SLs) does not change pyramidal (PYR) odor response properties.
(a) Mean firing rate in the first sniff for SLs and PYRs in light-on and light-off trials. Cells were identified as ‘activated’ (area under the receiver operating characteristic curve [auROC] > 0.5 and Wilcoxon rank-sum test p<0.05), ‘suppressed’ (auROC < 0.5 and Wilcoxon rank-sum test p<0.05) or ‘no response’ (auROC = 0.5) based on their responses in the light-off trials. There is a slight increase in the firing rate of PYRs that were suppressed in the light-off trials (off: 1.33 Hz [0.982, 1.76], on: 2.14 Hz [1.50, 2.85]; p=0.0037, paired t-test). (b) Distribution of response indices for PYRs in the light-off (black) and light-on (magenta) trials. (c) The mean lifetime sparseness across experiments for PYRs does not change during light-on trials (off: 0.491 [0.451, 0.534], on: 0.527 [0.502, 0.554]; p=0.286, paired t-test). The population sparseness increases slightly (off: 0.703 [0.689, 0.718], on: 0.738 [0.722, 0.755]; p=0.0284, paired t-test). (d) The correlation structure of PYR responses does not change during light-on trials. (e) The mean correlation within odor (p=0.600, paired t-test) and between odors (p=0.603, paired t-test) does not change during light-on trials. (f) The distance between pairs of odors in principal component space for PYR responses does not change during light-on trials (p=0.525, paired t-test). (g) Distribution of Euclidean distances between the mean of the first six principal components for pairs of odors for PYRs in the light-off (black) and light-on (magenta) conditions."
Author response image 1

Additional files
Download links
A two-part list of links to download the article, or parts of the article, in various formats.
Downloads (link to download the article as PDF)
Open citations (links to open the citations from this article in various online reference manager services)
Cite this article (links to download the citations from this article in formats compatible with various reference manager tools)
Parallel processing by distinct classes of principal neurons in the olfactory cortex
eLife 10:e73668.
https://doi.org/10.7554/eLife.73668


