Using adopted individuals to partition indirect maternal genetic effects into prenatal and postnatal effects on offspring phenotypes
- Institute for Molecular Bioscience, The University of Queensland, Australia
- The University of Queensland Diamantina Institute, The University of Queensland, Australia
- Institute for Clinical Medicine, Faculty of Medicine, University of Oslo, Norway
- K.G. Jebsen Center for Genetic Epidemiology, Department of Public Health and Nursing, Norwegian University of Science and Technology, Norway
- Population Health Science, Bristol Medical School, University of Bristol, United Kingdom
- MRC Integrative Epidemiology Unit, University of Bristol, United Kingdom
Figures
Figure 1
Path diagrams illustrating the structural equation models (SEM) underlying the seven family structures modelled in this manuscript (G1 – G7).
Causal relationships are represented by one headed arrows. Two headed arrows represents correlational relationships. Observed variables and latent variables are shown in squares and circles, respectively. Zm represents biological mother’s genotype which influences offspring phenotype (Y) via prenatal (γm) and postnatal (βm) pathways. Zp represents the biological father’s genotype which only influences offspring phenotype postnatally (βp). Zo represents offspring genotype which influences offspring phenotype (βo) and is correlated ½ with the genotypes of its biological parents. Zm_b represents the genotype of a biological mother whose child was adopted and therefore only influences her child’s phenotype through prenatal pathways (γm). Zm_a represents the adoptive mother’s genotype which only influences her adopted offspring’s phenotype via postnatal pathways (βm). Zp_b represents the genotype of a biological father whose child was adopted and therefore has no influence on the adopted offspring phenotype. Zp_a represents the adoptive father’s genotype which influences his adopted offspring postnatally (βp). ρ represents the covariance between parental genotypes, as a result of e.g. assortative mating (it is assumed that this covariance is the same in biological parents and adoptive parents). The total variance of genotypes in the parental generation is set to Φ. Ɛ1 and Ɛ2 represent residual error terms for the biological and adopted offspring phenotypes respectively that we assume have different variances.
Figure 2
Power to detect prenatal maternal genetic effects (γm) (top) or postnatal maternal genetic effects (βm) (bottom) whilst also varying the size of prenatal and postnatal maternal genetic effects, paternal genetic effects (βp) or offspring genetic effects (βo).
Effect sizes are parameterized using the path coefficients β and γ. Power was calculated assuming sample sizes approximating the number of white European individuals in the UK Biobank with educational attainment data (i.e. 1000 biological trios, 4000 biological mother-offspring pairs, 1800 biological father-offspring pairs, 300,000 singletons, 6000 adopted individuals, and 50 biological mother-adopted offspring pairs and a covariance of 0 (ρ) between maternal and paternal genotypes).
Figure 3

Power to detect prenatal maternal (γm) or postnatal maternal genetic (βm) effects whilst varying the numbers of each family structure, with the sample sizes of other family structures approximating numbers of white European individuals in the UK Biobank reporting educational attainment (1000 biological trios, 4000 biological mother-offspring pairs, 1800 biological father-offspring pairs, 300,000 singletons, 6000 singletons, and 50 biological mother-adopted offspring pairs).
Path coefficients representing postnatal or prenatal maternal genetic effects, paternal genetic effects (βp) and offspring genetic effects (βo) were fixed to 0.1. The covariance between maternal and paternal genotypes was fixed to 0.
Figure 4
Diagram illustrating a Mendelian randomization study designed to estimate the causal effect of a maternal prenatal environmental exposure on an offspring later life outcome.
Maternal genotype proxies a perinatal exposure of interest and is used as an instrumental variable to estimate the causal effect of the perinatal exposure on the offspring outcome. The pathway of interest is represented by the blue arrows where the SNP influences the outcome prenatally through the perinatal exposure of interest. In this sort of design, it is important to control for spurious pathways through the offspring genome since offspring genotype will be correlated ½ with maternal genotype. Maternal genotype could also influence the offspring phenotype via other pleiotropic paths through the intrauterine environment (red arrow) or through the postnatal environment (dashed arrows). The inclusion of adopted individuals into the research design may be useful in controlling for the effect of horizontal pleiotropic influences through the postnatal environment. Intuitively this is because adoptive mother’s genotype provides an estimate of the relationship between maternal genotype and offspring outcome through postnatal pathways only. This estimate could be included in statistical models of the relationship between maternal genotype and offspring outcome to help correct for the effect of horizontal pleiotropy.
Appendix 1—figure 1
Path diagrams illustrating the structural equation models (SEM) underlying four additional family structures (G8 – G11) where biological and adoptive parents are related.
Observed variables and latent variables are shown in squares and circles respectively. Causal relationships are represented by one headed arrows. Two headed arrows represents correlational relationships. Zo represents offspring genotype which influences offspring phenotype (βo) and is correlated ½ with the genotypes of its biological parents. Zm_b represents the genotype of a biological mother whose child was adopted and therefore only influences her child’s phenotype through prenatal pathways (γm). Zm_a represents the adoptive mother’s genotype which only influences her adopted offspring’s phenotype via postnatal pathways (βm). Zp_b represents the genotype of a biological father whose child was adopted and therefore has no influence on the adopted offspring phenotype. Zp_a represents the adoptive father’s genotype which influences his adopted offspring postnatally (βp). ρ represents the covariance between parental genotypes, as a result of e.g. assortative mating (it is assumed that this covariance is the same in biological parents and adoptive parents). The total variance of genotypes in the parental generation is set to Φ. Ɛ3 through Ɛ6 represent residual error terms for the adopted offspring that we assume have different variances. The (fixed) parameter r represents the covariance between biological and adoptive parents’ genotypes.
Appendix 1—figure 2
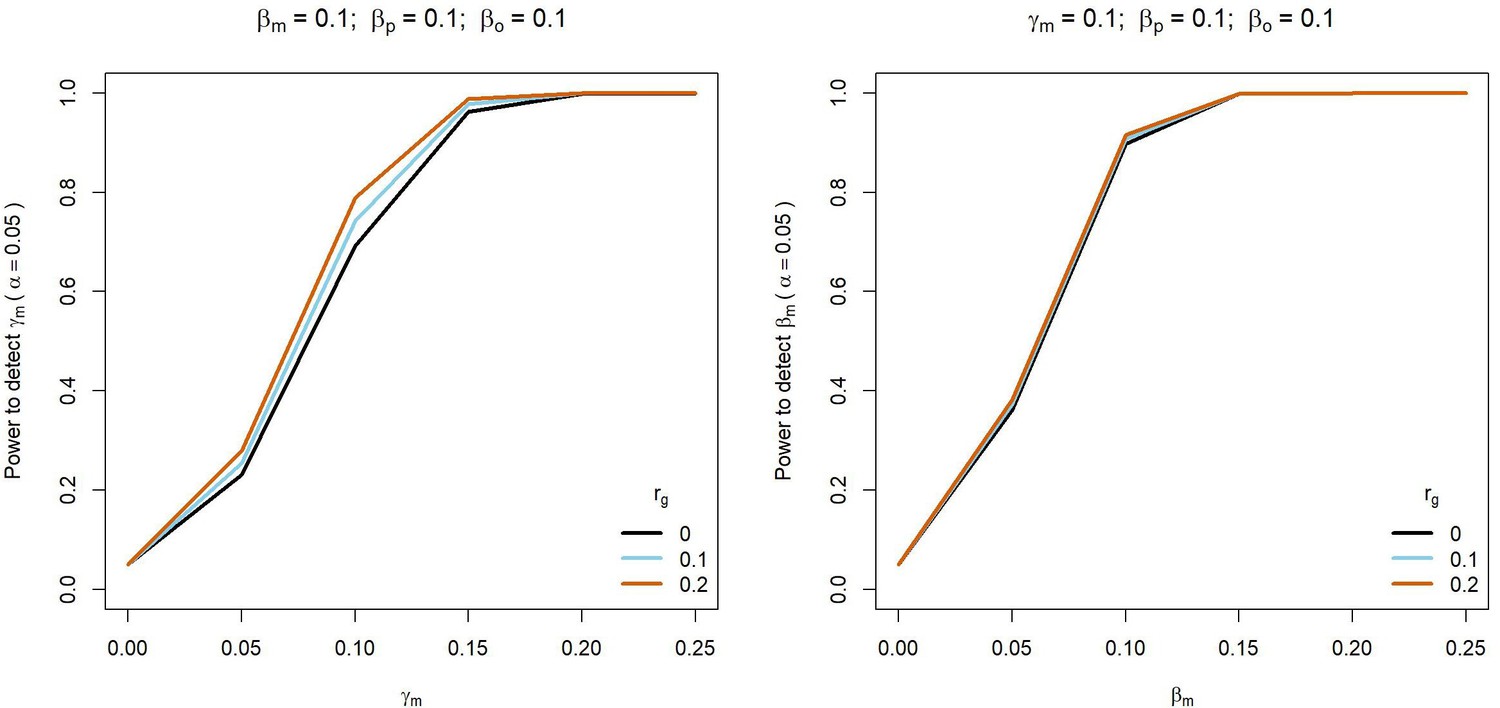
Power to detect prenatal maternal (γm) or postnatal maternal (βm) genetic effects whilst varying the correlation (rg) between maternal and paternal genotypes.
Power was calculated using sample sizes approximating the number of white European individuals in the UK Biobank reporting their own educational attainment (1000 biological trios, 4000 biological mother-offspring pairs, 1,800 biological father-offspring pairs, 300,000 singletons, 6000 adopted individuals, and 50 biological mother-adopted offspring pairs). Path coefficients representing prenatal maternal (γm), postnatal maternal (βm), paternal (βp) and offspring genetic effects (βo) were fixed to 0.1.
Appendix 1—figure 3
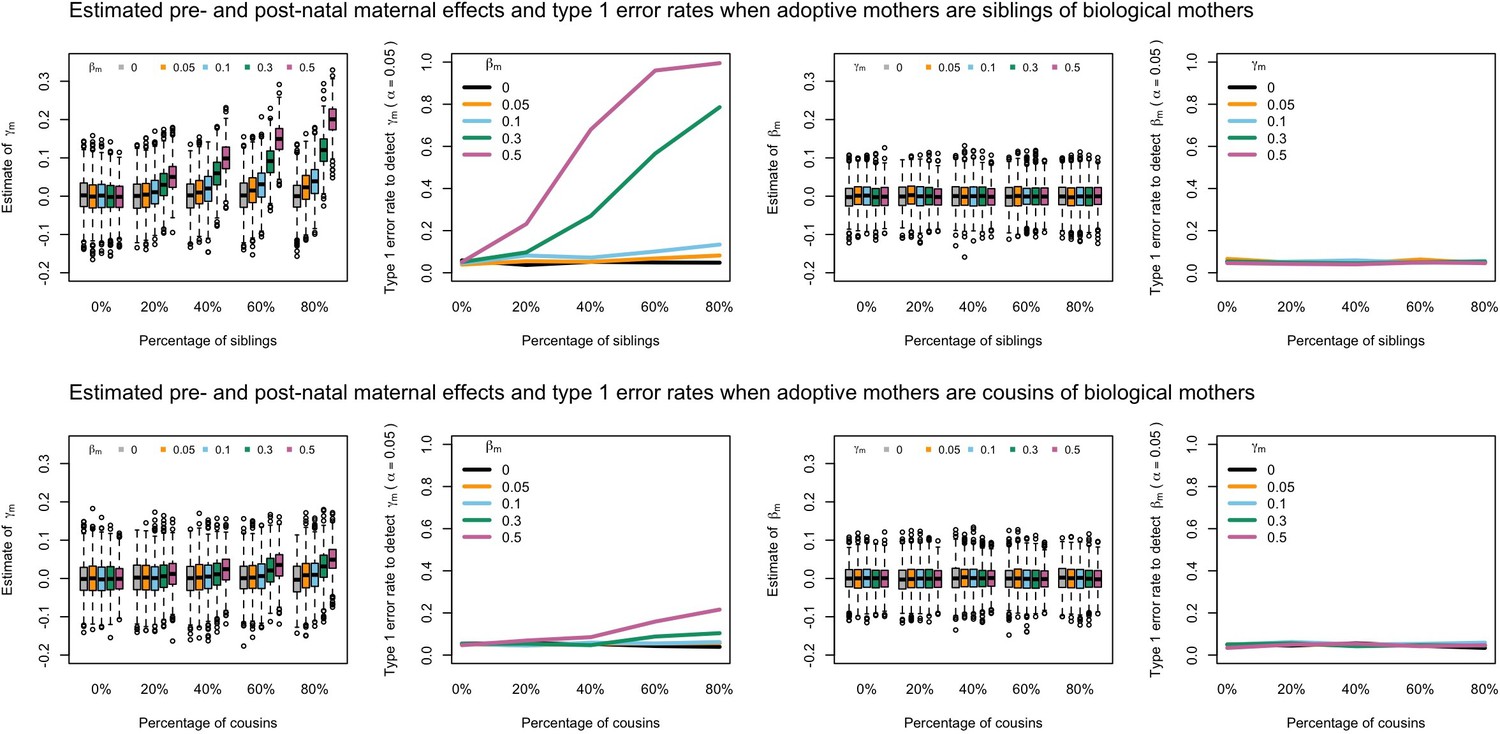
Estimated prenatal (γm) and postnatal (βm) maternal effects and type 1 error rates whilst varying the percentage of adoptive mothers being siblings (top) or cousins (bottom) of biological mothers.
An SEM which did not correctly model this relationship was fit to the data. Power was calculated using simulated data with 1000 biological trios, 4000 biological mother-offspring pairs, 1800 biological father-offspring pairs, 300,000 singletons, and 6000 adopted individuals. Prenatal maternal genetic effects were fixed to zero whilst the size of postnatal maternal genetic effects were varied (left panels); postnatal maternal genetic effects were fixed to zero whilst the size of prenatal maternal genetic effects were varied (right panels). Paternal effects (βp) and offspring effects (βo) were fixed to 0.1. The covariance between maternal and paternal genotypes was fixed to zero.
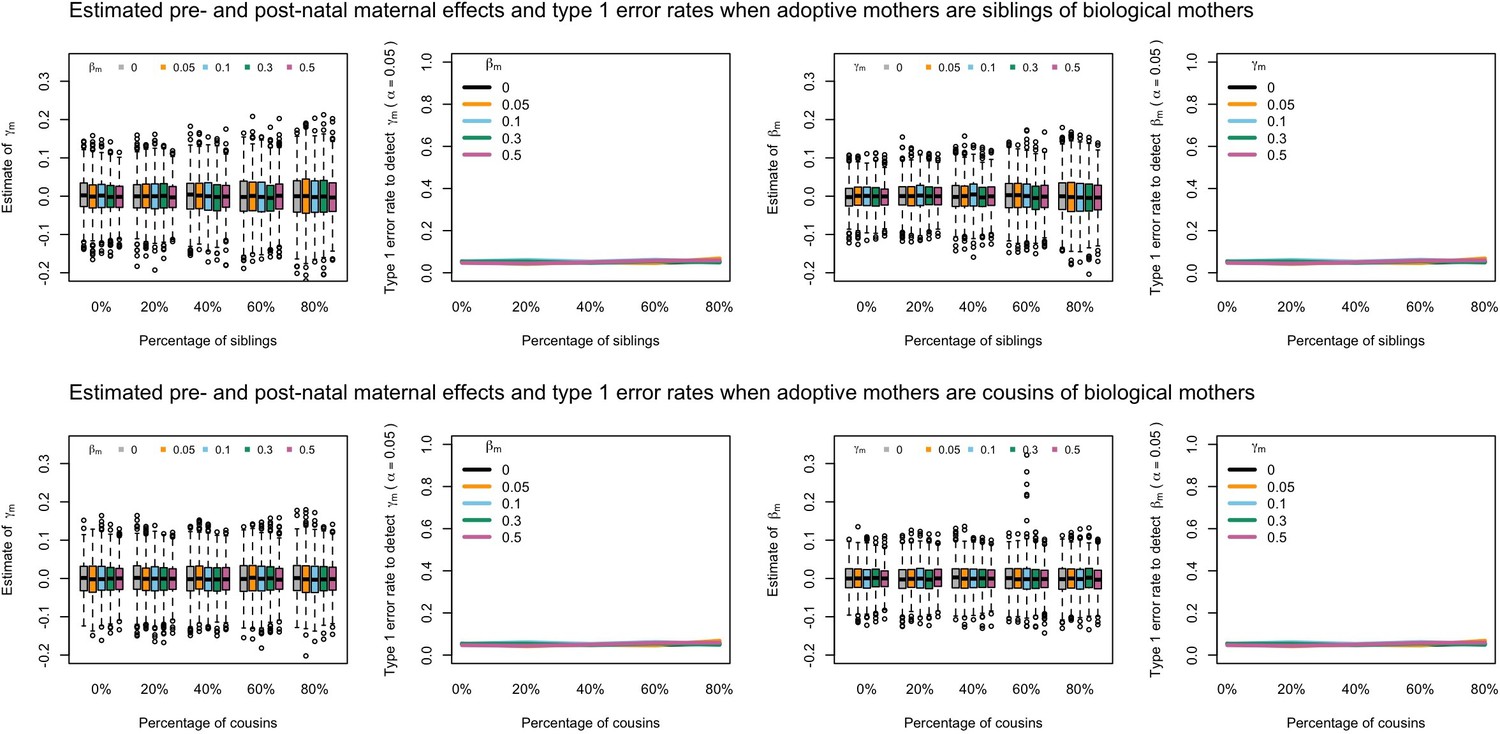
Appendix 1—figure 4
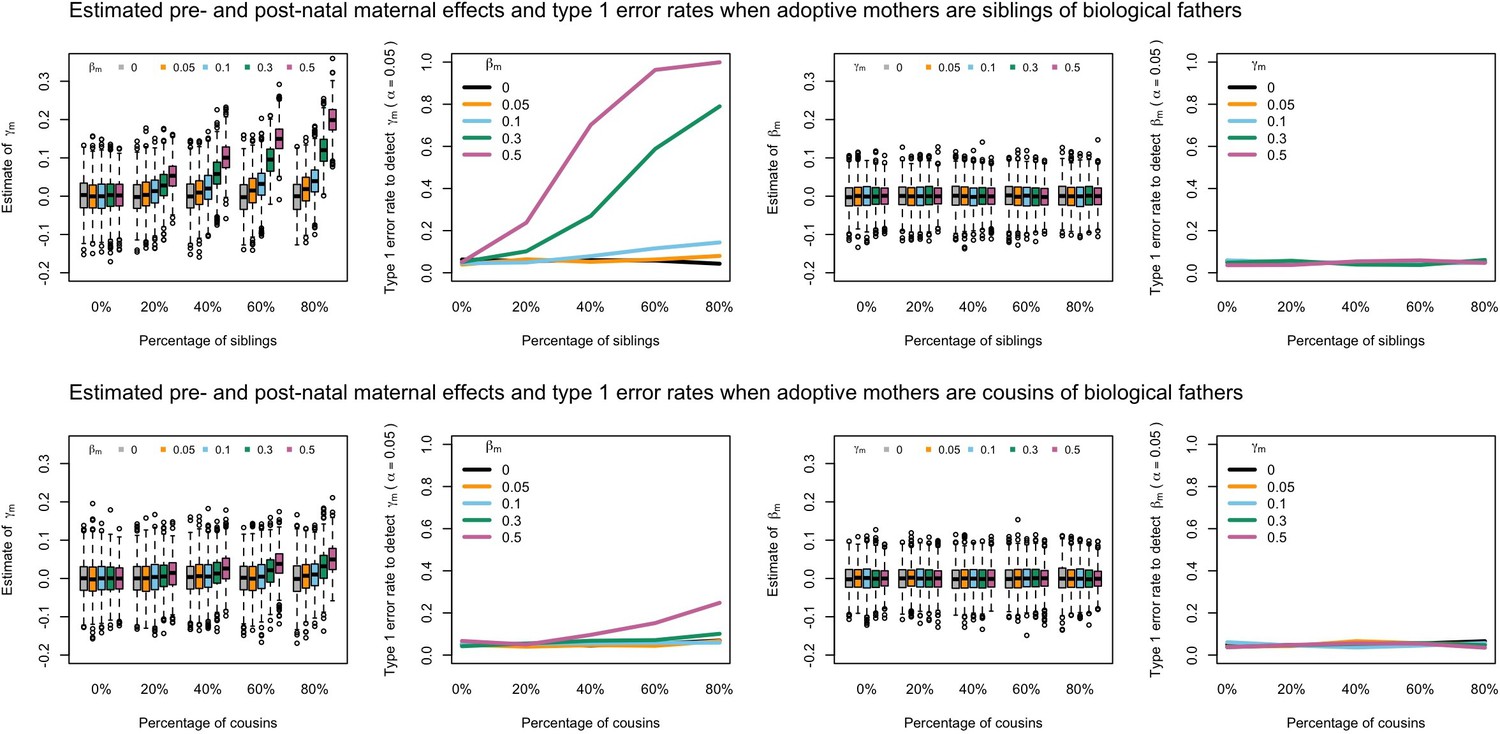
Estimated prenatal (γm) and postnatal (βm) maternal effects and type 1 error rates whilst varying the percentage of adoptive mothers being siblings (top) or cousins (bottom) of biological fathers.
An SEM which did not correctly model this relationship was fit to the data. Power was calculated using simulated data with 1000 biological trios, 4000 biological mother-offspring pairs, 1800 biological father-offspring pairs, 300,000 singletons, and 6000 adopted individuals. Prenatal maternal genetic effects were fixed to zero whilst the size of postnatal maternal genetic effects were varied (left panels); postnatal maternal genetic effects were fixed to zero whilst the size of prenatal maternal genetic effects were varied (right panels). Paternal effects (βp) and offspring effects (βo) were fixed to 0.1. The covariance between maternal and paternal genotypes was fixed to zero.
Appendix 1—figure 5
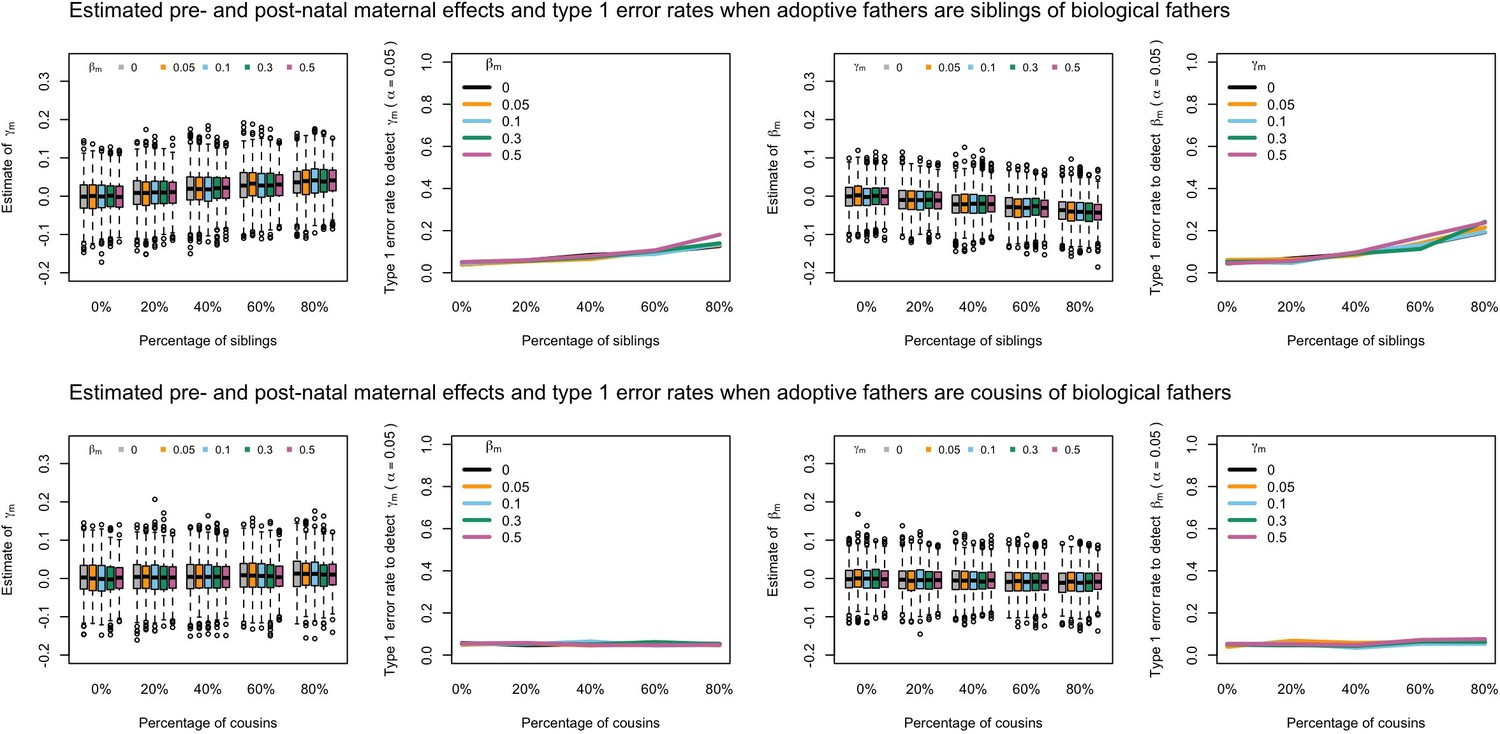
Estimated prenatal (γm) and postnatal (βm) maternal effects and type 1 error rates whilst varying the percentage of adoptive fathers being siblings (top) or cousins (bottom) of biological fathers.
An SEM which did not correctly model this relationship was fit to the data. Power was calculated using simulated data with 1000 biological trios, 4000 biological mother-offspring pairs, 1800 biological father-offspring pairs, 300,000 singletons, and 6000 adopted individuals. Prenatal maternal genetic effects were fixed to zero whilst the size of postnatal maternal genetic effects were varied (left panels); postnatal maternal genetic effects were fixed to zero whilst the size of prenatal maternal genetic effects were varied (right panels). Paternal effects (βp) and offspring effects (βo) were fixed to 0.1. The covariance between maternal and paternal genotypes was fixed to zero.
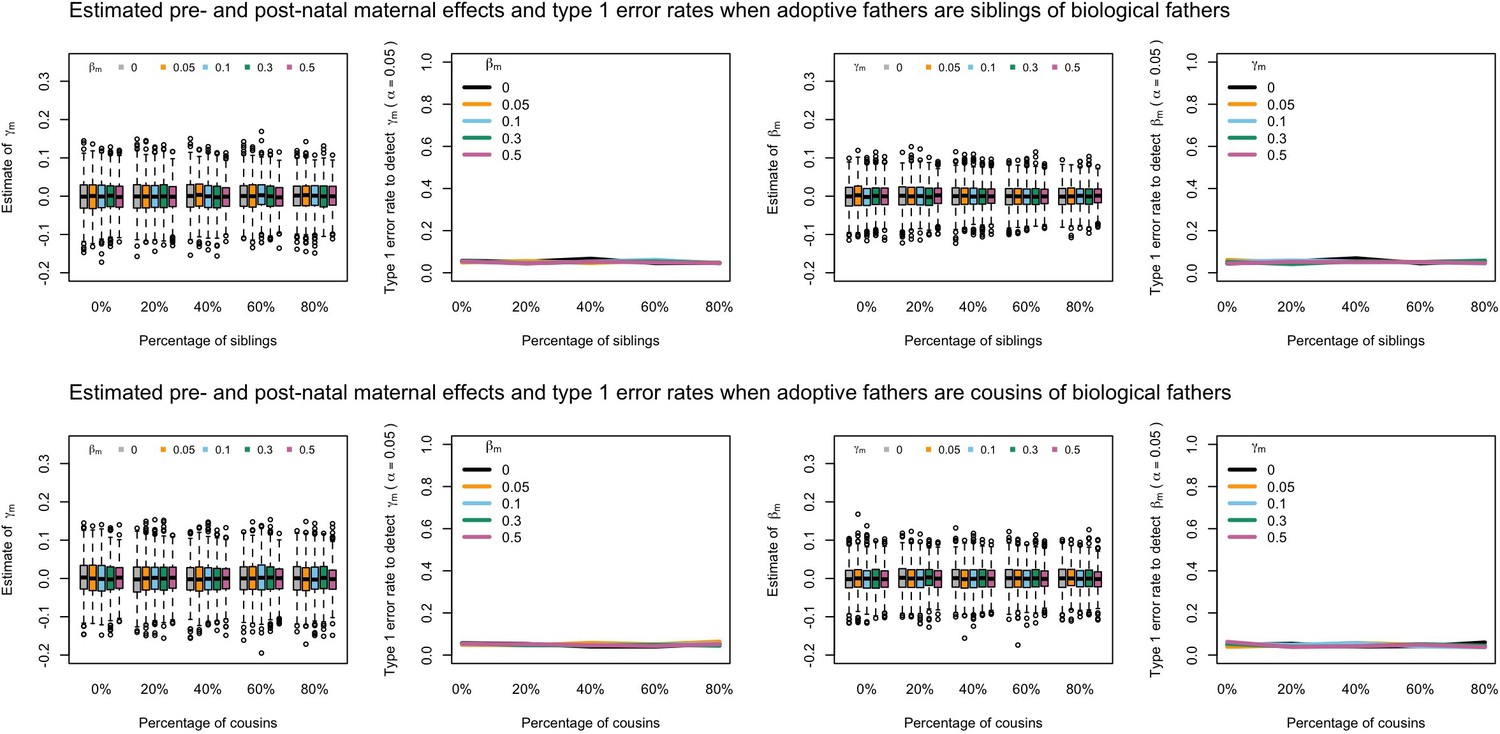
Appendix 1—figure 6
Estimated prenatal (γm) and postnatal (βm) maternal effects and type 1 error rates whilst varying the percentage of adoptive fathers being siblings (top) or cousins (bottom) of biological mothers.
An SEM which did not correctly model this relationship was fit to the data. Power was calculated using simulated data with 1000 biological trios, 4000 biological mother-offspring pairs, 1800 biological father-offspring pairs, 300,000 singletons, and 6000 adopted individuals. Prenatal maternal genetic effects were fixed to zero whilst the size of postnatal maternal genetic effects were varied (left panels); postnatal maternal genetic effects were fixed to zero whilst the size of prenatal maternal genetic effects were varied (right panels). Paternal effects (βp) and offspring effects (βo) were fixed to 0.1. The covariance between maternal and paternal genotypes was fixed to zero.
Appendix 1—figure 7
Estimated prenatal (γm) and postnatal (βm) maternal effects and type 1 error rates whilst varying the percentage of adoptive mothers being siblings (top) or cousins (bottom) of biological mothers.
An SEM which modelled this relationship correctly was fit to the data. Power was calculated using simulated data with 1000 biological trios, 4000 biological mother-offspring pairs, 1800 biological father-offspring pairs, 300,000 singletons, and 6000 adopted individuals. Prenatal maternal genetic effects were fixed to zero whilst the size of postnatal maternal genetic effects were varied (left panels); postnatal maternal genetic effects were fixed to zero whilst the size of prenatal maternal genetic effects were varied (right panels). Paternal effects (βp) and offspring effects (βo) were fixed to 0.1. The covariance between maternal and paternal genotypes was fixed to zero.
Appendix 1—figure 8
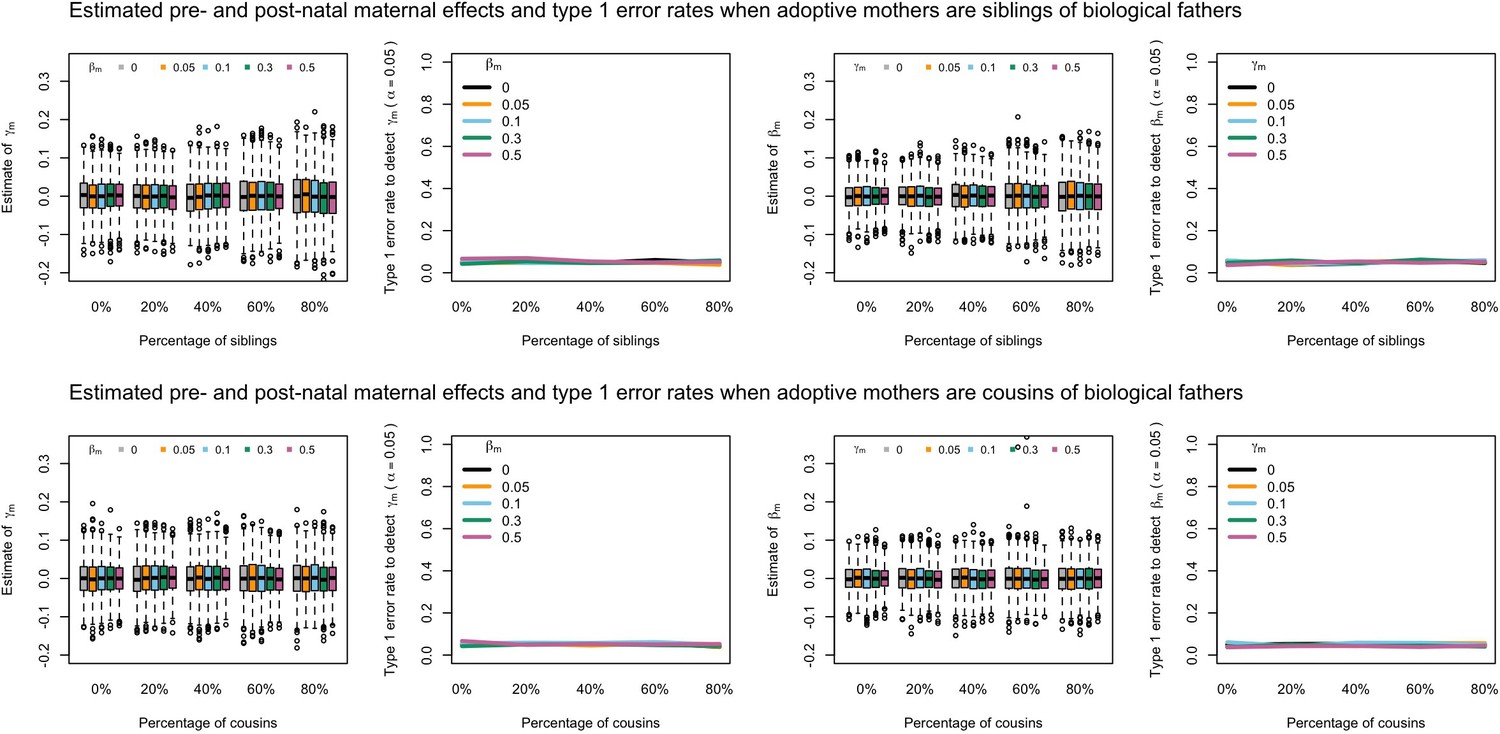
Estimated prenatal (γm) and postnatal (βm) maternal effects and type 1 error rates whilst varying the percentage of adoptive mothers being siblings (top) or cousins (bottom) of biological fathers.
An SEM which modelled this relationship correctly was fit to the data. Power was calculated using simulated data with 1000 biological trios, 4000 biological mother-offspring pairs, 1800 biological father-offspring pairs, 300,000 singletons, and 6000 adopted individuals. Prenatal maternal genetic effects were fixed to zero whilst the size of postnatal maternal genetic effects were varied (left panels); postnatal maternal genetic effects were fixed to zero whilst the size of prenatal maternal genetic effects were varied (right panels). Paternal effects (βp) and offspring effects (βo) were fixed to 0.1. The covariance between maternal and paternal genotypes was fixed to zero.
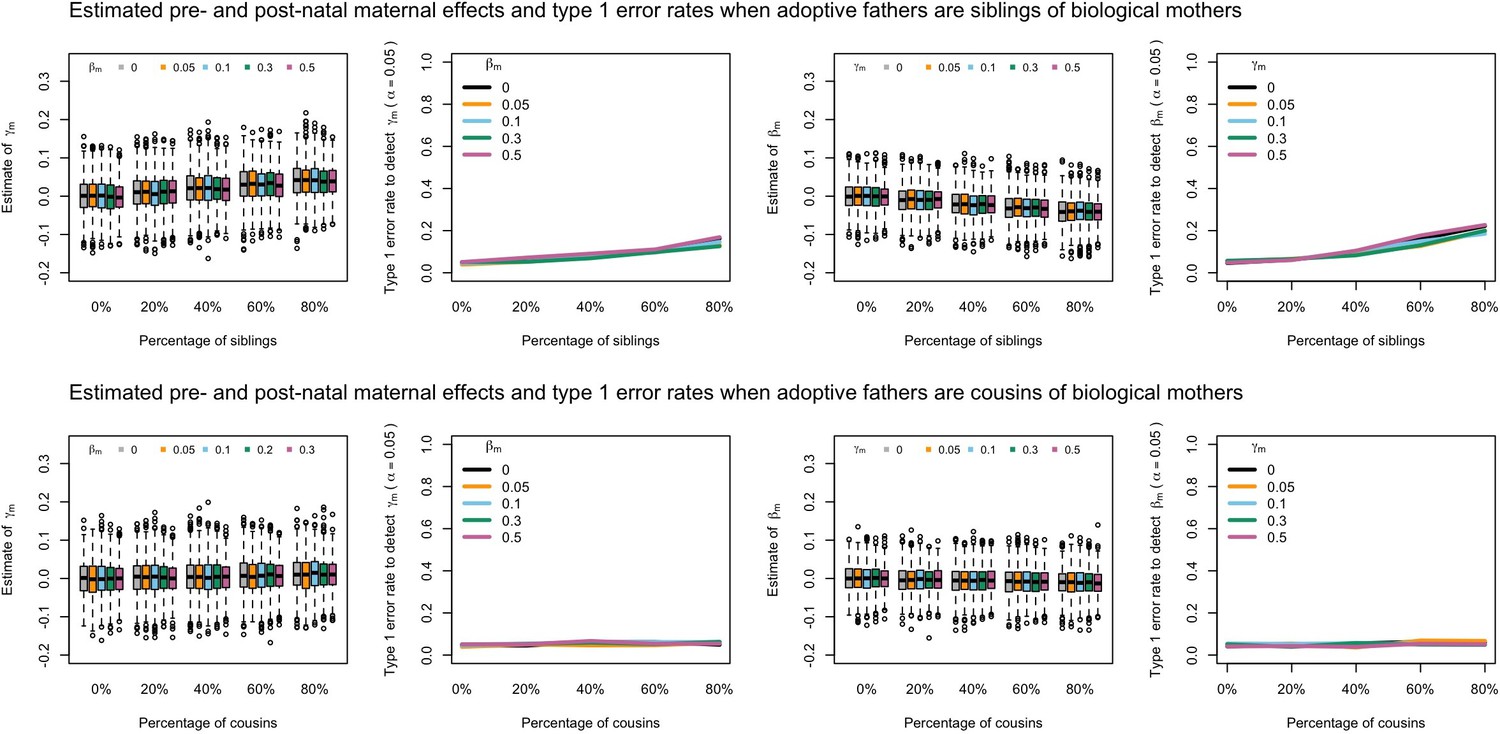
Appendix 1—figure 9
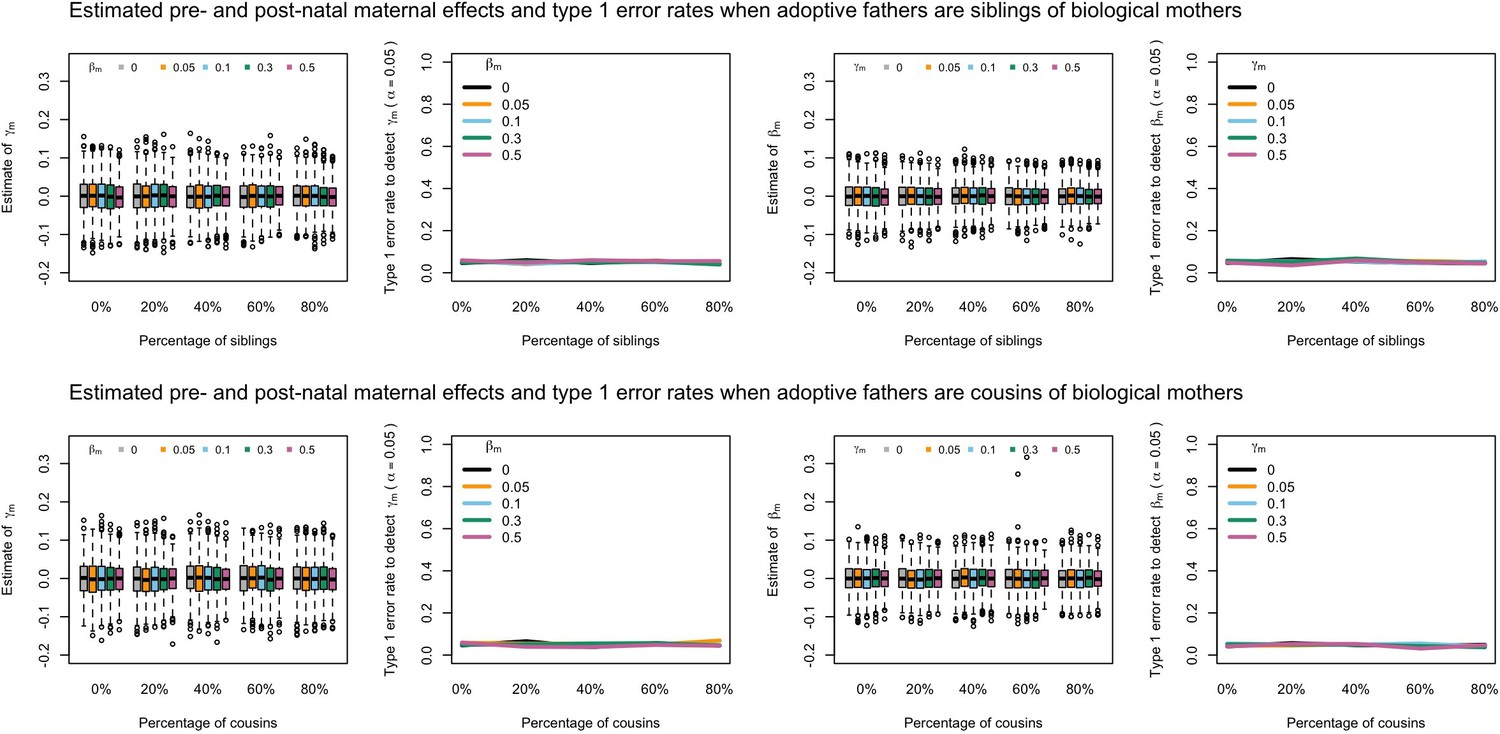
Estimated prenatal (γm) and postnatal (βm) maternal effects and type 1 error rates whilst varying the percentage of adoptive fathers being siblings (top) or cousins (bottom) of biological fathers.
An SEM which modelled this relationship correctly was fit to the data. Power was calculated using simulated data with 1000 biological trios, 4000 biological mother-offspring pairs, 1800 biological father-offspring pairs, 300,000 singletons, and 6000 adopted individuals. Prenatal maternal genetic effects were fixed to zero whilst the size of postnatal maternal genetic effects were varied (left panels); postnatal maternal genetic effects were fixed to zero whilst the size of prenatal maternal genetic effects were varied (right panels). Paternal effects (βp) and offspring effects (βo) were fixed to 0.1. The covariance between maternal and paternal genotypes was fixed to zero.
Appendix 1—figure 10
Estimated prenatal (γm) and postnatal (βm) maternal effects and type 1 error rates whilst varying the percentage of adoptive fathers being siblings (top) or cousins (bottom) of biological mothers.
An SEM which modelled this relationship correctly was fit to the data. Power was calculated using simulated data with 1000 biological trios, 4000 biological mother-offspring pairs, 1800 biological father-offspring pairs, 300,000 singletons, and 6000 adopted individuals. Prenatal maternal genetic effects were fixed to zero whilst the size of postnatal maternal genetic effects were varied (left panels); postnatal maternal genetic effects were fixed to zero whilst the size of prenatal maternal genetic effects were varied (right panels). Paternal effects (βp) and offspring effects (βo) were fixed to 0.1. The covariance between maternal and paternal genotypes was fixed to zero.
Appendix 1—figure 11
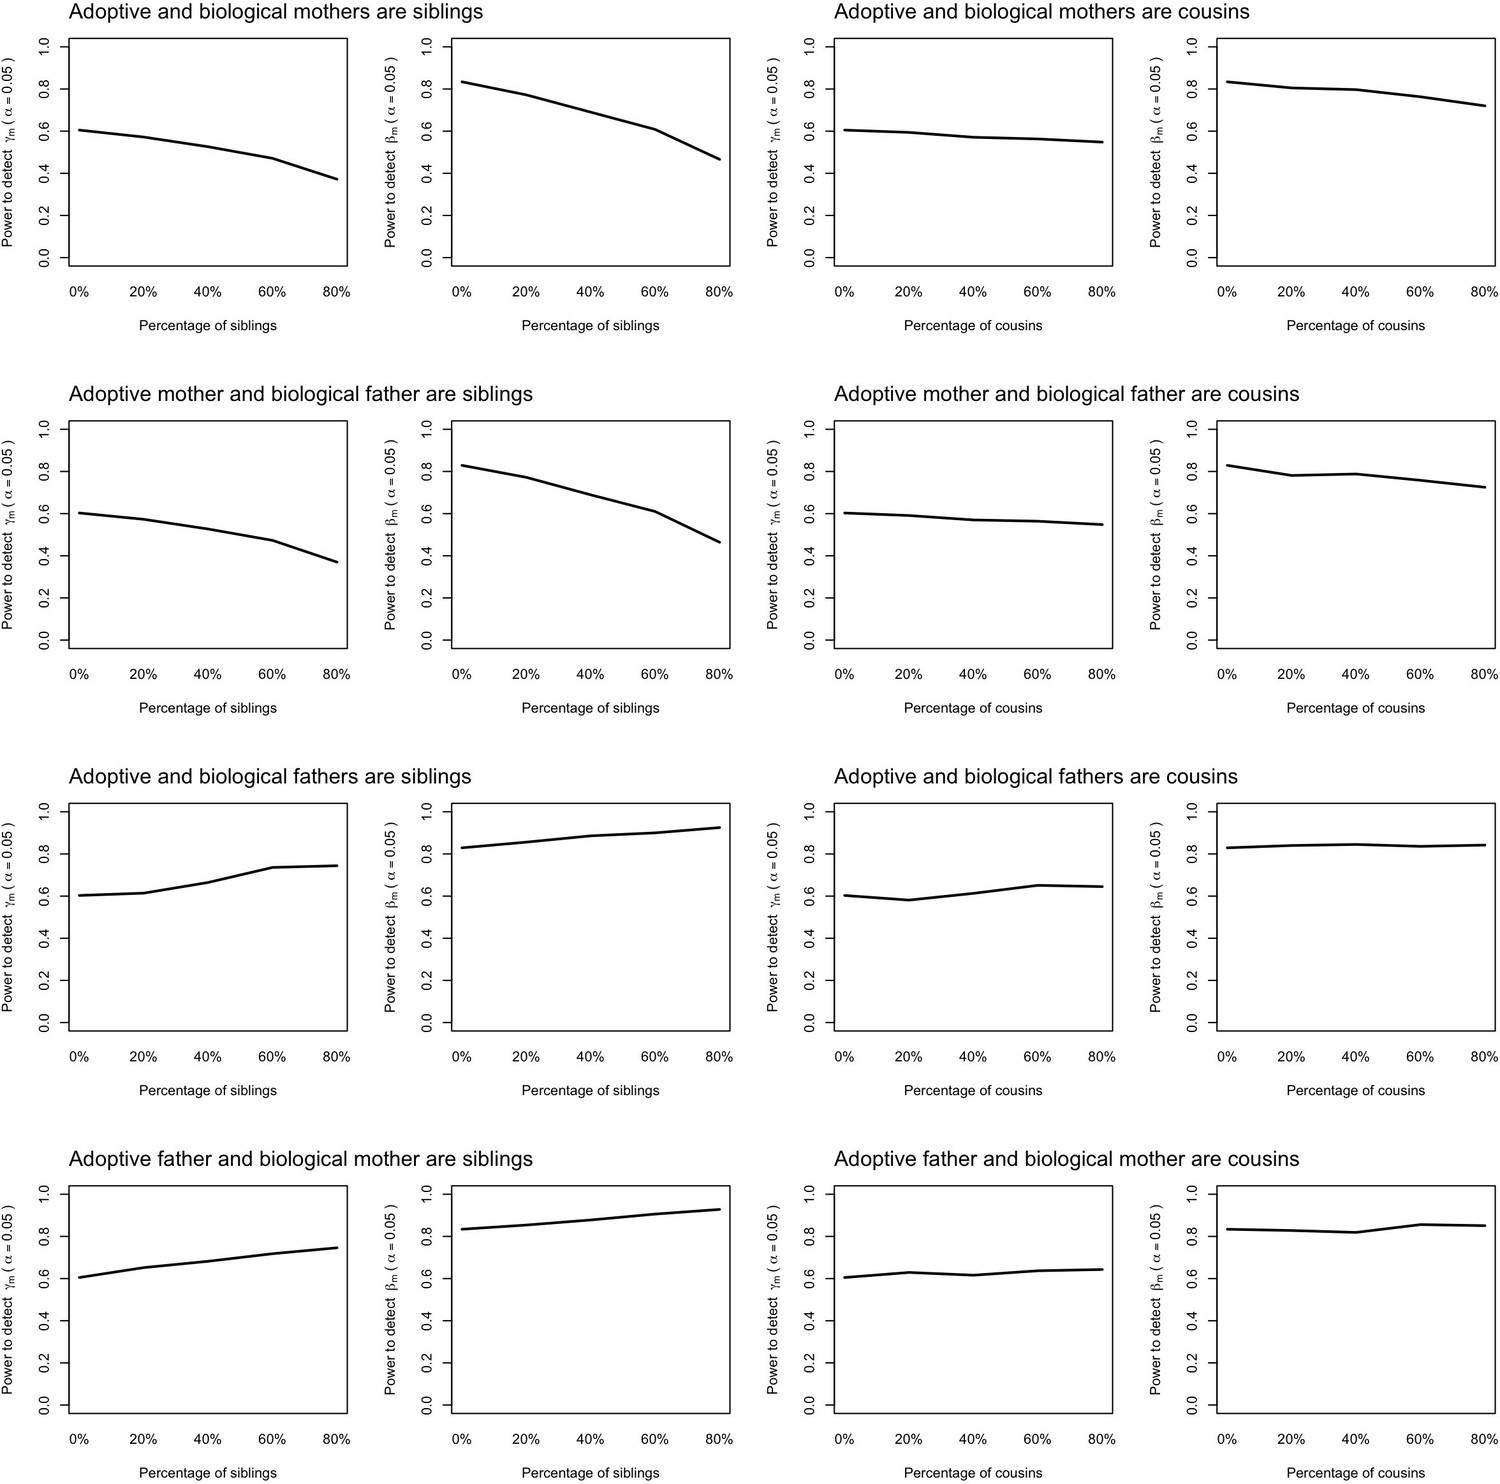
Power to detect prenatal (γm) and postnatal maternal (βm) genetic effects when the relationship between adoptive and biological parents are correctly specified in the model.
Power was calculated using simulated data assuming 1000 biological parent-offspring trios, 4000 biological mother-offspring pairs, 1800 biological father-offspring pairs, 300,000 singletons from non-adopted families, and 6000 adopted individuals. Prenatal maternal genetic effects, postnatal maternal genetic effects, paternal genetic effects (βp) and offspring genetic effects (βo) were fixed to 0.1. The covariance between maternal and paternal genotypes was fixed to 0. The percentage of adopted individuals whose adoptive parents were genetically related to their biological parents was varied (x-axis). Note that 0% corresponds to the situation where biological and adoptive parents are unrelated.
Tables
Table 1
Modelling results of birth weight in the UK Biobank.
| Unweighed PRS | Weighted PRS | |||||
|---|---|---|---|---|---|---|
| Estimate | Std Error | P-value | Estimate | Std Error | P-value | |
| Offspring effect | –0.008 | 0.004 | 0.058 | –0.173 | 0.115 | 0.132 |
| Prenatal maternal effect | 0.035 | 0.013 | 0.006 | 0.893 | 0.383 | 0.020 |
| Postnatal maternal effect | –0.017 | 0.011 | 0.130 | –0.419 | 0.335 | 0.211 |
| Postnatal paternal effect | 0.003 | 0.005 | 0.588 | 0.048 | 0.151 | 0.751 |
-
PRS: polygenic risk score constructed using 20 SNPs showing maternal effects on birth weight from Warrington et al., 2019; Std Error: standard error.
Table 2
Modelling results of educational attainment in the UK Biobank.
| Full sample | ||||||
|---|---|---|---|---|---|---|
| Unweighted PRS | Weighted PRS | |||||
| Estimate | Std Error | p-value | Estimate | Std Error | p-value | |
| Offspring effect | 0.026 | 0.005 | 3.18 × 10 -7 | 2.474 | 0.485 | 3.40 × 10 -7 |
| Prenatal maternal effect | 0.027 | 0.011 | 0.013 | 1.722 | 0.703 | 0.014 |
| Postnatal maternal effect | –0.006 | 0.008 | 0.484 | –0.288 | 0.514 | 0.575 |
| Postnatal paternal effect | 0.018 | 0.007 | 0.006 | 1.233 | 0.678 | 0.069 |
| Excluding adopted individuals with breastfeeding information | ||||||
| Unweighted PRS | Weighted PRS | |||||
| Estimate | Std Error | p-value | Estimate | Std Error | p-value | |
| Offspring effect | 0.025 | 0.005 | 5.52 × 10⁻⁷ | 2.441 | 0.372 | 5.15 × 10⁻¹¹ |
| Prenatal maternal effect | 0.017 | 0.012 | 0.140 | 0.909 | 0.705 | 0.197 |
| Postnatal maternal effect | 0.004 | 0.009 | 0.682 | 0.549 | 0.595 | 0.357 |
| Postnatal paternal effect | 0.019 | 0.007 | 0.005 | 1.273 | 0.552 | 0.021 |
-
PRS: polygenic risk score constructed using 1,267 SNPs from Lee et al., 2018; Std Error: standard error.
Author response table 1
| Effect | matrix | Estimate | Std.Error | P-value |
|---|---|---|---|---|
| GRS | V | 25.317 | 0.190 | 0.000 |
| Fetal effect | B_FY | 0.000 | 0.002 | 0.997 |
| Postnatal maternal effect | B_MY | 0.007 | 0.004 | 0.113 |
| Paternal effect | B_PY | -0.001 | 0.003 | 0.697 |
| Prenatal maternal effect | G_MY | 0.003 | 0.005 | 0.586 |
| e1 | E1 | 0.206 | 0.001 | 0.000 |
| e2 | E2 | 0.179 | 0.005 | 0.000 |
| rho | R | -0.045 | 0.369 | 0.907 |
Author response table 2
| Adopted individuals who knew their breastfeeding status | Adopted individuals who did not know their breastfeeding status | |
|---|---|---|
| Years of education (mean (SD)) | 13.97 (4.98) | 13.15 (5.00) |
| Birthweight (kg; mean (SD)) | 3.30 (0.43) | 3.34 (0.42) |
Author response table 3
| Effect | matrix | Adopted individuals with age<60 removed (N_G5=2756) | Adopted individuals with age>=60 removed (N_G5=2422) | ||||
|---|---|---|---|---|---|---|---|
| Estimate | Std.Error | P-value | Estimate | Std.Error | P-value | ||
| GRS | V | 571.885 | 4.747 | 0.000 | 571.943 | 5.006 | 0.000 |
| Fetal effect | B_FY | 0.026 | 0.005 | 0.000 | 0.025 | 0.005 | 0.000 |
| Postnatal maternal effect | B_MY | -0.019 | 0.009 | 0.046 | 0.007 | 0.0100 | 0.482 |
| Paternal effect | B_PY | 0.018 | 0.007 | 0.008 | 0.019 | 0.007 | 0.004 |
| Prenatal maternal effect | G_MY | 0.039 | 0.011 | 0.001 | 0.014 | 0.012 | 0.235 |
| e1 | E1 | 23.897 | 0.119 | 0.000 | 23.870 | 0.126 | 0.000 |
| e2 | E2 | 21.544 | 0.857 | 0.000 | 24.335 | 0.727 | 0.000 |
| rho | R | 58.208 | 9.397 | 0.000 | 58.262 | 9.956 | 0.000 |
Additional files
-
Supplementary file 1
SNPs used to construct unweighted polygenic scores of educational attainment.
- https://cdn.elifesciences.org/articles/73671/elife-73671-supp1-v2.xlsx
-
Supplementary file 2
SNPs used to construct unweighted polygenic scores of educational attainment.
- https://cdn.elifesciences.org/articles/73671/elife-73671-supp2-v2.xlsx
-
Supplementary file 3
Comparison of power estimated from asymptotic calculations and simulations using varying sizes of prenatal maternal genetic effects (γm), paternal genetic effects (βp) or offspring genetic effects (βo) with sample sizes approximating the number of individuals in UK Biobank with educational attainment information.
1000 biological parent-offspring trios, 4000 biological mother-offspring pairs, 1800 biological father-offspring pairs, 300,000 singletons, 6000 adopted individuals, and 50 biological mother-adopted offspring pairs. Covariance between parental genotypes was fixed at 0.
- https://cdn.elifesciences.org/articles/73671/elife-73671-supp3-v2.xlsx
-
Supplementary file 4
Comparison of power to detect pre-natal (γm) and post-natal (βm) maternal genetic effects estimated from asymptotic calculations and simulations using varying sample size for each of the 7 family structures and the remaining family structures approximating the number of individuals in the UK Biobank with educational attainment data.
1000 biological parent-offspring trios, 4000 biological mother-offspring pairs, 1800 biological father-offspring pairs, 300,000 singletons, 6000 adopted individuals, and 50 biological mother-adopted offspring pairs.
Path coefficients representing postnatal or prenatal maternal genetic effects, paternal genetic effects (βp) and offspring genetic effects (βo) were fixed to 0.1. Covariance between parental genotypes was fixed to 0.
- https://cdn.elifesciences.org/articles/73671/elife-73671-supp4-v2.xlsx
-
Supplementary file 5
Sensitivity analysis for the modelling of educational attainment in the UK Biobank using SNPs from the Okbay et al., 2016.
- https://cdn.elifesciences.org/articles/73671/elife-73671-supp5-v2.xlsx
-
Supplementary file 6
Some limitations/assumptions of our Structural Equation Model (SEM) and its application to the UK Biobank.
Source Code File. R scripts that fit Structural Equation Modelling to partition maternal genetic effects into pre- and postnatal effects on offspring phenotypes.
- https://cdn.elifesciences.org/articles/73671/elife-73671-supp6-v2.docx
-
Transparent reporting form
- https://cdn.elifesciences.org/articles/73671/elife-73671-transrepform1-v2.docx
-
Source code 1
Adoption_SEM.R.
- https://cdn.elifesciences.org/articles/73671/elife-73671-code1-v2.zip
Download links
A two-part list of links to download the article, or parts of the article, in various formats.
Downloads (link to download the article as PDF)
Open citations (links to open the citations from this article in various online reference manager services)
Cite this article (links to download the citations from this article in formats compatible with various reference manager tools)
Using adopted individuals to partition indirect maternal genetic effects into prenatal and postnatal effects on offspring phenotypes
eLife 11:e73671.
https://doi.org/10.7554/eLife.73671


