High-resolution structures of the actomyosin-V complex in three nucleotide states provide insights into the force generation mechanism
- Department of Structural Biochemistry, Max Planck Institute of Molecular Physiology, Germany
- Department of Pharmacology and Therapeutics and the Myology Institute, University of Florida, United States
- Structural Motility, Institut Curie, Centre National de la Recherche Scientifique, France
Figures
Figure 1 with 7 supplements
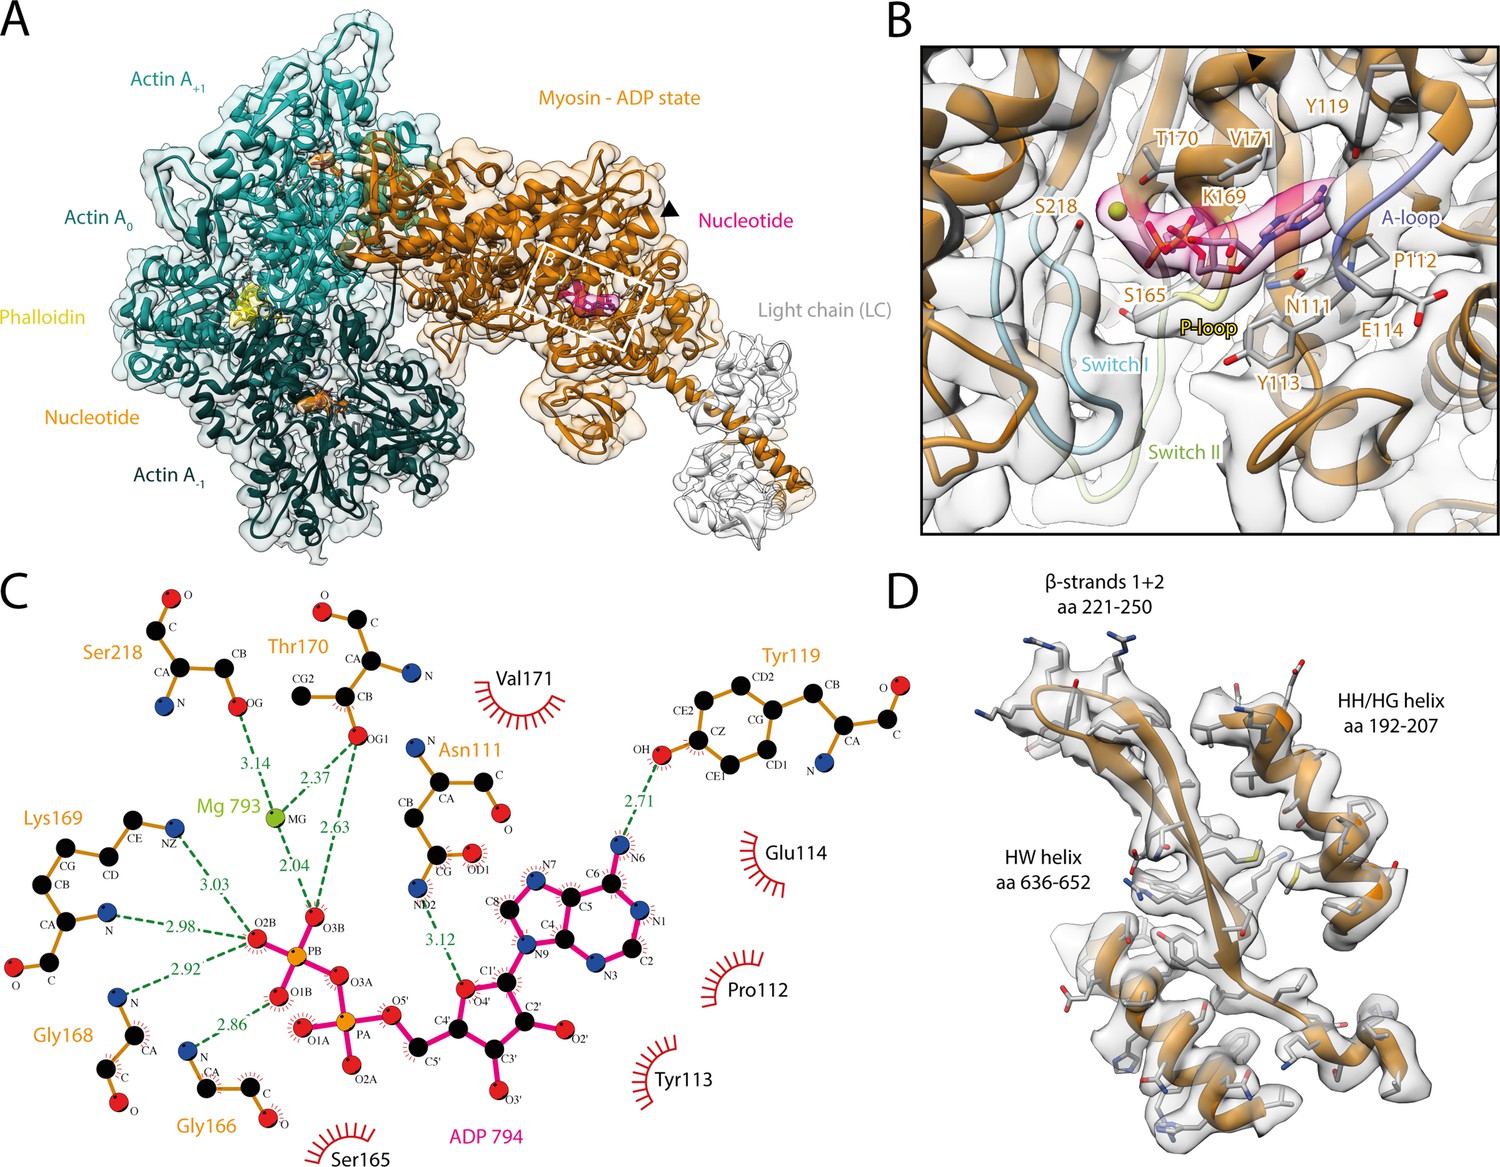
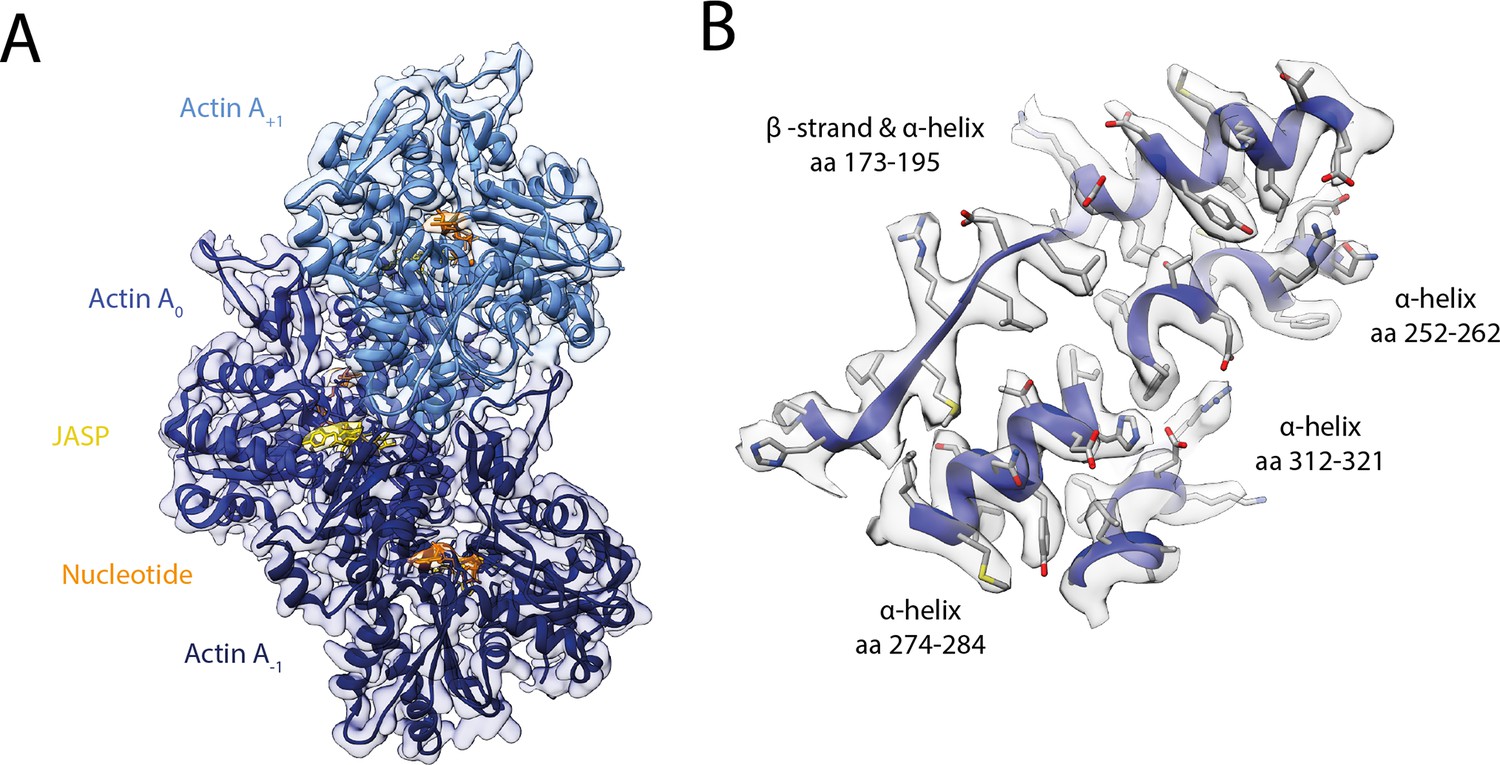
Structure and active site of the aged actomyosin-V complex bound to ADP.
(A) Atomic model and LAFTER density map of the central myosin-V-LC subunit (orange, LC: white) bound to aged F-actin-PHD (shades of sea green, three subunits shown, A-1 to A+1). Nucleotides and PHD are highlighted in orange, pink, and yellow, respectively. The HF helix is marked by a black arrowhead. (B) Close-up view of the myosin active site consisting of the P-loop (yellow, 164–168), switch I (blue, aa 208–220), switch II (green, aa 439–448), and the A-loop (purple, aa 111–116). Only side chains involved in the binding of ADP are displayed, also see Figure 1—figure supplement 3. (C) 2D protein-ligand interaction diagram illustrating the coordination of Mg2+-ADP by hydrogen bonds (dashed green lines) and hydrophobic interactions (red rays). (D) Illustration of the model-map agreement within a central section of myosin. Most side chains are resolved by the post-refined density map (transparent gray). See Figure 1—video 1 for a three-dimensional visualization and Figure 1—figure supplements 1–2 for an overview of the processing pipeline and the cryo-EM data, respectively. A comparison of the strong-ADP state of different myosins can be found in Figure 1—figure supplements 4 and 5. Figure 1—figure supplement 6 illustrates the domain architecture of myosin.
Figure 1—figure supplement 1
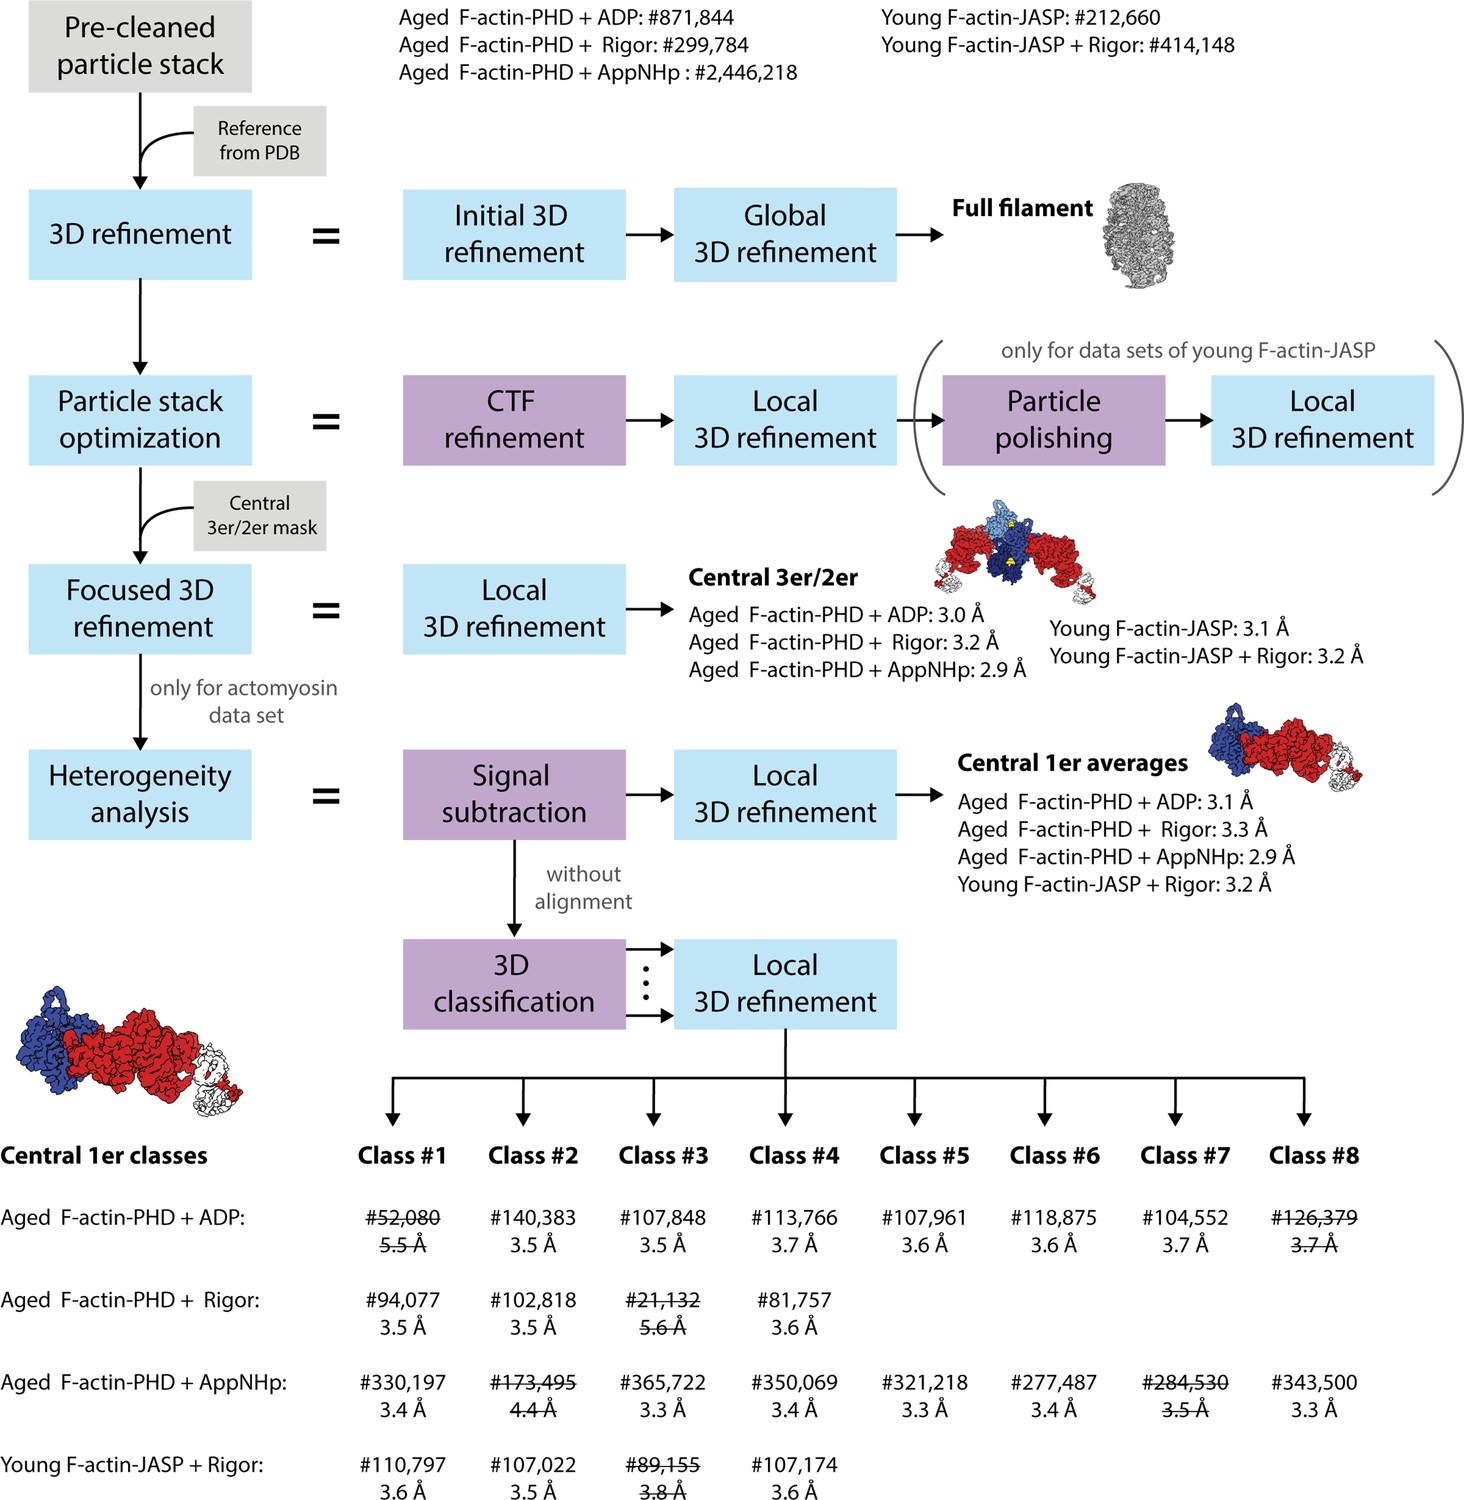
Schematic of the cryo-EM processing pipeline.
Auto-picked particle stacks were initially pre-cleaned by 2D classification (final number of particles stated). Cleaned stacks were 3D refined against an initial reference generated from an atomic model of actomyosin (PDB: 5JLH; von der Ecken et al., 2016) without applying a 3D mask. The resulting 3D density map was used as reference volume in a subsequent masked 3D refinement yielding a first high-resolution structure of the full actomyosin filament. Based on this, particle stacks were optimized by CTF refinement and in case of the young F-actin-JASP data sets by additional particle polishing, followed by a local 3D refinement. By applying a mask including only the central three actin and two myosin molecules (central 3er/2er), the refinement was subsequently focused on the central section of the filament (central 3er/2er maps, resolutions stated). To account for the structural heterogeneity observed in the actomyosin data sets, a heterogeneity analysis was performed. Here, particles were initially signal subtracted to remove everything but the central actomyosin subunit (central 1er). These particles were then locally 3D refined to produce average structures (central 1er maps, resolutions stated). In addition, signal-subtracted particles were 3D classified without alignment to separate distinct conformations. The number of classes was optimized experimentally to yield a maximum number of high-resolution 3D classes. Finally, subsets were locally 3D refined, resulting in 18 high-resolution structures (central 1er classes, final number of particles and resolutions stated). Classes of insufficient quality (struck through) were not modeled and omitted in all subsequent analysis steps.
Figure 1—figure supplement 2
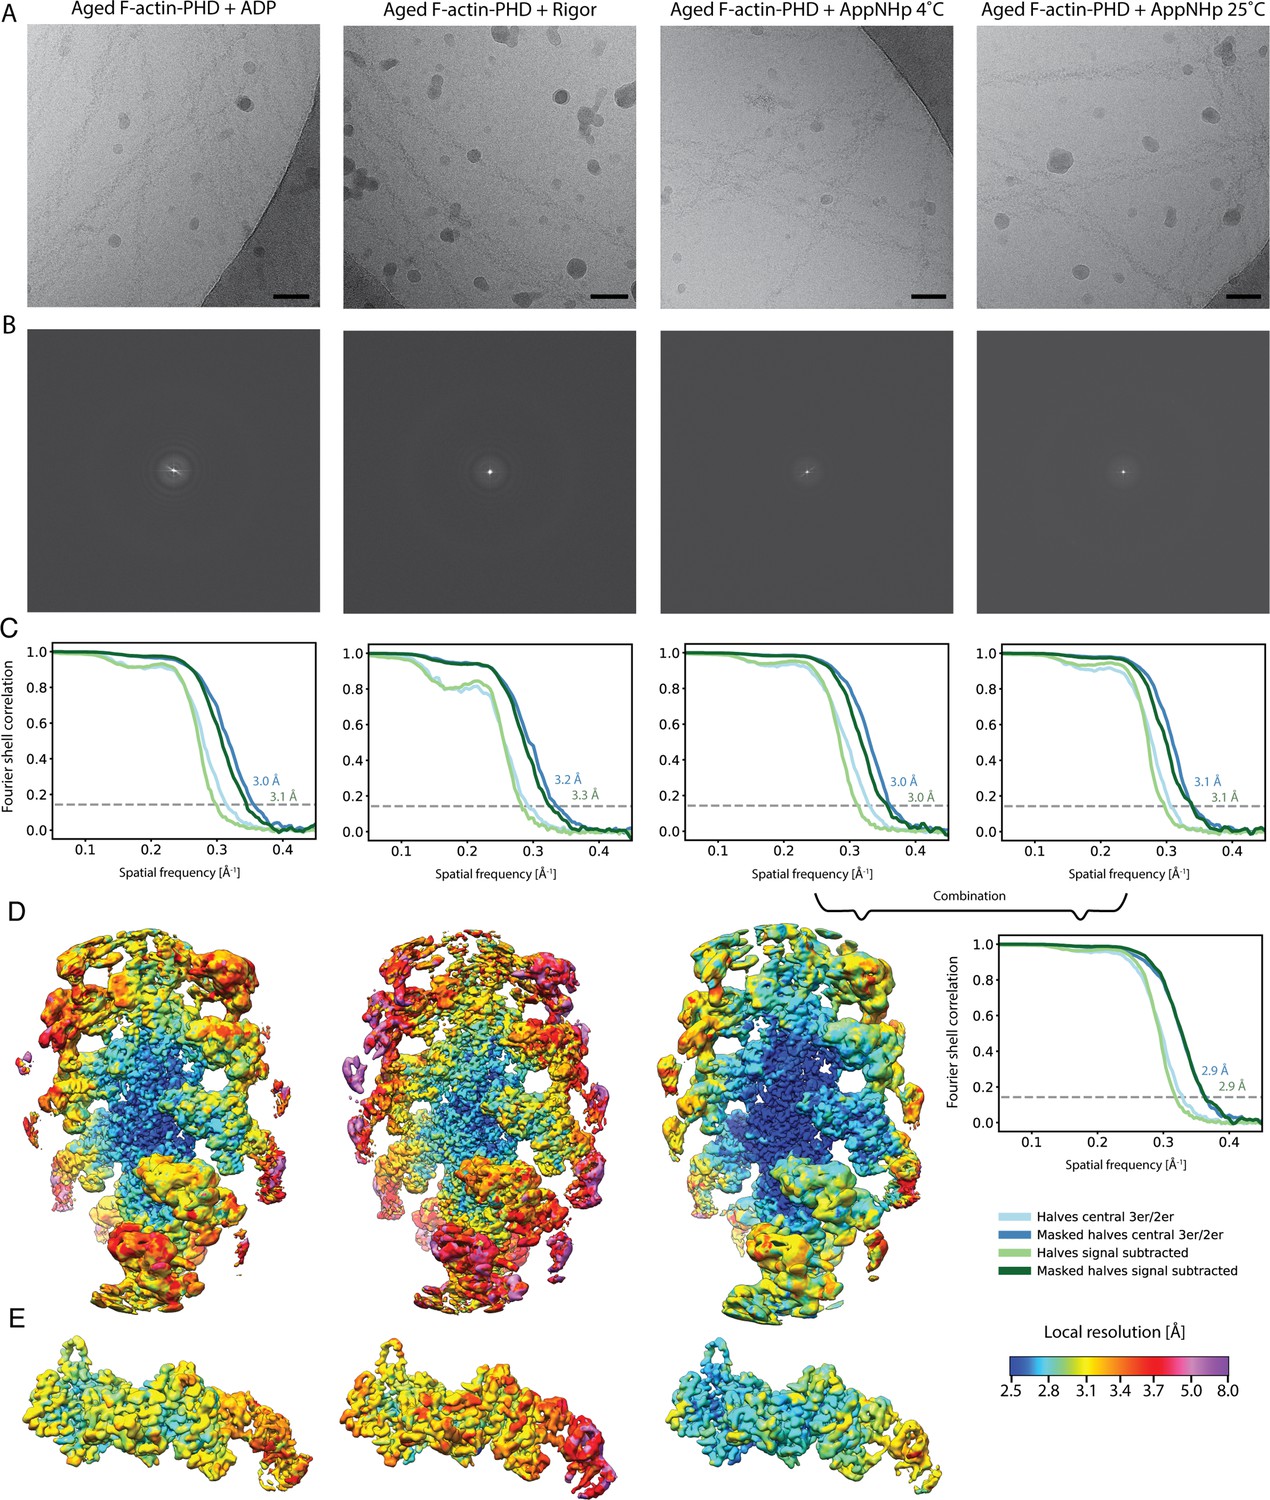
Overview of the cryo-EM data and resolution of aged F-actin-PHD in complex with myosin-V in the rigor, ADP, and AppNHp state.
(A) Representative micrographs at –1.3 μm defocus and (B) their power spectra. (C) Fourier shell correlation (FSC) curves for masked (darker shade, with resolution values) and unmasked half maps (lighter shade) including either three actin subunits and two myosin molecules (central 3er/2er, shades of blue, also see Figure 1—figure supplement 1) or one actomyosin subunit (signal subtracted, central 1er, shades of green). (D) Color-coded local resolution of full filaments and (E) signal-subtracted actomyosin subunits for all three states. Note that the two AppNHp data sets (4°C and 25°C) were combined to increase the overall resolution. Scale bar 500 Å.
Figure 1—figure supplement 3

Nucleotide densities at and organization of the active sites of actin and myosin.
Close-up views of the active site of F-actin (left column) and myosin-V (middle and right column) of all five structures. Ribbons are color-coded according to the respective structural state; aged F-actin-PHD: sea green; young F-actin-JASP: blue; and myosin-V in the rigor: red; ADP: orange; and AppNHp state: purple. Key loops of the myosin active site are highlighted by pastel colors; P-loop: yellow; switch I: blue; switch II: green; and A-loop: purple. Nucleotide densities are shown in orange and clearly support the presence of Pi in young JASP-stabilized F-actin. While there is density for a Mg2+ ion in all occupied active sites, there is an additional density, likely corresponding to a second Mg2+ ion, in AppNHp-bound myosin.
Figure 1—figure supplement 4
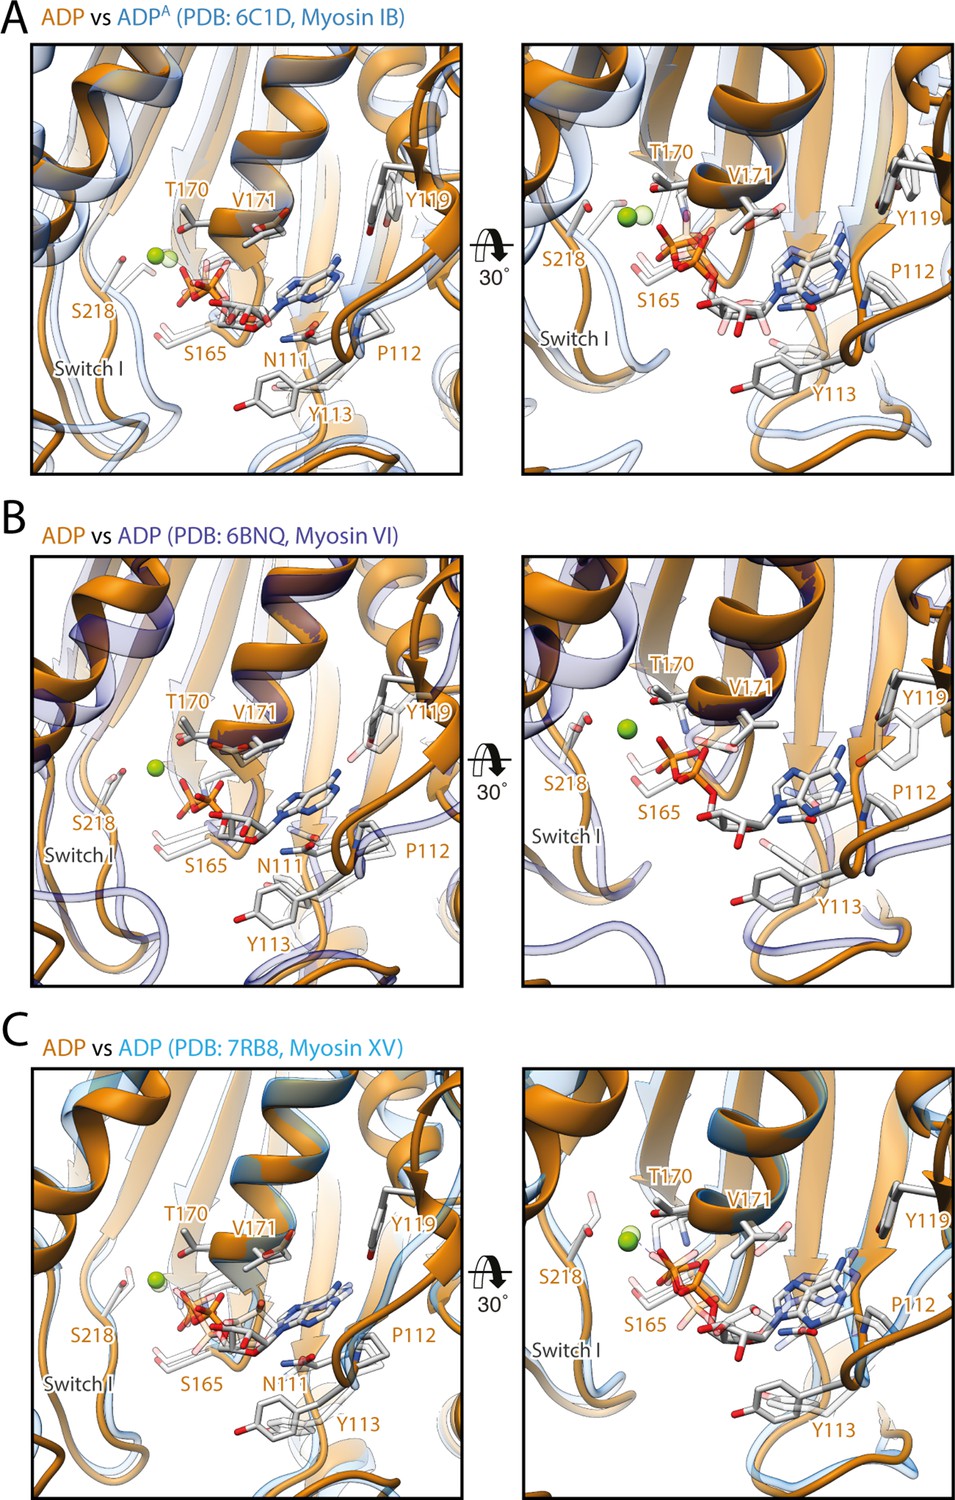
Comparison of the coordination of Mg2+-ADP in different myosins.
Comparison of the active sites of myosin-V in the strong-ADP state (orange) with the ones of (A) myosin-IB (PDB: 6C1D; Mentes et al., 2018), (B) myosin-VI (PDB: 6BNQ, nucleotide not modeled; Gurel et al., 2017), and (C) myosin-XV (PDB: 7R91, Gong et al., 2021) in the same state (shades of blue, shown as transparent). The coordination of Mg2+-ADP is almost identical in all four atomic models. Only the relative positions of switch I differ considerably, resulting in shifting of the coordinated Mg2+ ion. Atomic models were aligned on the HF helix (aa 169–181). Residue labels are given for myosin-V only.
Figure 1—figure supplement 5

Structural variations of the rigor and strong-ADP states of different actomyosin complexes.
Comparison of atomic models of the rigor and strong-ADP states of different actomyosin complexes solved by cryo-EM. (A) Superposition of the rigor states of myosin-V (red), myosin-II (PDB: 5H53; Fujii and Namba, 2017), myosin-NMIIC (PDB: 5JLH; von der Ecken et al., 2016), myosin-NMIIC (PDB: 5JLH; von der Ecken et al., 2016), myosin-IB (PDB: 6C1H; Mentes et al., 2018), and myosin-XV (PDB: 7R91; Gong et al., 2021) (shades of gray), illustrating strongly varying conformations and lever arm orientations. (B) Superposition of the strong-ADP states of myosin-V (orange), myosin-IB (PDB: 6C1D; Mentes et al., 2018), and myosin-XV (PDB: 7RB8; Gong et al., 2021) (shades of gray). The corresponding rigor states are shown as transparent. The difference in the orientation of the lever arm, which is caused by variations in the overall conformation, is even more pronounced in the strong-ADP state, increasing from a relative rotation of 54° to 71° for myosin-V and myosin-IB. These variations highlight the need to solve all key states of the motor cycle for a single myosin to reliably describe its structural transitions and ultimately the force generation mechanism. Structures are shown without the light chain after alignment on the actin subunit.
Figure 1—figure supplement 6
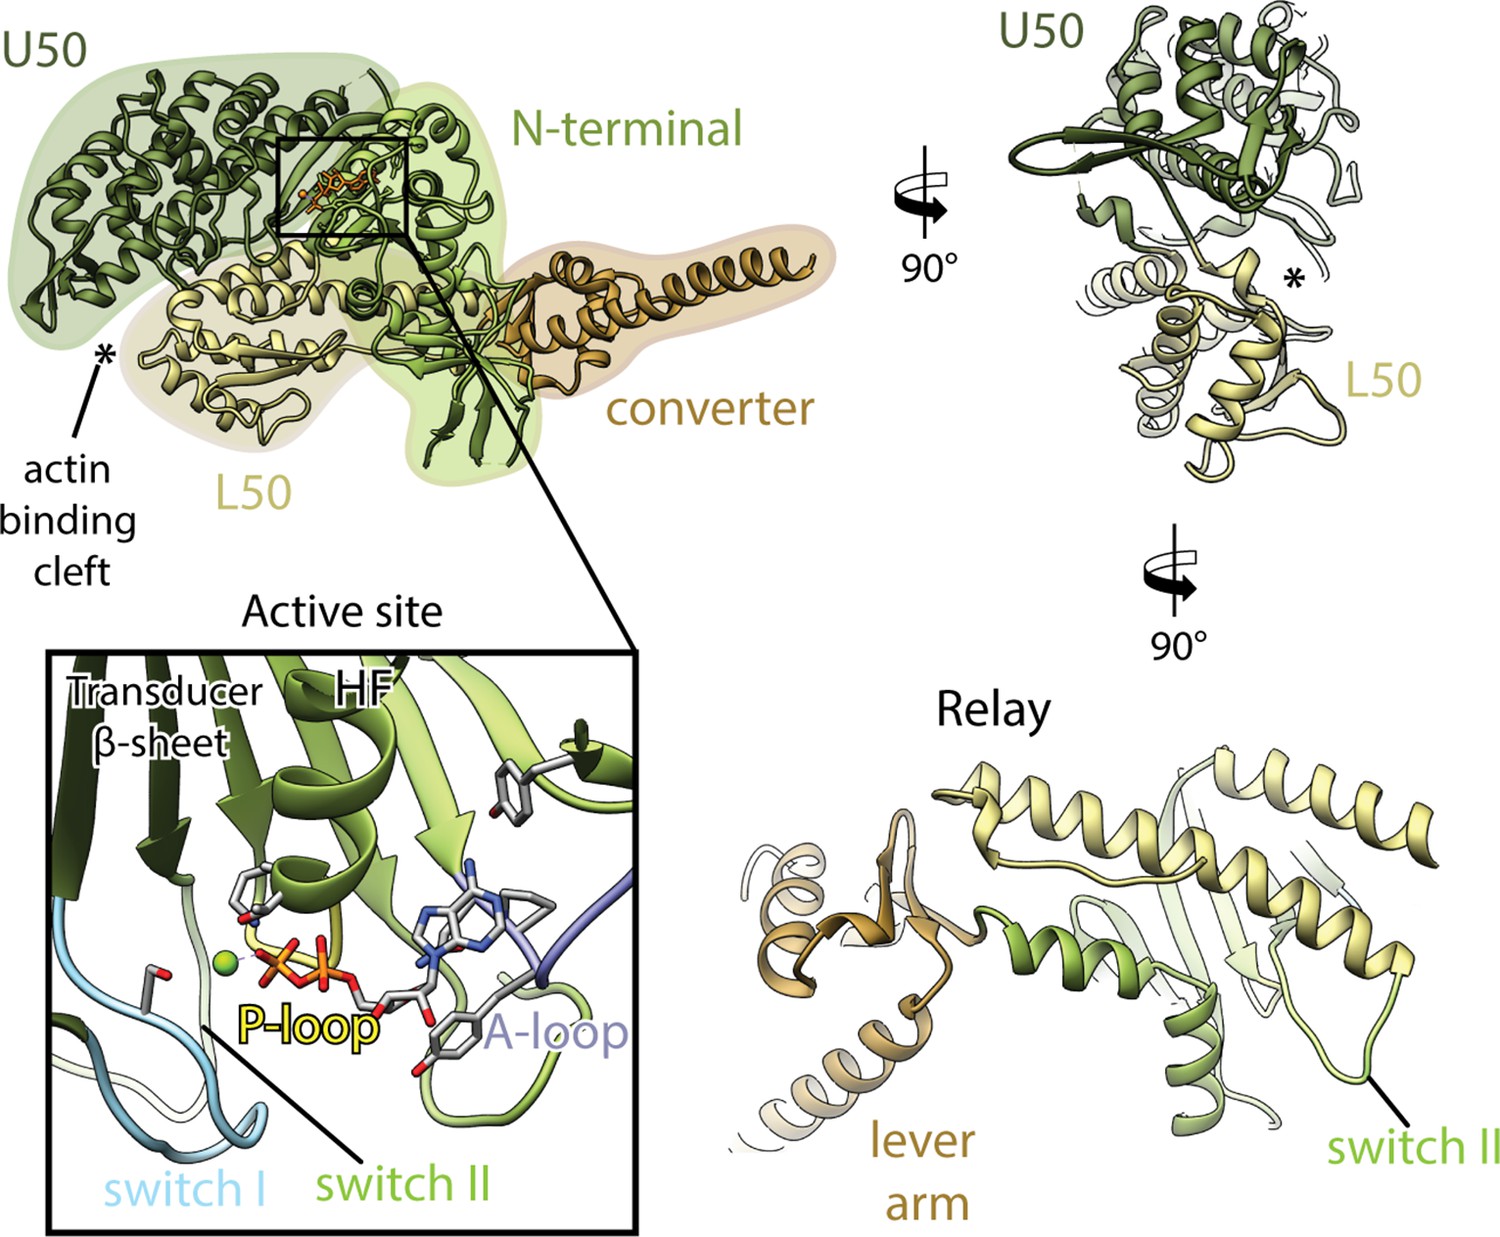
Domain architecture of the myosin motor domain.
Schematic illustrating the architecture of the myosin motor domain consisting of the actin-binding upper (U50, dark green) and lower 50 kDa domains (L50, tan), as well as the N-terminal domain (light green) and the converter domain (brown), which includes the light chain-binding lever arm. The U50 and L50 kDa domains are separated by a large cleft known as actin-binding cleft (highlighted by an asterisk). The active site resides at the interface of the U50 and N-terminal domain (black box, nucleotide shown in orange). The nucleotide localizes close to the HF helix (aa 169–183) and is coordinated by four loops including the P-loop: pastel yellow (aa 164–168); switch I: pastel blue (aa 208–220); switch II: pastel green (aa 439–448); and the A-loop: pastel purple (aa 111–116). Key structural elements such as the central transducer β-sheet and the relay helix (aa 449–479) are labeled.
Figure 1—video 1
Structure of the aged actomyosin-V complex bound to ADP.
Three-dimensional visualization of the aged actomyosin-V complex bound to ADP. Overview of the (A) overall structure, (B) active site, and (C) a central section of myosin, as shown in Figure 1A, B and D.
Figure 2 with 1 supplement
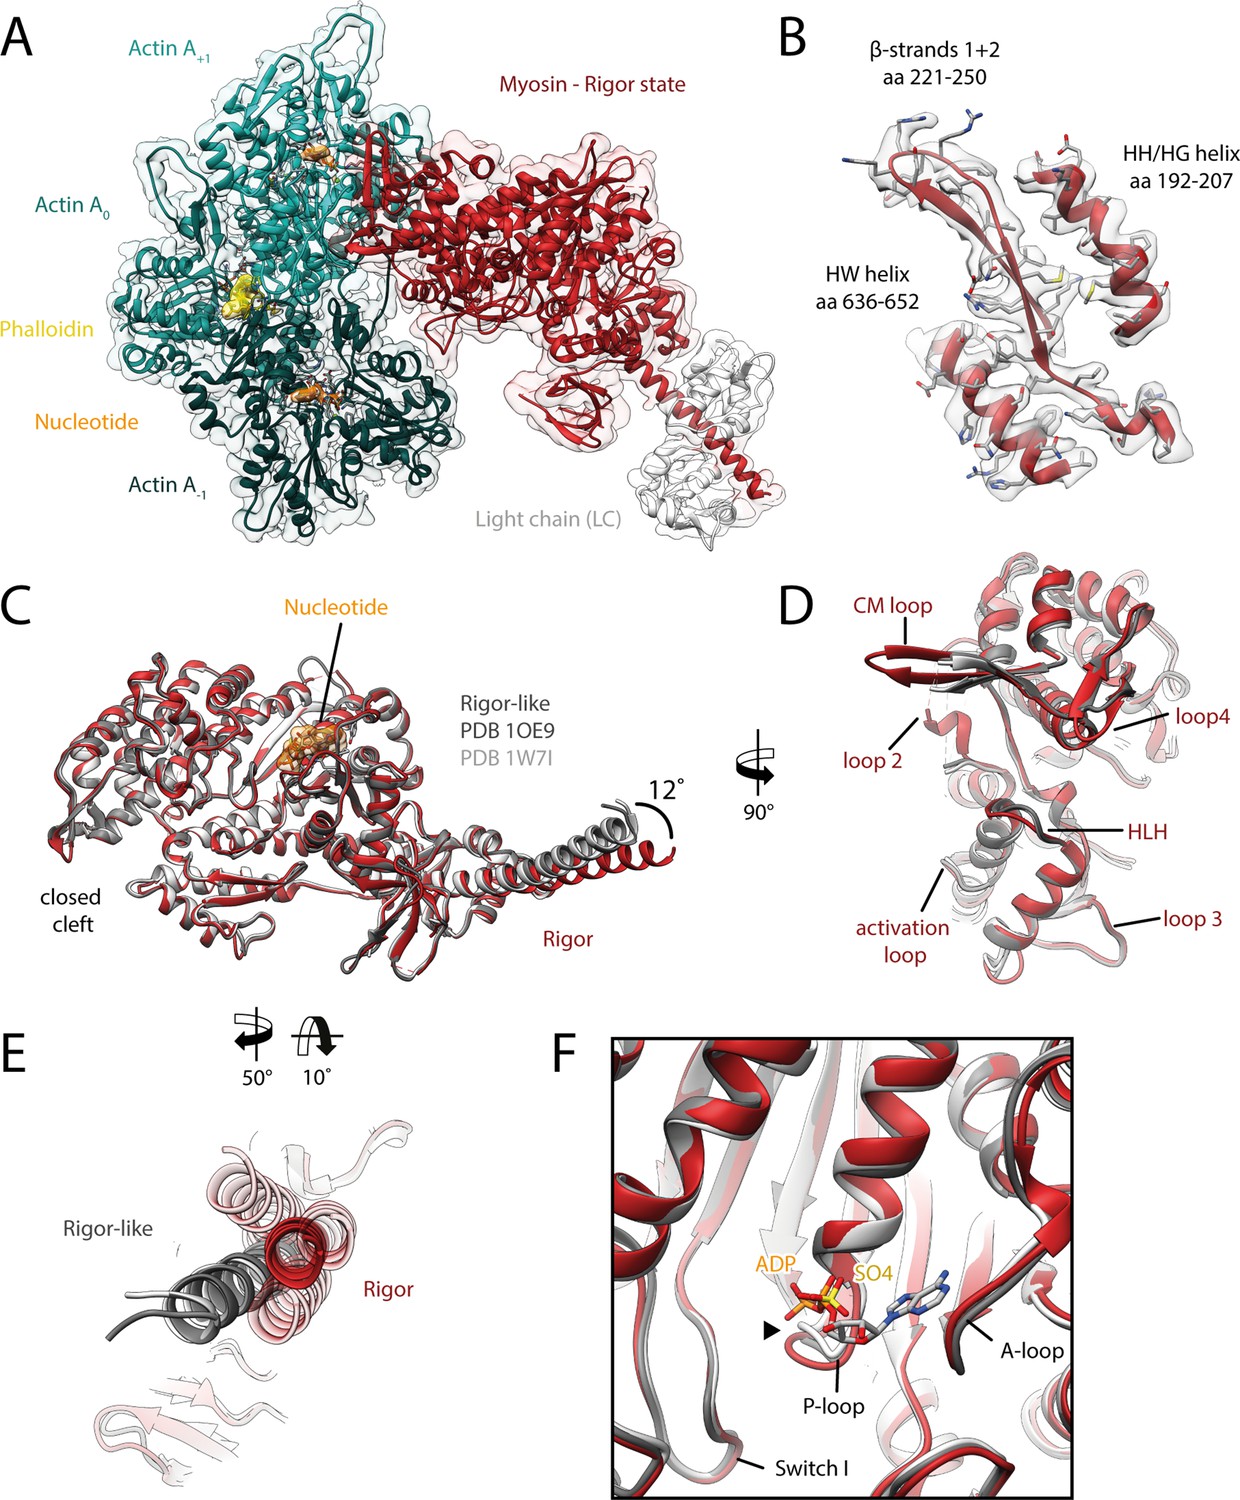
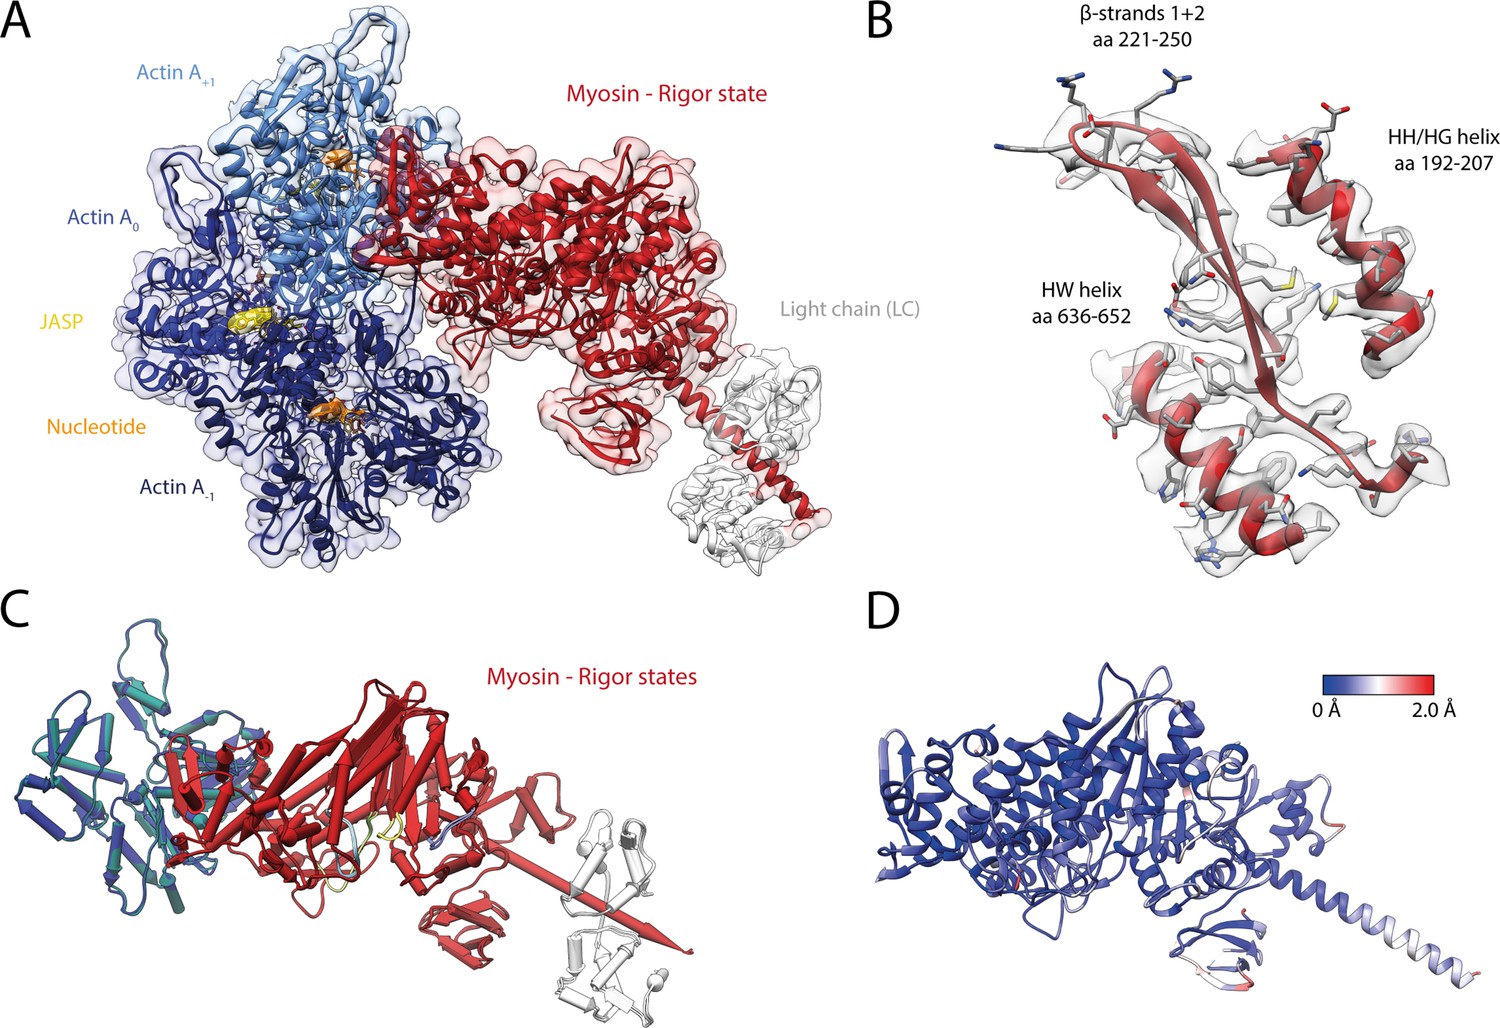
Structure of the aged actomyosin-V complex in the rigor state.
(A) Atomic model and LAFTER density map of the central myosin-V-LC subunit (red, LC: white) bound to aged F-actin-PHD (shades of sea green, three subunits shown, A-1 to A+1). Nucleotides and PHD are highlighted in orange and yellow, respectively. (B) Illustration of the model-map agreement within a central section of myosin. Most side chains are resolved by the post-refined density map (transparent gray). See Figure 2—video 1 for a three-dimensional visualization. (C–F) Comparison of the rigor state of myosin-V with crystal structures of the same myosin in the rigor-like state (PDB: 1OE9; Coureux et al., 2003; and PDB: 1W7I, also called weak-ADP state; Coureux et al., 2004; shades of gray). (C) Superposition of atomic models illustrating that deviations are limited to the actin interface, particularly (D) the CM loop, loop 4, and loop 2 and (E) the lever arm. Interestingly, the lever arm orientation seen in the rigor-like states does not superimpose with any conformation seen for the rigor complex (average: red; and 3D classes: transparent red), but localizes outside of its conformational space. (F) The active site is open in both the rigor and rigor-like states, and the SO4 and ADP bound to the rigor-like crystal structures only give rise to small, isolated changes of the P-loop (highlighted by a black arrowhead). Differences in the rigor-like structure can be readily attributed to the absence of F-actin and crystal packing, respectively.
Figure 2—video 1
Structure of the aged actomyosin-V complex in the rigor state.
Three-dimensional visualization of the aged actomyosin-V complex in the rigor state. Overview of the (A) overall structure, (B) active site, and (C) a central section of myosin, as shown in Figure 2.
Figure 3 with 1 supplement
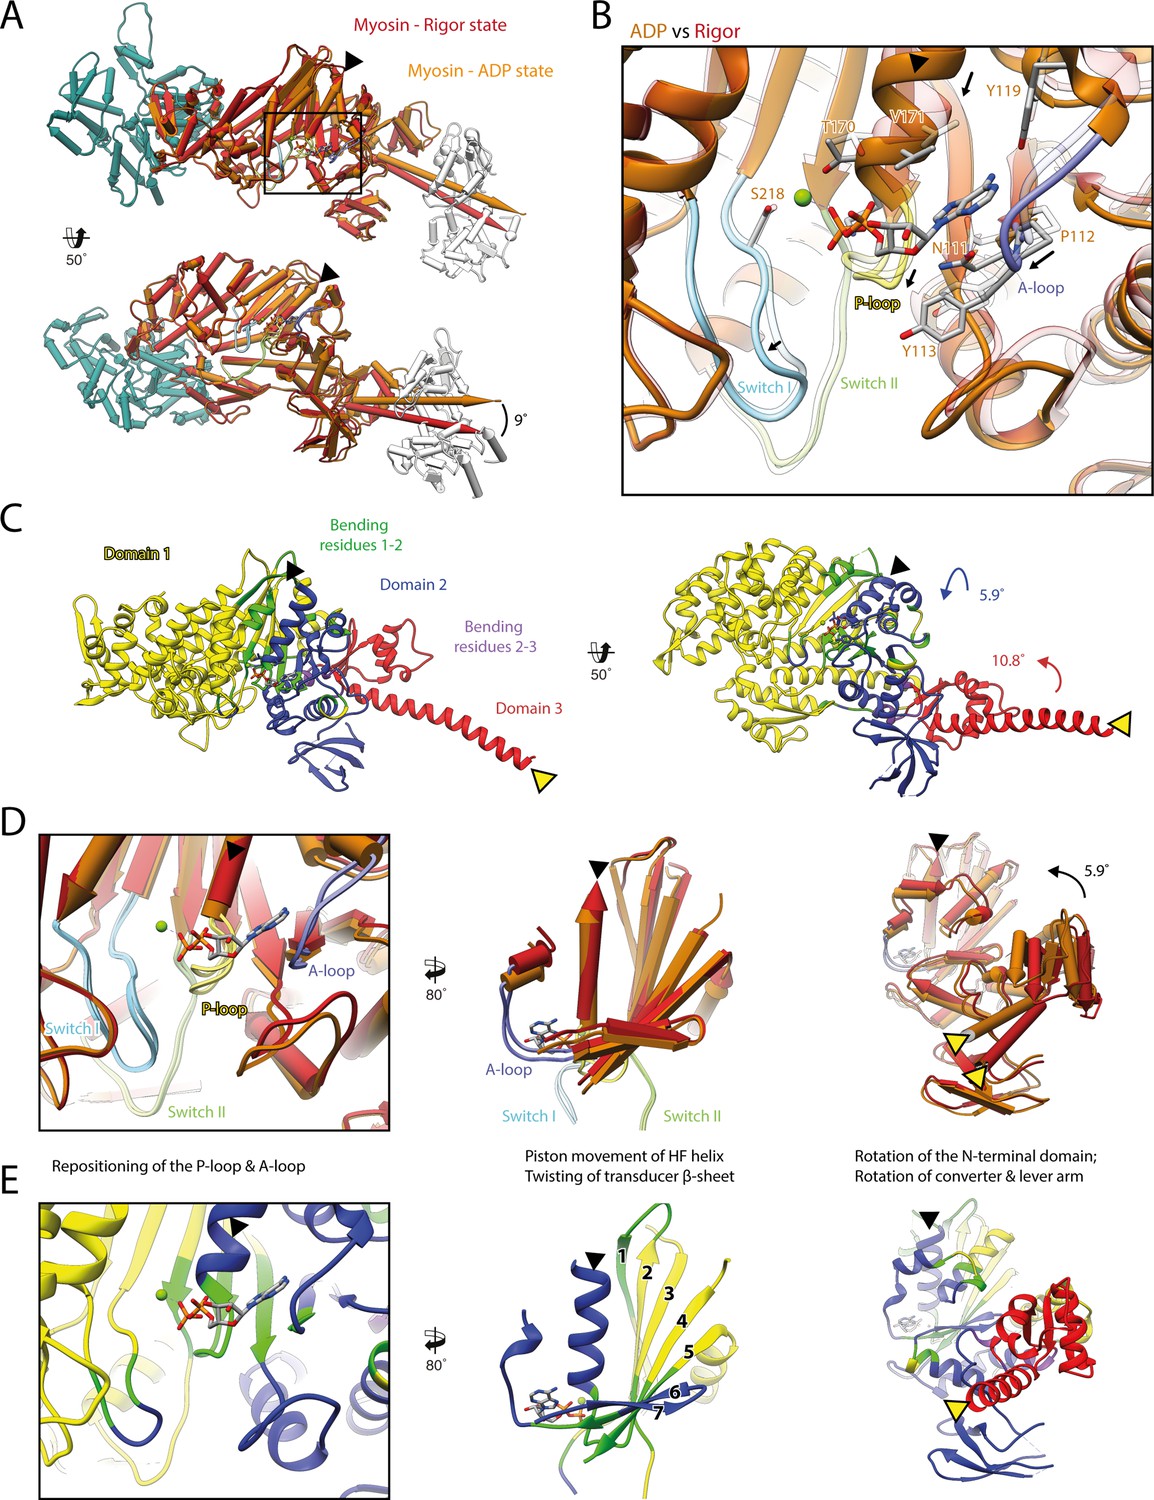
Structural transition of myosin-V upon Mg2+-ADP release.
(A) Superposition of the strong-ADP (orange) and rigor (red) atomic models. Changes at the active site (black box) are not transmitted to the actomyosin interface, but to the N-terminal and converter domain, resulting in a lever swing of 9°. (B) Close-up view of the active site showing the structural rearrangements upon Mg2+-ADP release (indicated by black arrows). The rigor structure is shown as transparent; see Figure 1 for color code. (C) Illustration of domain movements associated with Mg2+-ADP release predicted by DynDom (Hayward and Lee, 2002). Identified domains correlate well with myosins structural domains (see Figure 1—figure supplement 6) with domain 1 (yellow, 452 residues), domain 2 (181 residues, blue), and domain 3 (93 residues, red) representing the L50 and U50 domains, the N-terminal domain, and the converter domain, respectively. Bending residues primarily localize to the P-loop, the A-loop, and the central transducer β-sheet (1–2, green), as well as to a small part of the N-terminal and converter domain (2–3, purple). (D) Scheme illustrating the structural changes associated with Mg2+-ADP release. (E) Same views as in (D), but colored by DynDom domains, also see (C). The HF helix and the lever arm are highlighted by a black and a yellow arrowhead, respectively. Models were aligned on F-actin. See Figure 3—video 1 for a three-dimensional visualization.
Figure 3—video 1
Structural transition of myosin-V upon ADP release.
Three-dimensional visualization of the structural transition of myosin-V upon Mg2+-ADP release. (A, B) Morph from the strong-ADP (orange) to the rigor state (red) of myosin-V colored by state (A) and DynDom domains (B); for color code, see Figure 3. (C–E) and (F–H) indicate animated scheme illustrating the structural changes associated with Mg2+-ADP release as shown in Figure 3C and D.
Figure 4 with 4 supplements

Structure and active site of the aged actomyosin-V complex bound to AppNHp.
(A) Atomic model and LAFTER density map of the central myosin-V-LC subunit (purple, LC: white) bound to aged F-actin-PHD (shades of sea green, three subunits shown, A-1 to A+1). Nucleotides and PHD are highlighted in orange and yellow, respectively. (B) Close-up view of the myosin active site; see Figure 1 for color code. Only side chains involved in the binding of AppNHp are displayed. The density suggests the presence of two Mg2+ ions coordinating the γ, and α- and β-phosphate, respectively; also see Figure 1—figure supplement 3 and Figure 4—video 1. (C) 2D protein-ligand interaction diagram illustrating the coordination of Mg2+-AppNHp by hydrogen bonds (dashed green lines) and hydrophobic interactions (red rays). (D) Illustration of the model-map agreement within a central section of myosin. Most side chains are resolved by the post-refined density map (transparent gray). See Figure 4—figure supplements 1–3 for comparisons of the AppNHp-myosin-V structure with other structures as well as an analysis of unbound myosin in the AppNHp data set.
Figure 4—figure supplement 1
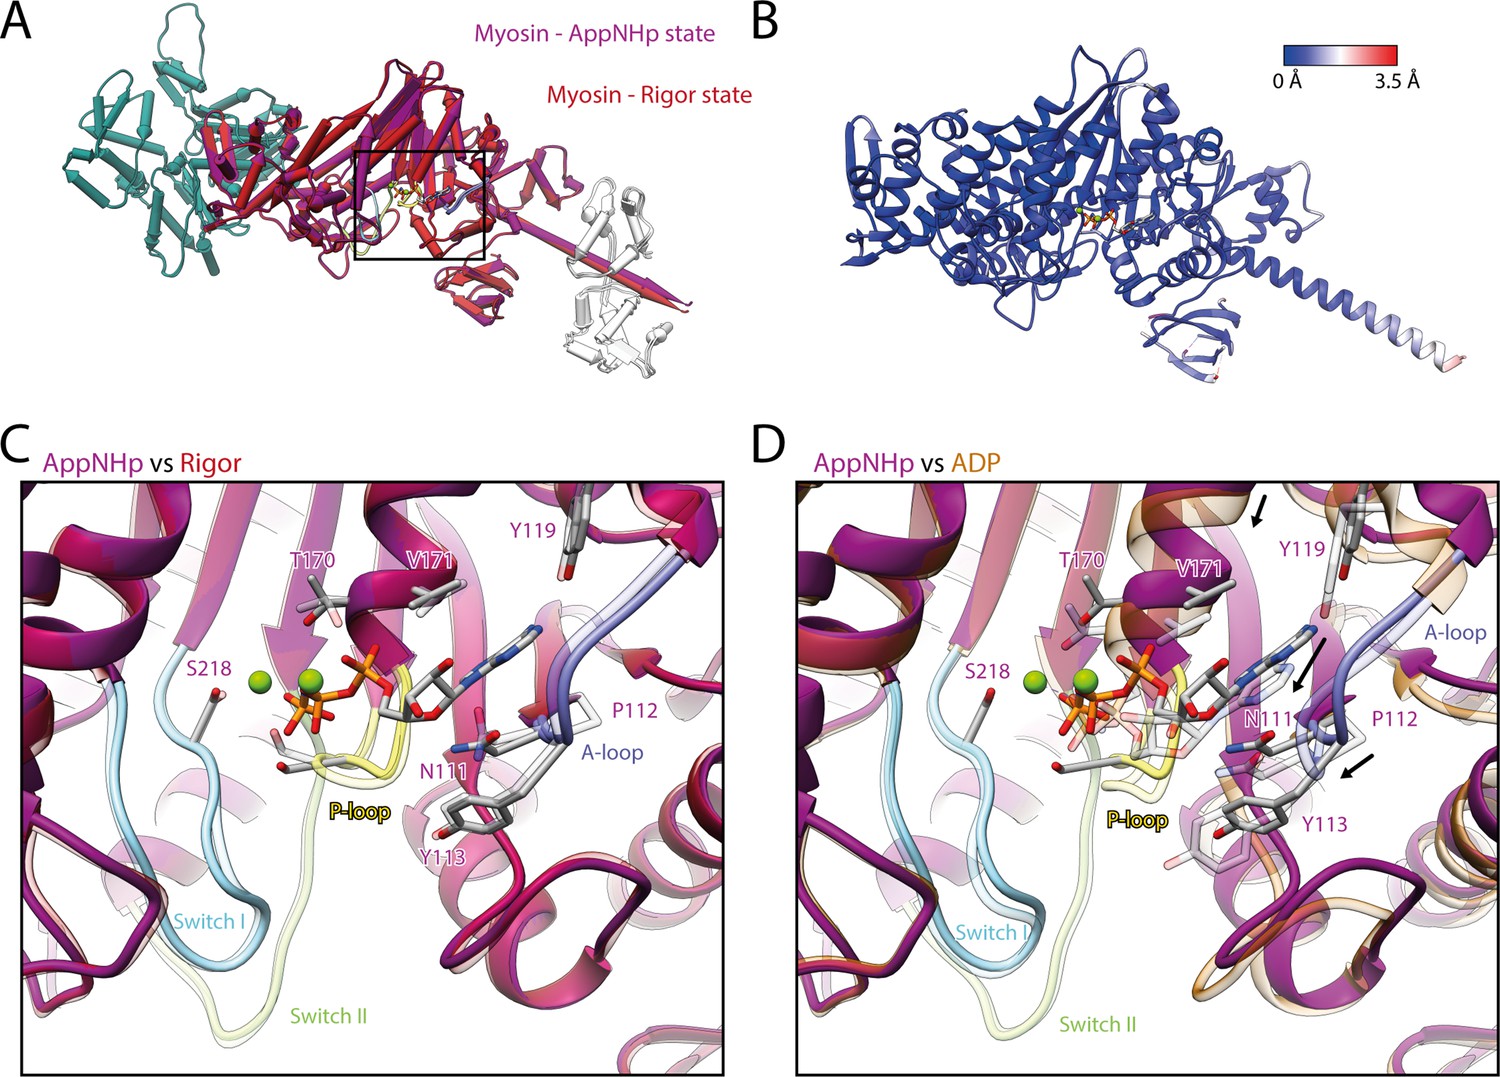
Comparison of AppNHp-bound myosin-V with myosin-V in the rigor and strong-ADP state.
(A) Superposition and (B) color-coded backbone root mean square deviation (RMSD) of the rigor (red) and the AppNHp (purple) atomic models, illustrating their close resemblance. Higher RMSD values localize exclusively to regions of lower local resolution and thus are likely due to modeling inaccuracies. A black box highlights the position of the active site. (C, D) Comparison of the active site of myosin bound to AppNHp (purple) with the one of myosin in the rigor (transparent red) (C) and strong-ADP state (transparent orange) (D). While only small, local changes are associated with the binding of AppNHp (C), the active sites of AppNHp- and ADP-bound myosin-V differ markedly (rearrangements are indicated by black arrows). Models were aligned on F-actin; for color code, see Figure 1.
Figure 4—figure supplement 2
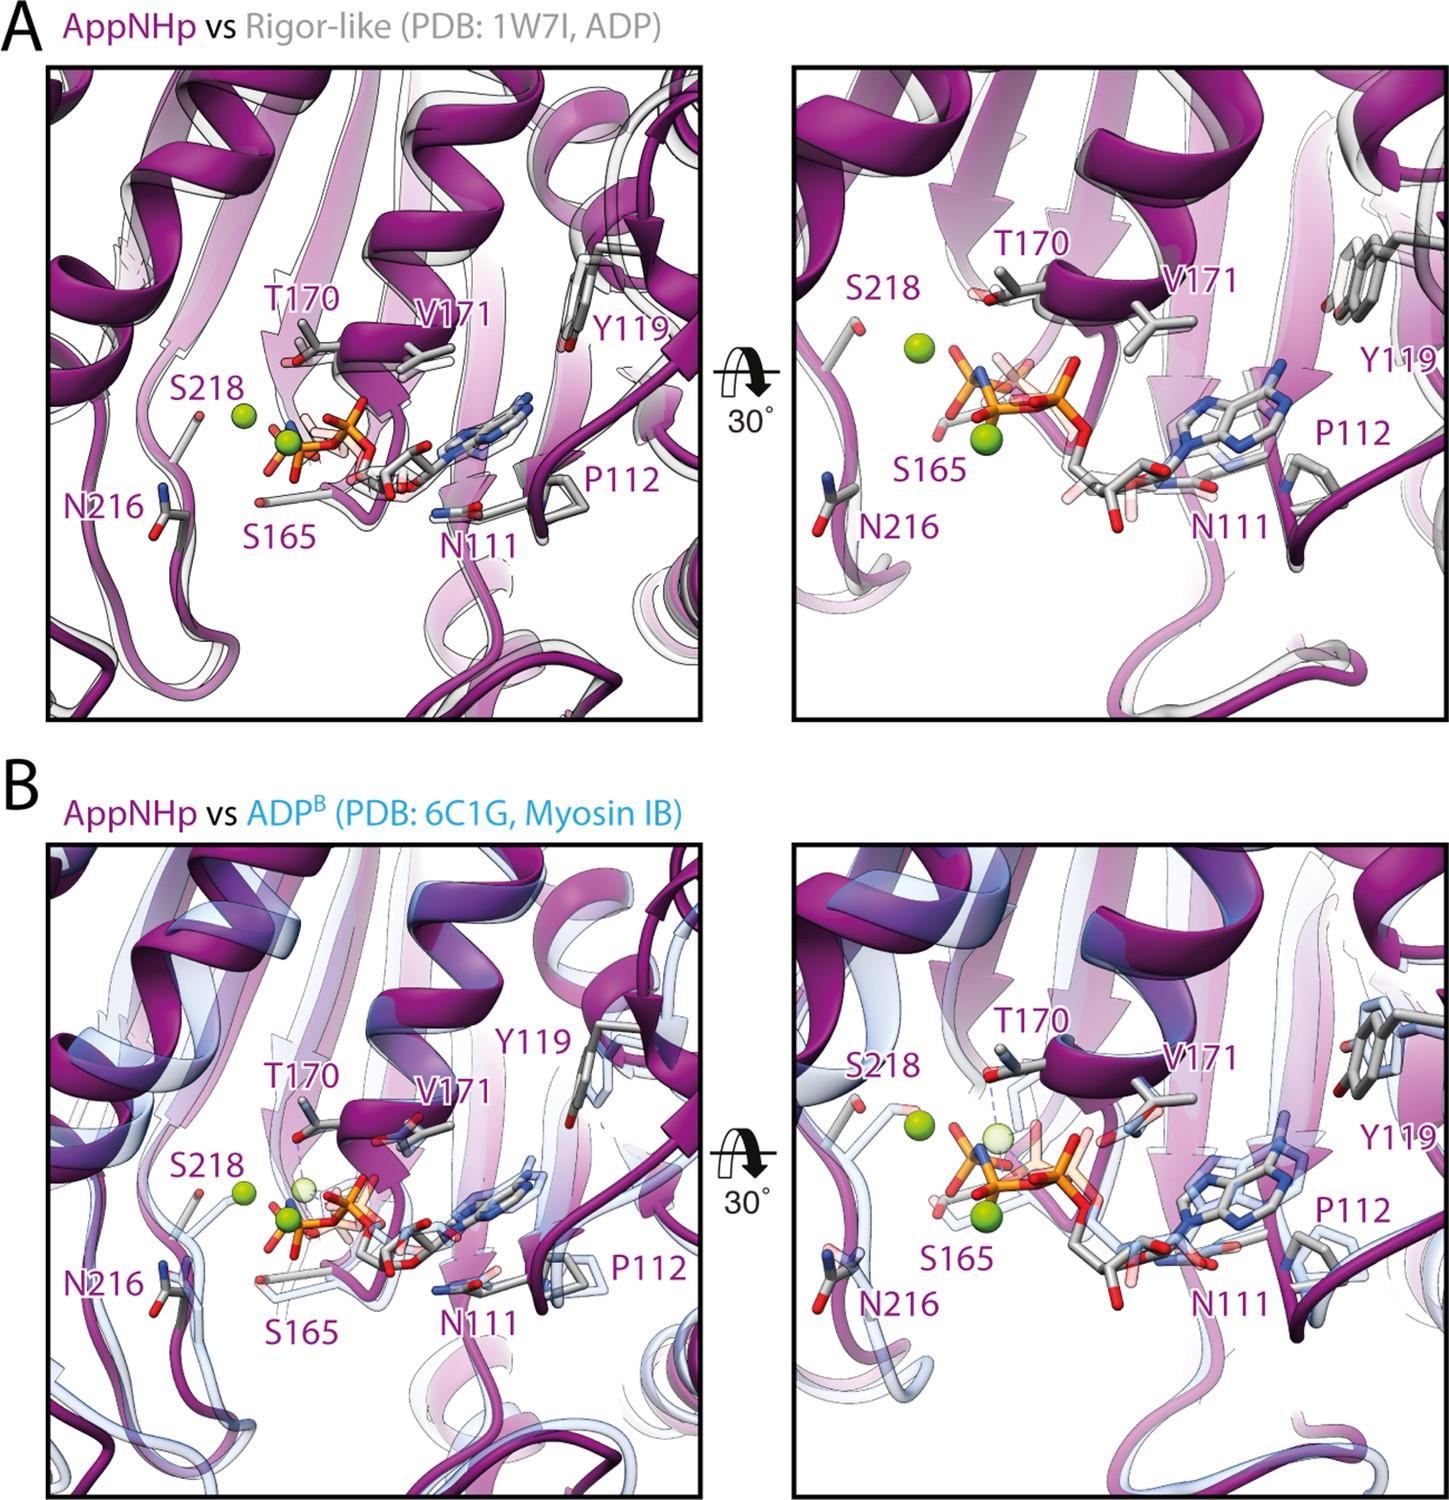
Common active site conformation in transition states with weakly bound nucleotide.
(A, B) Comparison of the active site of myosin-V bound to AppNHp with the one of (A) rigor-like myosin-V with ADP weakly bound (PDB: 17WI, also known as weak-ADP state, transparent gray; Coureux et al., 2004) and (B) ADP-bound myosin-IB in a strong-ADP to rigor transition state (PDB: 6C1G, transparent blue; Mentes et al., 2018). Models were aligned on the HF helix (aa 169–190, trailing the P-loop). The overall conformation of the active site as well as the coordination of the nucleotide is remarkably similar in all three structures, suggesting it to be characteristic for actin-bound transition states with weakly bound nucleotide.
Figure 4—figure supplement 3

2D cryo-EM data of unbound myosin-V in complex with AppNHp.
(A) Representative contrast-enhanced micrograph of the aged actomyosin-V complex bound to AppNHp (sample plunged at 4°C) illustrating many unbound particles in the background, which likely correspond to myosin-V molecules. Particle boxes (white) are shown for a few particles to highlight their size. Scale bar 500 Å. (B) Representative 2D class averages confirming that the particles in the background are indeed unbound myosin-V molecules. Scale bar 100 Å.
Figure 4—video 1
Structure of the aged actomyosin-V complex bound to AppNHp.
Three-dimensional visualization of the aged actomyosin-V complex bound to AppNHp. Overview of the (A) overall structure, (B) active site, and (C) a central section of myosin, as shown in Figure 4A, B and D.
Figure 5 with 1 supplement

Indistinguishable actomyosin interfaces in the strong-ADP, rigor, and post-rigor transition (PRT) state.
Comparison of the actomyosin-V interface within all three states (rigor: red; strong-ADP: orange; and AppNHp-bound PRT: purple) illustrating the remarkable similarity of interactions with F-actin. (Top) Front and back views of the central myosin molecule and the two actin subunits it is bound to (shades of green and blue, A+1 and A-1; see Figure 1—figure supplement 3 for color code). Black boxes indicate the location of close-up views shown below. (Bottom) Close-up views of all actin-myosin interfaces including the cardiomyopathy (CM) loop, the helix-loop-helix (HLH) motif, loops 2–4, and the activation loop (highlighted by an asterisk). Side chains of key residues are displayed and labeled for all states (rigor: black; ADP and AppNHp: gray). Dashed lines indicate hydrogen bonds predicted for the rigor (black) and ADP/AppNHp state (gray), respectively. See Figure 5—video 1 for a three-dimensional visualization including density maps.
Figure 5—video 1
Conservation of the actomyosin-V interface.
Comparison of the actomyosin-V interface within all three states (rigor: red; strong-ADP: orange; and AppNHp-bound post-rigor transition (PRT): purple). (A, J) Overview of the central myosin molecule and the two actin subunits it is bound to (shades of green and blue, A+1 and A-1; for color code, see Figure 1—figure supplement 3). (B–I) Close-up views highlighting the localization and molecular details of all actin-myosin interfaces including the cardiomyopathy (CM) loop and loop 4 (B–D), the helix-loop-helix (HLH) motif and activation loop (highlighted by an asterisk) (D–G), loop 3 (B, D, G, H), and loop 2 (D, G, I). In close-up views of specific interfaces, the structure of the aged actomyosin-V complex in the rigor state is first shown on its own, followed by a superposition of all models illustrating the remarkable similarity of the actomyosin interface. Corresponding density maps are additionally shown as mesh (rigor: red; strong-ADP: orange; PRT: purple; and young rigor: gray). See Figure 5 for residue labels and predicted hydrogen bonds.
Figure 6
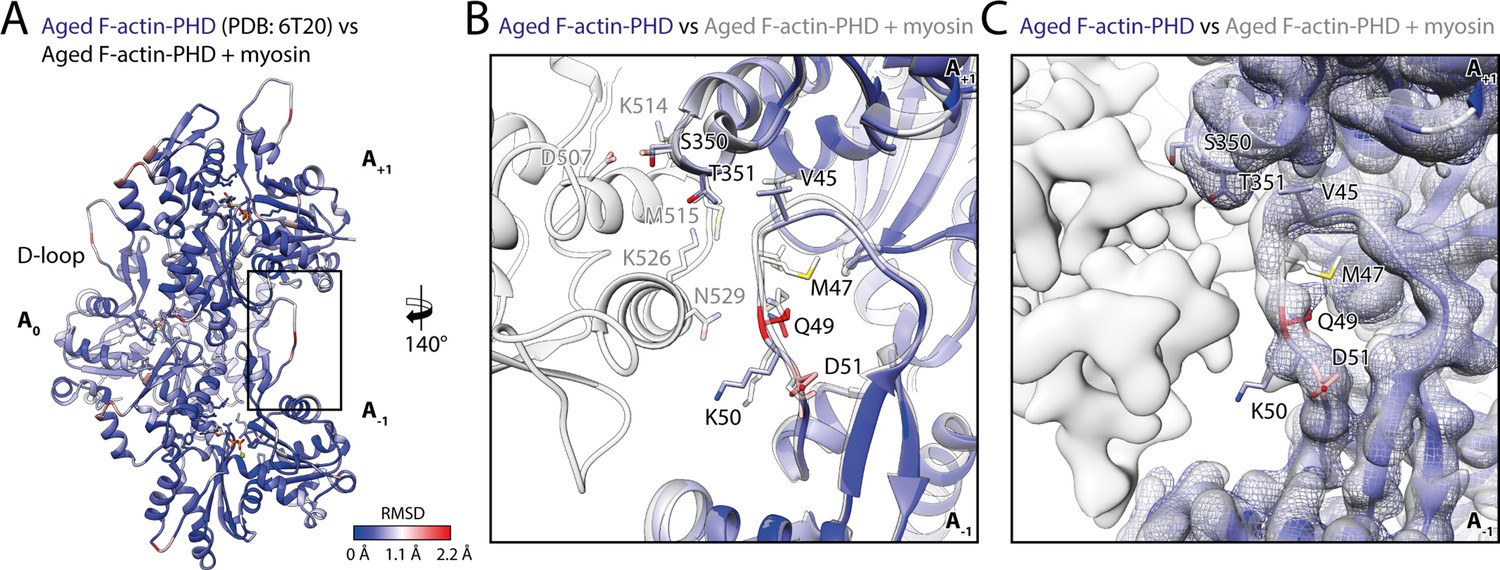
Myosin binding gives rise to subtle structural changes of aged PHD-stabilized F-actin.
Illustration of the structural similarity of aged F-actin-PHD in the absence and presence of myosin. (A) Atomic model of aged F-actin-PHD (PDB: 6T20; Pospich et al., 2020; three subunits shown, A-1 to A+1) color-coded by the backbone root mean square deviation (RMSD) of this structure with the one of aged F-actin-PHD decorated with myosin-V in the rigor state. (B) Close-up view of the D-loop interface illustrating that the structural changes associated with myosin binding are small. For a direct comparison, the atomic model of the rigor actomyosin-V complex is superimposed (transparent gray). F-actin subunits were aligned individually to account for errors in the calibration of the pixel size. (C) Comparison of LAFTER density maps of aged F-actin-PHD on its own (blue mesh) and bound to myosin-V (gray). For guidance, the atomic model of F-actin-PHD colored by RMSD is also shown. See Table 5 for a comparison of helical symmetry parameters.
Figure 7 with 2 supplements
Structure of the young actomyosin-V complex in the rigor state.
(A) Atomic model and LAFTER density map of the central myosin-V-LC subunit (red, LC: white) bound to young F-actin-JASP (shades of blue, three subunits shown, A-1 to A+1). Nucleotides and JASP are highlighted in orange and yellow, respectively; also see Figure 8—video 1F–H. (B) Illustration of the model-map agreement within a central section of myosin. Most side chains are resolved by the post-refined density map (transparent gray). (C) Superposition and (D) color-coded root mean square deviation (RMSD) of the young and aged actomyosin-V complex in the rigor state illustrating their structural identity. Residues with increased RMSD solely localize to regions of lower local resolution and can therefore be explained by modeling inaccuracies. See Figure 7—figure supplement 1 and Table 6 for an overview of the cryo-EM data and refinement and model building statistics, respectively. The structure of young F-actin-JASP in the absence of myosin is shown in Figure 7—figure supplement 2.
Figure 7—figure supplement 1
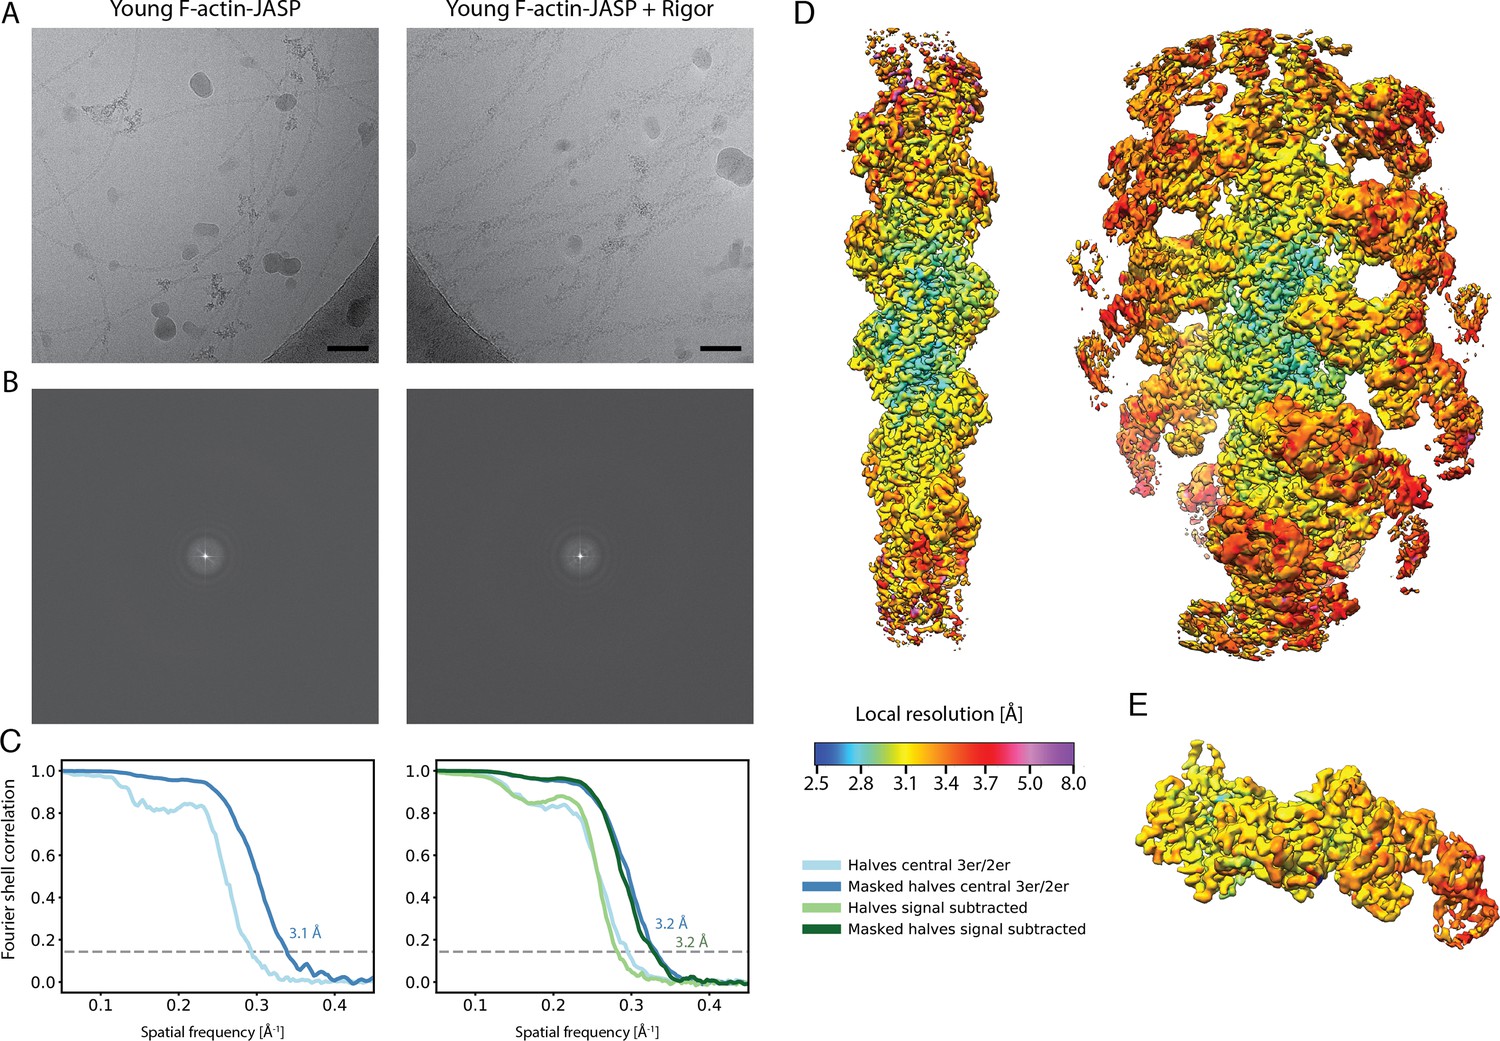
Overview of the cryo-EM data and resolution of young F-actin-JASP alone and in complex with myosin-V in the rigor state.
(A) Representative micrographs at –1.3 μm defocus and (B) their power spectra. (C) Fourier shell correlation (FSC) curves for masked (darker shade, with resolution values) and unmasked (lighter shade) half maps. For bare F-actin, the FSC of a map covering the central three subunits is shown (shades of blue), while for actomyosin either the FSC for three actin subunits and two myosin molecules (central 3er/2er, shades of blue) or for one actomyosin subunit (signal subtracted, central 1er, shades of green) is shown. (D) Color-coded local resolution of full filaments for both data sets and of the (E) signal-subtracted central subunit of the young actomyosin complex. Note that signal subtraction was only performed for actomyosin complexes; also see Figure 1—figure supplement 1. Scale bar 500 Å.
Figure 7—figure supplement 2
Structure of young JASP-stabilized F-actin.
(A) Atomic model and LAFTER density map of young F-actin-JASP (shades of blue, three subunits shown, A-1 to A+1). Nucleotides and JASP are highlighted in orange and yellow, respectively; also see Figure 8—video 1A–C. (B) Illustration of the model-map agreement within a central section of myosin. Most side chains are resolved by the post-refined density map (transparent gray).
Figure 8 with 3 supplements
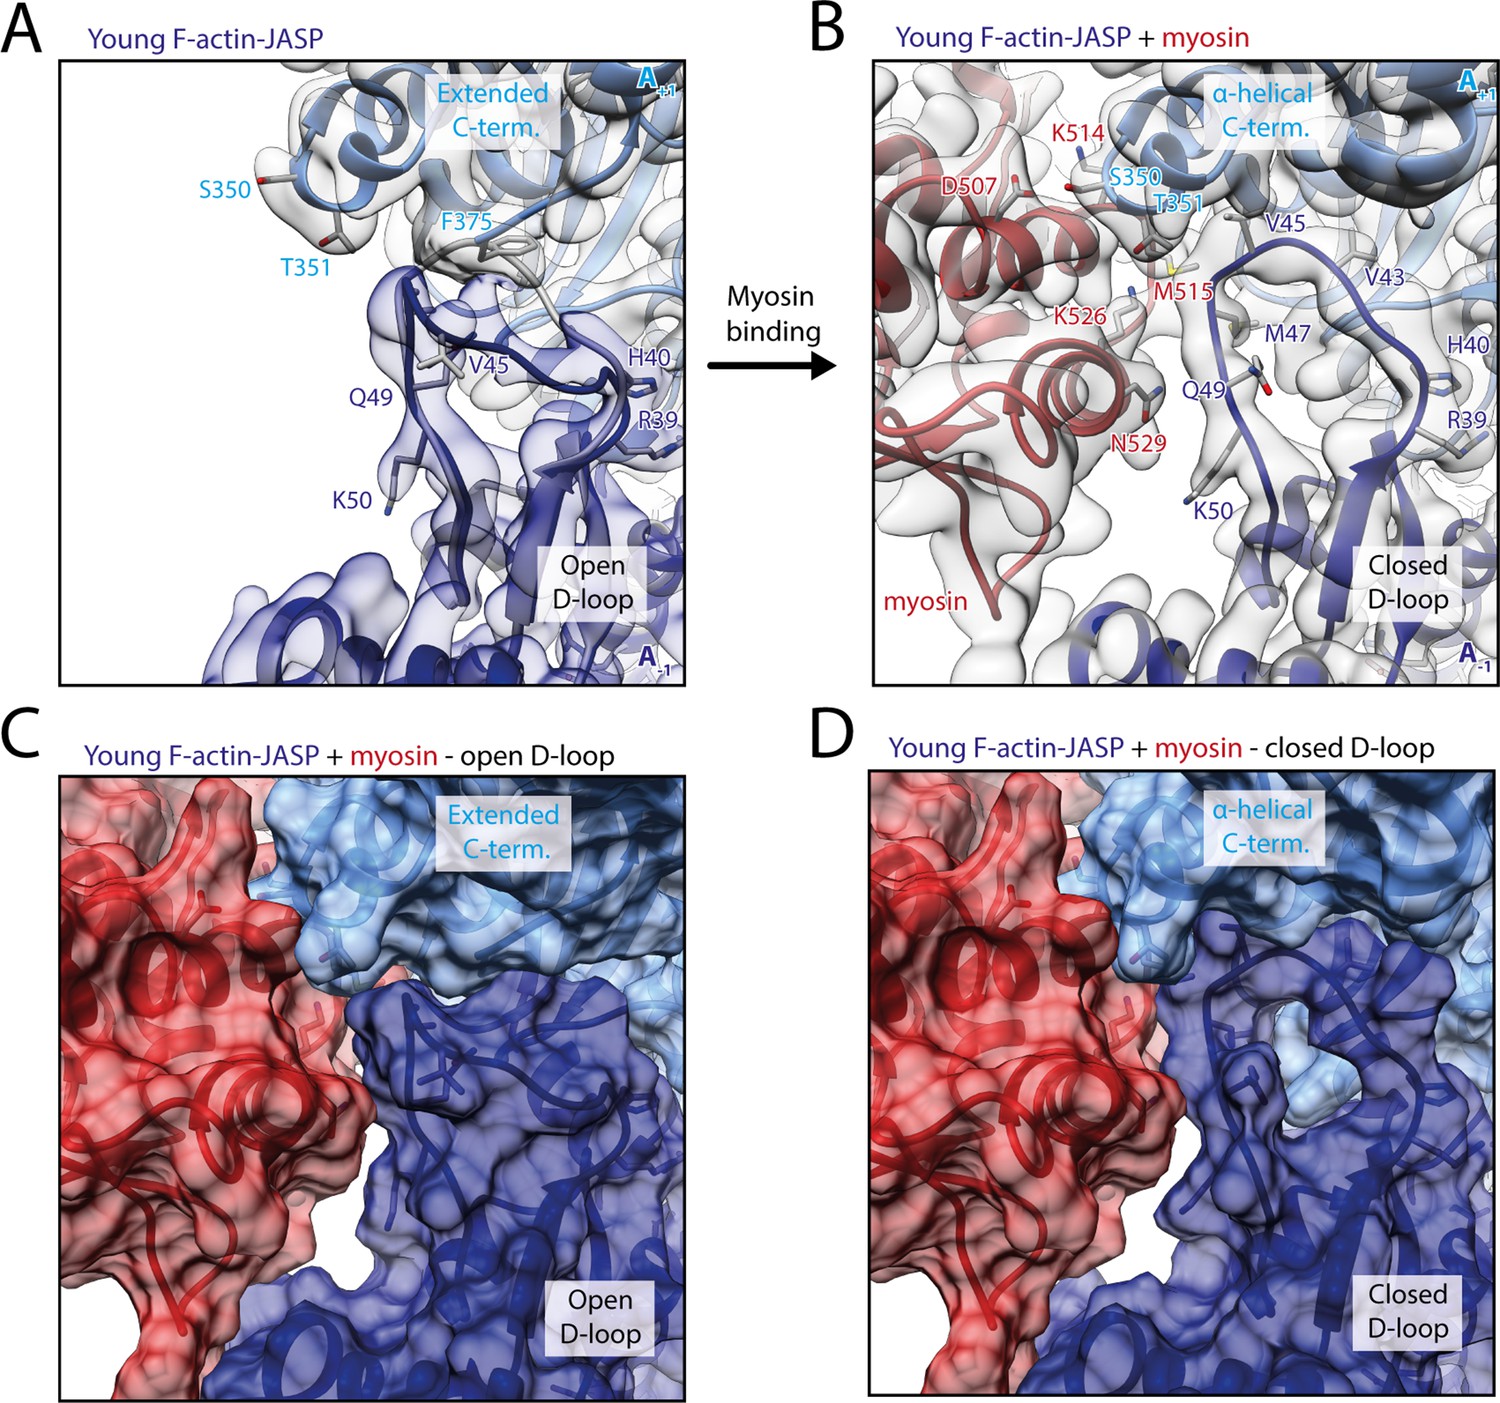
Myosin-V binding causes closure of the D-loop in young JASP-stabilized F-actin.
(A) Atomic model and LAFTER density map of young F-actin-JASP (shades of blue, subunits A-1 and A+1). Before myosin binding, the D-loop primarily adopts the open conformation and the C-terminus is extended. A superimposed atomic model (gray) highlights a minor density potentially corresponding to the closed D-loop conformation. (B) Binding of myosin-V in the rigor state (red) causes a structural transition to the closed D-loop conformation, which comes with an α-helical C-terminus; also see Figure 8—video 1 and Figure 8—figure supplement 1. (C) Surface representation of young F-actin-JASP (open D-loop, as shown in A) illustrating that the open D-loop conformation would not clash with myosin (computationally docked). (D) Surface representation of the young JASP-stabilized actomyosin complex (closed D-loop, as shown in B). See Figure 8—figure supplement 2 for an illustration how pyrene labeling might interfere with myosin binding.
Figure 8—figure supplement 1

Myosin-V selects a specific conformation of F-actin.
(A, B) Root mean square deviation (RMSD) of young F-actin-JASP before and after myosin binding illustrating a major but spatially confined rearrangement of the D-loop and C-terminus interface. (C, D) Root mean square deviation (RMSD) highlighting the remarkable similarity of myosin-bound aged F-actin-PHD and myosin-bound young F-actin-JASP. Subunits were aligned individually to account for errors in the calibration of the pixel size.
Figure 8—figure supplement 2

Pyrene labeling potentially impedes selection of the closed D-loop.
(A) Root mean square deviation (RMSD) of pyrene-labeled F-actin bound to ADP-Pi (PDB: 7K21; Chou and Pollard, 2020) and young F-actin-JASP in complex with myosin-V illustrating that differences primarily localize to the D-loop and C-terminus interface (black box). Subunits were aligned individually to account for errors in the calibration of the pixel size. (B) Close-up view of the D-loop C-terminus interface of pyrene-labeled F-actin bound to ADP-Pi (shades of green, PDB: 7K21; Chou and Pollard, 2020). Pyrene (magenta) wedges in-between the D-loop and C-terminus and thereby displaces the D-loop. In this way, pyrene likely interferes with myosin (transparent red) selecting the closed D-loop conformation (transparent gray).
Figure 8—video 1
Structural changes of JASP-stabilized F-actin upon binding of myosin-V.
(A–C) Overview of the structure of young F-actin-JASP. (A) Atomic model and LAFTER density map of the central three actin subunits (shades of blue, A-1 to A+1). The D-loop primarily adopts the open conformation typical for JASP-stabilized F-actin. Nucleotides and JASP are highlighted in orange and yellow, respectively. (B) Close-up view of the F-actin active site. There is clear density for an inorganic phosphate Pi, which is characteristic for young F-actin; also see Figure 1—figure supplement 3. (C) Model-map agreement within a central section of F-actin. Most side chains are resolved by the post-refined density map (transparent gray, also shown in B). (D) Animation schematically illustrating the closure of the D-loop upon binding of myosin-V in the rigor state (red, LC: white). (E) Close-up view showing the structural rearrangement of the D-loop C-terminus interface of young F-actin-JASP upon myosin binding. For guidance, myosin is shown as transparent in the unbound state. (F–H) Overview of the structure of the young actomyosin-V complex in the rigor state. (F) Atomic model and LAFTER density map of the central myosin-V-LC subunit bound to young F-actin-JASP. The D-loop solely adopts a closed conformation despite the presence of JASP (yellow). (G) Close-up view of the active site illustrating that myosin binding does not affect the nucleotide state of F-actin. (H) Model-map agreement within a central section of myosin. Most side chains are resolved within the post-refined density map (transparent gray, also shown in G). Note that the myosin-binding process is intentionally shown over-simplistically.
Figure 9 with 4 supplements
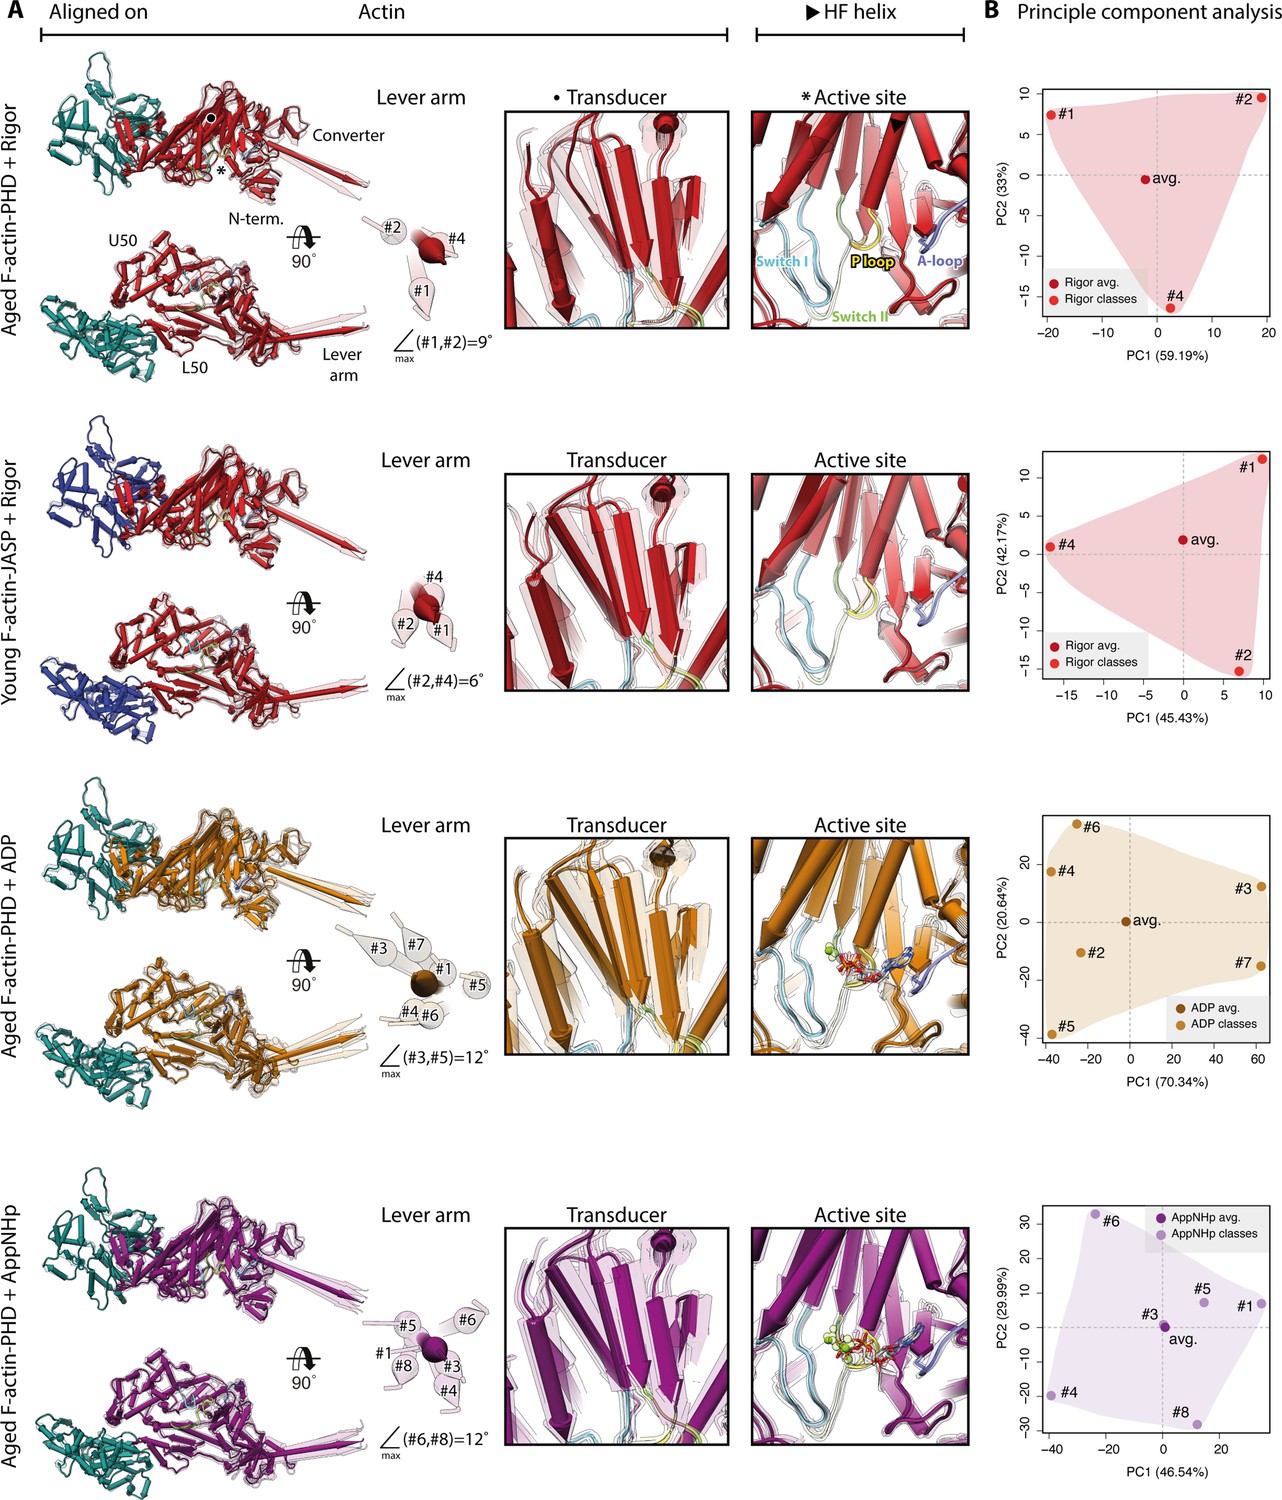
Conformational heterogeneity of myosin-V.
Illustration of the conformational heterogeneity of myosin-V in the rigor (red), strong-ADP (orange), and AppNHp-bound post-rigor transition (PRT) state (purple) when bound to F-actin (aged F-actin-PHD: sea green; young F-actin-JASP: blue). (A) Superposition of all atomic models (central 1er, average: opaque; 3D classes: transparent) built for each state. Models were either aligned on the F-actin subunit or the HF helix (indicated by black arrowhead). Pivoting of the U50 domain in combination with shifting and twisting of the central transducer β-sheet results in a rotation of the N-terminal and converter domain, giving rise to a two-dimensional distribution of lever arm orientations. The extent of these changes depends on the nucleotide state and is largest in the strong-ADP and PRT state. Insets show either the transducer β-sheet (black dot) or the active site (asterisk), which basically remains unchanged within all models of one state. (B) Mapping of atomic models (average and 3D classes) into the first two principal components of a principal component analysis (PCA) illustrating the overall conformational space covered. Classes are labeled by their number (#1–#8; also see Figure 1—figure supplement 1). For a comparison of conformational extremes, see Figure 9—figure supplement 1. Morphs of extremes and trajectories along the principal components are visualized in Figure 9—video 1, Figure 9—video 2, and Figure 9—video 3. See Figure 1—figure supplement 6 for an overview of the domain architecture of myosin.
Figure 9—figure supplement 1
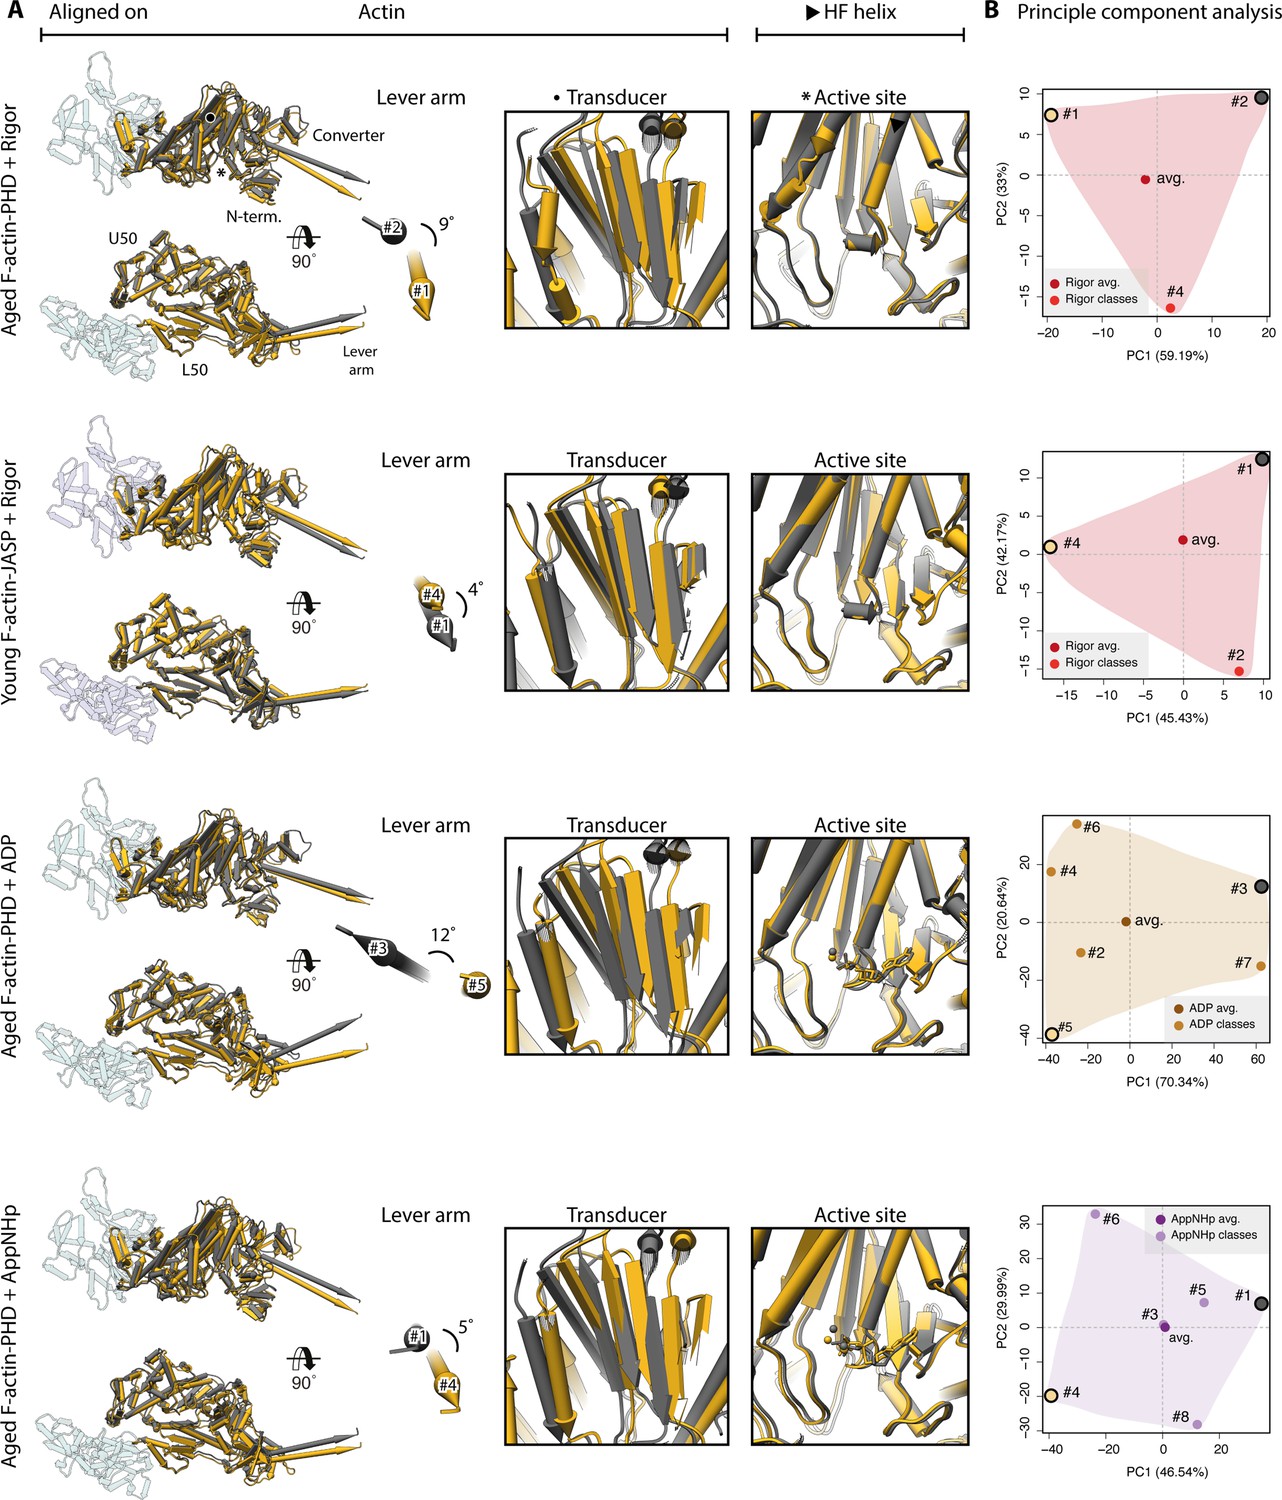
Extreme conformations of myosin-V.
Extreme conformations of myosin-V in the rigor, strong-ADP, and AppNHp-bound PRT state. (A) Superposition of atomic models as shown in Figure 9, but displaying only the extreme structures along the first principal component (yellow and gray). (B) Mapping of atomic models (average and 3D classes) into the first two principal components as shown in Figure 9. The localization of the extreme structures shown in (A) is highlighted by a yellow and gray dot, respectively.
Figure 9—video 1
Structural heterogeneity of myosin-V in the strong-ADP state.
(A, B) Three-dimensional visualization of the average structure of aged actomyosin-V in the strong-ADP state (myosin: orange; F-actin: sea green; PHD: yellow; LC: white). (C) Morph of 3D class average models illustrating the conformational heterogeneity of myosin (classes are ordered by their number; also see Figure 1—figure supplement 1). (D, E) Morph of extreme structures along the first (D) and second (E) principal components; also see Figure 9—figure supplement 1.
Figure 9—video 2
Structural heterogeneity of myosin-V in the rigor state.
(A, B) Three-dimensional visualization of the average structure of aged actomyosin-V in the rigor state (myosin: red; F-actin: sea green; PHD: yellow; LC: white). (C) Morph of 3D class average models illustrating the conformational heterogeneity of myosin (classes are ordered by their number; also see Figure 1—figure supplement 1). (D, E) Morph of extreme structures along the first (D) and second (E) principal components; also see Figure 9—figure supplement 1. (F, G) Three-dimensional visualization of the average structure of young actomyosin-V in the rigor state (myosin: red; F-actin: blue; JASP: yellow; LC: white). Morph of 3D class average models (H) and morph of extreme structures along the first (I) and second (J) principal components.
Figure 9—video 3
Structural heterogeneity of myosin-V in the post-rigor transition (PRT) state (AppNHp).
(A, B) Three-dimensional visualization of the average structure of aged actomyosin-V in the AppNHp-bound PRT state (myosin: purple; F-actin: sea green; PHD: yellow; LC: white). (C) Morph of 3D class average models illustrating the conformational heterogeneity of myosin (classes are ordered by their number; also see Figure 1—figure supplement 1). (D, E) Morph of extreme structures along the first (D) and second (E) principal components; also see Figure 9—figure supplement 1.
Figure 10 with 1 supplement

Principal component analysis of all myosin-V models.
Principal component analysis of all atomic models of the actomyosin-V complex, including average and 3D class average models of the strong-ADP, rigor, and post-rigor transition (PRT) state (central actomyosin subunit only). (A) Mapping of atomic models into the first and second as well as the second and third principal components. Data points are colored by the state of the actomyosin-V complex (aged rigor: red; aged strong-ADP: orange; aged AppNHp-bound PRT: purple; and young rigor: blue). Atomic models of average structures are shown as opaque, and models of 3D classes as transparent. The conformational space covered within each state is indicated by a correspondingly colored 2D polygon. (B) Superposition of all lever arm positions reflecting the relative mapping of individual conformational spaces. Changes along the first and third principal components are highlighted by black and gray arrows, respectively (extremes marked with asterisks). (C) Color-coded trajectories along the first, second, and third principal components (red minimum, blue maximum). Arrows indicate the mapped conformational changes. (D) Same views as in (C) but showing the extreme structures along each principal component; see Figure 9 for color code. For an animation of trajectories and morphs of the extreme structures, see Figure 10—video 1; and see Figure 1—figure supplement 6 for an overview of the domain architecture of myosin.
Figure 10—video 1
Structural heterogeneity of myosin-V: principal component analysis (PCA) of all atomic models.
Three-dimensional visualization of the trajectories and morphs of extreme structures along the first (A, B), second (C, D), and third (E, F) PC as identified in a PCA of all atomic models of the actomyosin-V complex. The localization of each model within the PC space is indicated for guidance. See Figure 10 for color code and an overview of PCA results.
Author response image 1

Author response image 2
Tables
Table 1
Data collection statistics of F-actin and actomyosin data sets.
Aged PHD-stabilized F-actin (F-actin-PHD) was decorated with myosin-V in the rigor (no nucleotide), strong-ADP (bound to Mg2+-ADP) and post-rigor transition (PRT) state (bound to Mg2+-AppNHp). Young JASP-stabilized F-actin (F-actin-JASP) was imaged in absence and presence of myosin-V in the rigor state. Refinement and model building statistics can be found in Table 2, Table 3, Table 4 and Table 6. See Figure 1—figure supplement 1 for an overview of the processing pipeline.
| Aged F-actin-PHD | Young F-actin-JASP | ||||||
|---|---|---|---|---|---|---|---|
| Microscopy | ADP | Rigor | AppNHp 4°C | AppNHp 25°C | AppNHp* | Actin only | Rigor |
| Microscope | Titan Krios – Cs 2.7 mm | Titan Krios – Cs-corrected | |||||
| Voltage (kV) | 300 | ||||||
| Camera | K2 – super resolution | ||||||
| Energy filter slit width (eV) | 20 | ||||||
| Pixel size (Å) | 1.06 | 1.10 | |||||
| Frames per movie | 40 | ||||||
| Exposure time (s) | 15 | ||||||
| Total electron dose (e/Å2) | 79 | 82 | 81 | 81 | 81 | 80 | 80 |
| Final electron dose (e/Å2) | Dose weighted | Polished particles | |||||
| Defocus range (µm) | 0.3–3.2 | 0.5–3.0 | 0.3–3.0 | 0.3–3.0 | 0.3–3.0 | 0.3–2.9 | 0.3–3.0 |
| Number of images† | 4571 (5908) | 2304 (3623) | 5858 (7121) | 6617 (7023) | 12,475 | 936 (1064) | 2970 (3336) |
-
*
Combined from two data sets (4°C and 25°C).
-
†
In parenthesis is the initial number of images.
Table 2
Statistics of aged actomyosin in the strong-ADP state.
Refinement and model building statistics of aged F-actin-PHD in complex with myosin-V in the strong-ADP state.
| Strong-ADP state: aged F-actin-PHD + myosin-Va-LC + Mg2+-ADP | ||||||||
|---|---|---|---|---|---|---|---|---|
| Central 3er/2er | Central 1er(subtracted) | Class 2 | Class 3 | Class 4 | Class 5 | Class 6 | Class 7 | |
| 3D refinement statistics | ||||||||
| Number of helical segments | 871,844 | 871,844 | 140,383 | 107,848 | 113,766 | 107,961 | 118,875 | 104,552 |
| Resolution (Å) | 3.0 | 3.1 | 3.5 | 3.5 | 3.7 | 3.6 | 3.6 | 3.7 |
| Map sharpeningfactor (Å2) | –60 | –60 | –78 | –78 | –94 | –86 | –83 | –88 |
| Atomic model statistics | ||||||||
| Non-hydrogen atoms | 23,334 | 10,171 | 10,149 | 10,149 | 10,086 | 10,066 | 10,113 | 10,139 |
| Cross-correlation masked | 0.85 | 0.83 | 0.83 | 0.83 | 0.80 | 0.82 | 0.83 | 0.80 |
| MolProbity score | 1.35 | 1.23 | 1.28 | 1.36 | 1.38 | 1.36 | 1.35 | 1.39 |
| Clashscore | 6.28 | 4.55 | 5.31 | 6.45 | 6.94 | 6.50 | 6.37 | 7.15 |
| EMRinger score* | 3.42/2.83 | 3.56/3.36 | 3.44/3.49 | 2.83/2.92 | 2.67/2.23 | 2.99/2.92 | 2.92/2.52 | 2.68/2.38 |
| Bond RMSD (Å) | 0.012 | 0.005 | 0.004 | 0.005 | 0.005 | 0.004 | 0.006 | 0.008 |
| Angle RMSD (°) | 1.07 | 0.83 | 0.85 | 0.89 | 0.92 | 0.88 | 0.93 | 1.06 |
| Rotamer outliers (%) | 0.04 | 0.09 | 0.09 | 0.09 | 0.09 | 0.09 | 0.09 | 0.09 |
| Ramachandranfavored (%) | 99.65 | 99.68 | 99.76 | 99.68 | 99.84 | 99.84 | 99.84 | 99.84 |
| Ramachandranoutliers (%) | 0.00 | 0.00 | 0.00 | 0.00 | 0.00 | 0.00 | 0.00 | 0.00 |
| CaBLAM outliers (%) | 0.7 | 0.9 | 1.1 | 1.3 | 1.2 | 1.0 | 0.8 | 1.4 |
-
*
Values correspond to score against the post-refined map used for real-space refinement/a map filtered to local resolution.
Table 3
Statistics of aged actomyosin in the rigor state.
Refinement and model building statistics of aged F-actin-PHD in complex with myosin-V in the rigor state.
| Rigor state: aged F-actin-PHD + myosin-Va-LC | |||||
|---|---|---|---|---|---|
| Central 3er/2er | Central 1er(subtracted) | Class 1 | Class 2 | Class 4 | |
| 3D refinement statistics | |||||
| Number of helical segments | 299,784 | 299,784 | 94,077 | 102,818 | 81,757 |
| Resolution (Å) | 3.2 | 3.3 | 3.5 | 3.5 | 3.6 |
| Map sharpening factor (Å2) | –81 | –80 | –89 | –89 | –87 |
| Atomic model statistics | |||||
| Non-hydrogen atoms | 23,288 | 10,148 | 10,139 | 10,139 | 10,139 |
| Cross-correlation masked | 0.83 | 0.86 | 0.83 | 0.82 | 0.81 |
| MolProbity score | 1.28 | 1.18 | 1.24 | 1.25 | 1.31 |
| Clashscore | 5.25 | 3.97 | 4.66 | 4.81 | 5.75 |
| EMRinger score* | 3.14/3.39 | 3.41/3.10 | 2.97/3.00 | 3.53/3.00 | 3.01/3.06 |
| Bond RMSD (Å) | 0.005 | 0.014 | 0.005 | 0.005 | 0.005 |
| Angle RMSD (°) | 0.84 | 1.14 | 0.80 | 0.84 | 0.82 |
| Rotamer outliers (%) | 0.04 | 0.00 | 0.00 | 0.00 | 0.00 |
| Ramachandran favored (%) | 99.86 | 99.84 | 99.60 | 99.76 | 99.76 |
| Ramachandran outliers (%) | 0.00 | 0.00 | 0.00 | 0.00 | 0.00 |
| CaBLAM outliers (%) | 0.8 | 0.9 | 0.9 | 0.9 | 0.8 |
-
*
Values correspond to score against the post-refined map used for real-space refinement/a map filtered to local resolution.
Table 4
Statistics of aged actomyosin in the post-rigor transition (PRT) state.
Refinement and model building statistics of aged F-actin-PHD in complex with myosin-V in the PRT state (bound to AppNHp).
| Post-rigor transition state: aged F-actin-PHD + myosin-Va-LC + Mg2+-AppNHp | ||||||||
|---|---|---|---|---|---|---|---|---|
| Central 3er/2er | Central 1er(subtracted) | Class 1 | Class 3 | Class 4 | Class 5 | Class 6 | Class 8 | |
| 3D refinement statistics | ||||||||
| Number of helical segments | 2,446,218 | 2,446,218 | 330,197 | 365,722 | 350,069 | 321,218 | 277,487 | 343,500 |
| Resolution (Å) | 2.9 | 2.9 | 3.4 | 3.3 | 3.4 | 3.3 | 3.4 | 3.3 |
| Map sharpening factor (Å2) | –80 | –100 | –113 | –106 | –114 | –106 | –111 | –104 |
| Atomic model statistics | ||||||||
| Non-hydrogen atoms | 23,370 | 10,189 | 10,125 | 10,189 | 10,154 | 10,189 | 10,085 | 10,189 |
| Cross-correlation masked | 0.85 | 0.84 | 0.84 | 0.86 | 0.85 | 0.85 | 0.83 | 0.84 |
| MolProbity score | 1.25 | 1.15 | 1.17 | 1.24 | 1.20 | 1.26 | 1.37 | 1.18 |
| Clashscore | 4.76 | 3.56 | 3.78 | 4.64 | 4.12 | 4.99 | 6.74 | 3.95 |
| EMRinger score* | 3.29/3.45 | 3.82/3.40 | 3.35/3.07 | 3.58/3.45 | 3.18/3.35 | 2.94/2.97 | 3.01/3.01 | 3.09/2.88 |
| Bond RMSD (Å) | 0.004 | 0.012 | 0.009 | 0.014 | 0.009 | 0.014 | 0.009 | 0.005 |
| Angle RMSD (°) | 0.78 | 1.01 | 0.96 | 1.15 | 0.97 | 1.14 | 1.08 | 0.81 |
| Rotamer outliers (%) | 0.08 | 0.09 | 0.09 | 0.09 | 0.09 | 0.09 | 0.09 | 0.09 |
| Ramachandran favored (%) | 99.86 | 99.84 | 99.84 | 99.84 | 99.84 | 99.84 | 99.84 | 99.84 |
| Ramachandran outliers (%) | 0.00 | 0.00 | 0.00 | 0.00 | 0.00 | 0.00 | 0.00 | 0.00 |
| CaBLAM outliers (%) | 1.1 | 1.2 | 1.1 | 1.1 | 1.2 | 1.2 | 1.4 | 0.7 |
-
*
Values correspond to score against the post-refined map used for real-space refinement/a map filtered to local resolution.
Table 5
Summary of helical symmetry parameters.
Overview of helical symmetry parameters of aged PHD-stabilized and young JASP-stabilized actomyosin-V complexes. For a direct comparison, the parameters of aged F-actin-PHD (PDB: 6T20; Pospich et al., 2020) and young F-actin-JASP (PDB: 5OOD; Merino et al., 2018) are shown alongside. Differences in both the helical rise and twist can be readily explained by errors of the pixel size, which is not identical for all data sets. Helical parameters were estimated from the atomic model of five consecutive subunits independently fitted into the map; see Pospich et al., 2017 for details. To make results more comparable, only actin subunits were considered during fitting. Note that fitting inaccuracies can also give rise to small deviations.
| Rise (Å) | Twist (°) | Pixel size (Å) | |
|---|---|---|---|
| Helical symmetry | |||
| Aged F-actin-PHD+ rigor | 27.82±0.02 | –167.27±0.02 | 1.06 |
| Aged F-actin-PHD+ ADP | 27.81±0.02 | –167.32±0.02 | 1.06 |
| Aged F-actin-PHD+ AppNHp | 27.77±0.02 | –167.32±0.02 | 1.10 |
| Aged F-actin-PHD (PDB: 6T20) | 27.59±0.02 | –166.9±0.1 | 1.14 |
| Young F-actin-JASP | 27.85±0.08 | –166.87±0.02 | 1.10 |
| Young F-actin-JASP+ Rigor | 27.72±0.01 | –167.06±0.02 | 1.10 |
| Young F-actin-JASP (PDB: 5OOD) | 27.39 | –166.41 | 1.09 |
Table 6
Statistics of young actomyosin in the rigor state.
Refinement and model building statistics of young F-actin-JASP alone and in complex with myosin-V in the rigor state.
| Young F-actin-JASP | Rigor state: young F-actin-JASP + myosin-Va-LC | |||||
|---|---|---|---|---|---|---|
| Actin only3er/2er | Central 3er/2er | Central 1er(subtracted) | Class 1 | Class 2 | Class 4 | |
| 3D refinement statistics | ||||||
| Number of helical segments | 212,660 | 414,148 | 414,148 | 110,797 | 107,022 | 107,174 |
| Resolution (Å) | 3.1 | 3.2 | 3.2 | 3.6 | 3.5 | 3.6 |
| Map sharpening factor (Å2) | –56 | –83 | –50 | –55 | –49 | –54 |
| Atomic model statistics | ||||||
| Non-hydrogen atoms | 8940 | 23,278 | 10,149 | 10,169 | 10,169 | 10,156 |
| Cross-correlation masked | 0.81 | 0.84 | 0.83 | 0.84 | 0.83 | 0.83 |
| MolProbity score | 1.27 | 1.29 | 1.15 | 1.24 | 1.26 | 1.23 |
| Clashscore | 5.11 | 5.46 | 3.62 | 4.66 | 4.91 | 4.57 |
| EMRinger score* | 3.11/3.08 | 2.92/2.66 | 3.11/2.92 | 2.89/2.96 | 2.99/3.39 | 2.88/2.55 |
| Bond RMSD (Å) | 0.004 | 0.004 | 0.009 | 0.005 | 0.003 | 0.004 |
| Angle RMSD (°) | 0.915 | 0.780 | 0.950 | 0.836 | 0.807 | 0.835 |
| Rotamer outliers (%) | 0.00 | 0.00 | 0.00 | 0.00 | 0.00 | 0.00 |
| Ramachandran favored (%) | 100.00 | 99.86 | 99.84 | 99.84 | 99.84 | 99.84 |
| Ramachandran outliers (%) | 0.00 | 0.00 | 0.00 | 0.00 | 0.00 | 0.00 |
| CaBLAM outliers (%) | 0.27 | 0.75 | 0.90 | 0.81 | 0.65 | 0.49 |
-
*
Values correspond to score against the post-refined map used for real-space refinement/a map filtered to local resolution.
Key resources table
| Reagent type (species) or resource | Designation | Source or reference | Identifiers | Additional information |
|---|---|---|---|---|
| Gene (Gallus gallus) | MYO5A | De La Cruz et al., 1999 | Uniprot ID:Q02440 | Unconventional myosin-Va |
| Gene (Homo sapiens) | MYL6B (MLC1SA) | De La Cruz et al., 1999 | Uniprot ID:P14649 | Myosin light chain 6B/myosin LC 1 – slow-twitch muscle A isoform |
| Cell line (Spodoptera frugiperda) | SF9 cells | De La Cruz et al., 1999 | Insect cells, for baculovirus expression | |
| Biological sample (Oryctolagus cuniculus) | Rabbit skeletal muscle acetone powder | Gift from W. Linke and A. Unger (Ruhr-Universität Bochum, Germany) | N/A | For purification of α-actin (Uniprot ID:P68135) |
| Recombinant DNA reagent | pVL1392 pVL1393(plasmids) | De La Cruz et al., 1999 | Invitrogen, V1392-20 | |
| Chemical compound, drug | Phalloidin (PHD)Amanita phalloides | Sigma-Aldrich | P2141 | For stabilization of aged ADP-bound F-actin |
| Chemical compound, drug | Jasplakinolide (JASP) | Sigma-Aldrich | J4580 | For stabilization of young ADP-Pi-bound F-actin |
| Chemical compound, drug | AppNHp (AMPPNP) | Jena Bioscience | NU-407-10 | |
| Chemical compound, drug | ADP | Sigma-Aldrich | A2754 | |
| Software, algorithm | TranSPHIRE | Stabrin et al., 2020; PMID:33177513 | v1.4–1.5.7 | |
| Software, algorithm | MotionCor2 | Zheng et al., 2017; PMID:28250466 | v1.1.0; v1.3.0; v1.2.6 | Within TranSPHIRE |
| Software, algorithm | GCTF | Zhang, 2016; PMID:26592709 | v1.06 | Within TranSPHIRE |
| Software, algorithm | crYOLO | Wagner et al., 2020; PMID:32627734 | v1.2.2; v1.2.4; v1.4.1 | Within TranSPHIRE |
| Software, algorithm | GPU-ISAC | Stabrin et al., 2020; PMID:33177513 | v1.2 and earlier | Within TranSPHIRE |
| Software, algorithm | Cinderella | Stabrin et al., 2020; PMID:33177513 | v0.3.1 | Within TranSPHIRE |
| Software, algorithm | SPHIRE | Moriya et al., 2017; PMID:28570515 | v1.3 | Helical processing pipeline, including CTF refinement and signal subtraction |
| Software, algorithm | Relion | Scheres, 2012; PMID:23000701 | v3.0.4 | For particle polishing and 3D classifications |
| Software, algorithm | UCSF Chimera | Pettersen et al., 2004; PMID:15264254 | v1.15 | |
| Software, algorithm | UCSF ChimeraX | Goddard et al., 2018; PMID:28710774 | v0.91 | For model building with ISOLDE |
| Software, algorithm | ISOLDE | Croll, 2018; PMID:29872003 | v1.0b4 | |
| Software, algorithm | Coot | Emsley et al., 2010; PMID:20383002 | v0.8.9.2 | |
| Software, algorithm | Phenix | Adams et al., 2011; Afonine et al., 2018; PMID:18094468 | v1.17.1 | |
| Software, algorithm | elBOW | Moriarty et al., 2009; PMID:19770504 | v1.17.1 | Within Phenix |
| Software, algorithm | MolProbity | Chen et al., 2010; PMID:20057044 | v1.17.1 | Within Phenix |
| Software, algorithm | EMRinger | Barad et al., 2015; PMID:26280328 | v1.17.1 | Within Phenix |
| Software, algorithm | LAFTER | Ramlaul et al., 2019; PMID:30502495 | v1.1 | |
| Software, algorithm | Bio3d | Grant et al., 2006; PMID:32734663 | v2.3-4 | Library for PCA in R |
| Software, algorithm | DynDom | Hayward and Lee, 2002; PMID:12463636;http://dyndom.cmp.uea.ac.uk | Accessed October 2020 | |
| Software, algorithm | PDBsum | Laskowski et al., 2018; PMID:28875543;https://www.ebi.ac.uk/pdbsum/ | Accessed November 2020 | |
| Other | Cryo-EM grids | Quantifoil (QF) | R2/1 300 mesh |
Additional files
Download links
A two-part list of links to download the article, or parts of the article, in various formats.
Downloads (link to download the article as PDF)
Open citations (links to open the citations from this article in various online reference manager services)
Cite this article (links to download the citations from this article in formats compatible with various reference manager tools)
High-resolution structures of the actomyosin-V complex in three nucleotide states provide insights into the force generation mechanism
eLife 10:e73724.
https://doi.org/10.7554/eLife.73724


