Chemogenetics defines a short-chain fatty acid receptor gut–brain axis
- Centre for Translational Pharmacology, Institute of Molecular, Cell and Systems Biology, College of Medical, Veterinary and Life Sciences, University of Glasgow, United Kingdom
- Discovery Sciences, Biopharmaceutical R&D, AstraZeneca, Sweden
- Institute of Neuroscience and Psychology, College of Medical, Veterinary and Life Sciences, University of Glasgow, United Kingdom
- Department of Drug Design and Pharmacology, University of Copenhagen, Universitetsparken, Denmark
Figures
Figure 1 with 3 supplements
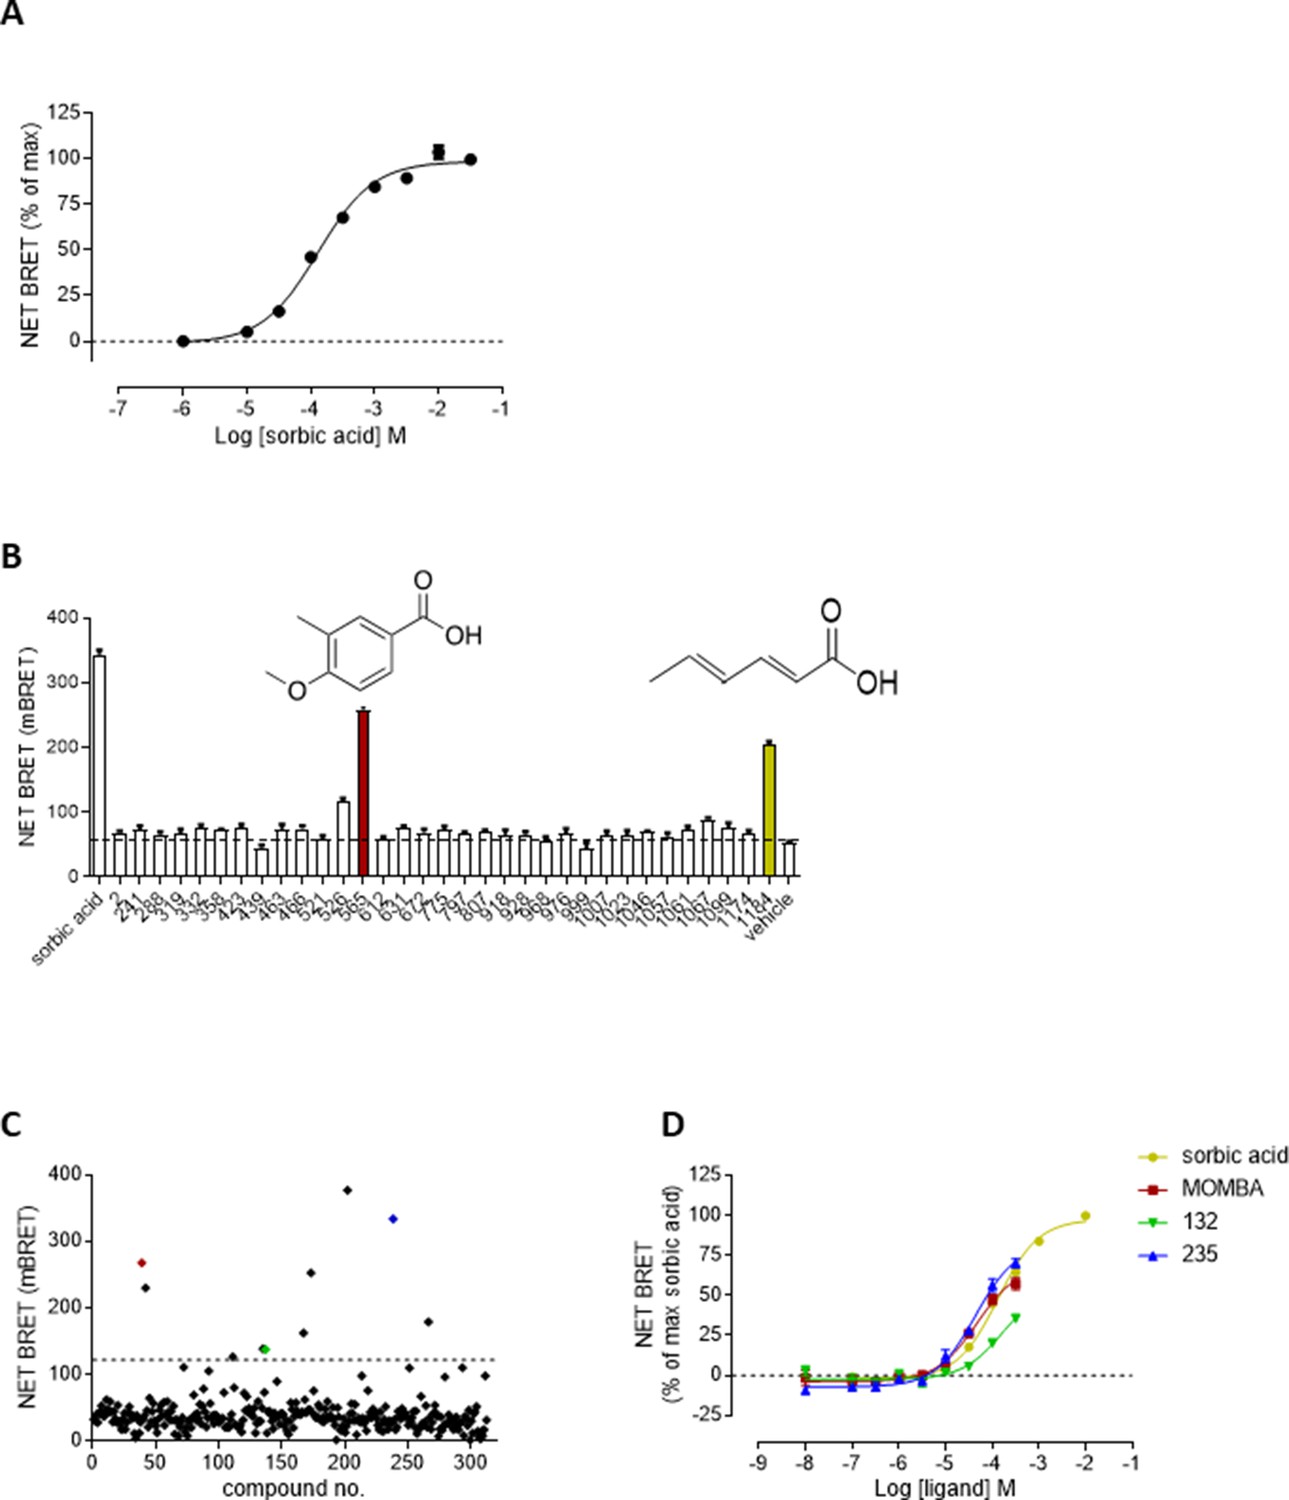
Screening for novel agonists of hFFA2-DREADD identifies 4-methoxy-3-methyl-benzoic acid (MOMBA) (A).
HEK293 cells were transiently transfected to express both hFFA2-DREADD-eYFP and β-arrestin-2-Renilla-luciferase. Addition of sorbic acid-promoted interactions between these proteins in a concentration-dependent manner. Data are means ± standard error of the mean (SEM) of triplicates from a single experiment, representative of 6. (B) A subset of the positives from the initial screen (see Figure 1—figure supplement 1) were retested at 100 µM. Compounds 565 (MOMBA) (red bar) and 1184 (sorbic acid) (yellow bar) are highlighted. Dotted line indicates basal signal. Data are from a single experiment with results plotted as mean ± SEM of triplicate assays. (C) A further 320 compounds selected on similarity to hits from Figure 1—figure supplement 1A were selected and screened at 100 µM in single point assays: As well as MOMBA (red) two of these were 4-methoxy-3-chloro-benzoic acid (compound 132) (green) and 4-methoxy-3-hydroxy-benzoic acid (compound 235) (blue). Dotted line indicates selection cutoff. Data are from a single experiment. (D) Concentration dependence of selected hits from C to activate hFFA2-DREADD is displayed. MOMBA (red), compound 132 (green), and compound 235 (blue). Sorbic acid (yellow) is shown as reference.
-
Figure 1—source data 1
NET bioluminescence resonance energy transfer (BRET) measurements for Figure 1.
- https://cdn.elifesciences.org/articles/73777/elife-73777-fig1-data1-v1.xlsx
Figure 1—figure supplement 1
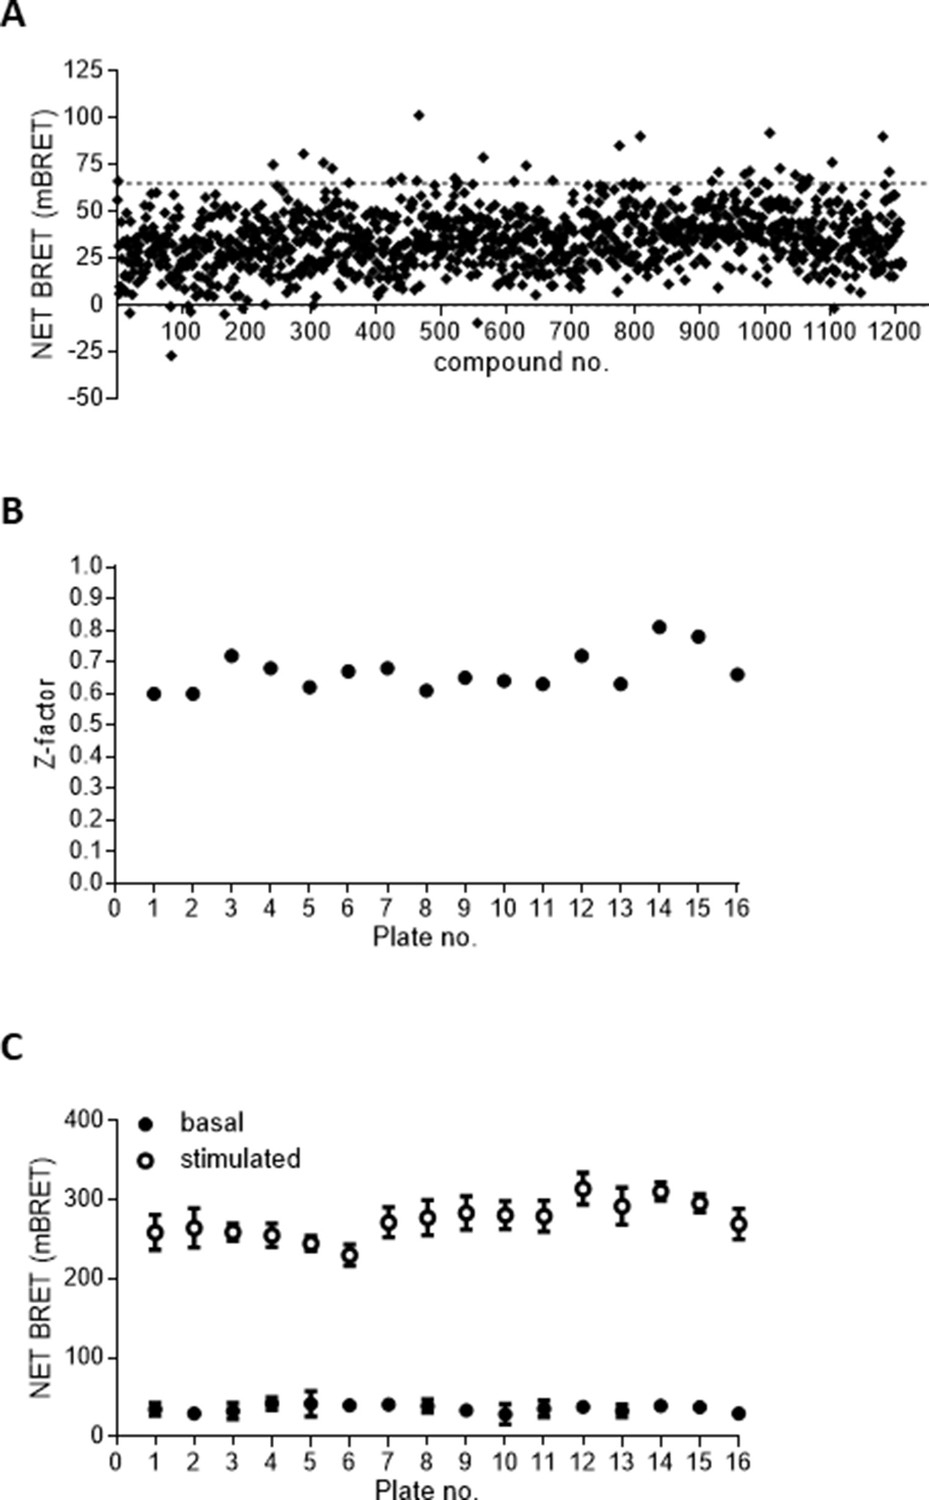
Development of a screening assay to identify novel hFFA2-DREADD activators.
(A) Screening of 1210 compounds at 100 µM in a hFFA2-DREADD–β-arrestin-2 interaction assay identified various potential hits in a single point assay. Data are presented as Net milliBRET. The dotted line represents mean + 3 standard deviation (SD). (B) The Z′ factor (Zhang et al., 1999) of assay robustness was calculated across individual 96-well microtitre plates of compounds screened in (A, C). Signal to background across the assay format was assessed by spiking four wells of each plate with 100 µM sorbic acid (open symbols) as a positive control and comparing this with a vehicle control (filled symbols). Data are means ± standard error of the mean (SEM).
-
Figure 1—figure supplement 1—source data 1
NET bioluminescence resonance energy transfer (BRET) measurements for Figure 1—figure supplement 1.
- https://cdn.elifesciences.org/articles/73777/elife-73777-fig1-figsupp1-data1-v1.xlsx
Figure 1—figure supplement 2
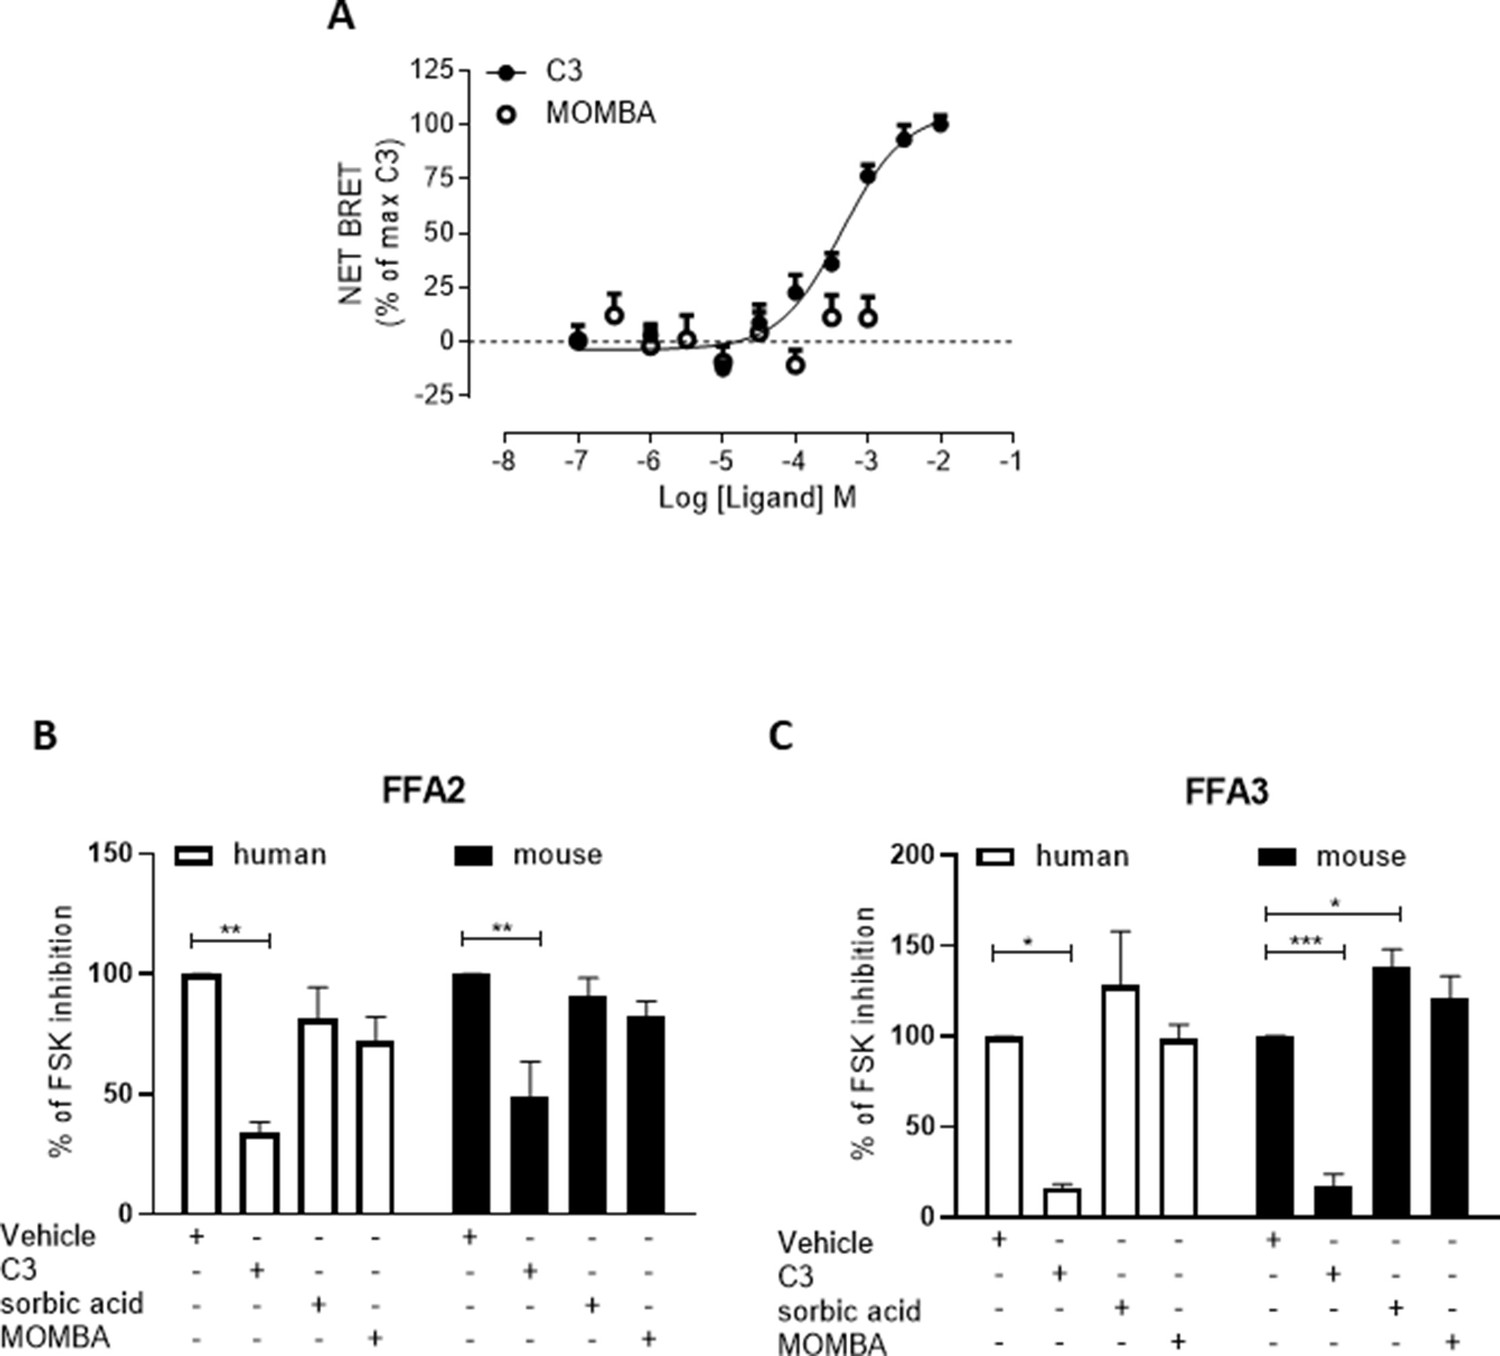
4-Methoxy-3-methyl-benzoic acid (MOMBA) is a selective agonist at hFFA2-DREADD.
(A) The ability of varying concentrations of C3 (filled symbols) or MOMBA (open symbols) to promote interactions between wild-type human FFA2 and β-arrestin-2 was assessed in a bioluminescence resonance energy transfer (BRET)-based assay. Data are means ± standard error of the mean (SEM) from three separate experiments. (B) The ability of a single concentration of C3 (1 mM), sorbic acid (1 mM), and MOMBA (100 µM) to inhibit forskolin-stimulated levels of cAMP in Flp-In T-REx 293 cells induced to express either human (open bars) or mouse (filled bars) FFA2-eYFP was compared to vehicle. Data are means ± SEM. n = 3, **p < 0.01, one-way analysis of variance followed by Dunnett’s Multiple Comparison Test. (C) Studies equivalent to B were performed in Flp-In T-REx 293 cells induced to express either human (open bars) or mouse (filled bars) FFA3. Data are means ± SEM. n = 3, *p < 0.05, ***p < 0.001, one-way analysis of variance followed by Dunnett’s Multiple Comparison Test.
-
Figure 1—figure supplement 2—source data 1
NET bioluminescence resonance energy transfer (BRET) and percentage forskolin inhibition for Figure 1—figure supplement 2.
- https://cdn.elifesciences.org/articles/73777/elife-73777-fig1-figsupp2-data1-v1.xlsx
Figure 1—figure supplement 3
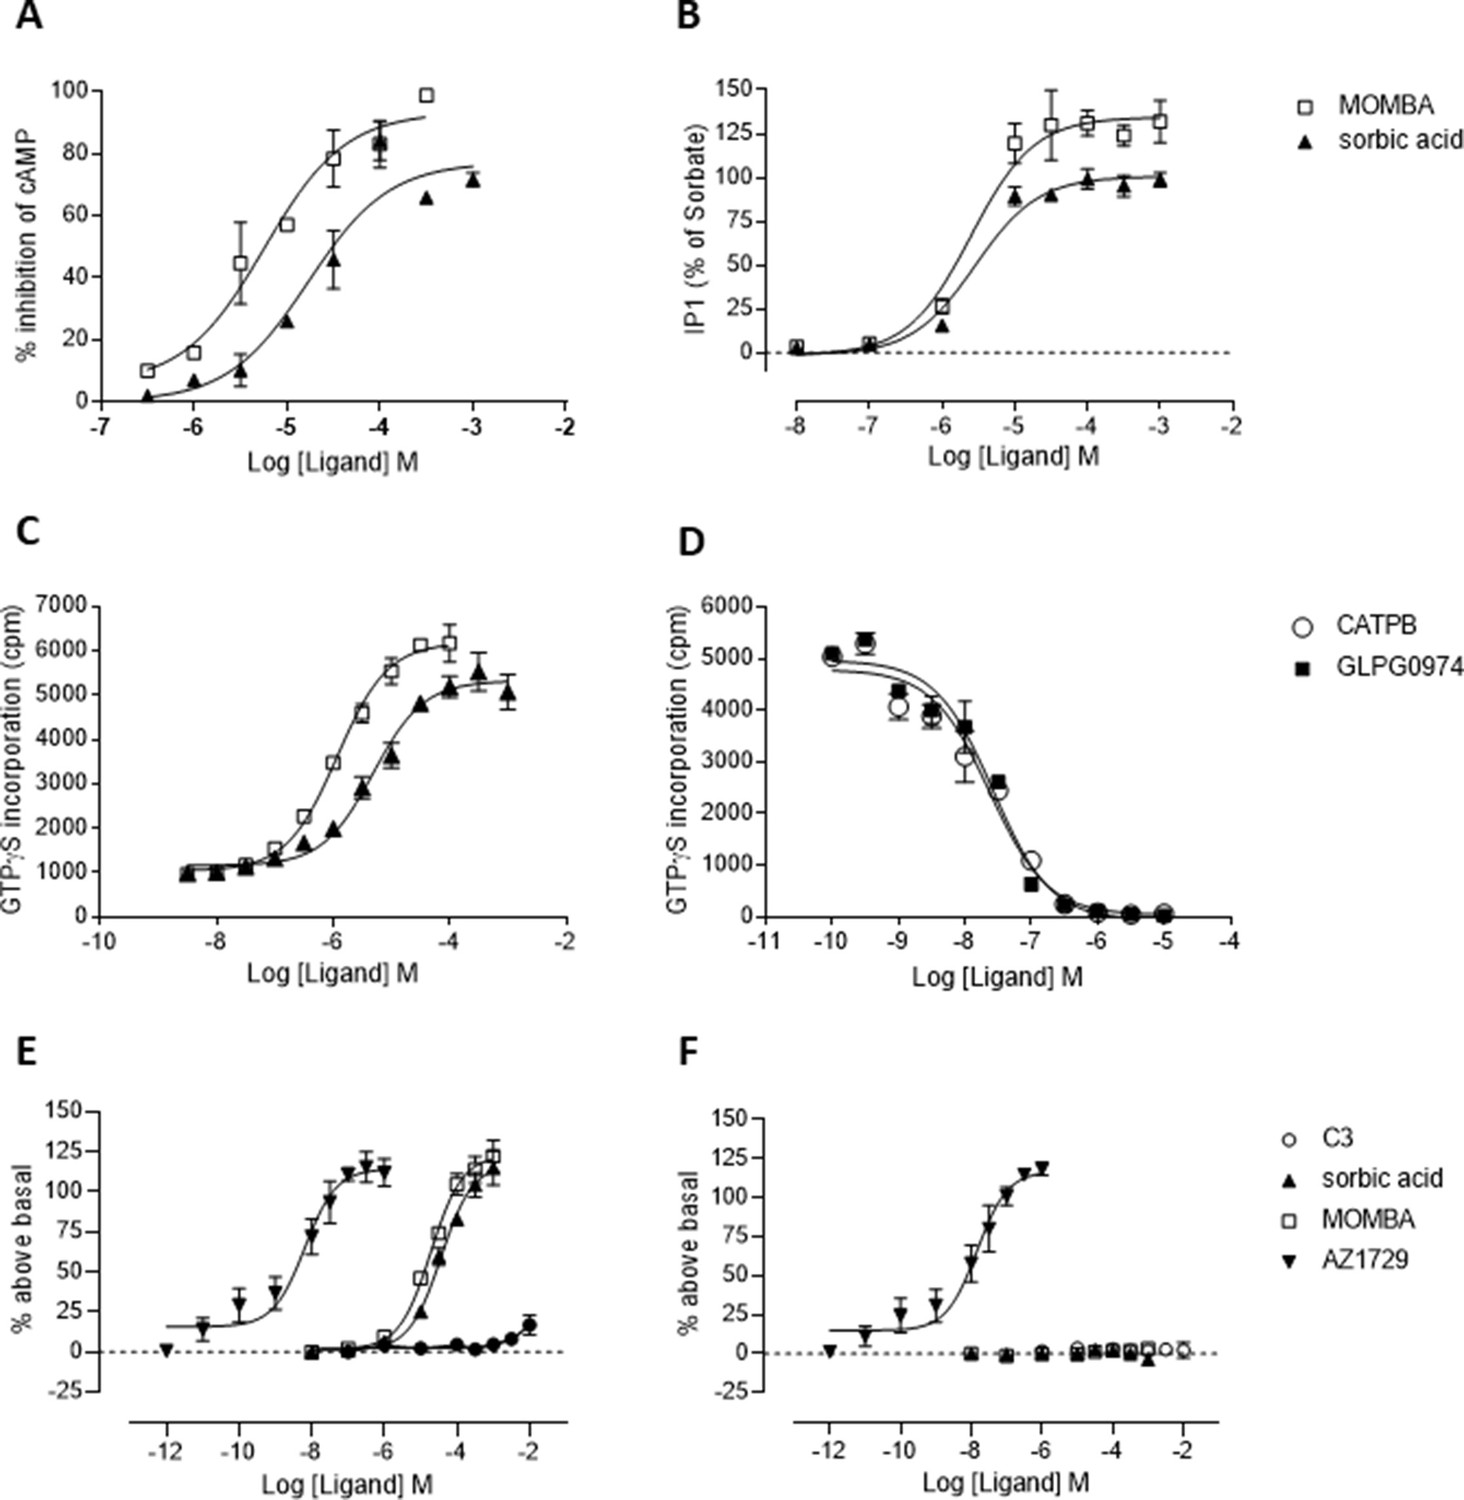
4-Methoxy-3-methyl-benzoic acid (MOMBA) is an effective and more potent orthosteric agonist of hFFA2-DREADD than sorbic acid.
(A) The ability of varying concentrations of either MOMBA (open symbols) or sorbic acid (closed symbols) to inhibit forskolin-stimulated cAMP levels was assessed in cells induced to express hFFA2-DREADD. (B) The ability of varying concentrations of either MOMBA (open symbols) or sorbic acid (closed symbols) to promote production of inositol monophosphates in cells induced to express hFFA2-DREADD is shown. (C) Membrane preparations of cells induced to express hFFA2-DREADD were used to assess the ability of MOMBA (open symbols) or sorbic acid (closed symbols) to promote binding of [35S]GTPγS. (D) The capacity of varying concentrations of either CATPB (open symbols) or GLPG0974 (filled symbols) to inhibit binding of [35S]GTPγS induced by an EC80 concentration of MOMBA was assessed. (E) Each of AZ1729 (Bolognini et al., 2016a), MOMBA and sorbic acid, but not C3, were able to stimulate binding of [35S]GTPγS in membranes of cells expressing hFFA2-DREADD. (F) By contrast only AZ1729, but not MOMBA, sorbic acid or C3, was able to activate an orthosteric (Arg180Ala) binding site mutant of hFFA2-DREADD in a [35S]GTPγS-binding assay.
-
Figure 1—figure supplement 3—source data 1
cAMP levels, production of inositol monophosphates and binding of [35S]GTPγS for Figure 1—figure supplement 3.
- https://cdn.elifesciences.org/articles/73777/elife-73777-fig1-figsupp3-data1-v1.xlsx
Figure 2 with 1 supplement
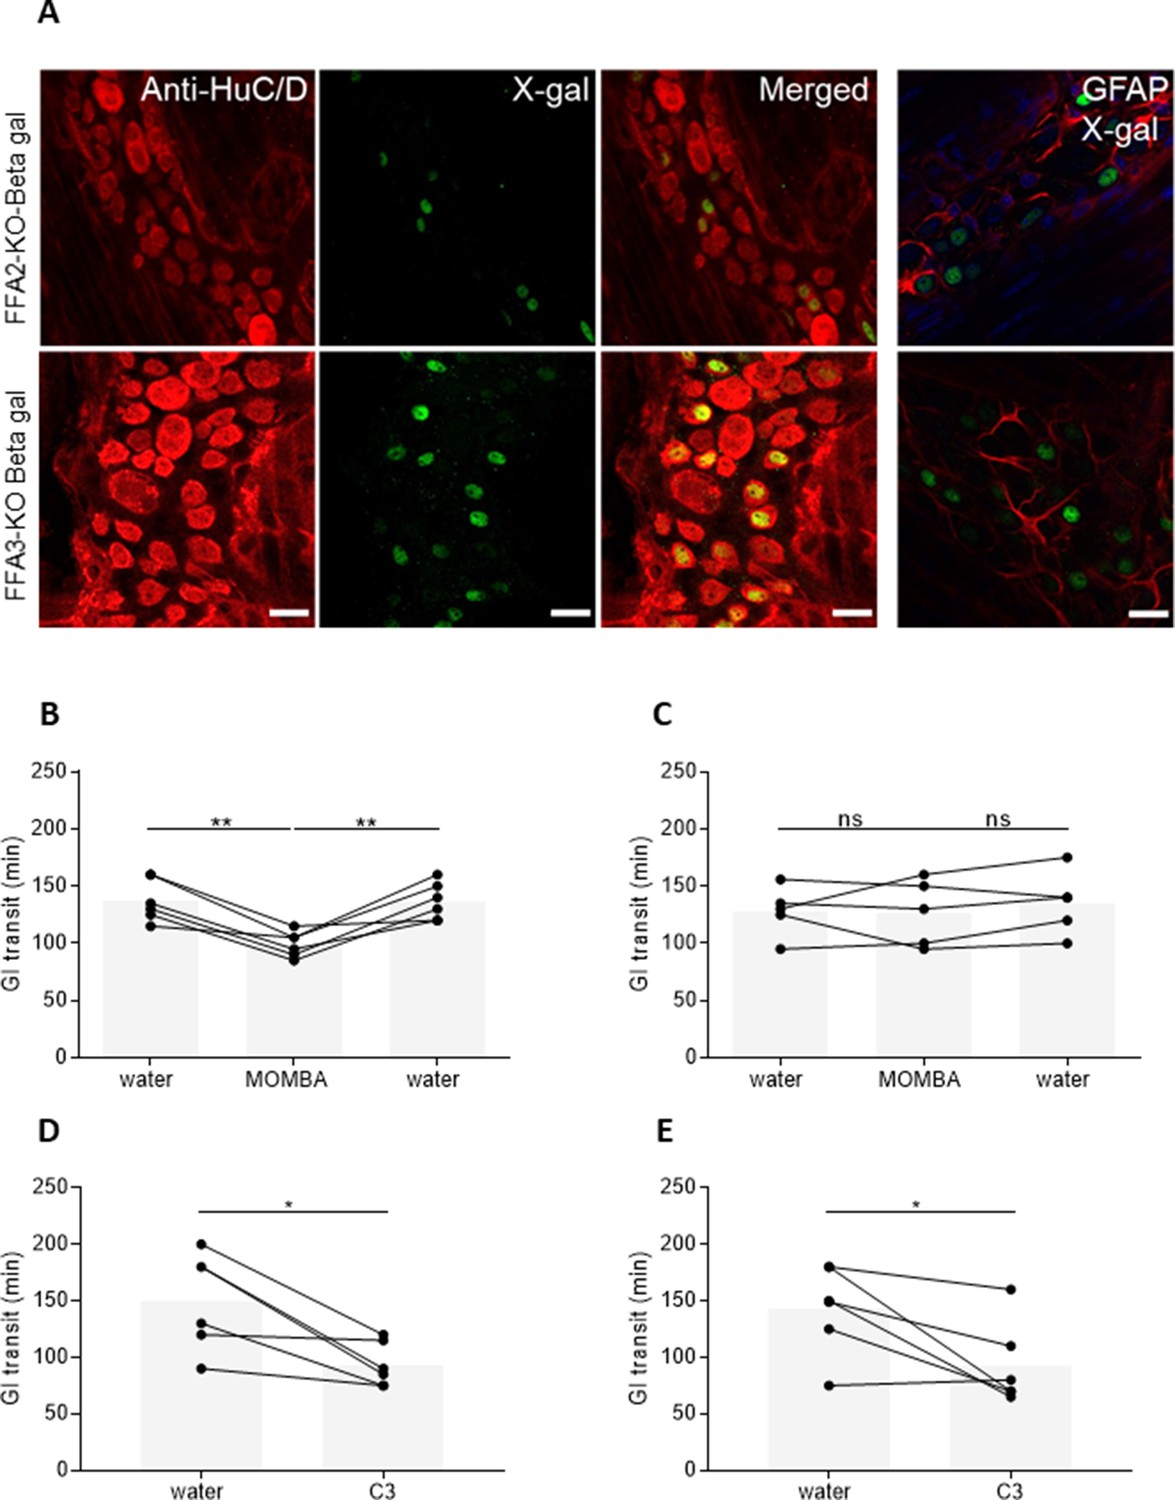
Both FFA2 and FFA3 are expressed in myenteric neurons and promote increased gut transit.
(A) Myenteric plexus dissected from mice expressing a β-galactosidase reporter gene, driven by the Ffar2 (upper panel) or Ffar3 (lower panel) gene promoter sequences were immunostained with anti-HuC/D to identify enteric neurons (left-hand panels, red) and with X-gal to identify receptor-expressing cells (second panels, green). Merged images (third panels) showed coexpression. Myenteric plexus immunostained with X-gal and Glial Fibrillary Acidic Protein (GFAP) to identify enteric glia did not show any coexpression (right-hand panels). Blue: staining with 4′,6-diamidino-2-phenylindole (DAPI) to identify cell nuclei. Scale bar = 20 µm. Male hFFA2-DREADD-HA (B), CRE-MINUS (C), FFA2-KO-βGAL (D), or FFA3-KO-βGAL (E) mice were acclimatized for 7 days with free access to drinking water. Individual animals were then gavaged with carmine red and total GI transit time measured. Following the initial transit studies, mice were provided with 4-methoxy-3-methyl-benzoic acid (MOMBA) (15 mM) or C3 (150 mM) in the drinking water as indicated. After a further 7 days GI transit of all mice was again measured. MOMBA was then removed and the mice were again provided with water followed by a further gavage with carmine red 7 days later. Data are for individual animals (*p < 0.05, **p < 0.01, ns = not significant). One-way analysis of variance followed by Bonferroni’s Multiple Comparison Test.
-
Figure 2—source data 1
GI transit measurements for Figure 2.
- https://cdn.elifesciences.org/articles/73777/elife-73777-fig2-data1-v1.xlsx
Figure 2—figure supplement 1
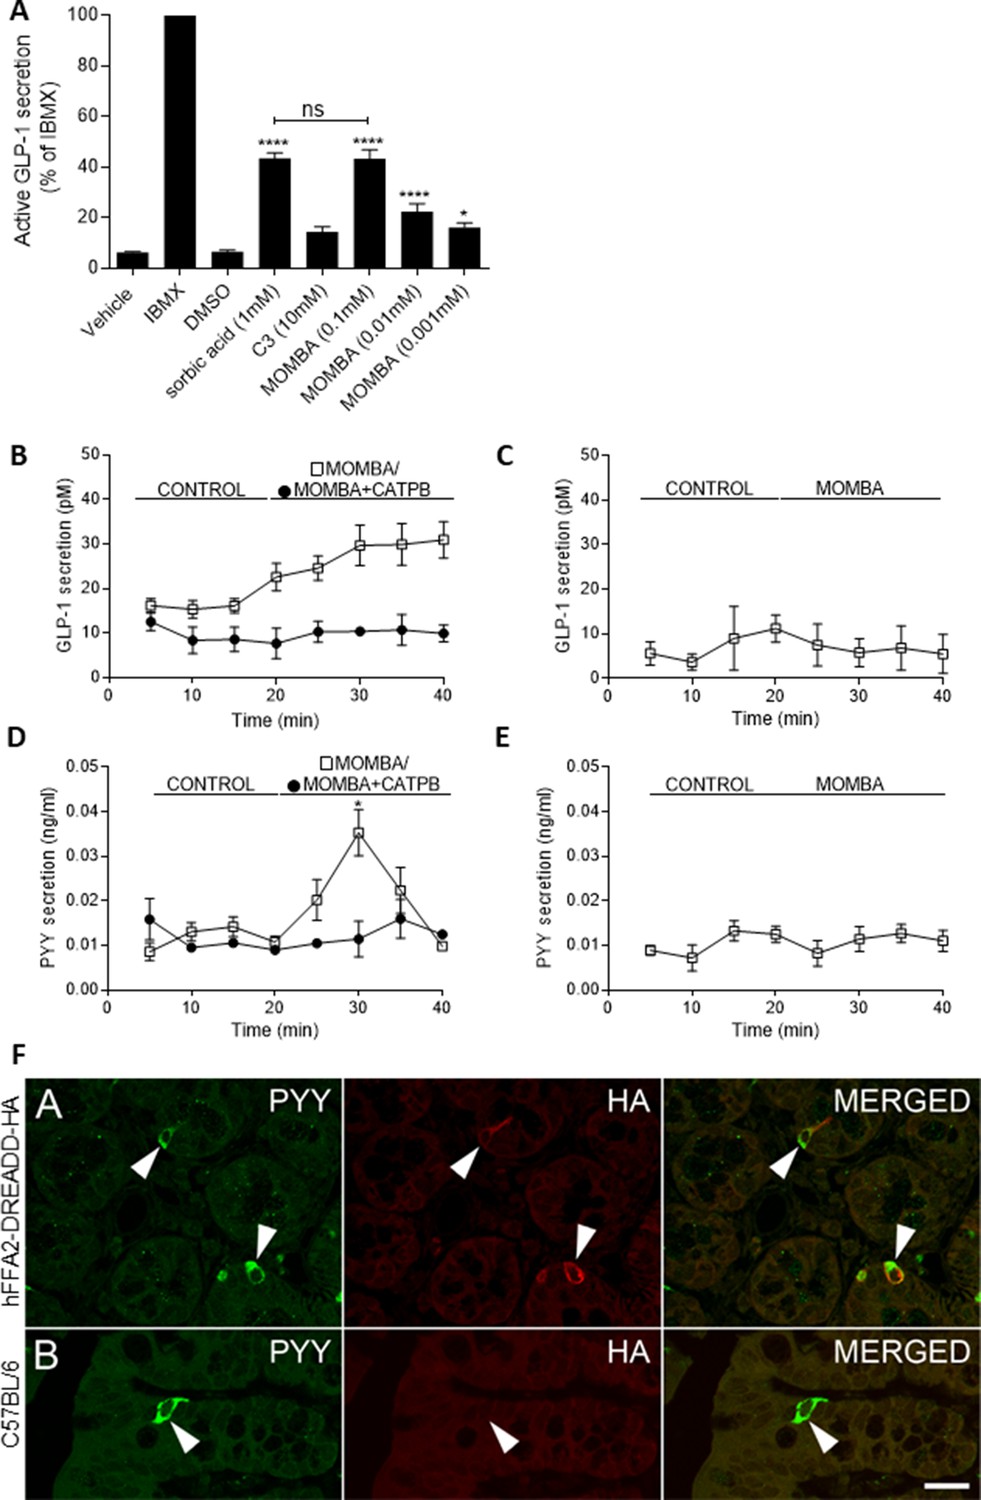
4-Methoxy-3-methyl-benzoic acid (MOMBA) promotes release of GLP-1 and peptide YY (PYY) in colonic preparations from hFFA2-DREADD-HA-expressing mice.
(A) Colonic crypt-containing preparations were isolated from hFFA2-DREADD-HA-expressing mice. MOMBA-promoted release of GLP-1 in a concentration-dependent fashion (*p < 0.05, ****p < 0.0001) whilst C3 did not. At maximally effective concentrations MOMBA was as effective as sorbic acid (ns = not significantly different). Isobutylmethylxanthine (IBMX) (100 µM) provided a positive control for release of GLP-1. Data represent means ± standard error of the mean (SEM) from five different preparations, One-way analysis of variance followed by Bonferroni’s Multiple Comparison Test. (B) MOMBA (open symbols) promoted sustained release of GLP-1 release from colonic tissue of hFFA2-DREADD-HA-expressing mice and this was prevented by coexposure to CATPB (closed symbols). Data represent means ± SEM from four different preparations (***p < 0.001, unpaired t-test). (C) MOMBA did not promote release of GLP-1 from colonic tissue obtained from CRE-MINUS animals. Data represent means ± SEM from four different preparations. Following a period of flow of buffer (control) into colonic tubes from hFFA2-DREADD-HA (D) or CRE-MINUS (E) animals introduction of MOMBA (open symbols)-promoted transient PYY release from tissue of hFFA2-DREADD-HA-expressing mice (*p < 0.05, unpaired t-test) but not from CRE-MINUS animals. In tissue from hFFA2-DREADD-HA mice effect of MOMBA was prevented by coexposure to CATPB (filled symbols). Data represent means ± SEM from four (D) or five (E) different preparations. (F) Immunostaining of colonic sections from hFFA2-DREADD-HA (top panels) or wild-type C57BL/6 (bottom panels) with either anti-PYY (green, left) or anti-HA (red, middle) identified subsets of PYY-expressing cells that were also positive for the hFFA2-DREADD-HA receptor. Chevrons highlight exemplar cells that were positive for PYY and HA or PYY only. Scale bar = 20 µm.
-
Figure 2—figure supplement 1—source data 1
GLP-1 and peptide YY (PYY) secretion for Figure 2—figure supplement 1.
- https://cdn.elifesciences.org/articles/73777/elife-73777-fig2-figsupp1-data1-v1.xlsx
Figure 3
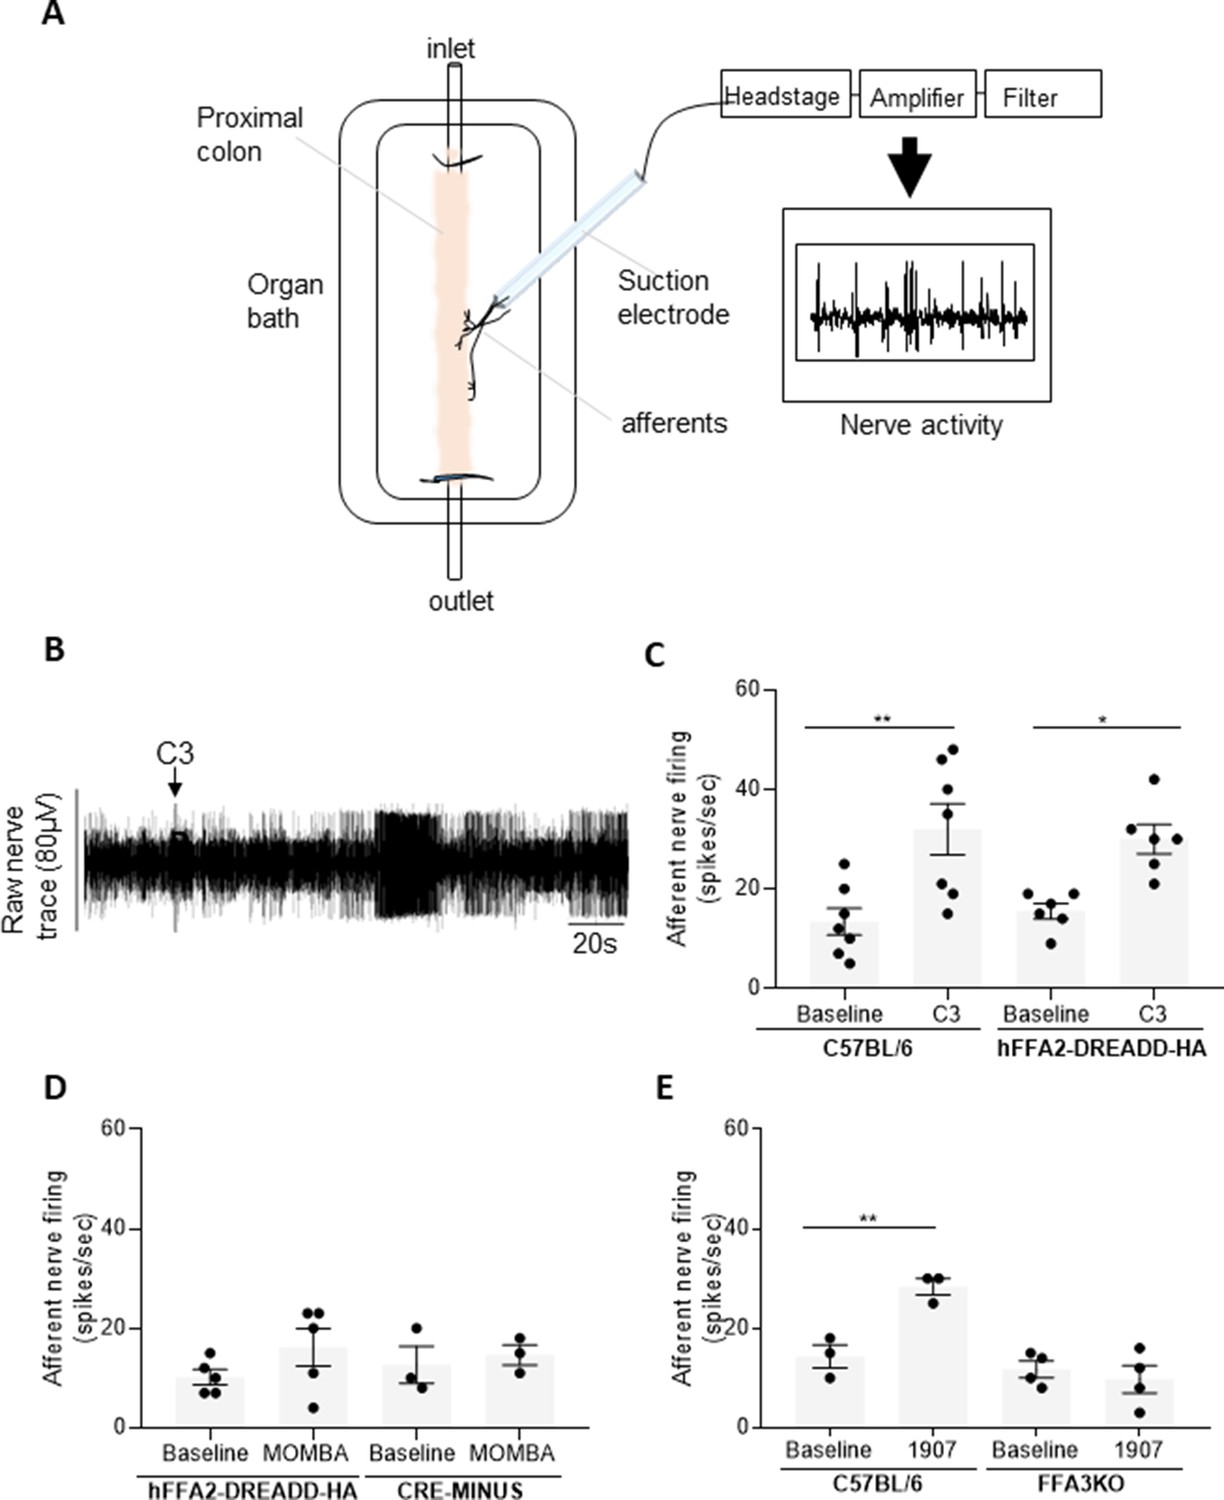
Colonic SCFAs promote firing of afferents via FFA3 (A).
A schematic illustration of the ex vivo proximal colon preparation. The proximal colon is superfused in the recording chamber and is cannulated at both ends. Intraluminal infusion is achieved using a syringe pump (100 µl/min). A nerve branch is dissected and inserted into a suction electrode and recording is made using neurolog and Spike software. (B) A representative trace of the colonic afferent nerve signal counting individual spikes above a preset threshold (spikes/s). Introduction of C3 is highlighted. (C) The ability of C3 to promote afferent nerve activity was compared to buffer (baseline) in segments of the proximal colon taken from either wild-type C57BL/6 or hFFA2-DREADD-HA-expressing mice. C3 increased nerve firing in both preparations (**p < 0.01 and *p < 0.05, one-way analysis of variance followed by Bonferroni’s Multiple Comparison Test). (D) Similar studies were performed with 4-methoxy-3-methyl-benzoic acid (MOMBA) using tissue from either hFFA2-DREADD-HA or CRE-MINUS mice. No significant effect of MOMBA was detected (one-way analysis of variance followed by Bonferroni’s Multiple Comparison Test). (E) TUG-1907 (3 µM) was able to increase nerve activity in tissue from C57BL/6 but not in tissue taken from FFA3-KO-βGAL mice (**p < 0.01, one-way analysis of variance followed by Bonferroni’s Multiple Comparison Test). Figure 3—source data 1.
-
Figure 3—source data 1
Multiunit nerve activity for Figure 3.
- https://cdn.elifesciences.org/articles/73777/elife-73777-fig3-data1-v1.xlsx
Figure 4 with 1 supplement
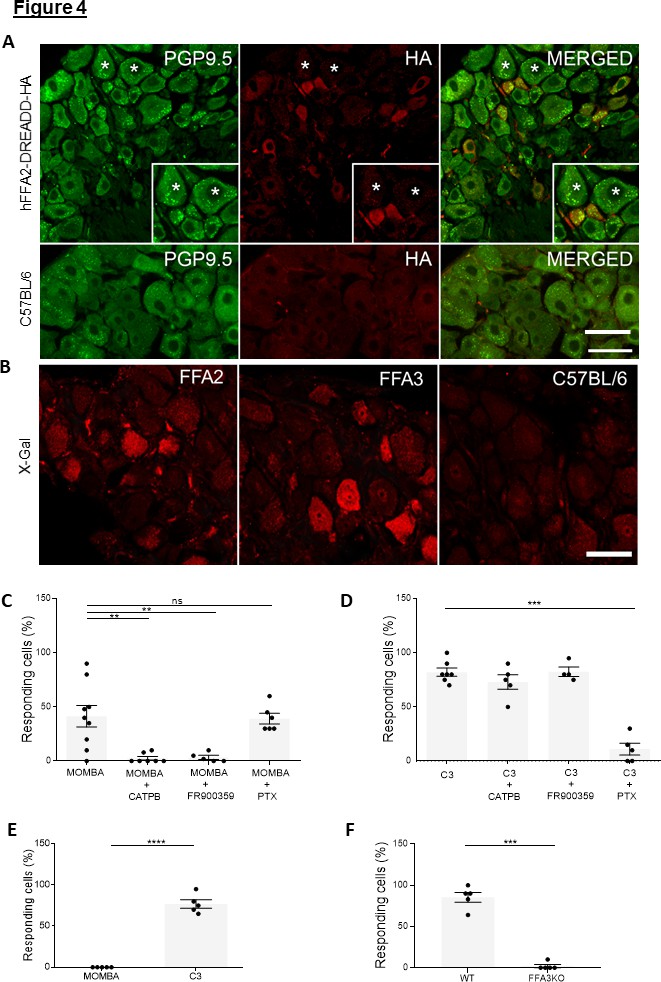
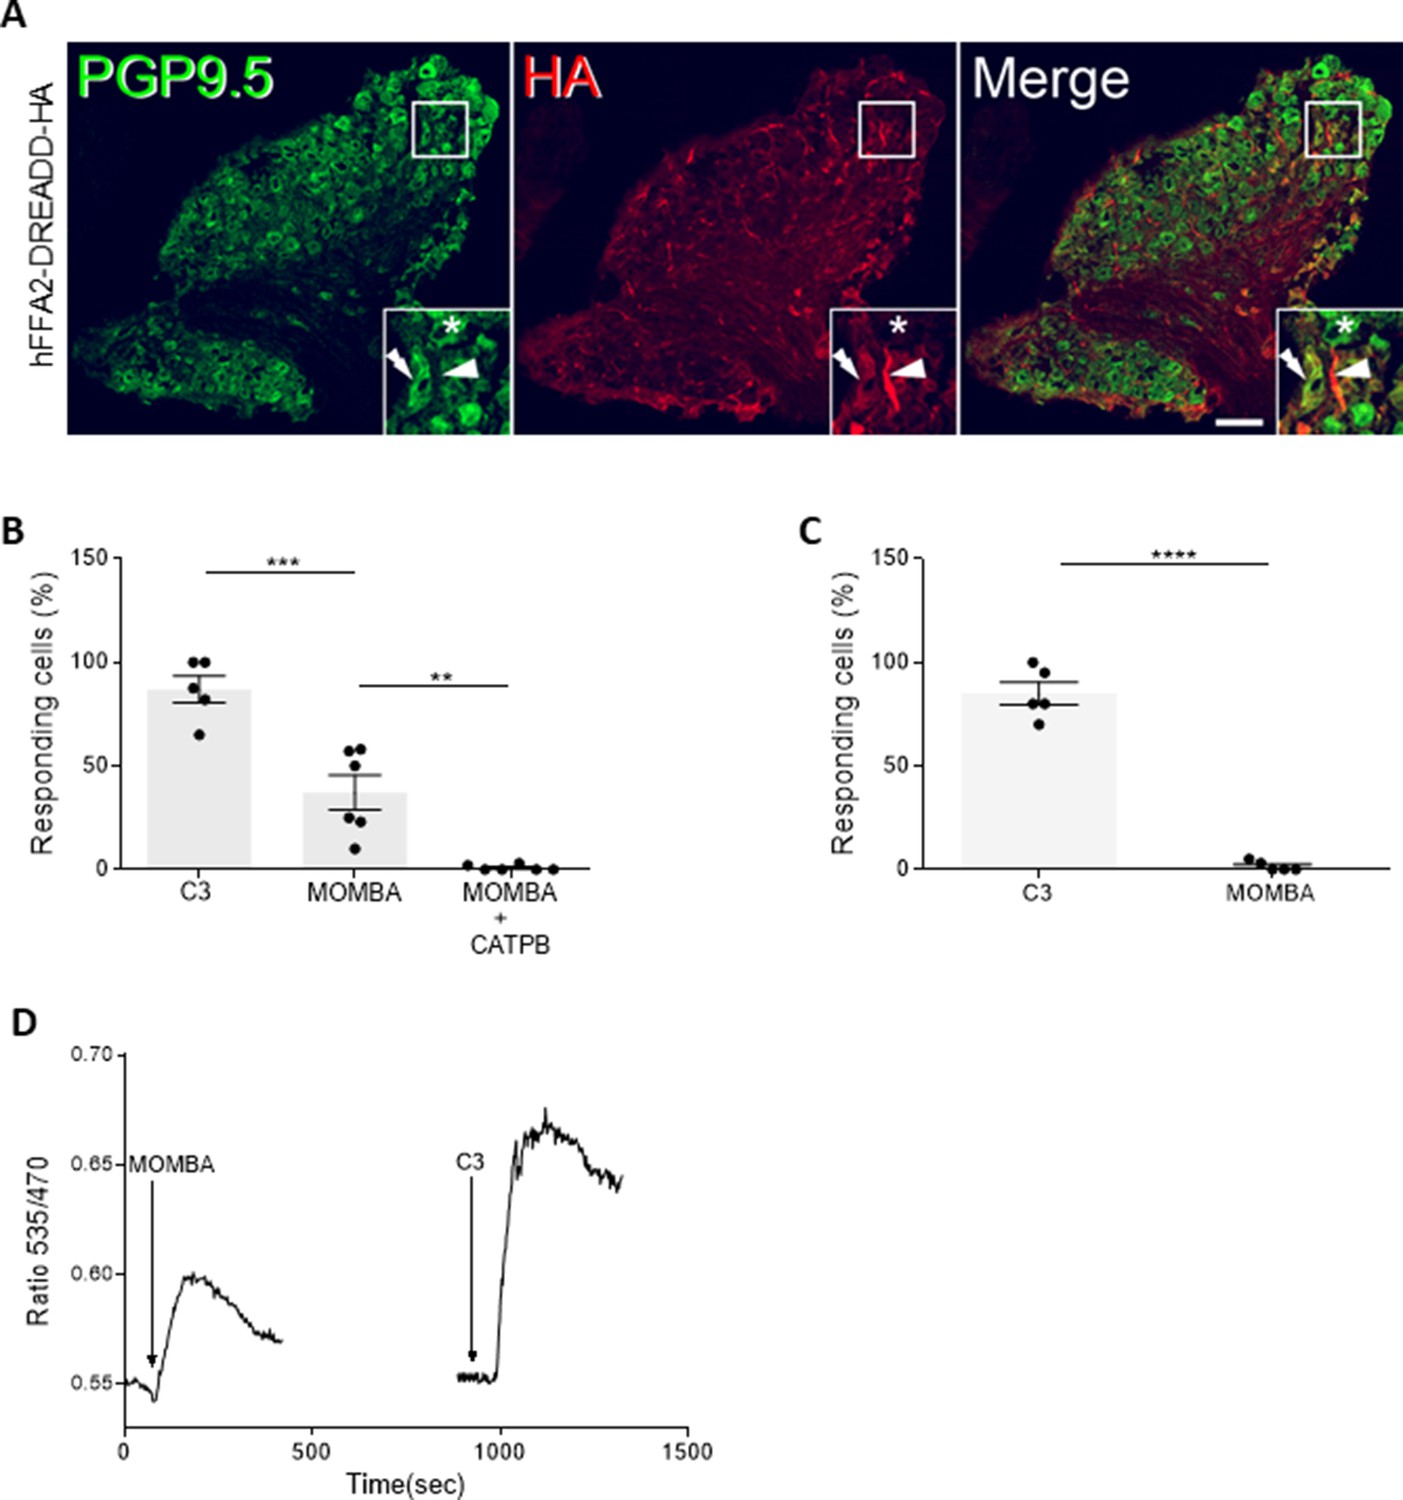
Both FFA2-DREADD-HA and FFA3 are expressed and functional in cells of dorsal root ganglia: the two G-protein-coupled receptors (GPCRs) elevate Ca2+ by different mechanisms (A).
Sections of dorsal root ganglia taken from hFFA2-DREADD-HA-expressing mice were immunostained with anti-PGP9.5 to identify neurons (left-hand panel, green) and with anti-HA to detect the receptor (middle panel, red). Merging of such images (right-hand panel) showed modest coexpression (see main text for quantification) but with additional anti-HA staining interspersed between neurons. Inserts: focus on regions in which individual cells express PGP9.5 but not HA (star), express HA reactivity but not PGP9.5 (chevron), or coexpress both PGP9.5 and hFFA2-DREADD-HA (double arrow). (B) Fluorescent X-gal staining (red) of dorsal root ganglia (DRG) sections isolated from mice expressing β-galactosidase reporter gene, which is driven either by the Ffar2 (left-hand panel) or Ffar3 gene promoters (middle panel). DRG sections from wild-type mice were also immunostained with X-gal (right-hand panel). Scale bar = 20 µm. (C, D) Single-cell Ca2+ imaging studies were performed on cells isolated from DRGs taken from hFFA2-DREADD-HA-expressing mice. Cells were exposed to 4-methoxy-3-methyl-benzoic acid (MOMBA) (C) or C3 (D). In various examples cells were pre-treated CATPB, with the Gq/G11 inhibitor FR900359 (15 min) or pertussis toxin (24 hr) prior to addition of agonist. CATPB blocked the effect of MOMBA (**p < 0.01) but not C3. FR900359 also blocked the effect of MOMBA (**p < 0.01) but not C3, whilst pertussis toxin treatment blocked the effect of C3 (***p < 0.001) but not MOMBA. One-way analysis of variance followed by Bonferroni’s Multiple Comparison Test. Pertussis toxin treatment blocked the effect of C3 (***p < 0.001) but not MOMBA. One-way analysis of variance followed by Bonferroni’s Multiple Comparison Test. (E) Cells dispersed from DRGs isolated from CRE-MINUS mice were used to assess the ability of ligands to elevate Ca2+. No effect of MOMBA was recorded whilst C3 was effective in most of the cells tested (****p <0.0001, unpaired t-test). (F) TUG-1907 (3 µM) was able to elevate Ca2+ levels in DRG cells from wild type but not FFA3-knockout mice (***p < 0.001, unpaired t-test).
-
Figure 4—source data 1
Intracellular calcium data (expressed as relative fluorescence) for Figure 4.
- https://cdn.elifesciences.org/articles/73777/elife-73777-fig4-data1-v1.xlsx
Figure 4—figure supplement 1
FFA2 is expressed and functional (intracellular calcium response) in nodose ganglia of mice.
(A) Sections of nodose ganglia from hFFA2-DREADD-HA mice were immunostained with anti-PGP9.5 to identify neurons (left-hand panels, green) and with anti-HA to detect the receptor (middle panels, red). Merging of such images (right-hand panels) showed modest coexpression, but with additional anti-HA staining interspersed between neurons in the hFFA2-DREADD-HA-expressing sections. Stars (*) illustrate cells that were positive for PGP9.5 but lacked anti-HA. Inserts: individual cells are illustrated in the boxes to highlight examples of cells expressing PGP9.5 but not HA, cells expressing HA reactivity but not PGP9.5, and cells coexpressing PGP9.5 and hFFA2-DREADD-HA. These are green, red, and yellow, respectively, in the right-hand insert. Scale bar = 20 µm. (B, C) Single-cell calcium imaging studies of dissociation cells from nodose ganglia from either hFFA2-DREADD-HA (B) or wild-type C57BL/6 (C) exposed to C3, 4-methoxy-3-methyl-benzoic acid (MOMBA), or MOMBA + CATPB as indicated. Both C3- and MOMBA-promoted elevation of intracellular [Ca2+] in a substantial proportion of cells from hFFA2-DREADD-HA-expressing mice and the effect of MOMBA was prevented by the presence of CATPB (**p < 0.01, ***p < 0.001). In cells from wild-type animals C3 (****p < 0.001) but not MOMBA was effective. Data represent the mean % of cells prepared from tissue of individual mice that responded to ligand treatments (one-way analysis of variance followed by Bonferroni’s Multiple Comparison Test). (D) Individual cells were exposed sequentially to MOMBA (100 µM) and then C3 (1 mM) with washout of MOMBA prior to treatment with C3. A representative example is shown.
-
Figure 4—figure supplement 1—source data 1
Calcium imaging values for Figure 4—figure supplement 1.
- https://cdn.elifesciences.org/articles/73777/elife-73777-fig4-figsupp1-data1-v1.xlsx
Figure 5 with 1 supplement
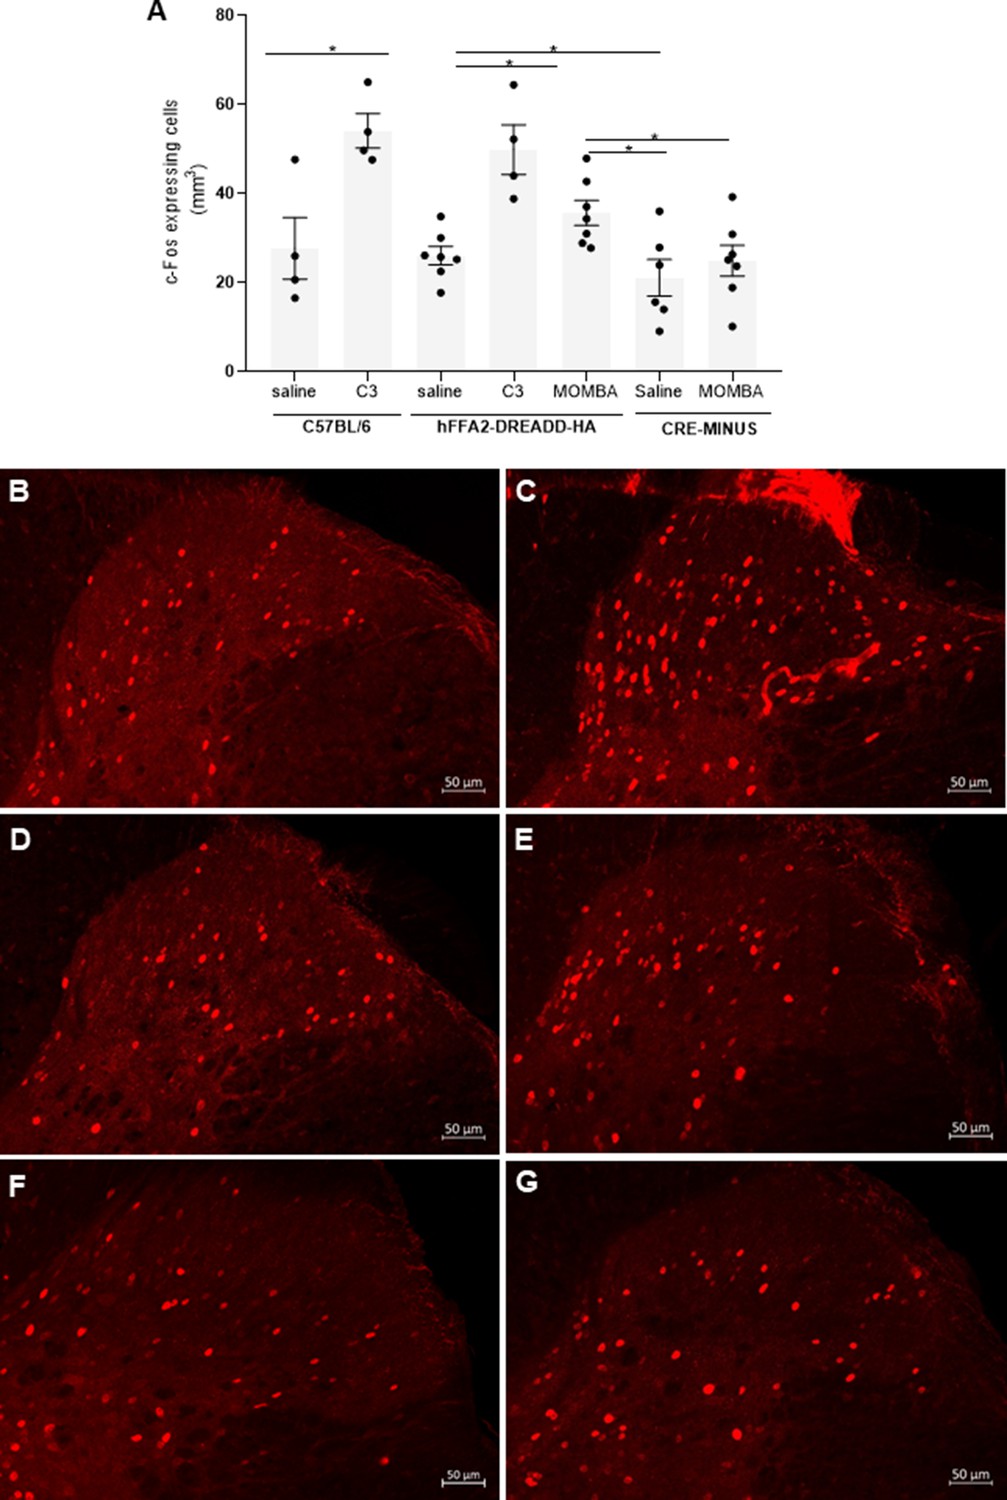
Gut short-chain fatty acid receptors promote activation of neurons in the dorsal horn of the spinal cord: roles for both FFA2 and FFA3 (A).
2 hr after introduction of saline, C3 or 4-methoxy-3-methyl-benzoic acid (MOMBA) into the colon of wild-type C57BL/6, hFFA2-DREADD-HA, or CRE-MINUS mice the number of c-Fos-expressing cells in the dorsal horn of the spinal cord was quantified. Data points represent individual animals. C3 increased c-Fos-expressing cells in wild-type (*p < 0.05) and hFFA2-DREADD-HA-expressing mice, MOMBA also did so in hFFA2-DREADD-HA expressing (*p < 0.05) but not CRE-MINUS mice (unpaired t-test). Representative images of dorsal horn from C57BL/6 plus saline (B), or plus C3 (C); hFFA2-DREADD-HA plus saline (D), or plus MOMBA (E); CRE-MINUS plus saline (F), or plus MOMBA (G) treatments are shown for illustration. Scale bar = 50 µm.
-
Figure 5—source data 1
c-Fos-expressing cells per mm3 for Figure 5.
- https://cdn.elifesciences.org/articles/73777/elife-73777-fig5-data1-v1.xlsx
Figure 5—figure supplement 1
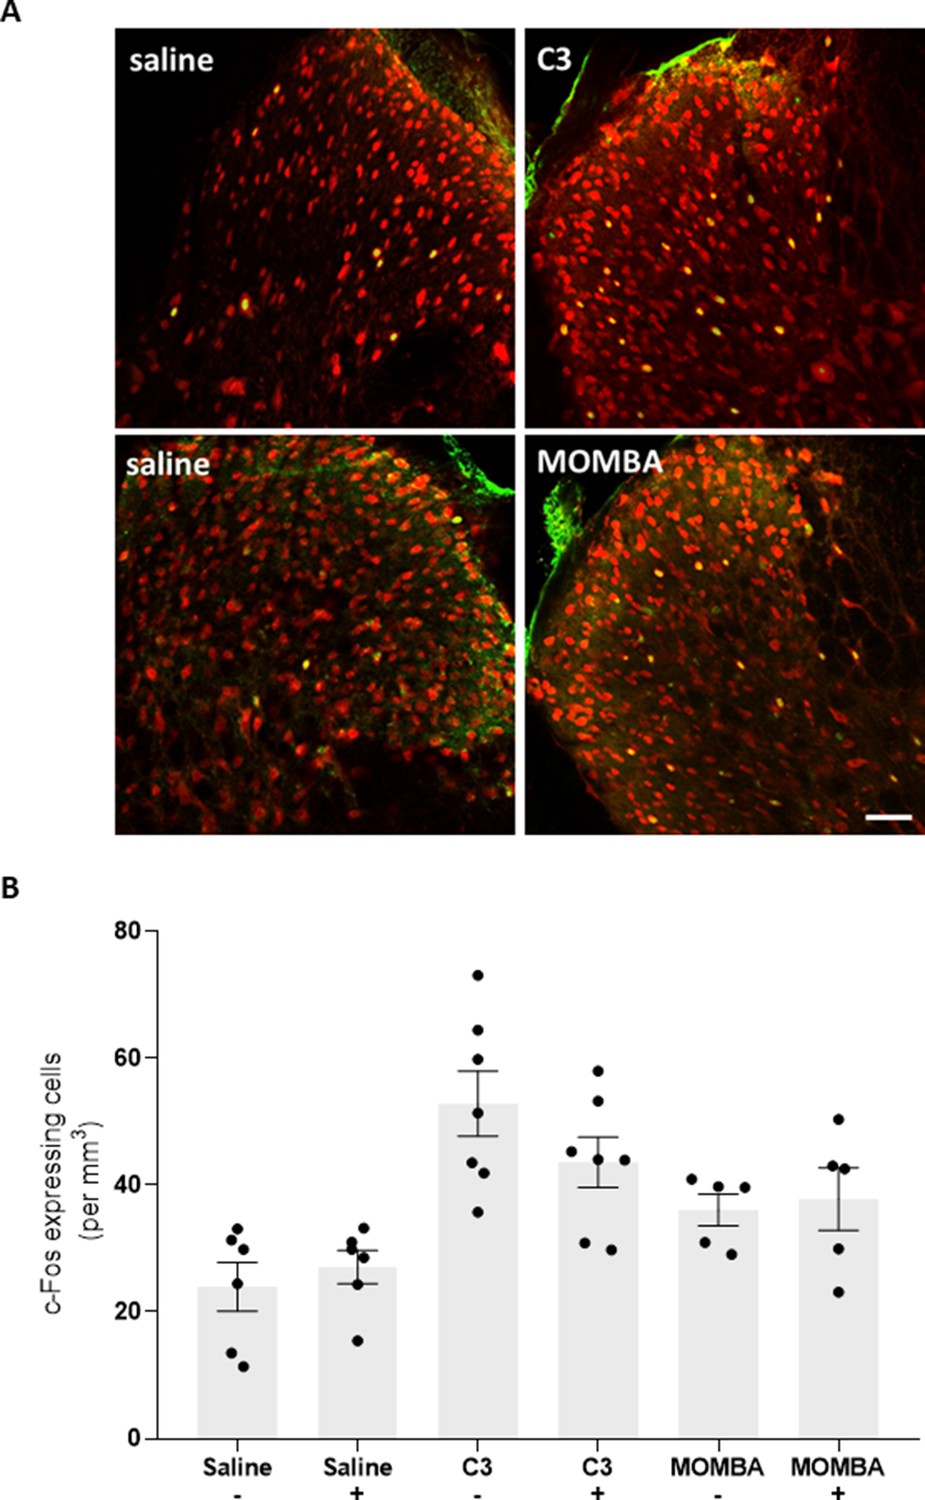
Spinal c-Fos expression induced by activation of short-chain fatty acid (SCFA) receptors.
(A) Representative images of dorsal horn from C57BL/6 (A: top panels) and hFFA2-DREADD-HA (A: bottom panels) show coexpression of c-Fos (green) and NeuN (red). Scale bar = 50 µm. (B) Preadministration of granisetron (1 mM) did not block spinal c-Fos expression in response to C3 or 4-methoxy-3-methyl-benzoic acid (MOMBA) in anesthetized hFFA2-DREADD-HA mice. Data points represent individual animals (p > 0.05) (unpaired t-test).
Additional files
-
Supplementary file 1
4-Methoxy-3-methyl-benzoic acid (MOMBA) promotes Ca2+ elevation in subsets of dorsal root ganglia (DRG)-derived cells in a FFA2 and Gq/G11-dependent manner.
n cells isolated from DRGs from N hFFA2-DREADD-HA-expressing mice were assessed for capacity to elevate intracellular [Ca2+] in response to MOMBA or MOMBA following the indicated treatments. See also Figure 4B.
- https://cdn.elifesciences.org/articles/73777/elife-73777-supp1-v1.docx
-
Supplementary file 2
C3 promotes Ca2+ elevation in subsets of DRG-derived cells in a non-FFA2 and Gi-dependent manner.
n cells isolated from dorsal root ganglia (DRGs) from N hFFA2-DREADD-HA-expressing mice were assessed for capacity to elevate intracellular [Ca2+] in response to C3 or C3 following the indicated treatments. See Figure 4C for details.
- https://cdn.elifesciences.org/articles/73777/elife-73777-supp2-v1.docx
-
Supplementary file 3
Activation of gut short-chain fatty acid (SCFA) receptors promotes c-Fos expression in the dorsal horn of the spinal cord.
- https://cdn.elifesciences.org/articles/73777/elife-73777-supp3-v1.docx
-
Transparent reporting form
- https://cdn.elifesciences.org/articles/73777/elife-73777-transrepform1-v1.docx
Download links
A two-part list of links to download the article, or parts of the article, in various formats.
Downloads (link to download the article as PDF)
Open citations (links to open the citations from this article in various online reference manager services)
Cite this article (links to download the citations from this article in formats compatible with various reference manager tools)
Chemogenetics defines a short-chain fatty acid receptor gut–brain axis
eLife 11:e73777.
https://doi.org/10.7554/eLife.73777


